
Abstract
Administrative problems such as computer malfunction and power outage occasionally lead to missing item scores and hence to incomplete data on mastery tests such as the AP and U.S. Medical Licensing examinations. Investigators are often interested in estimating the probabilities of passing of the examinees with incomplete data on mastery tests. However, there is a lack of research on this estimation problem. The goal of this article is to suggest two new approaches—one each based on classical test theory and item response theory—for estimating the probabilities of passing of the examinees with incomplete data on mastery tests. The two approaches are demonstrated to have high accuracy and negligible misclassification rates.
Introduction
Measurement professionals are familiar with the phenomenon of missing item scores, or, incomplete tests, on educational assessments. A wide variety of problems related to missing item scores in educational or psychological measurement were tackled by researchers such as De Ayala et al. (2001), Finch (2008), Feinberg (2020), Sinharay (2021), Smits et al. (2002), and Xiao and Bulut (2020).
This article focuses on tests such as the AP (e.g., Patterson & Ewing, 2013), Praxis (Educational Testing Service, 2020), and U.S. Medical Licensing Examination or USMLE (2020) that are used to decide whether the test-takers have attained a specific level of knowledge or mastery of a given subject and to report pass–fail statuses instead of or in addition to scaled scores. For convenience, tests that report pass–fail statuses will henceforth be referred to as mastery tests. These tests primarily include licensure and certification tests. Occasionally, administrative problems such as computer malfunction, natural calamities, noise or disruption in the testing area (e.g., American Educational Research Association, American Psychological Association, & National Council for Measurement in Education, 2014), and power outage lead to missing item scores in mastery testing (e.g., Feinberg, 2020; USMLE, 2020). Missing item scores for an examinee lead to an incomplete test for the examinee.
While several options such as retests are available to the test administrators for handling incomplete mastery tests, one option is to report estimated pass–fail statuses to the examinees with incomplete tests after estimating their probabilities of passing. There is a lack of research on this topic with the exception of Feinberg (2020), who suggested four approaches that can be used to estimate the passing probabilities of examinees based on their performance on the part of the test that they were able to complete. However, Feinberg (2020) considered the case where the test includes only dichotomous items and all the missing item scores are located at the end of the test. Further, the misclassification rates of the best performing approaches of Feinberg (2020) were often large, especially for the examinees whose actual scores were close to the passing score, and only one data set was analyzed by Feinberg (2020).
The objective of this article is to extend the research of Feinberg (2020) on estimating passing probabilities on incomplete mastery tests in several ways. First, this article considers mastery tests that include both dichotomous and polytomous items—these tests are often referred to as mixed-format tests (e.g., Kolen & Lee, 2011)—AP (e.g., Patterson & Ewing, 2013) tests are examples of such tests. Second, this article considers the case when the missing item scores do not necessarily occur at the end of the test; for example, for a test such as the Praxis®Spanish World Language test (ets.org/s/praxis/pdf/5195.pdf) that includes speaking items, poor audio quality, or excessive background noise during recording may render some responses to the speaking items, which do not necessarily appear at the end of the test, unscorable, leading to missing scores on these items. Third, while the three approaches based on item response theory (IRT) of Feinberg (2020) were based on the Rasch model, this article considers more general IRT models including the three-parameter logistic model (3PLM; Birnbaum, 1968) and the generalized partial credit model (GPCM; Muraki, 1992). Fourth, Feinberg (2020) reported results from only one data set—this article reports results from several simulated data sets and one real data set. Finally, two new approaches—one based on classical test theory (CTT) and one on IRT—for estimation of the passing probability on incomplete mastery tests are suggested in an attempt to overcome the problem of large misclassification rates that some approaches of Feinberg (2020) suffered from; two comparison studies—one based on simulated data and one based on real data—are employed to demonstrate the superior performance of the two new approaches compared with the approaches of Feinberg (2020).
The next section includes a review of the literature on the analysis of missing data for educational and psychological tests and of the four approaches of Feinberg (2020). The “Method: . . .” section includes a description of two new approaches for estimating the passing probabilities for the examinees with incomplete data on mastery tests. The “Data Analysis” section includes a comparison of the two new approaches and three approaches of Feinberg (2020) using simulated and real data. The last section includes discussions and conclusions.
Omitted and not-reached responses, which also lead to missing item scores, are quite common in educational assessments. But these responses occur due to various types of examinee behavior and not due to administrative problems—so they are not considered in this article. Instead, the assumption is made that the omitted and not-reached responses are treated using the operational approaches of the tests concerned. Researchers such as De Ayala et al. (2001) and Glas and Pimentel (2008) explored various approaches for handling omitted and not-reached responses.
Analysis of Missing Data in Educational Measurement
Researchers such as Enders (2010), Graham (2009, 2012), Schafer (1997), Schafer and Graham (2002), Sinharay et al. (2001), and Vriens and Sinharay (2006) provided extensive reviews of the literature on missing data analysis in general. While Holman and Glas (2005), Glas and Pimentel (2008), Sulis and Porcu (2017), and Rose et al. (2017) suggested various advanced IRT models for modeling missing data in educational and psychological measurement, measurement researchers and practitioners considered several additional problems related to missing data. Some of the research is summarized below, categorized by the problem of interest.
Various Types of Missing Data Analysis in Educational Measurement
Estimation of Model Parameters or Summary Statistics
Finch (2008) and Sulis and Porcu (2017) compared several missing-data imputation approaches with respect to their accuracy in estimating parameters of dichotomous and polytomous IRT models, respectively, in the presence of missing item scores. Sijtsma and van der Ark (2003) compared several missing-data imputation approaches with respect to their accuracy in the presence of missing data in estimating the coefficient
Imputation of Raw/Scaled Score and Grade Point Average
Huisman and Molenaar (2001) compared several missing-data imputation approaches for imputation of the total/raw score in psychology tests in the presence of missing item scores. Sinharay (2021) compared several missing-data imputation approaches for imputation of scaled scores in the presence of missing item scores in educational tests. Smits et al. (2002) compared several missing-data imputation approaches with respect to their accuracy in imputation of grade point averages in the presence of missing grades on several courses.
Ability Estimation in the Presence of Missing Data
Xiao and Bulut (2020) compared several missing-data imputation approaches with respect to their accuracy in estimating the ability parameters of dichotomous IRT models in the presence of missing item scores. Cetin-Berber et al. (2019) compared several missing-data imputation approaches with respect to their accuracy in estimating the examinee ability in computerized adaptive multistage testing in the presence of missing item scores.
Various Treatments of Omitted Responses and Their Impact
Shin (2009) examined how omitted responses should be handled in IRT equating. Kohler et al. (2017) investigated how different treatments of item nonresponse affect relevant outcome measures such as estimates of coefficients of a linear regression of examinee ability on explanatory variables such as gender and socioeconomic status, on educational assessments. De Ayala et al. (2001) examined how omitted responses affect common IRT ability parameter estimates such as the maximum likelihood estimate and the posterior mean of ability for dichotomous IRT models. They also examined whether the omitted responses should be treated as incorrect responses. Pohl et al. (2014) attempted to find the best approaches for item and person parameter estimation in the presence of omitted responses on competency tests.
Estimation of the Passing Probability on an Incomplete Mastery Test
Feinberg (2020) suggested four approaches for estimating the probability of passing of an examinee on an incomplete mastery test. More details of the four approaches are provided shortly.
Brief Summary of Missing Data Analysis in Educational Measurement
The above discussion indicates that (a) missing data could lead to various types of problems for educational tests, (b) researchers have suggested various approaches for tacking these problems, and (c) there is a lack of research on estimating the passing probability of an examinee on an incomplete mastery test, with the exception of Feinberg (2020).
The Four Approaches of Feinberg (2020)
Feinberg (2020) considered the case where, due to administrative problems, the scores on items
• Model-based standard error (MSE) approach: This approach involves the assumption that the posterior distribution of the examinee ability
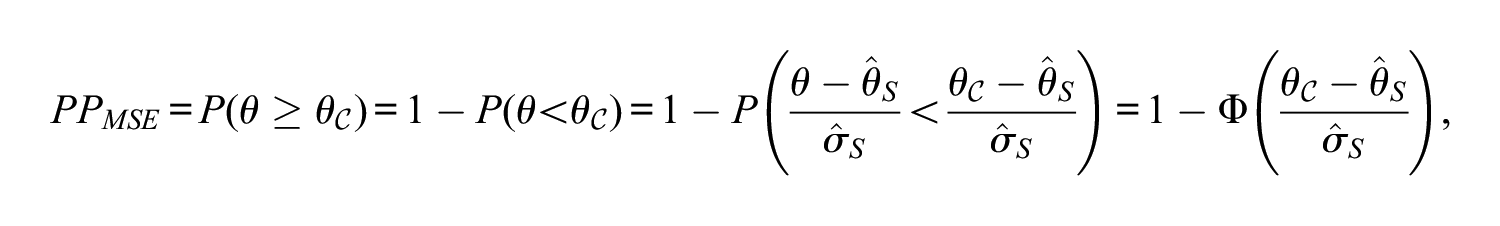
where
• Bayesian approach: This approach employs a reference data set collected from past administrations of the test and involves the estimation of the probability of passing as
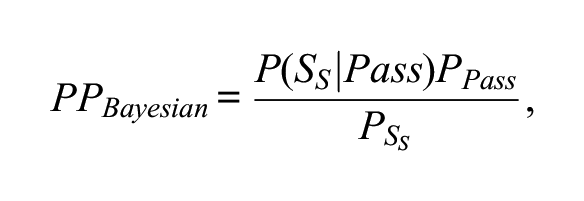
where
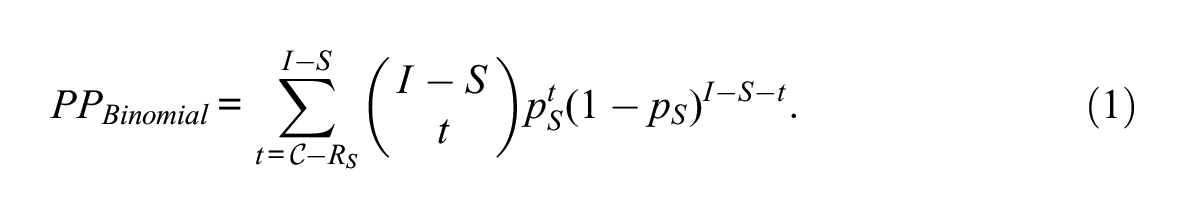
• Binomial distribution (BD) approach: This approach involves (a) the assumption that the raw score of the examinee on items
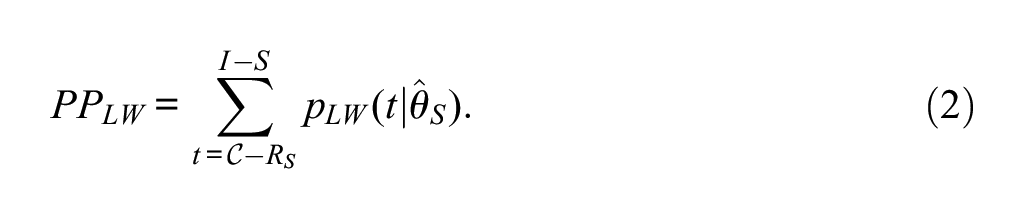
• Lord–Wingersky (LW) or Recursion approach: This approach involves the computation of
Three of the aforementioned four approaches are based on an IRT model—Feinberg (2020) used the Rasch model because the model is used for the USMLE whose data were analyzed by him. After estimating the passing probability for an examinee with an incomplete test, one assigns a “pass” or “fail” status to the examinee if the estimated probability is larger than or smaller than cutoffs of
Feinberg (2020) used a data set from the USMLE in 2015 to compare the accuracy, indeterminate, and misclassification rates of the four approaches that he suggested. The comparisons of Feinberg (2020) revealed that
• The MSE approach performed the worst among his four approaches; the power of the approach was too low on average.
• The Bayesian approach may be difficult to implement in practice due to the problem of finding appropriate prior information that is required by the approach and was less powerful than the LW and BD approaches.
• Among the LW and BD approaches, the BD approach performed as well as the LW approach in several cases, but somewhat worse in a case when the items were ordered by difficulty (see his Figure 5).
Therefore, Feinberg (2020) concluded that the LW approach is the most robust option for estimating passing probabilities on incomplete mastery tests. However, Feinberg (2020) pointed to the large misclassification rates of the LW approach (and those of two other approaches that he considered), especially for borderline pass–fail examinees and for a large number of missing item scores. For example, in his Figure 3, the misclassification rate of the LW approach was about 10% for the borderline pass–fail examinees who answered only the first 100 items on a 252-item test. While Feinberg (2020) commented that a high-stakes testing program would likely want to create a policy that results in close to, if not exactly, an expected 0% misclassification rate, the misclassification rate of his LW approach was often considerably larger than 0%—so the ideal imputation approach remained elusive in his study. 1 In addition, Feinberg (2020) analyzed only one data set and considered the case where the test includes only dichotomous items and all the missing item scores occur at the end of the test. Finally, his IRT-based approaches were based on the Rasch model. So, there is a considerable scope of further extensions of the research of Feinberg (2020) on estimating passing probabilities on incomplete mastery tests—this article reports results from such extensions.
Methods: Two New Approaches for Estimating Passing Probabilities on Incomplete Mastery Tests
In this section, two new approaches—one based on CTT and another based on IRT—are suggested for estimating probabilities of passing on incomplete mastery tests—the approaches apply to mixed-format tests and can handle missing item scores that are not necessarily at the end of the test.
Some Notation
Let us consider a mixed-format test that includes several dichotomously scored items and several polytomously scored items with potentially different numbers of score categories. An example of such a test is the 71-item AP Spanish test in 2011, which was considered by Y. Kang and Lee (2011)—the test included 65 multiple-choice (MC) and dichotomously scored items, three polytomous items with maximum scores of 5 each, and three more polytomous items with maximum scores of 9 each. Let us denote the sets of items on which scores are available and missing for an examinee as
A New Approach Based on IRT
The LW approach of Feinberg (2020) was modified in multiple ways to estimate the passing probability on incomplete and mixed-format mastery tests. First, while the LW approach of Feinberg (2020) utilizes the LW algorithm (Lord & Wingersky, 1984) that can be used to compute the probability
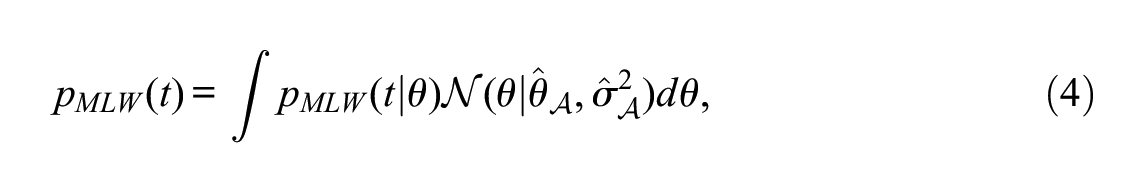
where
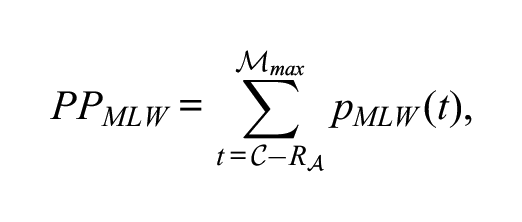
where
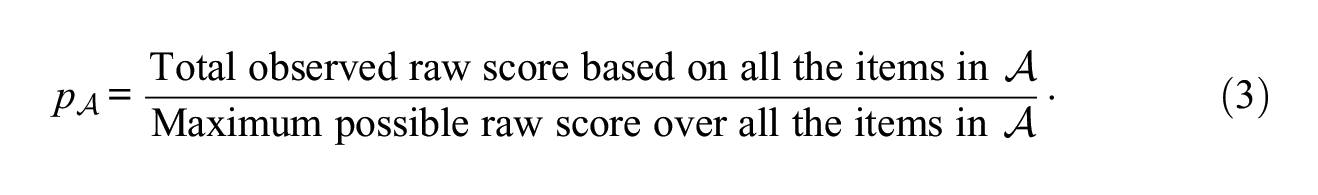
A New Approach Based on CTT
The approach of Hanson (1994) and Thissen et al. (1995) is an IRT-based way to compute
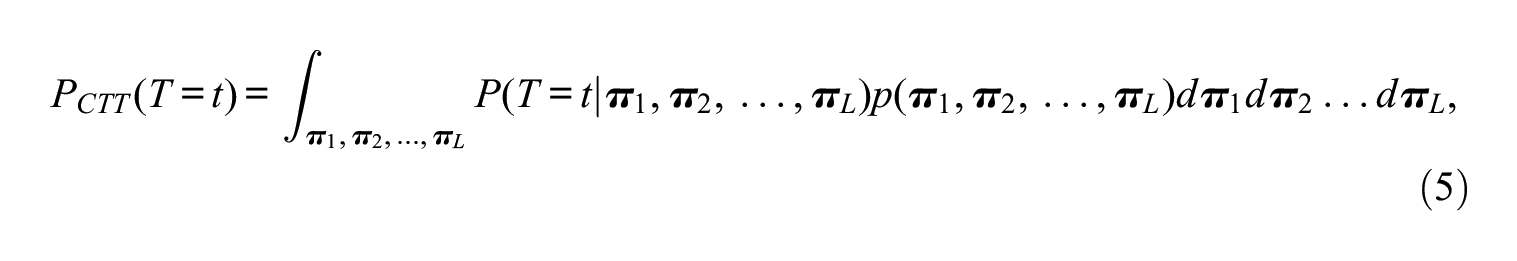
for an appropriate choice of
where
Data Analysis
The performances of the two new approaches were compared with that of three approaches of Feinberg (2020) in two comparison studies: one using data simulated to look like the data set of Feinberg (2020) and another using a real data set from a mixed-format mastery test.
Comparison Using Simulated Data
While Feinberg (2020) used a data set from the 2015 USMLE in his comparisons, data simulated so as to be similar to those were used in this article to compare the approaches for estimating passing probabilities. Several data sets comprising scores of 42,413 examinees to 252 dichotomously scored items (the same numbers as in Feinberg, 2020) were simulated from the 3PLM. The true examinee abilities were simulated from a standard normal distribution. The passing rate on the USMLE was 85% in 2015 (USMLE, 2020). Therefore, the passing score on the examinee ability scale (
A total of 100 replications of the following steps were performed for
Figure 1 shows the percents of accurate classification (left column), indeterminate classification (middle column), and misclassification (right column) along the vertical axis for all approaches for various values of
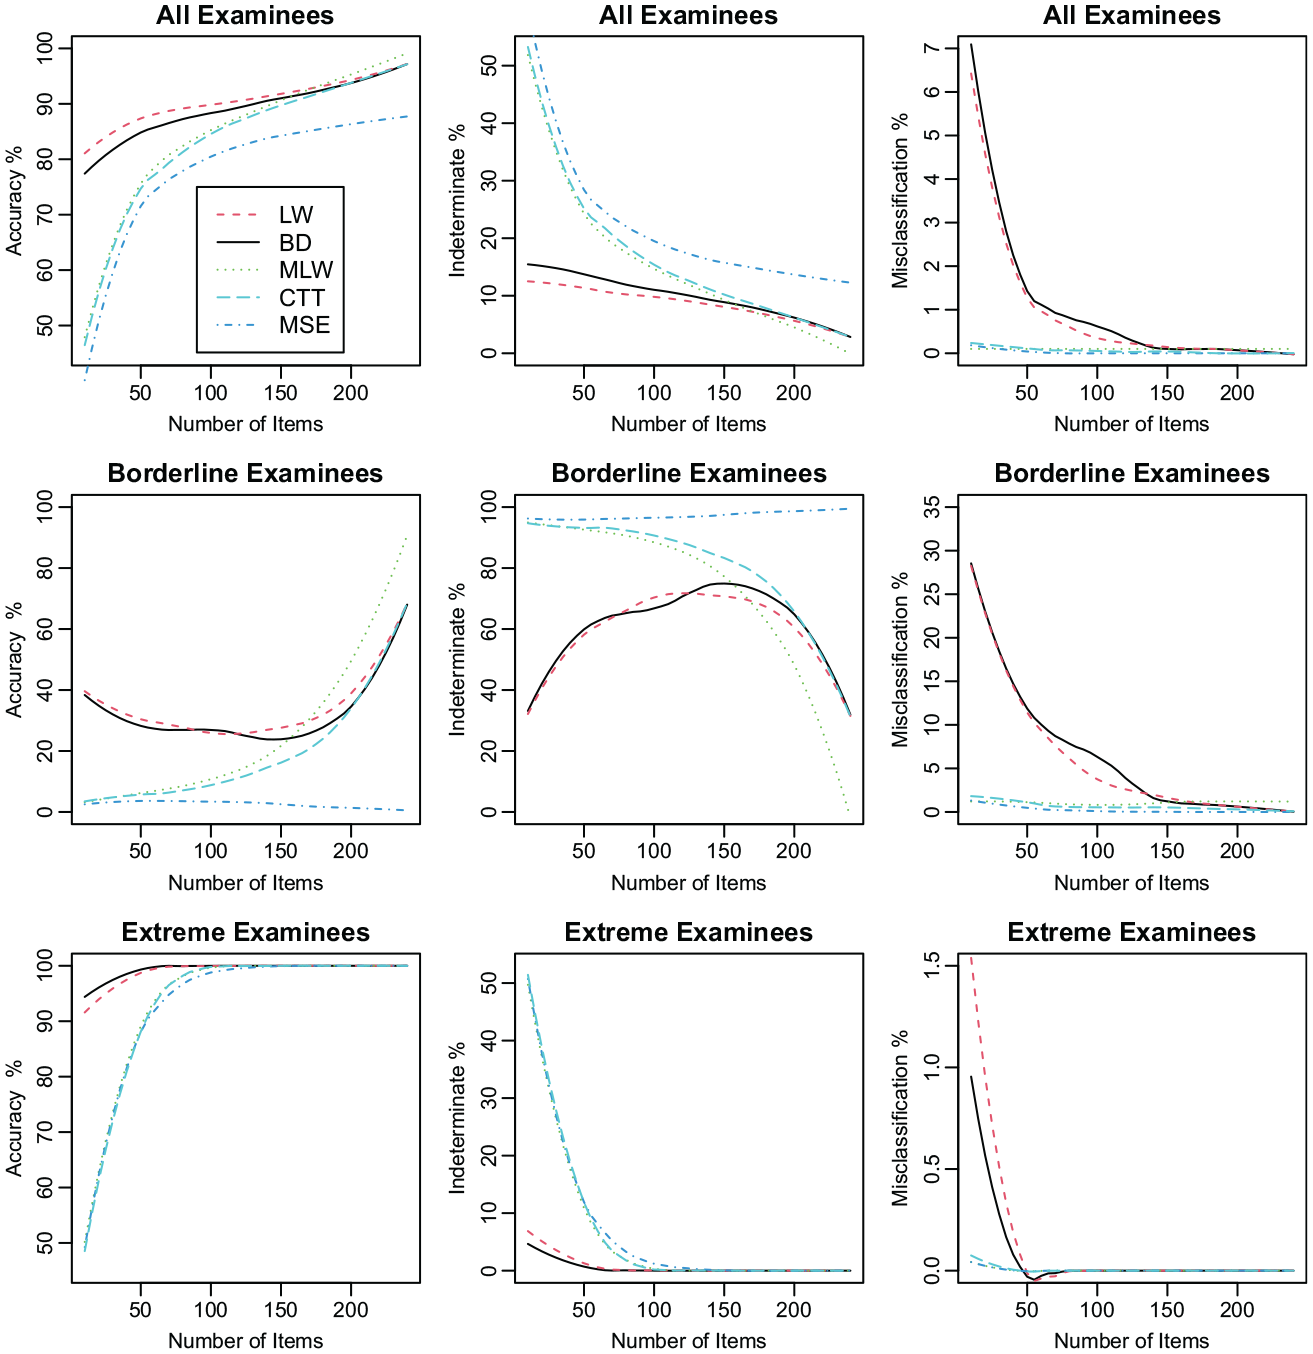
Comparison of the accuracy, indeterminate and misclassification percentages of the five approaches for estimating probabilities of passing for simulated data.
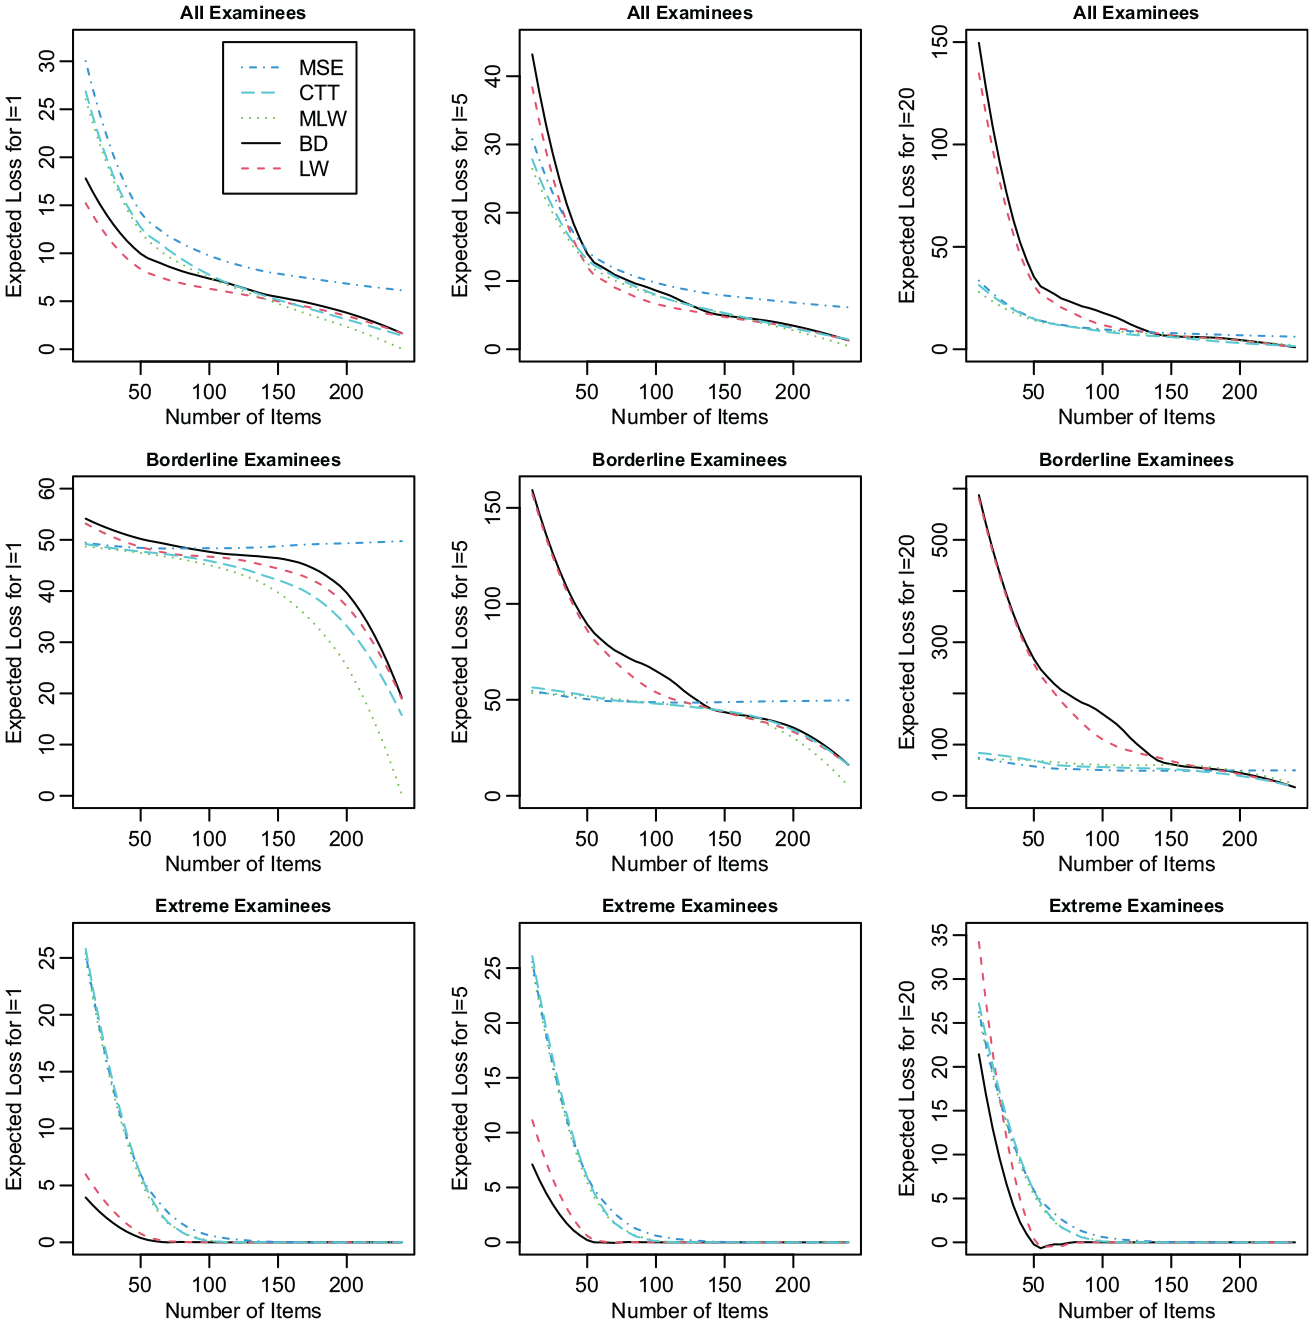
Comparison of the expected losses of the five approaches for three values of
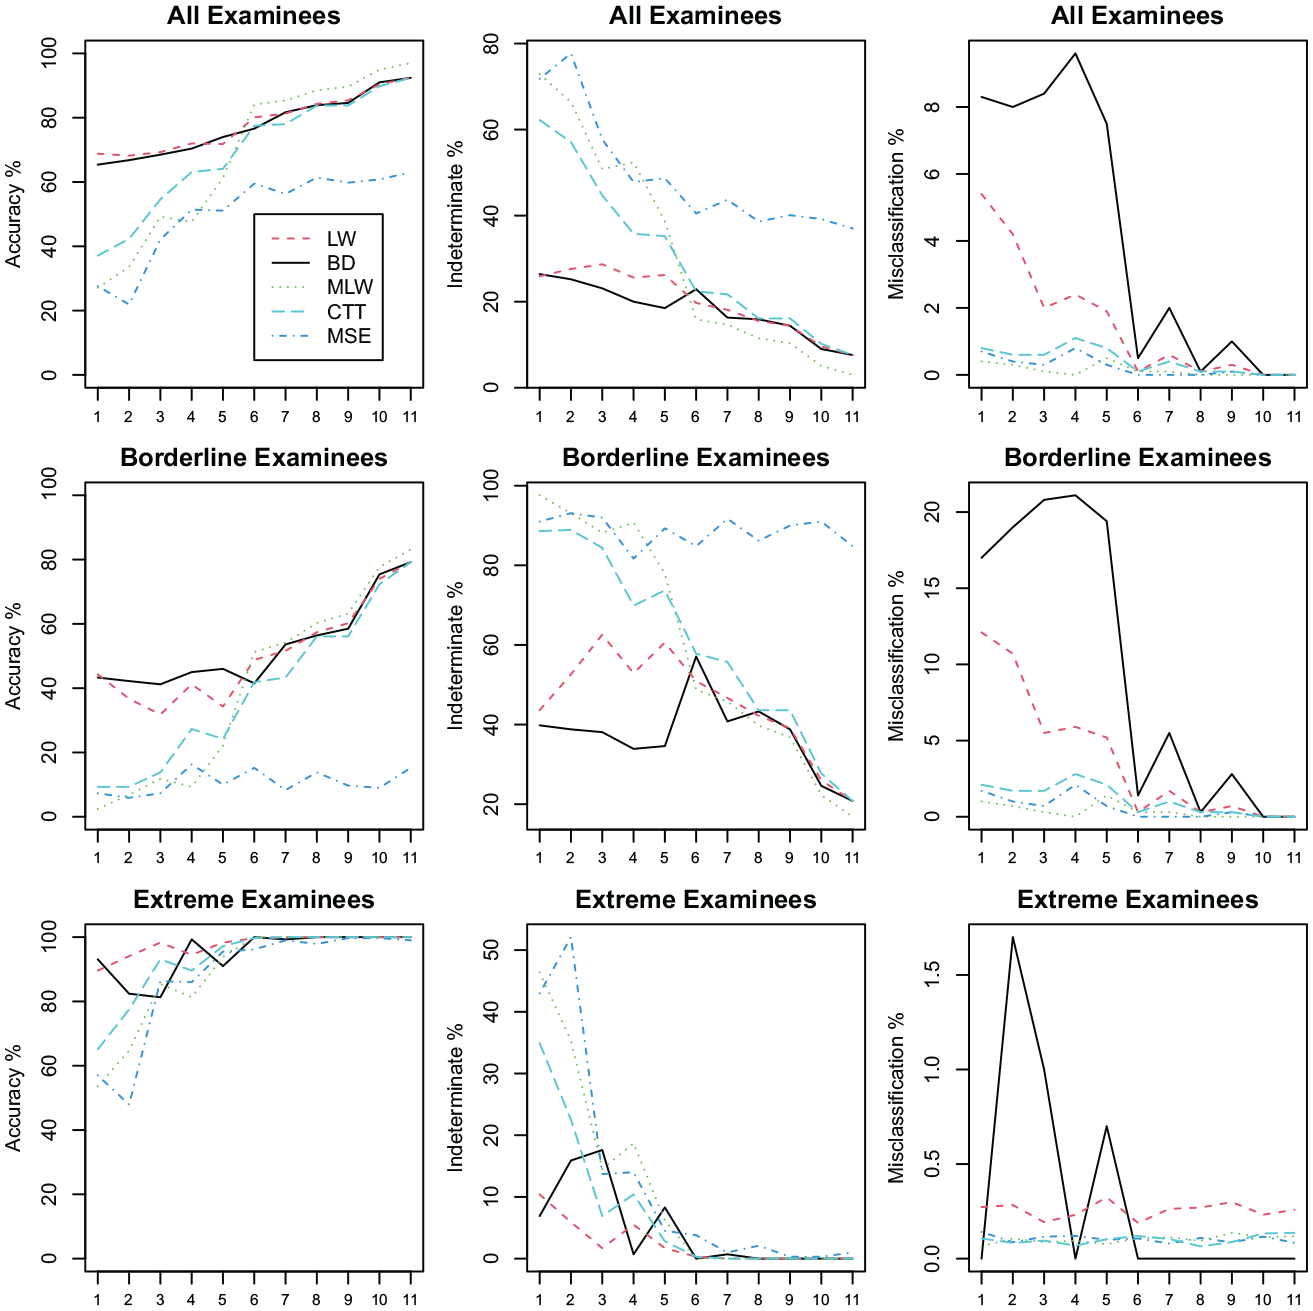
Comparison of the accuracy, indeterminate, and misclassification percentages of the five approaches for estimating probabilities of passing for the real data set.

Comparison of the expected losses of the five approaches for three values of
The findings from Figure 1 regarding the three approaches of Feinberg (2020) are mostly in agreement with those from Figures 2 to 4 of Feinberg (2020). For example, (a) the curves for any group of examinees for any approach in Figure 1 look very much like the corresponding curves in Feinberg (2020), which indicates that the comparison of Feinberg (2020) was successfully replicated in this article in spite of the use of simulated (instead of real) data; (b) as in Figures 2 to 4 of Feinberg (2020), Figure 1 shows that the accuracy and misclassification rates are the largest for the BD and LW approaches and smallest for the MSE approach, the accuracy rates of all the approaches are the largest for the extreme examinees and smallest for the borderline examinees, and the misclassification rates of all the approaches are the smallest for the extreme examinees and largest for the borderline examinees.
Regarding the comparative performance of the two new approaches (the MLW and CTT approaches) and the approaches of Feinberg (2020), Figure 1 indicates that the misclassification rates of both new approaches are very close to zero (like that of the MSE approach) for all values of
While Figure 1 provides detailed information about the performance of the approaches, a single index combining the information from the accuracy, indeterminate, and misclassification rates may make it easier for practitioners to compare the approaches. Therefore, a measure, referred to as the expected loss, was defined as
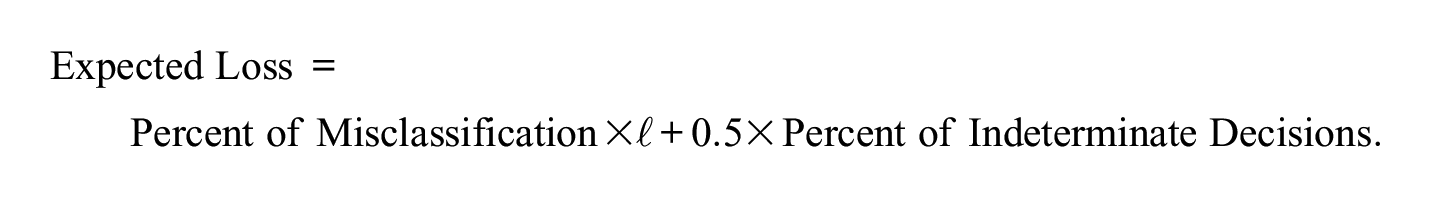
The measure is motivated by the idea of loss functions in decision theory (e.g., Ferguson, 1967) and reflects the idea that the losses resulting from an accurate decision, indeterminate decision, and misclassification, respectively, are 0, 0.5, and
Figure 2 shows the values of the expected loss for
While Figures 1 and 2 provide a comparison of the approaches at an overall level, Table 1 is intended to provide a deeper look at how the LW and MLW approaches function and differ for individual examinees. The table shows, for six simulated examinees, the true ability (
Some Details Regarding Six Simulated Examinees.

Comparison Using Real Data
A data set comprising scores of about 6,000 examinees on one recent form of a high-stakes and mixed-format mastery test was used in a comparison of the approaches. The test is computerized, measures the knowledge, skills, and abilities of the examinees in a language, and comprises 64 MC and dichotomously scored items and eight polytomously scored items. Among the polytomous items, all of which are constructed-response (CR) items, four involve writing and four involve speaking. The scores on each polytomous item can only be one among 0, 1, 2, 3, and 4. Thus, the maximum possible raw score on the test is 96. No item scores were missing due to administrative problems for the available data set, which is a subset of the data set for an entire administration of the test. For the data set, the average raw score, reliability of the raw score, average percent correct score on the MC items, average percent correct score on the CR items, average interitem correlation among the MC items, and average interitem correlation among the CR items are 69, 0.91, 76, 61, 0.11, and .57, respectively. The raw score is equated to the raw score on a reference form and then converted to a pass–fail status using a passing score recommended by a standard-setting committee. The passing score on the raw score scale (
On rare occasions, computer problems lead to missing item scores for the mastery test. In addition, on rare occasions, the speaking items are unscorable due to background noise or poor audio quality. Thus, various patterns of missing item scores can be observed for the test. Consequently, 11 patterns of missing item scores, with various extent of missingness, were considered in the comparison study. Each of these patterns corresponds to two specific percents of missing MC and CR item scores. The patterns are shown in Table 2. For example, the first pattern corresponds to 100% missing MC item scores and 50% missing CR item scores; thus, the pattern represents a severe extent of missingness and all the approaches are expected to perform relatively poorly for this case. The reliability of the total score on the available items is shown in the last column of the table. 8 Roughly, as one goes down the table, the proportion of missingness decreases and the reliability increases, and the approaches are expected to perform more accurately in estimating the passing probabilities.
The 11 Patterns of Missing Item Scores Considered in the Comparison Using Real Data.

Note. MC = multiple-choice; CR = constructed-response.
A total of 100 replications of the following steps were performed for each pattern of missing item scores mentioned in Table 2: (a) randomly select 5% of the examinees in the data set and mark their scores as missing on the items determined by the missing score pattern. For example, when the percentages of missing CR and MC item scores are 100 and 50, respectively, then a random set of 50% MC items (that varies over the examinees) was drawn for each of the 5% examinees and scores on these randomly drawn items and all CR items were assumed missing for these 5% examinees. (b) fit the IRT model (that is a combination of the 3PLM and GPCM) and the CTT model of Lee (2007) and Lee et al. (2006) to the subset of the data comprising the 95% examinees with no missing scores, (c) Estimate the pass-fail statuses of the 5% examinees using the models fitted in the previous step and the five imputation approaches and compare them to their actual true pass-fail statuses. The BD approach of Feinberg (2020), which is meant to be used for dichotomous items, was applied with a slight modification in order to accommodate the polytomous items—the success probability
As in the simulations, the accuracy, indeterminate, and misclassification rates were computed for all examinees, borderline pass–fail examinees (whose raw score on the whole test was within half SD of the raw passing score, where the SD was computed for the full examinee sample), and extreme examinees (whose raw scores were below the 2.5th percentile or above 97.5th percentile of the distribution of the raw scores for the sample).
Figure 3 shows the percentages of accurate classification, indeterminate classification, and misclassification for all the 11 missing score patterns for all examinees (top row), for borderline pass–fail examinees (middle row), and extreme examinees (bottom row) for the five approaches.
The lines in Figure 3 are not as smooth as in Figure 1 because unlike in the latter figure, the number of items with missing scores do not constitute a continuum in the former figure. However, several patterns in Figure 3 are similar to those in Figure 1. For example, (a) as one goes from left to the right of any panel, the accuracy rates mostly increase and the indeterminate and misclassification rates mostly decrease for any approach; (b) for all the approaches, the accuracy rates are the largest for the extreme examinees and smallest for the borderline examinees, and the indeterminate and misclassification rates are the smallest for the extreme examinees and largest for the borderline examinees; (c) the accuracy rates are the largest for the BD and LW approaches for more missing items, but are the largest for all approaches except the MSE approach for fewer missing items; (d) the misclassification rates are the largest for the BD and LW approaches and are close to zero for the new approaches and the MSE approach for all cases. The misclassification rates of the BD approach are somewhat larger on average than that of the other approaches; this could be the outcome of the fact that the proportional score on the MC items is not a good predictor of that on the CR items and vice versa and the BD approach treats these quantities to be equivalent.
Figure 4, like Figure 2, shows the values of the expected loss for
Discussion on the Comparison of the Approaches
The results from the simulated and real data sets seem to favor the use of the two new approaches—the MLW and CTT approaches—for high-stakes mastery tests. Feinberg (2020) stated that a high-stakes testing program would likely want to create a policy that resulted in close to, if not exactly, an expected 0% misclassification rate at the cost of additional indeterminate classifications. The new approaches are exactly the types of approaches that Feinberg (2020) called for because of their small misclassification rates, modestly large indeterminate classification rates, and large power for a few missing item scores. For tests for which misclassifications do not have serious consequences, the BD or LW approach of Feinberg (2020), which are computationally simpler, may be preferred for the examinees who completed a small part of the test (if the test administrators decide to report scores for such examinees).
Conclusions
There is a lack of research on estimating the passing probability of examinees with incomplete data on mastery tests. This article presents two new approaches to estimate the aforementioned probabilities and demonstrates the benefit of the approaches compared with the existing approaches for high-stakes mastery tests—the misclassification rates for the new approaches are shown to be very close to zero in two comparison studies based on simulated and real data sets. The superior performance of the new approaches compared with the existing approaches is partially due to the fact that the new approaches take into account the uncertainty inherent in the estimates of the examinees’ true abilities by averaging out the uncertainty.
The data sets considered in this article were large. We repeated our analysis with smaller subsamples and found that the comparative performance of the approaches remain very similar to those reported in the article for sample sizes of about 1,000 or more. The items with missing scores are equally difficult on average with those with no missing scores in the simulated and real data examples earlier. Appendix D includes a simulation when the items with missing scores are more difficult on average than those with no missing scores. The MLW and LW approaches perform well in those simulations because these are based on IRT and take into account the item difficulties of the items with missing scores. However, the BD and CTT approaches perform poorly because they cannot take into account the item difficulties.
While there is no guarantee that the results found for the new approaches in this article will generalize to all data sets, the strong theoretical basis of the new approaches and the results from the simulated and real data sets presented above provide convincing evidence in favor of the approaches. A testing program that is considering an application of the new approaches to their test should evaluate the properties of the approaches for their data in the same manner as in the above comparison using real data. In addition, the testing programs applying the MLW approach should ensure that the IRT model fits the data adequately, the item parameter estimates are accurate, and the examinee population has not shifted.
The new approaches are more computation-intensive compared with those suggested by Feinberg (2020), but they did not require more than a couple of seconds for one replication for the real data set considered in this article. Considering the potentially serious consequences of misclassifications, the extra computation required in the new approaches is probably worth it, especially for high-stakes mastery tests.
The findings of this article are important especially given the several recent instances of technical difficulty during large-scale tests (e.g., Byrne, 2017; Sinharay et al., 2014; Sinharay et al., 2015) and the potential future technical difficulties due to poor internet access on at-home tests (e.g., Michel, 2020), especially because technical difficulties are a major cause of missing item scores.
The findings of this article have the practical implication that for tests (such as professional licensure tests) for which misclassifications have serious consequences, the new approaches are preferable for estimating the passing probability of examinees with incomplete data on mastery tests. However, for tests for which misclassifications do not have serious consequences, the BD or LW approaches of Feinberg (2020) may be preferred for the examinees who completed a small part of the test (if the test administrators decide to report scores for such examinees).
The new approaches were based on classical measurement techniques—one was based on IRT while the other was based on CTT. It is possible to use other approaches, especially those based on classical statistical methods, such as linear regression and logistic regression, in future research. In addition, further research could estimate passing probabilities using multiple imputation approaches, such as those suggested by Schafer (1997) and Raghunathan et al. (2001) and applied to measurement research by Edwards and Finch (2018) and Xiao and Bulut (2020). Another potential line of related research is the application of data mining methods such as random forests and gradient boosting machine (e.g., Hastie et al., 2009; Sinharay, 2016) to estimate passing probabilities.
The choice of
The research presented in this article can be extended in several additional ways. First, the comparison of approaches can be performed for more simulated and real data sets including data from different types of tests. Second, there is a lack of comparison of approaches for estimating probabilities of passing when the item scores are missing not at random (MNAR; e.g., Little & Rubin, 2002). Only missing at random (MAR) data were considered in this article, as well as in Feinberg (2020). However, recent research on other missing data problems for item-response data by, for example, Xiao and Bulut (2020) and Sinharay (2021), implies that the accuracy of the reported pass–fail statuses from the approaches considered in this article will be smaller (than those found in this article) for MNAR data, but probably not by much as long as the number of missing item scores is not too large. Also, the comparative performance of the approaches for MNAR data is expected to be similar to that for MAR data—limited simulations (whose results are not reported here and can be obtained from the author) supported this claim. Third, while this article focuses on tests that report pass and fail classifications, it is possible to extend the research to tests like AP that report multiple classifications. Finally, while this article focuses on estimating passing probabilities, it is possible to estimate the pass–fail classifications themselves in future research.
Footnotes
Appendix A
Appendix B
Appendix C
Appendix D
Author’s Note
Any opinions expressed in this publication are those of the author and not necessarily of Educational Testing Service.
Declaration of Conflicting Interests
The author declared no potential conflicts of interest with respect to the research, authorship, and/or publication of this article.
Funding
The author received no financial support for the research, authorship, and/or publication of this article.