
Abstract
Performance assessments heavily rely on human ratings. These ratings are typically subject to various forms of error and bias, threatening the assessment outcomes’ validity and fairness. Differential rater functioning (DRF) is a special kind of threat to fairness manifesting itself in unwanted interactions between raters and performance- or construct-irrelevant factors (e.g., examinee gender, rater experience, or time of rating). Most DRF studies have focused on whether raters show differential severity toward known groups of examinees. This study expands the DRF framework and investigates the more complex case of dual DRF effects, where DRF is simultaneously present in rater severity and centrality. Adopting a facets modeling approach, we propose the dual DRF model (DDRFM) for detecting and measuring these effects. In two simulation studies, we found that dual DRF effects (a) negatively affected measurement quality and (b) can reliably be detected and compensated under the DDRFM. Using sample data from a large-scale writing assessment (N = 1,323), we demonstrate the practical measurement consequences of the dual DRF effects. Findings have implications for researchers and practitioners assessing the psychometric quality of ratings.
Differential Rater Functioning
In performance assessments, it is common practice to use human raters for evaluating examinees’ responses to constructed-response tasks like essay writing, providing work samples, or solving problems. However, raters may exhibit various kinds of judgmental tendencies, errors, and biases, together called rater effects, threatening the ratings’ validity and fairness (Johnson et al., 2009; Myford & Wolfe, 2003; Saal et al., 1980). Therefore, researchers have developed a wide range of psychometric models and statistical indices to examine the extent to which raters are subject to these effects and to ensure sufficiently high rating quality (Engelhard & Wind, 2018; Wind & Peterson, 2018; Wolfe & Song, 2016).
A particularly intricate class of rater effects concerns differential rater functioning (DRF), commonly understood as systematic interactions between rater characteristics (e.g., response styles like severity or leniency and scoring experience) and performance- or construct-irrelevant characteristics of examinees (e.g., gender and age) or assessment conditions (e.g., time of rating and tasks or domains in an analytic scoring rubric). The net effect of such interactions is that examinee measures are not invariant over different levels of these characteristics (Eckes, 2015; Engelhard & Wind, 2018; Jin & Eckes, in press).
So far, most DRF studies have examined unwanted interactions focusing on rater severity, that is, differential severity/leniency (e.g., Hoskens & Wilson, 2001; Leckie & Baird, 2011; Lunz et al., 1996; Myford & Wolfe, 2004; Wind & Ge, 2021; Wind & Guo, 2019). Raters subject to differential severity/leniency tend to assign systematically lower/higher scores to particular subgroups of examinees after controlling for the examinees’ locations on the latent variable. For example, researchers have shown that raters exhibited significant differences in severity over time (Congdon & McQueen, 2000; Lamprianou et al., 2021), examinee gender groups (Wind & Sebok-Syer, 2019), and examinee proficiency level (Kondo-Brown, 2002). Severity levels may also systematically vary when allowing raters to share their views before rating performances (Wang et al., 2014).
In the rest of this paper, we will call DRF in severity/leniency “DRF-S” (for short). Note that DRF-S is analogous to uniform differential item functioning (DIF) in two-facet data, incorporating examinees and items (Gamerman et al., 2018; Osterlind & Everson, 2009; Penfield & Camilli, 2007).
Following the Rasch facets model (RFM; Linacre, 1989), DRF-S is usually assessed through the residual-based mean square error (MSE) statistics infit (weighted MSE) and outfit (unweighted MSE; Engelhard, 2008; Wind & Guo, 2019; Wind & Sebok-Syer, 2019). When a rater’s ratings exactly agree with RFM assumptions, this rater’s infit and outfit values are expected to be close to 1.0. Wind and Guo (2019) conducted a simulation study, showing that raters exhibiting DRF-S had infit and outfit values greater than 1.0 (e.g., infit MSE ranging from 1.16 to 1.50). However, rater infit and outfit statistics may be influenced by many factors other than differential severity (Eckes & Jin, 2021; Wind & Guo, 2019). Therefore, observing rater fit statistics greater than 1.0 does not provide conclusive evidence of DRF-S.
Recent research has increasingly focused on another rater effect having a similarly pervasive and negative influence on rating quality: central tendency or centrality (Jin & Wang, 2018; Uto & Ueno, 2020; Wolfe & Song, 2015, 2016; Wu, 2017). This effect refers to raters’ tendency to overuse the rating scale’s middle category or categories. In other words, raters subject to central tendency (“central” raters, for short) underestimate high performance levels and overestimate low performance levels. In contrast to rater severity, centrality effects cannot be directly measured using a traditional many-facet-Rasch measurement framework (Eckes, 2015; Eckes & Jin, 2021).
Unlike research on DRF-S, studies investigating DRF effects in terms of differential centrality (DRF-C) have been scarce (for an exception, see Myford & Wolfe, 2009). However, similar to DRF-S, DRF-C poses threats to an assessment’s validity and fairness. Therefore, both kinds of DRF effects, that is, DRF-S and DRF-C, should jointly be considered in rating quality studies.
As discussed later in somewhat more detail, DRF-C is conceptually similar to non-uniform DIF in two-facet data (i.e., examinees and items). That is, DRF-S and DRF-C may be effective in many-facet assessment settings much like uniform and non-uniform DIF in two-facet settings. We call the simultaneous presence of DRF-S and DRF-C in performance assessments “dual DRF effects.” At its core, the present study proposes a new psychometric model to measure dual DRF effects. We report simulations and empirical findings attesting to the model’s utility in detecting these effects.
Model Development
Rating data typically comprise at least three-facets: examinees, criteria (tasks and items), and raters. In assessment settings like this, an instance of the RFM widely used is:
where θ i is the proficiency of examinee i; δ j and τ jk are the mean difficulty and kth step difficulty of criterion j, respectively; and η l is the severity of rater l. Higher scores will be observed when θ i is high, δ j is low, and η l is low.
The distribution of step difficulties τ jk is related to the variance of observed scores (Jin & Wang, 2018). For example, let there be a four-category rating scale. Figure 1 shows the item characteristic curves for two different sets of step difficulties. The dispersed steps (upper panel) would lead to a much higher proportion of middle scores than the condensed steps (lower panel).
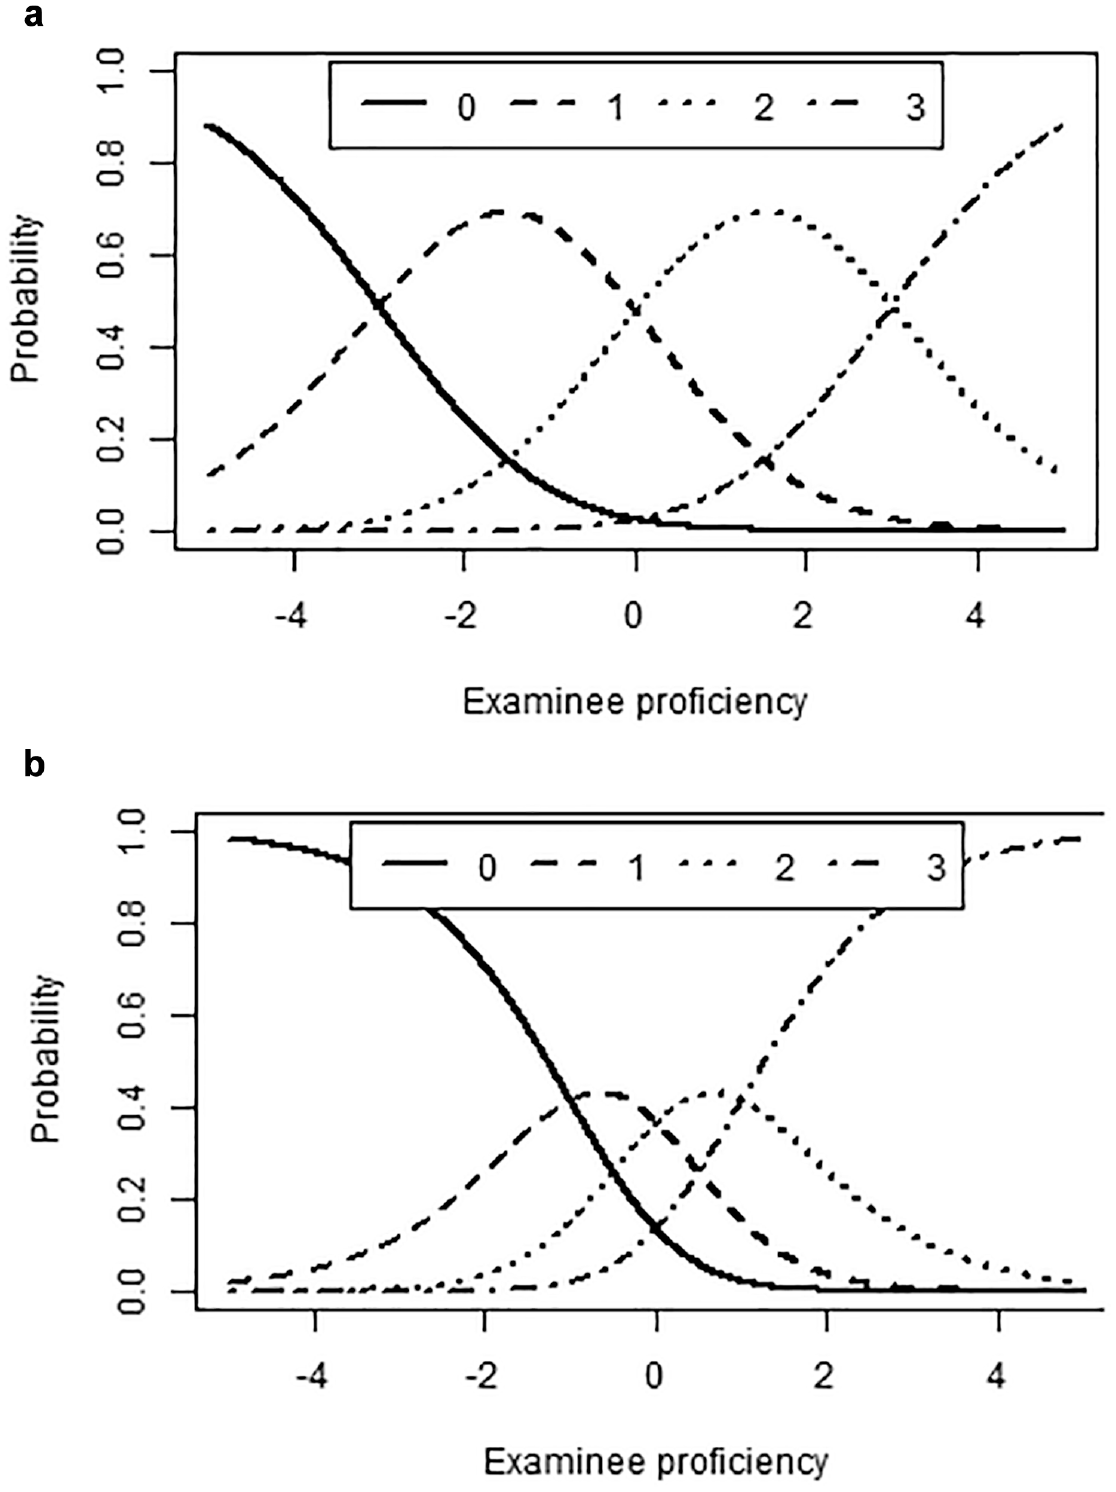
Two items with dispersed steps Panel (a) and condensed steps Panel (b).
Since raters may have different preferences for giving middle or extreme scores, it appears more appropriate to model a unique rating scale structure for each rater. Therefore, another version of the RFM to examine rater centrality looks like this (Myford & Wolfe, 2004; Wolfe & Song, 2015):

where υ lk is the kth step difficulty for rater l. Consequently, SD(υ lk ) represents the centrality level of rater l (e.g., Eckes & Jin, 2021). However, the estimate of υ lk is associated with measurement error; therefore, the precision of the SD(υ lk ) index is problematic. Also, SD(υ lk ) is not directly estimated in the model, making statistical testing infeasible.
Based on this reasoning, Jin and Wang (2018) proposed an extended model to quantify rater centrality:
where ω l is the centrality of rater l, indicating that raters are allowed to vary in the spread of individual step difficulties. In Equation (3), the parameter ω l assumes positive values (i.e., ω l > 0). Generally, ω j values greater than 1 indicate that raters tend to overuse the rating scale’s middle categories; ω j values less than 1 indicate that raters tend to overuse the extreme categories.
When ω
l
is re-parameterized as
Raters associated with higher ϖ parameter values tend to cluster scores around the rating scale’s middle category (or categories).
Equations (3) and (4) rest on the assumption that raters maintain a uniform level of severity and centrality over subgroups. However, some raters may be subject to DRF-S, DRF-C, or both, thus exhibiting DRF-S and DRF-C to varying degrees. Therefore, we extended Equation (4) to include DRF-S and DRF-C parameters for rater l:
where η lg and ϖ lg denote rater l’s severity and centrality, respectively, toward examinee group g.
Put differently, Δηl(=ηlF − ηlR) and Δϖl(=ϖlF − ϖlR) represent rater l’s DRF-S and DRF-C magnitudes regarding a reference group (R) and a focal group (F). Note that examinees’ group membership may be observed or latent (Jin & Wang, 2017). We refer to Equation (5) as the “dual DRF model” (DDRFM). When Δηl = 0 and Δϖl = 0 for all raters, suggesting raters exhibit no DRF, the DDRFM becomes Equation (4). Furthermore, when all raters are fair and exhibit the same severity and centrality level, the DDRFM reduces to the two-facet partial credit model (Masters, 1982).
Figure 2 illustrates dual DRF effects’ impact on expected scores. The area between two expected score curves for the reference and focal groups shows the direction and magnitude of DRF (Raju, 1988). Let there be a criterion with mean difficulty of 0 and three step difficulties of −1.5, 0.5, and 1, respectively. In the first example (Figure 2a), rater l exhibits DRF-S only (e.g., ηlR = 0, ηlF = 1 and ϖlR = 0, and ϖlF = 0); that is, this rater consistently gives lower scores to examinees in the focal group.

Influence of dual DRF effects on expected scores: (a) DRF-S, (b) DRF-C, and (c) DRF-S & DRF-C.
In the second example (Figure 2b), rater l exhibits DRF-C only (e.g., ηlR = 0, ηlF = 0, ϖlR = 0, and ϖlF = 1). Thus, focal group members with lower proficiencies would receive higher scores than reference group members at the same proficiency level; however, this pattern reverses when considering examinees at high proficiency levels.
Finally, Figure 2c displays what might happen when rater l exhibits DRF-S and DRF-C simultaneously (ηlR = 0, ηlF = 1, ϖlR = 0, and ϖlF = 1). The score differences between the focal and reference groups are more complex and difficult to interpret. Drawing the parallel between DRF and DIF effects again, the slopes and locations of the two expected score curves for the reference and focal groups would affect whether the biased rater can be successfully detected (Narayanon & Swaminathan, 1996).
In operational large-scale performance assessments, ratings are often missing by design; that is, the assessments use incomplete rating designs where not every rater scores every examinee’s performance. Typically, only two or three raters score each performance, yielding proportions of missing data around 90% or more (e.g., Eckes, 2005; Wind & Jones, 2019). Therefore, we included similar conditions in our DDRFM applications.
Model Parameter Estimation
We estimated DDRFM parameters through Bayesian methods using Markov chain Monte Carlo (MCMC) in JAGS (Plummer, 2017). In the simulation and empirical studies discussed later, the priors of the estimated parameters were specified as follows: θiR ∼ N(0,
where
An anchor has to be set in DRF detection studies for model identification. One may constraint
Across studies we ran a single MCMC chain to save computing time. 1 We discarded the first 5,000 iterations as burn-in, and kept the subsequent 5,000 iterations to form the posterior distributions. Based on the final 5,000 draws, we used the posterior distributions’ means as point estimates for the respective parameters. For a sample of the JAGS code, see the Supplemental Appendix.
We examined the convergence of MCMC draws within a chain by computing the Geweke z statistic (test of non-stationarity; Geweke, 1992; see also Jackman, 2009). The distributions of the first and second halves of samples for each estimate were compared. When converged, the two distributions are not significantly different, and the Geweke z statistic would follow an asymptotically standard normal distribution. In other words, when the Geweke z statistic exceeds ±1.96 (i.e., the 95% confidence interval), the convergence of MCMC is considered questionable. We expected the percentage of z statistics exceeding ±1.96 to be around 5% for a converged model.
The Bayesian chi-square statistic with posterior predictive model checking (Rubin, 1984) was used to evaluate the DDRFM’s absolute goodness-of-fit. The posterior predictive p-value (PPP-value) summarizes the discrepancy between the observed and replicated responses given the parameter estimates in each iteration. An extreme PPP-value (higher than .975 or lower than .025) indicates poor data-model fit (Levy & Mislevy, 2016).
Finally, to address the issue of relative model fit, that is, to compare the DDRFM to the RFM in terms of data-model fit, we computed the Bayesian deviance information criterion (DIC; Spiegelhalter et al., 2002) for each model. Models showing smaller DIC values are generally preferred as better fitting (Levy & Mislevy, 2016).
Simulation 1: Consequences of Ignoring Dual DRF
Design
Simulation 1 aimed to examine the consequences of ignoring dual DRF effects. We created rating data for 200 examinees, five criteria, and three raters; these conditions are quite common in applied assessment research (e.g., Kondo-Brown, 2002; Springer & Bradley, 2018). Data generation followed the same general settings as in Jin and Wang (2018). Ratings were provided using a five-category rating scale (ranging from 0 to 4).
Table 1 shows the rating design underlying this simulation. The total sample was divided equally into a reference group (R) and a focal group (F). Within each group, there were two equally sized subgroups. Within each subgroup, two raters assigned ratings to each examinee. We defined the first rater as unbiased (fair) and the second rater as biased (subject to severity or centrality).
Rating Design Used in Simulation Study 1.

Note. Rater U is an unbiased (fair) rater. Rater S is a biased rater exhibiting DRF-S. Rater C is a biased rater exhibiting DRF-C.
Specifically, for examinees belonging to Subgroups 1 and 2, the first rater, rater U (for short), was an unbiased rater, defined by ηUR = ηUF = 0 and ϖUR = ϖUF = 0. The second rater, rater S, was biased, defined by ηSR = 0, ηSF = 1 and ϖSR = ϖSF = 0; that is, rater S was simulated to be severe when rating focal group examinees but not when rating reference group examinees, thus exhibiting DRF-S.
For examinees belonging to Subgroups 3 and 4, the first rater was again unbiased and the second rater again biased. However, this time, the biased rater, rater C, was defined by ηCR = ηCF = 0 and ϖCR = 0, ϖCF = 1; that is, rater C was simulated to assign scores clustering around the rating scale’s middle category when rating focal group examinees but not when rating reference group examinees, thus exhibiting DRF-C.
For each subgroup, we generated 100 datasets from the DDRFM. Each dataset was fit by the RFM and the DDRFM. In these analyses, the parameters for rater U were fixed at their true values, whereas the parameters for raters S and C were freely estimated. In each replication, we computed the assessment’s reliability as the squared correlation coefficient between the true and estimated examinee proficiencies (θ values) under the RFM and DDRFM. We also computed the mean absolute rank change (MARC) to evaluate the empirical consequences of using these two-facet models:
where
Results
The Markov chains converged in all analyses. Unsurprisingly, the DIC uniformly favored the DDRFM (i.e., the data-generating model) across replications. Figure 3 displays the distributions of scores observed within each subgroup across 100 replications. The fair and biased raters assigned almost identical scores to reference group examinees (Subgroups 1 and 3; Figure 3a and c). However, for focal group examinees (Subgroups 2 and 4), the distributions of scores assigned by fair and biased raters were strikingly different. In Subgroup 2 (Figure 3b), biased rater S generally assigned lower scores (M = 2.12) to examinees in the focal group than fair rater U (M = 3.00). In Subgroup 4 (Figure 3d), biased rater C tended to assign much more scores around the middle categories (SD = 1.07) than fair rater U (SD = 1.41). In sum, the two different kinds of biased ratings each had a strong differential impact on individual examinees’ scores belonging to the focal group.
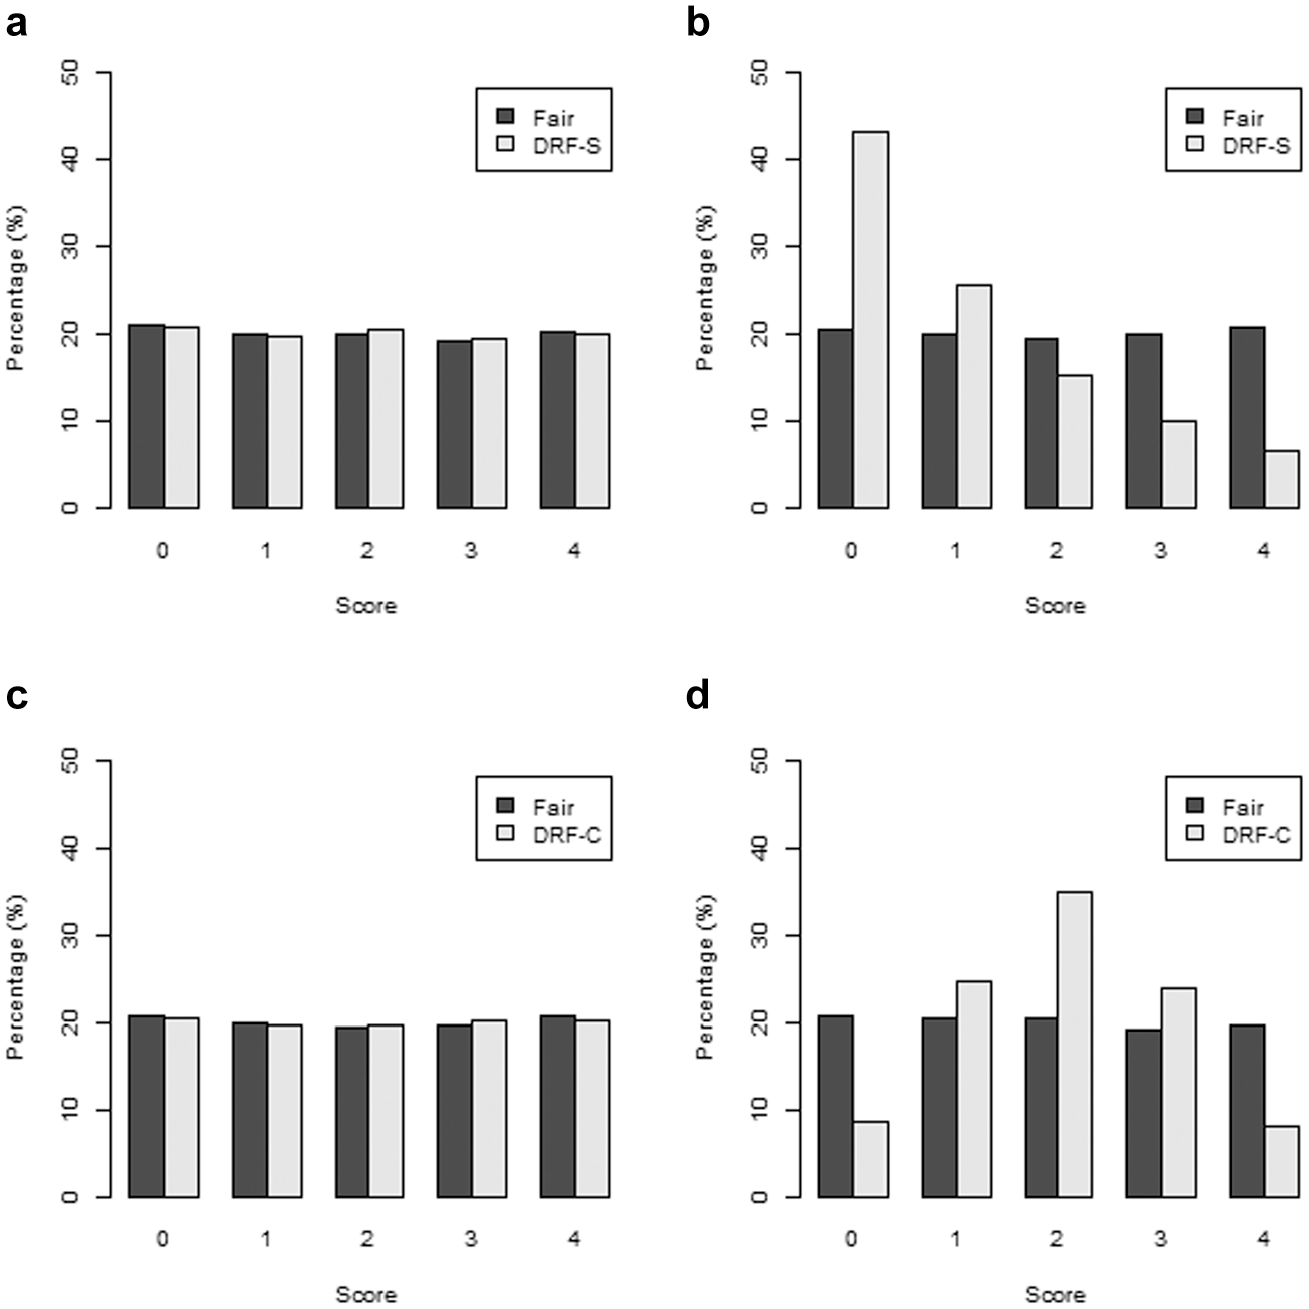
Observed score distributions (percentages) in Simulation Study 1: (a) Subgroup 1, (b) Subgroup 2, (c) Subgroup 3, and (d) Subgroup 4.
Figure 4 displays test reliability and MARC distributions for the reference and focal groups under the two models across 100 replications. Reliability values were consistently higher under the DDRFM than under the RFM (upper panel). Furthermore, MARC values were consistently lower under the DDRFM than under the RFM (lower panel).

Test reliability estimates and mean absolute rank change (MARC) for reference (R) and focal group examinees (F) under the RFM and the DDRFM in Simulation Study 1.
Regarding the biased ratings’ impact on the measurement precision, we looked at the relationship between true and estimated examinee proficiency estimates under the RFM and the DDRFM. For an exemplary simulated dataset, Figure 5 illustrates this relationship. Under the RFM (upper panel), the values were scattered widely around the identity line. By contrast, under the DDRFM, the values generally stayed much closer to the identity line, providing further evidence of higher DDRFM measurement precision.

Relationship between true and estimated examinee proficiency estimates under the RFM and the DDRFM in Simulation Study 1.
Simulation 2: False-positive and True-positive Rates of Dual DRF Detection
Design
In Simulation Study 2, we examined the efficiency of the model-based approach to detect dual DRF effects correctly. We generated item responses under the DDRFM employing a design similar to Simulation Study 1. Differences concerned the systematic variation of three factors: (1) the number of examinees (I = 500 or 1,000), (2) the number of criteria (J = 3 or 5), and (3) the number of rating scale categories (K = 3 or 5). These three factors are directly related to the amount of information on how raters use the rating scale.
Reference and focal groups were sampled from a standard normal distribution with a mean of zero and unit variance. The true values of parameters were taken from Jin and Wang (2017) and related studies. When J = 3, the mean criterion difficulties were set at −0.5, 0, and 0.5; when J = 5, the mean difficulties were set at −0.5, −0.25, 0, 0.25, and 0.5. For simplicity, the step parameters for all criteria were set at −0.5 and 0.5 when K = 3, and −0.75, −0.25, 0.25, and 0.75 when K = 5.
As shown in Tables 2 and 3, we specified three rater severity levels (η), each with 3 or 4 raters: −0.5, 0, and 0.5. Similarly, we specified three rater centrality levels (ϖ): −0.5, 0, and 0.5. The size of DRF-S (Δηl) was set at 0.5 for the two biased raters, and the size of DRF-C (Δϖl) was set at 0.5 for the other two biased raters; that is, two raters were more severe toward the focal group, whereas the other two raters exhibited more centrality toward the focal group.
Type I Error Rates (%) of Severity and Centrality Effect Detection under the DDRFM in Simulation Study 2.

Note. Values before and after the slash are Type I error rates under the conditions with 500 and 1,000 examinees, respectively.
Rater 1 is an unbiased rater used as an anchor. Type I error rates are reported for raters who did not exhibit DRF-S or DRF-C.
Power Rates (%) of Severity and Centrality Effect Detection under the DDRFM in Simulation Study 2.

Note. Values before and after the slash are power rates under the conditions with 500 and 1,000 examinees, respectively.
Rater 1 is an unbiased rater used as an anchor. Power rates are reported for raters who did exhibit DRF-S or DRF-C.
The simulated data were fit with the data-generating model. Therefore, rater l was identified as exhibiting DRF-S (or DRF-C) if the 95% probability interval of Δηl (or Δϖl) did not include zero. Regarding the Type I error rate, we computed the percentage of times a fair rater was mistakenly identified as exhibiting DRF-S (or DRF-C) across 100 replications. As to the power rate, we computed the percentage of times a biased rater was correctly identified as exhibiting DRF-S (or DRF-C). Under the true model, the Type I error rates should be close to the nominal 5% level across conditions. The power rates should depend on the manipulated factors: We expected higher power rates under conditions with more examinees, more criteria, and more scale categories.
Results
Table 2 summarizes the Type I error rates under the eight conditions. Overall, Type I error rates of DRF-S and DRF-C detection were well controlled at the 5% level across conditions. Similarly, Table 3 presents the power rates under the eight conditions. Consistently, higher power rates were observed with 1,000 examinees, 5 criteria, and 5 scale categories.
We also conducted three-way ANOVAs on the power rates of DRF-S and DRF-C, respectively. Under the current simulation design, the first manipulated factor (i.e., the number of examinees) had the greatest influence on the power rate of DRF-S detection (p = .002, partial η2 =0.70). In contrast, the third manipulated factor (i.e., the number of rating scale categories) had the greatest influence on the power rate of DRF-C detection (p < .001, partial η2 =0.98).
Notably, rater centrality (ϖ parameter) influenced the power rates of DRF-S detection: a biased rater with lower centrality was more likely detected as exhibiting DRF-S than a biased rater with higher centrality. The reason for this centrality-dependent DRF-S detection is mainly that, for a given DRF-S size, a larger area between two expected score curves for the reference and focal groups is obtained for raters with lower ϖ parameters.
An Empirical Example: TestDaF Essay Rating Data
Instrument and Procedure
The Test of German as a Foreign Language (TestDaF, Test Deutsch als Fremdsprache) is officially recognized as a language exam for international students applying for entry to higher education institutions in Germany (Eckes & Althaus, 2020; for a review, see Norris & Drackert, 2018). The TestDaF writing section assesses an examinee’s ability to produce a coherent and well-structured text on a given topic taken from the academic context. The dataset considered here had been analyzed before using a traditional facets modeling approach (Eckes, 2005).
Two out of 29 raters (23 women and 6 men) independently scored the written performances of 1,359 examinees on three criteria (global impression, task fulfillment, and linguistic realization) using a four-category rating scale (below TDN 3, TDN 3, TDN 4, and TDN 5; coded as 0–3). As mentioned previously, the proportion of missing ratings was high (93.1%). Nonetheless, the dataset was connected (Eckes, 2015; Engelhard & Wind, 2018).
At the time of this exam (April 2002), the examinees’ full names were provided in the label attached to each paper. Raters were thus able to infer most examinees’ gender from parts of these names. Moreover, research has shown that female and male handwritings look significantly different (Beech & Mackintosh, 2005; Boulet & McKinley, 2005; Siddiqi et al., 2015), increasing the chances for raters to guess an examinee’s gender correctly. Therefore, the essay ratings seemed to provide a suitable dataset for studying the potential impact of gender-related differential severity and centrality effects. Since 36 examinees did not indicate their gender, we included the responses of 1,323 examinees (728 females and 595 males) in the present analyses.
Table 4 gives the means and standard deviations (SDs) of each rater’s score distribution, listed separately for female and male examinees. Observed means and SDs can serve as rough indicators of rater severity and centrality, respectively (Johnson et al., 2009). Across raters, the overall mean for female examinees was 1.78 (SD = 0.84). For male examinees, the overall mean was 1.58 (SD = 0.83), suggesting that females, on average, slightly outperformed males. Notably, however, 6 raters (four women and two men) on average assigned higher ratings to male examinees, pointing to the possibility that raters’ severity levels may have varied with gender. Similarly, the observed SDs show that 16 raters (13 women and 3 men) tended to assign females less homogeneous scores than males. Our DDRFM analyses were to shed more light on these differential tendencies.
Means and Standard Deviations of Observed Scores Assigned to Female and Male Examinees by 29 Raters in the Essay Rating Study.
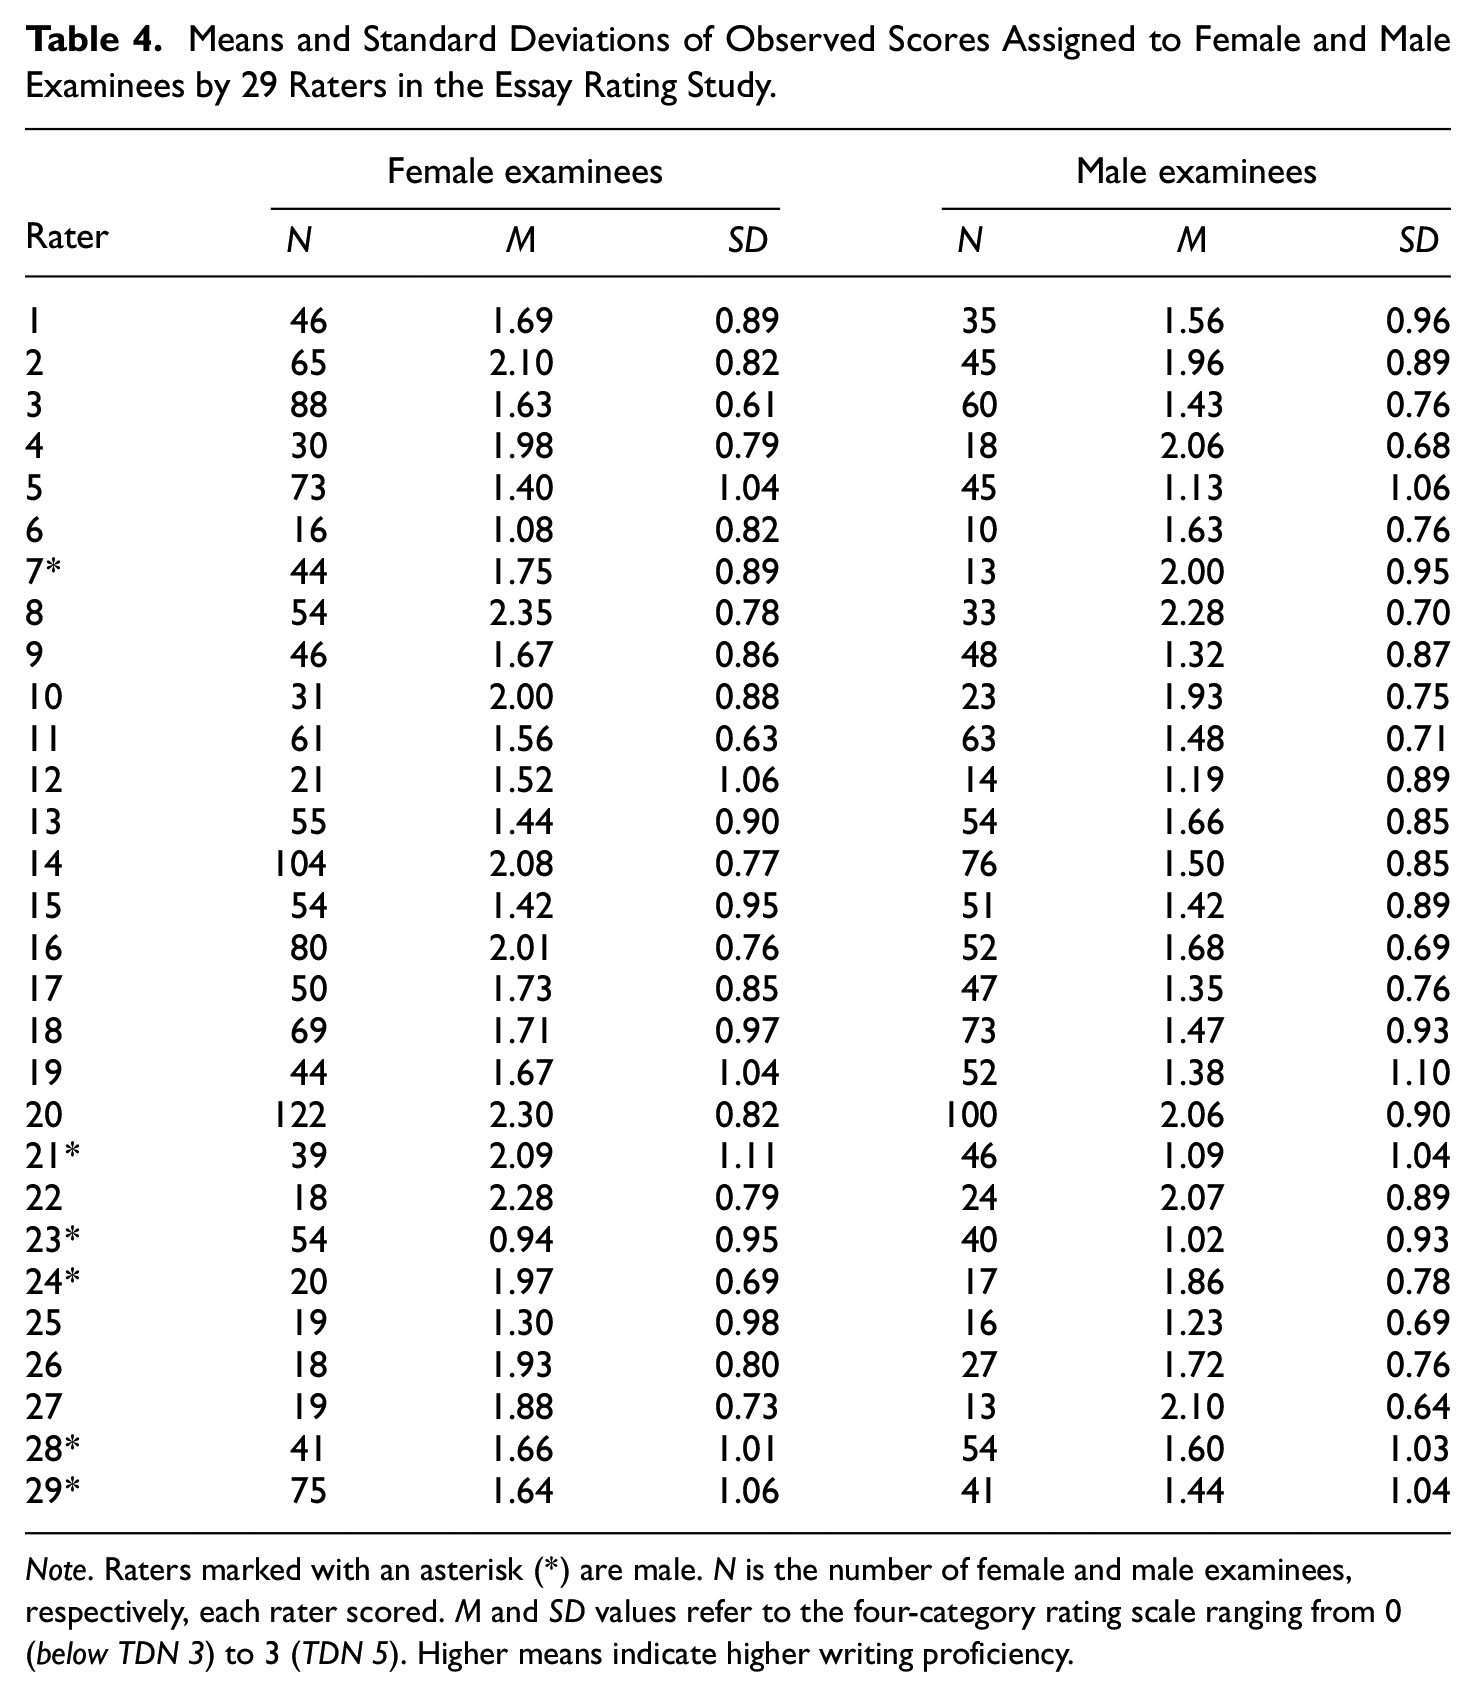
Note. Raters marked with an asterisk (*) are male. N is the number of female and male examinees, respectively, each rater scored. M and SD values refer to the four-category rating scale ranging from 0 (belowTDN 3) to 3 (TDN 5). Higher means indicate higher writing proficiency.
Data Analysis
The RFM and DDRFM were fit to the data, with male examinees treated as the reference group. For model identification, the mean ability of males was fixed at zero. Following the partial-credit approach in Eckes (2005), each criterion was modeled to have its own set of threshold parameters.
Results
The PPP-value of the Bayesian chi-square for the DDRFM was .175, indicating satisfactory absolute data-model fit. Furthermore, only 6.6% of the z statistics fell beyond the ±1.96 interval, suggesting convergence of the Markov chain to the posterior distribution. The DDRFM yielded a lower DIC value (13,315) than the RFM (13,612), providing evidence that the more complex model (i.e., DDRFM) fit the essay rating data better, taking into account the greater number of estimated parameters in terms of the penalty statistic for the DDRFM.
The findings regarding model fit suggest that important assumptions of the RFM regarding rater functioning, including equal centrality levels across raters and the nonexistence of DRF-S or DRF-C, respectively, were disconfirmed. On the other hand, the DDRFM fit the rating data so well that a closer look at the resulting parameter estimates seemed warranted.
Figure 6 displays the estimates (and the 95% probability intervals) for DRF-S and DRF-C, respectively. As can be seen (Figure 6a), raters 8, 13, 15, and 23 (three women and one man) were more severe to females, whereas raters 11, 14, 19, and 29 (three women and one man) were more lenient to females. The DRF-C estimates (Figure 6b) reveal that (female) rater 3 and (male) rater 7 tended to overuse middle categories (TDN 3 or TDN 4) when rating females’ performances, whereas (female) raters 8 and 16 tended to preferably assign extreme categories (below TDN 3 or TDN 5) to females. Notably, rater 8 was identified to exhibit DRF-S and DRF-C simultaneously.

DRF-S and DRF-C estimates for 29 raters in the TestDaF essay rating study.
Under the DDRFM, for male examinees, the mean θ estimate was 0 (males were treated as the reference group), and the variance of the estimates was 6.09; for female examinees, the respective statistics were 0.61 and 6.60, respectively, suggesting that females outperformed males. Figure 7a displays the relationship between the θ estimates obtained under the DDRFM and the RFM. The two sets of estimates were highly correlated (0.99). However, when taking the DDRFM θ estimates as the gold standard, the rank-order change was between −89 and 136 ranks (M = 8.85) for males and between −175 and 216 ranks (M = 7.23) for females. As illustrated in Figure 7b and c, fitting the RFM would make many male examinees attain higher ranking positions than female examinees, suggesting that females are disadvantaged when dual DRF effects are not taken into account.
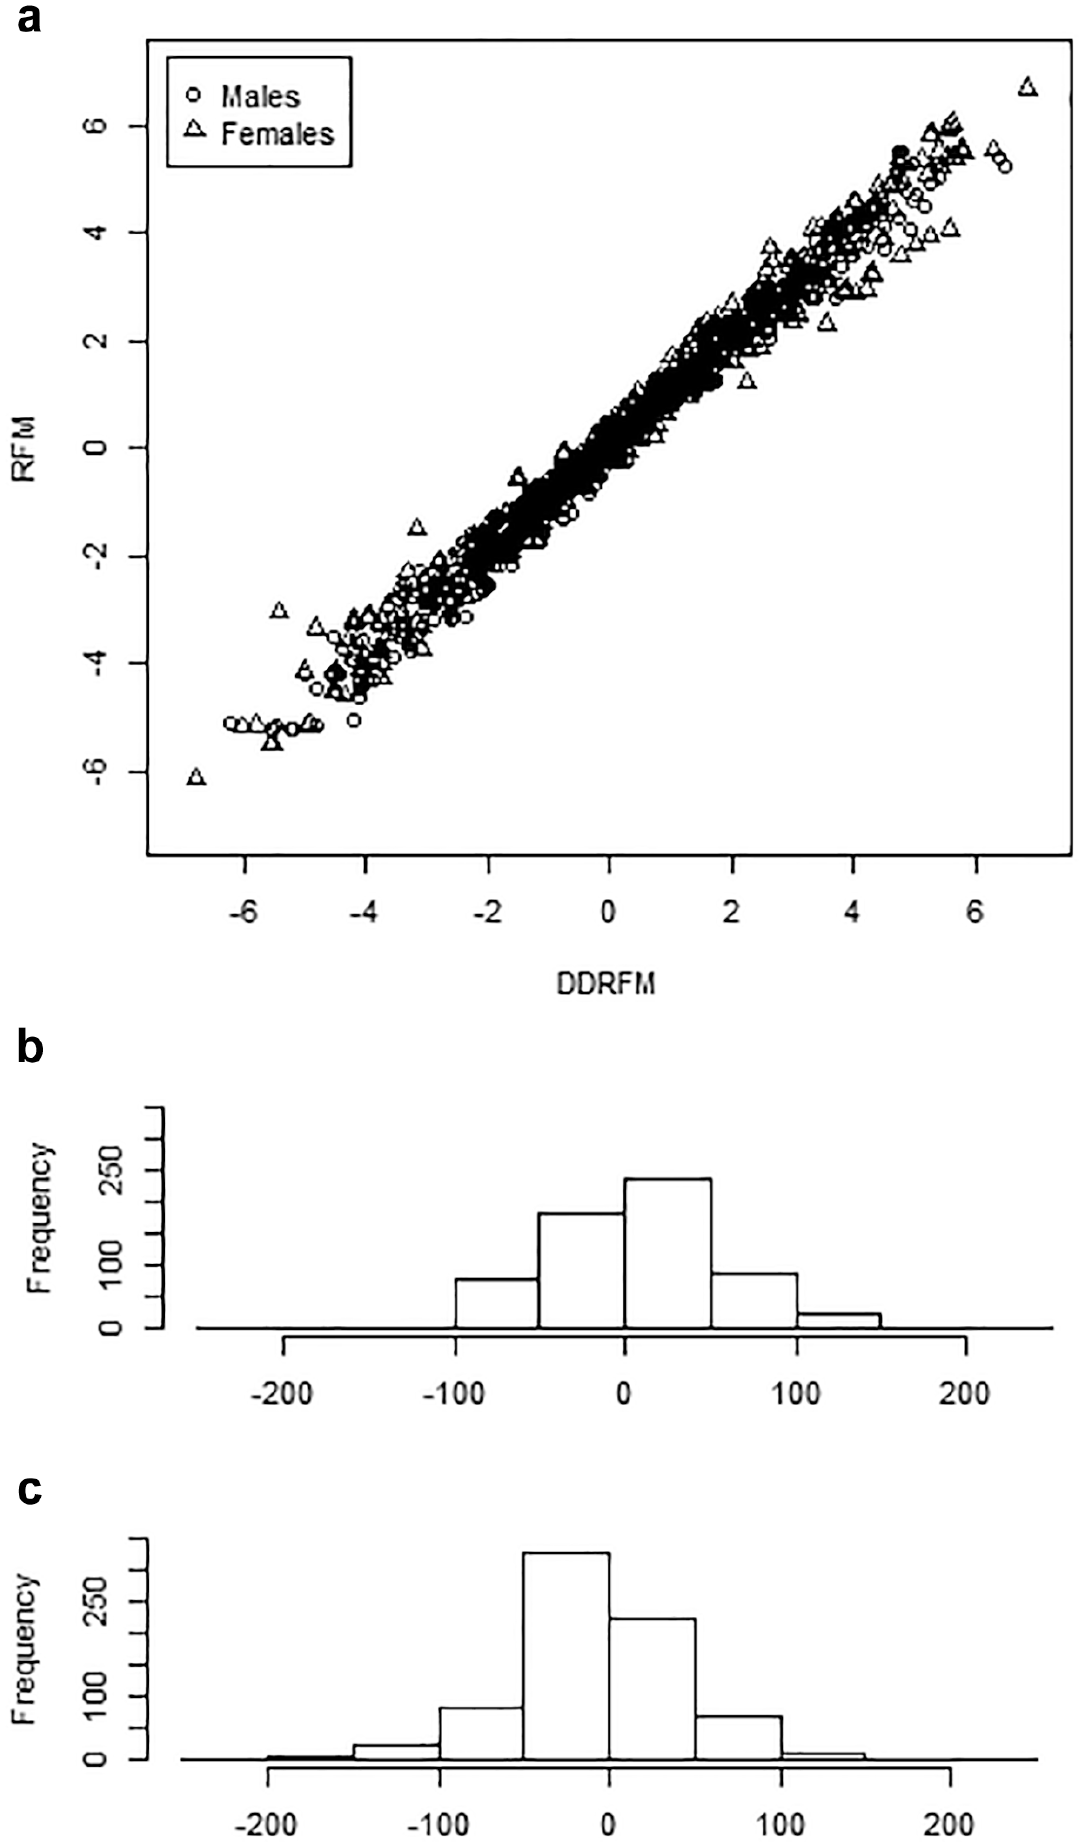
Writing proficiency estimates under the RFM and the DDRFM in the essay rating study: (a) θ estimates, (b) Rank-order change for males, and (c) Rank-order change for females.
Discussion
Severity and centrality are two main kinds of rater characteristics that need to be detected, measured, and compensated for as much as possible to ensure performance assessments’ validity and fairness (Engelhard, 1992; Myford & Wolfe, 2003, 2004; Saal et al., 1980). Ideally, once trained and sufficiently experienced, raters should exhibit only minimal severity and centrality levels, if at all, when judging examinee performances. Consistently small severity and centrality effects imply that raters should assign ratings, which are largely invariant over examinee characteristics irrelevant to the performance or construct in question. However, the bulk of research on rating quality in a wide variety of assessment settings has consistently provided evidence that raters, even when extensively trained, are subject to various forms of errors and biases, including DRF (Eckes, 2015; Engelhard & Wind, 2018; McNamara et al., 2019; Wind & Peterson, 2018; Wolfe & Song, 2016). In other words, performance assessments typically do not seem to come close to the ideal of raters acting as a homogeneous group and achieving undisputable high levels of interrater agreement and reliability. Instead, it may reasonably be doubted whether this ideal is ever attainable by rater training alone.
Measurement models help remedy this problematic situation. In the present research, we proposed a facets model, the dual differential rater functioning model (DDRFM), aiming to examine whether raters exhibited differential severity (DRF-S), differential centrality (DRF-C), or both, toward identifiable groups of examinees. In two simulation studies, we found that ignoring DRF-S and DRF-C would lead to poorer measurement quality, especially for the focal group. In addition, the proposed DDRFM allows researchers to detect DRF-S and DRF-C with well-controlled Type I error rates.
We also applied the DDRFM to a real dataset, using ratings from a large-scale writing performance assessment. The presence of gender-related severity biases in these data had been studied before using an exploratory interaction analysis based on the RFM (Eckes, 2005). In pairwise comparisons, statistically significant results were obtained for only three raters: two raters were more severe with male than with female examinees, one rater was more lenient with male than with female examinees. The present DDRFM analysis yielded a much more detailed, precise, and comprehensive picture of gender bias: 11 out of the 29 raters were identified to exhibit differential severity or differential centrality regarding examinee gender groups. One of these raters was subject to both DRF-S and DRF-C.
We illustrated the practical implications of dual DRF effects by comparing the examinee rank-ordering resulting from the DDRFM proficiency estimates (reference) to the examinee rank-ordering produced by the RFM estimates. On average, the rank orderings for male examinees differed by 8.85 ranks; for female examinees, the rank-order change averaged 7.23, depending on which model was used for estimating their proficiency. Rank differences of this magnitude may have severe consequences for individual examinees, for example, when deciding on university admission.
Several limitations should also be noted. In this study, we focused on between-rater variations of DRF-S and DRF-C. More specifically, in the DDRFM (Equation 5), we treated the dual DRF effects as fixed effects. Consequently, we were not able to consider possible within-rater variations (Wang & Wilson, 2005). A straightforward approach to account for within-rater differences in dual DRF effects would be to extend the DDRFM by defining the rater parameters as random effects (e.g., following normal distributions). Of course, fitting a random-effects DDRFM to real data requires much larger sample sizes for parameter estimation; that is, each rater should have rated a sufficiently large number of performances.
It should be noted that the choice of priors may influence the estimation results for DDRFM parameters (Gelman et al., 2013 ; Lunn et al., 2013 ). Therefore, it appears generally advisable to reanalyze the data with different priors and check the consistency of the results. In Simulation Study 1, for example, we ran an additional analysis with even less informative priors to investigate the parameter recovery when fitting the RFM and DDRFM; that is, we used N(0, 10) and λ(0.01, 0.01), respectively. The results were highly similar to the first analysis, attesting to our findings’ stability.
Furthermore, non-rating data targeting the same latent proficiency may be included as auxiliary information to improve parameter estimation. Particularly, it is common to use multiple item or task formats in large-scale assessments, including selected-response items (e.g., multiple-choice or short-answer questions; Guo & Wind, 2021; Wind & Ge, 2021). In such mixed-format situations, examinee responses to items objectively scored could be included to provide more information on examinee proficiency, further increasing the precision of dual DRF effects detection in DDRFM studies.
As a practical implication, measuring both differential severity and differential centrality effects can improve rater training and monitoring through providing individualized feedback to raters. This kind of feedback may help sensitize raters for possible biases that otherwise would go unnoticed. Regarding test or assessment development, any clues that may reveal examinees’ performance- or construct-irrelevant characteristics should be eliminated as far as possible. As for the TestDaF writing assessment (Eckes, 2005), subsequent examinations used completely anonymized paper scanning and rating procedures. Furthermore, with the recent advent of the web-based, digital TestDaF (g.a.s.t, 2020), examinees type their written responses using a keyboard, eliminating any gender-related information that may emerge from their handwriting.
Much like the situation in DIF research more generally (Penfield & Camilli, 2007), providing reasonable explanations for dual DRF effects that a DDRFM analysis may have revealed is quite challenging and often requires considering information on examinees and raters, respectively, coming from other sources. For example, since rating accuracy is influenced by raters’ cognitive and meta-analysis strategies (Zhang, 2016), researchers may investigate through a mix of quantitative and qualitative methods (e.g., eye-tracking analysis, think-aloud protocols, or structured interviews) how raters subject to dual DRF effects go about assigning ratings to examinees. Findings from studies along these lines may help to identify possible causes of dual DRF effects.
Supplemental Material
sj-docx-1-epm-10.1177_00131644211043207 – Supplemental material for Detecting Differential Rater Functioning in Severity and Centrality: The Dual DRF Facets Model
Supplemental material, sj-docx-1-epm-10.1177_00131644211043207 for Detecting Differential Rater Functioning in Severity and Centrality: The Dual DRF Facets Model by Kuan-Yu Jin and Thomas Eckes in Educational and Psychological Measurement
Footnotes
Declaration of Conflicting Interests
The author(s) declared no potential conflicts of interest with respect to the research, authorship, and/or publication of this article.
Funding
The author(s) received no financial support for the research, authorship, and/or publication of this article.
Supplemental Material
Supplemental material for this article is available online.
Notes
References
Supplementary Material
Please find the following supplemental material available below.
For Open Access articles published under a Creative Commons License, all supplemental material carries the same license as the article it is associated with.
For non-Open Access articles published, all supplemental material carries a non-exclusive license, and permission requests for re-use of supplemental material or any part of supplemental material shall be sent directly to the copyright owner as specified in the copyright notice associated with the article.