
Abstract
The unstructured multiple-attempt (MA) item response data in virtual learning environments (VLEs) are often from student-selected assessment data sets, which include missing data, single-attempt responses, multiple-attempt responses, and unknown growth ability across attempts, leading to a complex and complicated scenario for using this kind of data set as a whole in the practice of educational measurement. It is critical that methods be available for measuring ability from VLE data to improve VLE systems, monitor student progress in instructional settings, and conduct educational research. The purpose of this study is to explore the ability recovery of the multidimensional sequential 2-PL IRT model in unstructured MA data from VLEs. We conduct a simulation study to evaluate the effects of the magnitude of ability growth and the proportion of students who make two attempts, as well as the moderated effects of sample size, test length, and missingness, on the bias and root mean square error of ability estimates. Results show that the model poses promise for evaluating ability in unstructured VLE data, but that some data conditions can result in biased ability estimates.
Virtual learning environments (VLEs) are online instructional systems in which learners and teachers interact for an educational purpose (Weller, 2007). Allowing or encouraging multiple attempts (MA) on assessment items is increasingly common in these VLEs (Abbakumov et al., 2018; Bergner et al., 2019). As opposed to some more traditional forms of MA assessment administration, such as an “answer-until-correct” item administration (Pressey, 1926), some VLEs allow students to attempt items multiple times at their own discretion while not requiring students, per say, to make multiple or even single attempts on items.
Due to these characteristics, MA data from VLEs can be considered unstructured as it often contains a mix of single- and multiple-attempt responses to items regardless of success on a first attempt, variability in the degree to which students’ traits may increase across multiple attempts, and large amounts of missingness. In traditional MA data, there is often a fixed set of items in which each student makes at least one attempt and will make multiple attempts if the first attempt was incorrect, and there is often little time between attempts. However, in VLE MA data, students are often self-selecting to engage in assessments and may re-attempt an item at a much later date than the original attempt, if at all. Two characteristics of unstructured MA data from VLEs, namely the proportion of students making MA and the differential magnitudes of the changing ability across attempts per student, introduce variability in the data that has not been studied with respect to how to score the students. In addition, the unstructured MA data contain multiple types of missing data as some random missingness can come from items being randomly selected from the item bank to display to students who want to engage in the assessment and also some missing not at random (MNAR) data can be present when students choose to not respond to items presented or to only make one incorrect attempt. Hence, this study focuses on such item response data from these VLE-based, student-selected MA assessments, with a focus on being able to extract unbiased student ability estimates from such data, which can then be used for improving algorithms in the VLE (e.g., personalizing), informing instructors of student performance in the VLE, or conducting educational research from the VLE data.
Previous studies have applied classical test theory models (CTT), traditional item response theory models (IRT), and extended IRT models to evaluate data with MA to detect student learning (e.g., Abbakumov et al., 2018; Culpepper, 2014; Gönülates & Kortemeyer, 2015). For example, Attali and Powers (2010) followed the CTT framework to compare the observed scores between a three-attempt group and a single-attempt group on an MA test, finding that students’ scores increased up to 19% in the group with three attempts. Abbakumov et al. (2018) extended the traditional IRT model by modeling the effect of attempts, finding that the growth of students’ ability depended on the initial ability. Culpepper (2014) used a sequential Rasch model to estimate student ability in an up-to-five-attempt MA test, pointing out that student ability was constant at the first two attempts and then showed growth in following attempts. All these approaches analyzed their MA data either by adding an index to model the effect of attempts on student ability (e.g., Abbakumov et al., 2018; Gönülates & Kortemeyer, 2015; Hung & Huang, 2019) or by separating the number of attempts into various groups (e.g., Attali & Powers, 2010; Cheng & Liu, 2016; Culpepper, 2014).
However, to our knowledge, neither these methods nor any other methods proposed in the literature for estimating ability from MA data have been evaluated in the context of unstructured MA item response data from VLEs. Since the data characteristics in previous research were not aligned with unstructured MA item response data from VLEs, it is critical to understand the performance of methods for estimating student ability from unstructured MA item response data. Otherwise, measurement models may result in biased or error-prone estimates. With the increasing popularity of online education and the increasing need for well-studied computational psychometrics methods, researchers and practitioners need appropriate measurement models to evaluate student ability from the unstructured VLE data.
One reason it is challenging to estimate student ability with unstructured MA data is because of the uncertainty about whether a particular student’s ability is changing or staying constant across the repeated item attempts. It is easy and convenient for simulation studies to either assume constant ability or to assume growing ability within a particular degree across all simulees. But for applied studies, it is difficult for researchers to know the true ability change, leading to a challenge of model selection for appropriate ability estimates. In Culpepper’s (2014) application study, he fit a unidimensional sequential Rasch model to a data set by classifying the number of attempts into different groups. After noticing student ability changed over attempts, he fit a multidimensional sequential Rasch model. Another example is from Bergner’s et al. (2019) application study. Due to the unknown nature of true ability, they primarily analyzed model fit and the correlations between the estimated first-attempt scores and observed scores to evaluate the ability recovery of the sequential two-parameter logistic (2-PL) IRT model with three-attempt data, including MNAR data. As the true ability and ability growth are unknown in these applied studies, Culpepper’s (2014) and Bergner’s et al. (2019) results are bolstered by simulation work that supports the use of the approach in data similar to the applied data. However, as mentioned above, the unstructured MA data in VLEs are quite different than the data in previous MA studies, including those that used various versions of sequential measurement models, and hence simulations are needed to begin to understand how previously applied methods may work in such data environments.
The purpose of this study is to explore the ability of a sequential IRT model to recover unbiased ability estimates from unstructured MA data stemming from VLEs. We explore the model performance by manipulating four factors: the growth in student ability between attempts, the proportion of students making multiple attempts, the number of presented items, and the sample size. Also, we investigated the effect of MNAR data on the sequential IRT model performance. The outcomes of interest were bias and root mean square error (RMSE) surrounding ability estimates from the sequential IRT model. Hence, the research questions for this study are the following:
The Sequential IRT Model and VLE Data
Sequential measurement models were proposed by Tutz (1990) and defined as
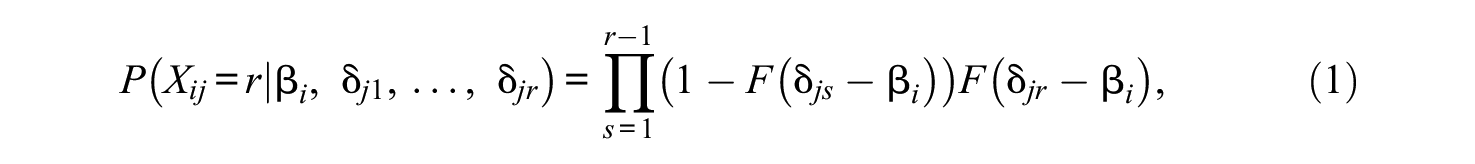
where

If we apply the 2-PL model (Birnbaum, 1968) into the sequential model framework, as Bergner et al. (2019) did,

The logic of the sequential model’s function is similar to the geometric random variable function, where
One reason to expect that sequential IRT models may perform well in unstructured MA data from VLEs is that these models have shown strong ability recovery performance in complex situations. Culpepper (2014) was the first application study using sequential models for a five-attempt test while defining the model as a sequential Rasch rating scale model. Also, he built the linear model for estimating student ability at every attempt. Culpepper (2014) claimed that the sequential Rasch model can estimate student ability with less bias at every attempt. Bergner et al. (2019) conducted a simulation study for MA item response data and concluded that the sequential 2-PL IRT model was associated with low RMSE values in estimating ability even when the data contained missing values.
Given that sequential IRT models may appropriately estimate student ability under the MA response structure, we selected a sequential IRT model to evaluate whether this model can estimate student ability for the unstructured MA data. To estimate each student’s various abilities during attempts in one model fitting, we selected the multidimensional 2-PL IRT model. The reason for selecting a 2-PL framework extension was that our previous work in the VLE platform established the appropriateness of a 2-PL framework underlying all of our item data (Xue et al., 2021). Therefore, the multidimensional sequential 2-PL IRT model is defined as
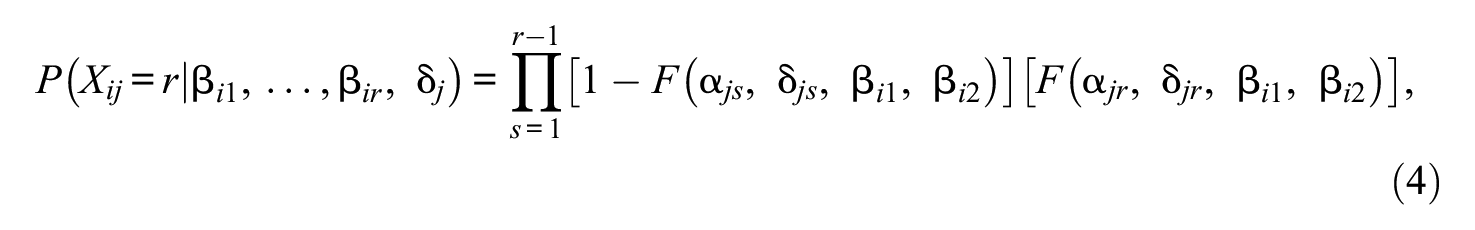
where

Probability of Skipping Items and Skipping Rate in Our Prior Work With the VLE
In VLEs, the unstructured MA data contain MNAR data due to skipping items. Students studying in VLEs may skip some challenging practices or select the learning materials that they are interested in or familiar with, since they can self-determine their learning materials. In the VLE of this current study, there is a large bank of items associated with various domains of content. When a student decides to engage in assessment, 10 items are drawn randomly from the relevant item bank and provided to the student. On any given item, the student can make no attempt or one attempt. At a later date, the same student may decide to practice with assessment items again in the VLE, and they may receive an item they have attempted in the past, allowing for another attempt on that item. Hence, the data have a large mix of missingness, single attempt on items, and multiple attempts on items.
Our previous work found that student ability and item difficulty were systematically related to skipping items that were presented to students in the VLE (Xue et al., 2021). We used logistic regression to simulate the skipping item response data and showed that the percentage of missingness in the data generated for simulations was similar to the characteristics of the observational VLE data. Hence, for this study we defined the probability of skipping items in alignment with our previous work as
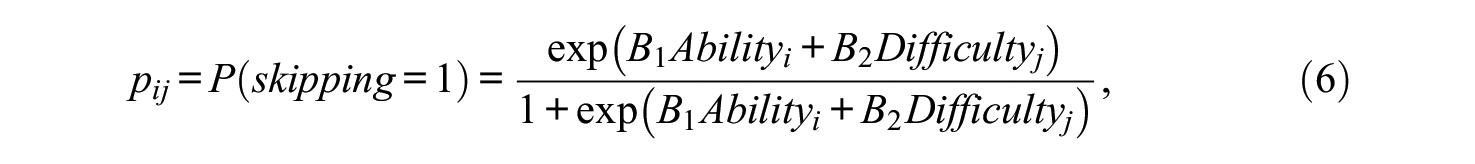
where
In this study, we obtained

where
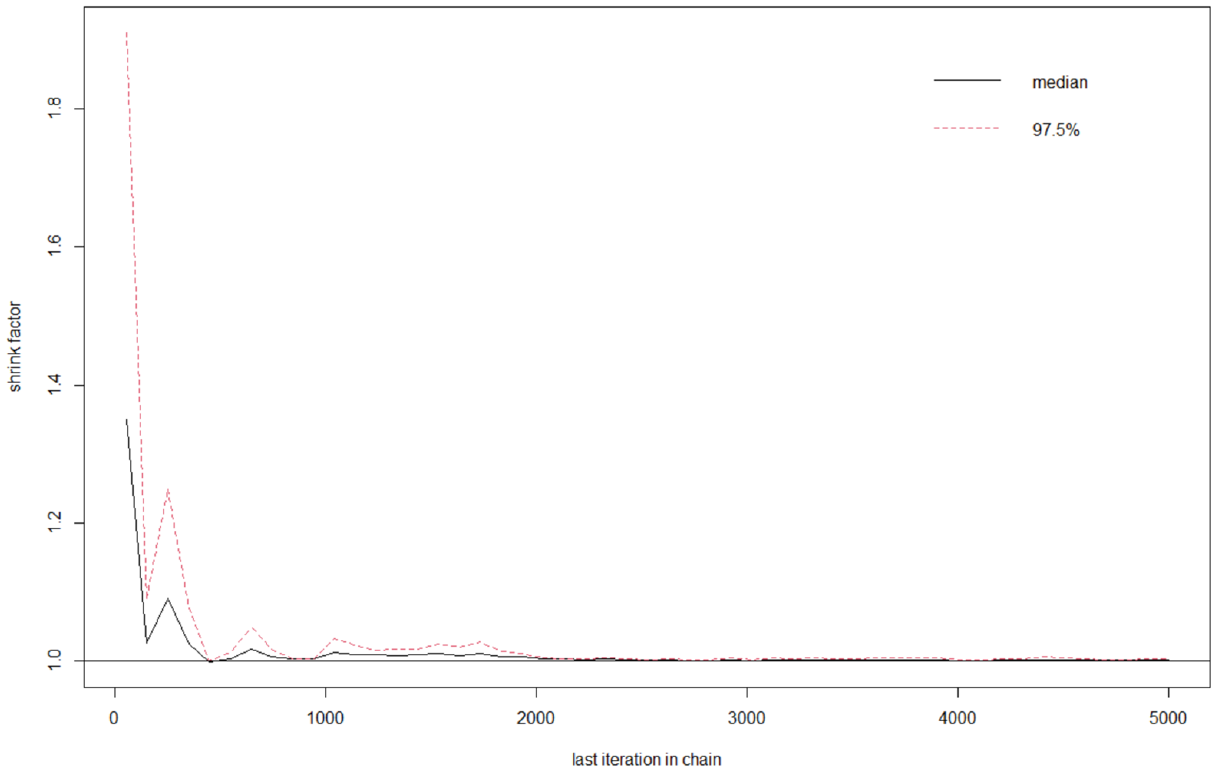
The Gelman-Rubin-Brooks Plot for Testing the Convergence Between and Within Chains in
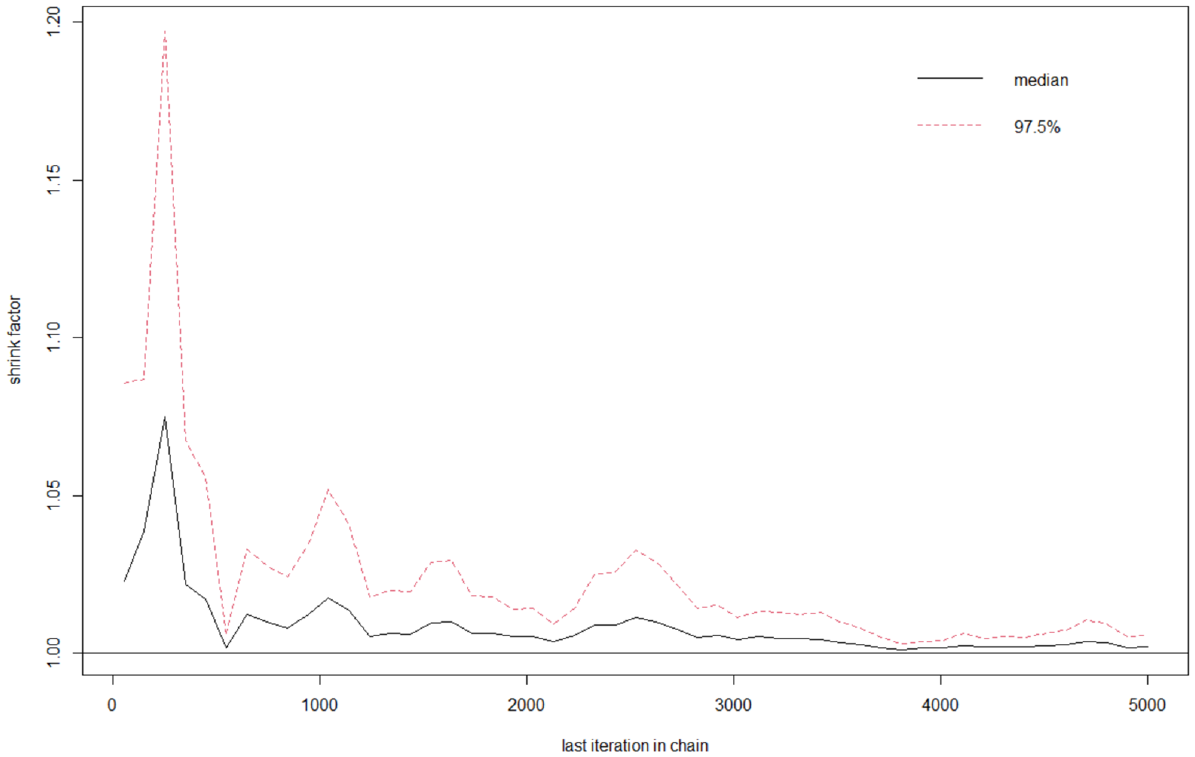
The Gelman-Rubin-Brooks Plot for Testing the Convergence Between and Within Chains in Sampling.
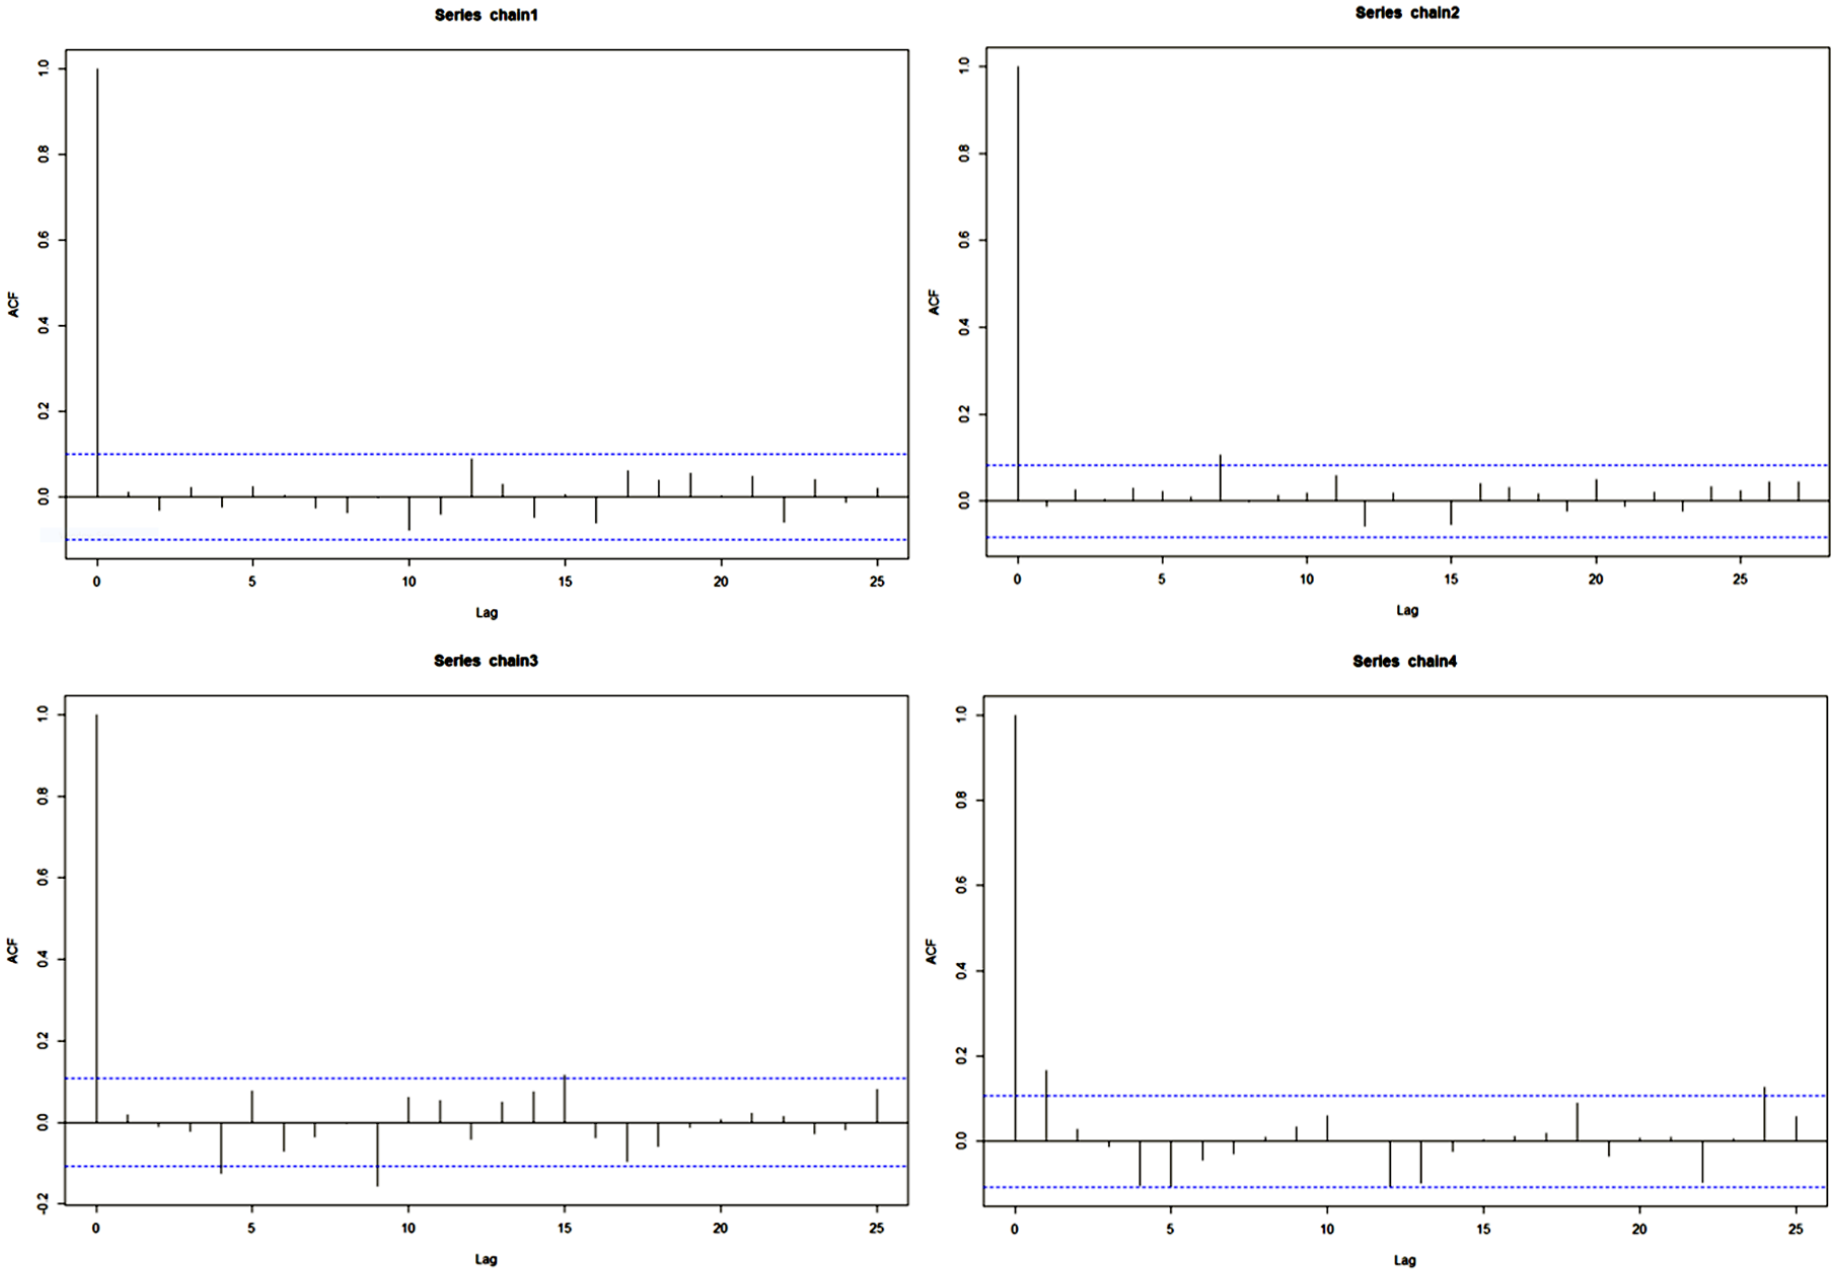
The Auto-Correlation-Function Plots of
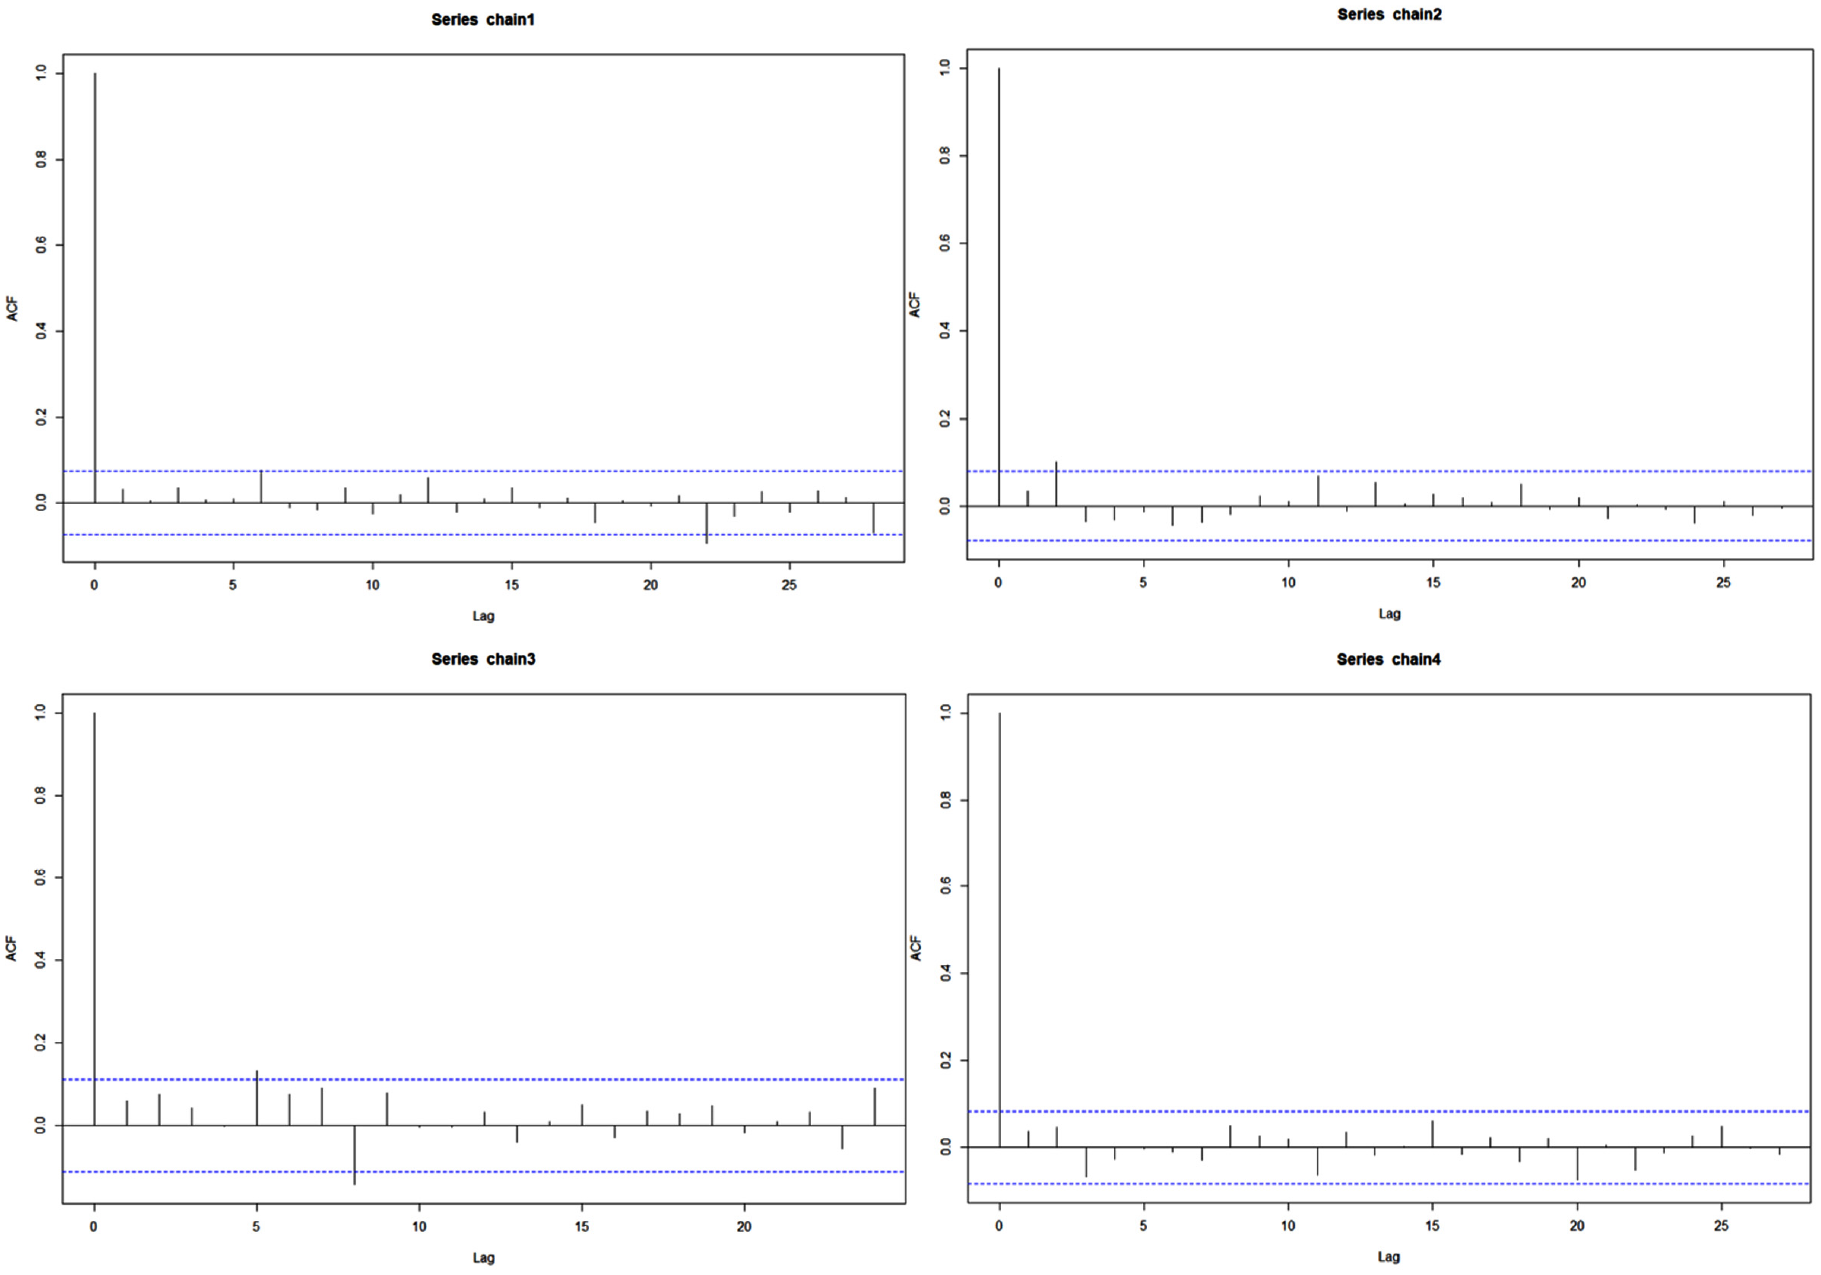
The Auto-Correlation-Function Plots of
In addition, we considered the skipping rate when generating item response data. The skipping rate was defined as

Suppose students should respond to all items, we can obtain the number of skipped items for each student by calculating every student’s probability of skipping per item. A lower skipping rate
Current Simulation Study
A simulation study was conducted based on operational data from an online learning platform Math Nation (Lastinger Center for Learning, University of Florida, 2019), which is a statewide VLE that provides video resources about Algebra 1, Geometry, and Algebra 2 to assist upper middle school and high school students with learning in these mathematics subjects. This VLE allows students to determine their learning pace and select learning materials by themselves (Leite et al., 2019). Notably, the items presented to students neither relate to student ability nor the item selection in the next engagement with the VLE. Rather, the VLE randomly assigns items from their item bank after students select their learning materials. Teachers sometimes assign students to practice with the items, but they do not assign particular items as random ones are chosen by the system. Students can decide which items to engage with, and their responses do not affect the random selection of the presented items in the next engagement.
We obtained three operational data sets that were collected from Grade 8 to 10 students’ VLE activity logs during the spring semester of 2018, the spring semester of 2020 before COVID-19 school closures, and the spring semester of 2020 after COVID-19 school closures. Each data set records the presented item numbers and students’ scores at every attempt, which has some students re-attempting an item more than once. For those students who skip the presented items, their scores record as NAs in the data set. The simulation conditions in the current study mimic descriptive statistics from these three data sets, with the exception of the ability growth between attempts which is unknown in the operational data sets and assumed to vary across students as the time between attempts also varies. Due to the limited choices in each item, students can relatively easily guess the correct answer on the third or higher attempt of an item, assuming they recall their earlier attempts. Hence, this simulation study allowed students to attempt the same items no more than two times, as we only considered the first two attempts in our operational data to be data that can help to evaluate student ability.
Simulation Factors
The proportion of students making two attempts on items was created as five levels, which were 1, 0.8, 0.6, 0.4, and 0.2. In the three operational data sets, the proportions of students making MA on at least one item varied were 13%, 24%, and 39%. In other words, the proportion of students making MA on items depends on the sample of data. Therefore, we set five levels with equal intervals to explore the effect of proportion of students making MA on the ability parameter recovery.
We set three levels and an additional baseline level for the simulation factor of ability growth between attempts,
The sample size was set as three levels, which were 500, 1,000, and 5,000. The sample sizes of three operational data sets were all larger than 3,000. It is a common situation in statewide or nationwide VLEs that the sample size is larger than 3,000. Thus, we set a level of 5,000 to represent those VLE data sets’ sample sizes. The level of 1,000 is a common level of sample size in many traditional IRT studies, and thus some researchers also selected this level of sample size to conduct MA studies with sequential IRT models (e.g., Bergner et al., 2019). Although research about the level of the sample size of 1,000 has been evaluated in traditional IRT models, the complicated characteristics of unstructured MA data in VLEs include a small number of item responses per student compared with the total number of items, various proportions of students making MA on items, and a nonignorable proportion of missing data. We decided to set 1,000 as one of the simulation sample size levels in our study for providing evidence to support the sample size selection in future MA application research in smaller VLE data sets. The level of 500 is also a common condition in other online educational learning studies (e.g., Hamutoglu et al., 2020; Jones et al., 2021). Hence, we set a level of 500 to represent small sample sizes in VLEs.
We created three levels for the simulation factor of the number of presented items, which were 5, 15, and 30. The VLE under study presents 10 items at a time, and most students engage with approximately one to three sets of items, with some skipping present. Thus, we set a level of 30 items as a baseline, with 15 items as a moderate amount of item engagement, and 5 items for students who are less engaged.
In total, there were 180 conditions, each of which were evaluated under 100 iterations in this study.
Data Generation
In this section, we mimicked the characteristics of the unstructured MA data in VLEs based on the operational data sets. We randomly sampled items for every student and randomly selected a proportion of students to make a second attempt on items. The response data for each attempt was generated separately with the 2-PL IRT model (Equation 3). The initial latent ability
At the first step, we randomly selected 15 items for every student who might skip items based on Equation 6. We re-sampled randomly from the remaining unselected items until students had at least five responses for mimicking the characteristics of the operational data. In a special case of students who skipped all items, we randomly selected two items to record their responses to keep those students in the database. Without this catch, many students went completely missing on the five-item test, making for incomparable simulation results across conditions. Next, we randomly selected 200 students out of 1,000 to make a second attempt on items. The proportion of re-attempt items depended on those selected students’ skipping rates (see Equation 8). Suppose a student responded to five items at the first attempt and their skipping rate was 90%, then we randomly selected one item (5×10%) as the re-attempt item from the first-attempt items. To keep the number of presented items consistent across conditions, we re-sampled 14 items (
For the generation of item parameters, item discriminations,
Data Analysis and Evaluation Criteria
We fit the multidimensional sequential 2-PL IRT model (Equations 4 and 5) while, notably, constraining item parameters to be equal across attempts. The models were fit in the MIRT package (Chalmers et al., 2020) in R.
To evaluate the recovery of latent ability

where n is the number of repeated times, and
RMSE is used to compare the deviations of the estimated abilities, and is defined as

To investigate the research questions, four factorial analysis of variance (ANOVA) models were used to analyze the main and interaction effects of the four simulation factors and the MNAR rate variable on the bias and RMSE, treated separately. The MNAR rate is defined as

Results
For all 180 conditions, the bias of the first-attempt ability estimates ranged from −0.77 to −0.05, and the RMSE of initial ability estimates ranged from 0.07 to 0.79. For the second-attempt ability estimates, the bias ranged from −0.82 to 0.44, and its RMSE ranged from 0.04 to 0.86. These results indicate that the multidimensional sequential 2-PL IRT model has a good recovery in student ability under some conditions but not all conditions. Prior to submitting these results to ANOVA models, we checked and upheld the normality, independence, and linearity assumptions.
As shown in Tables 1 and 2, the proportion of students making MA on items had a statistically significant main effect on bias and RMSE of the first-attempt ability estimates
ANOVA for Bias of the Initial Ability Estimate.
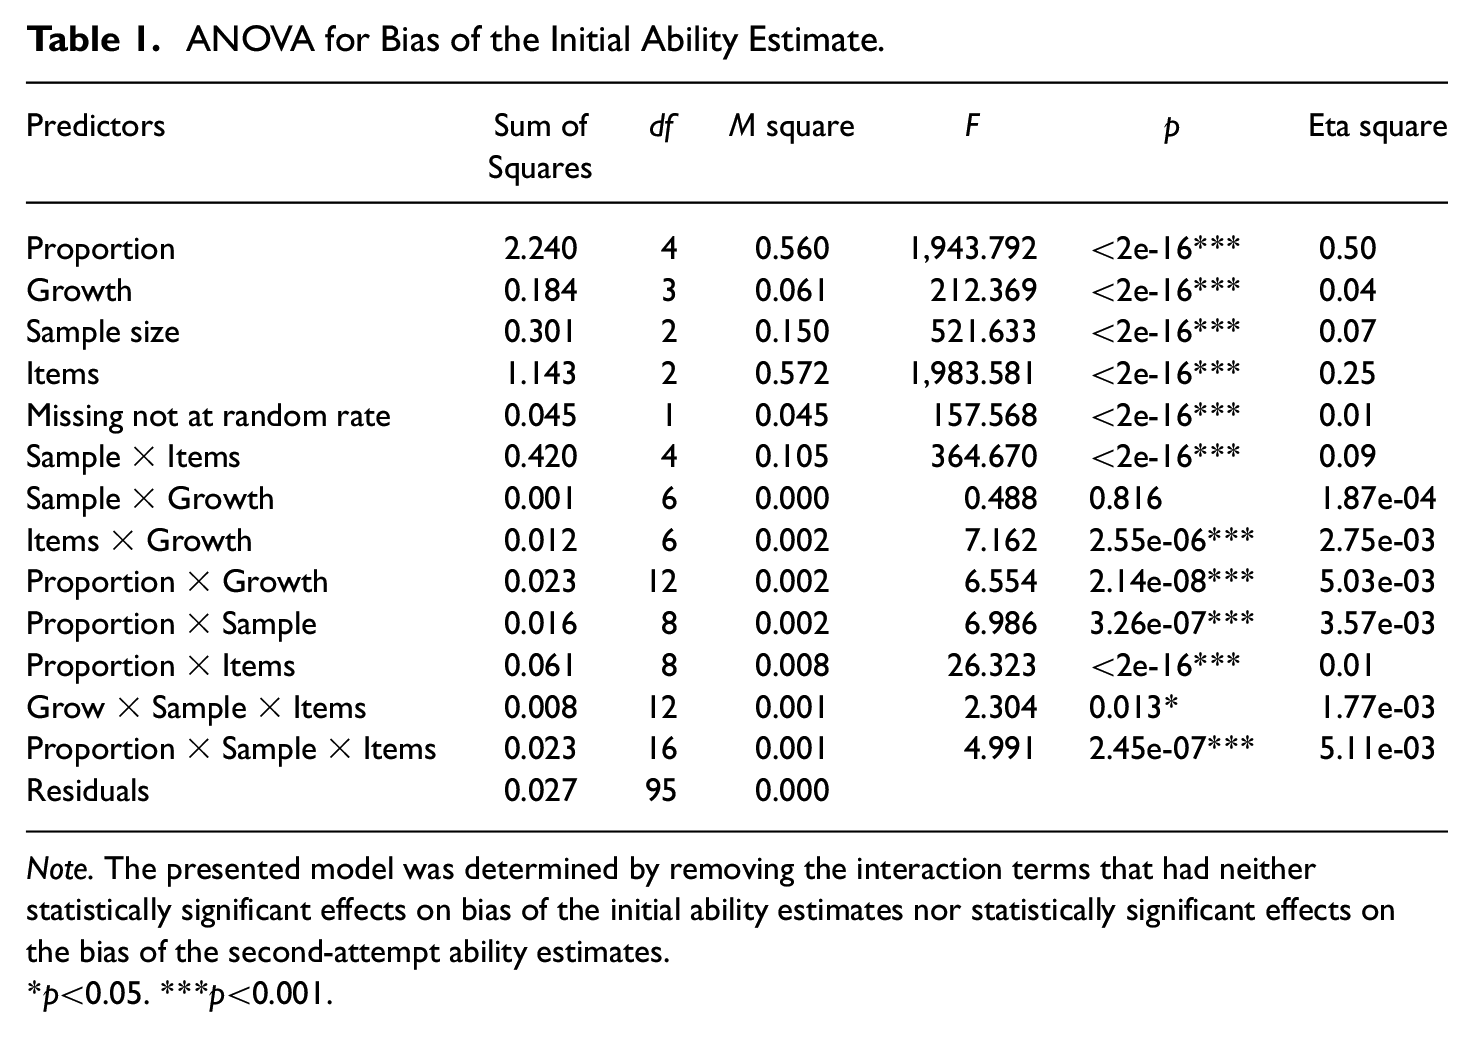
Note. The presented model was determined by removing the interaction terms that had neither statistically significant effects on bias of the initial ability estimates nor statistically significant effects on the bias of the second-attempt ability estimates. *p<0.05. ***p<0.001.
ANOVA for Root Mean Square Error of the Initial Ability Estimate.

Note. *p<0.05. ***p<0.001.
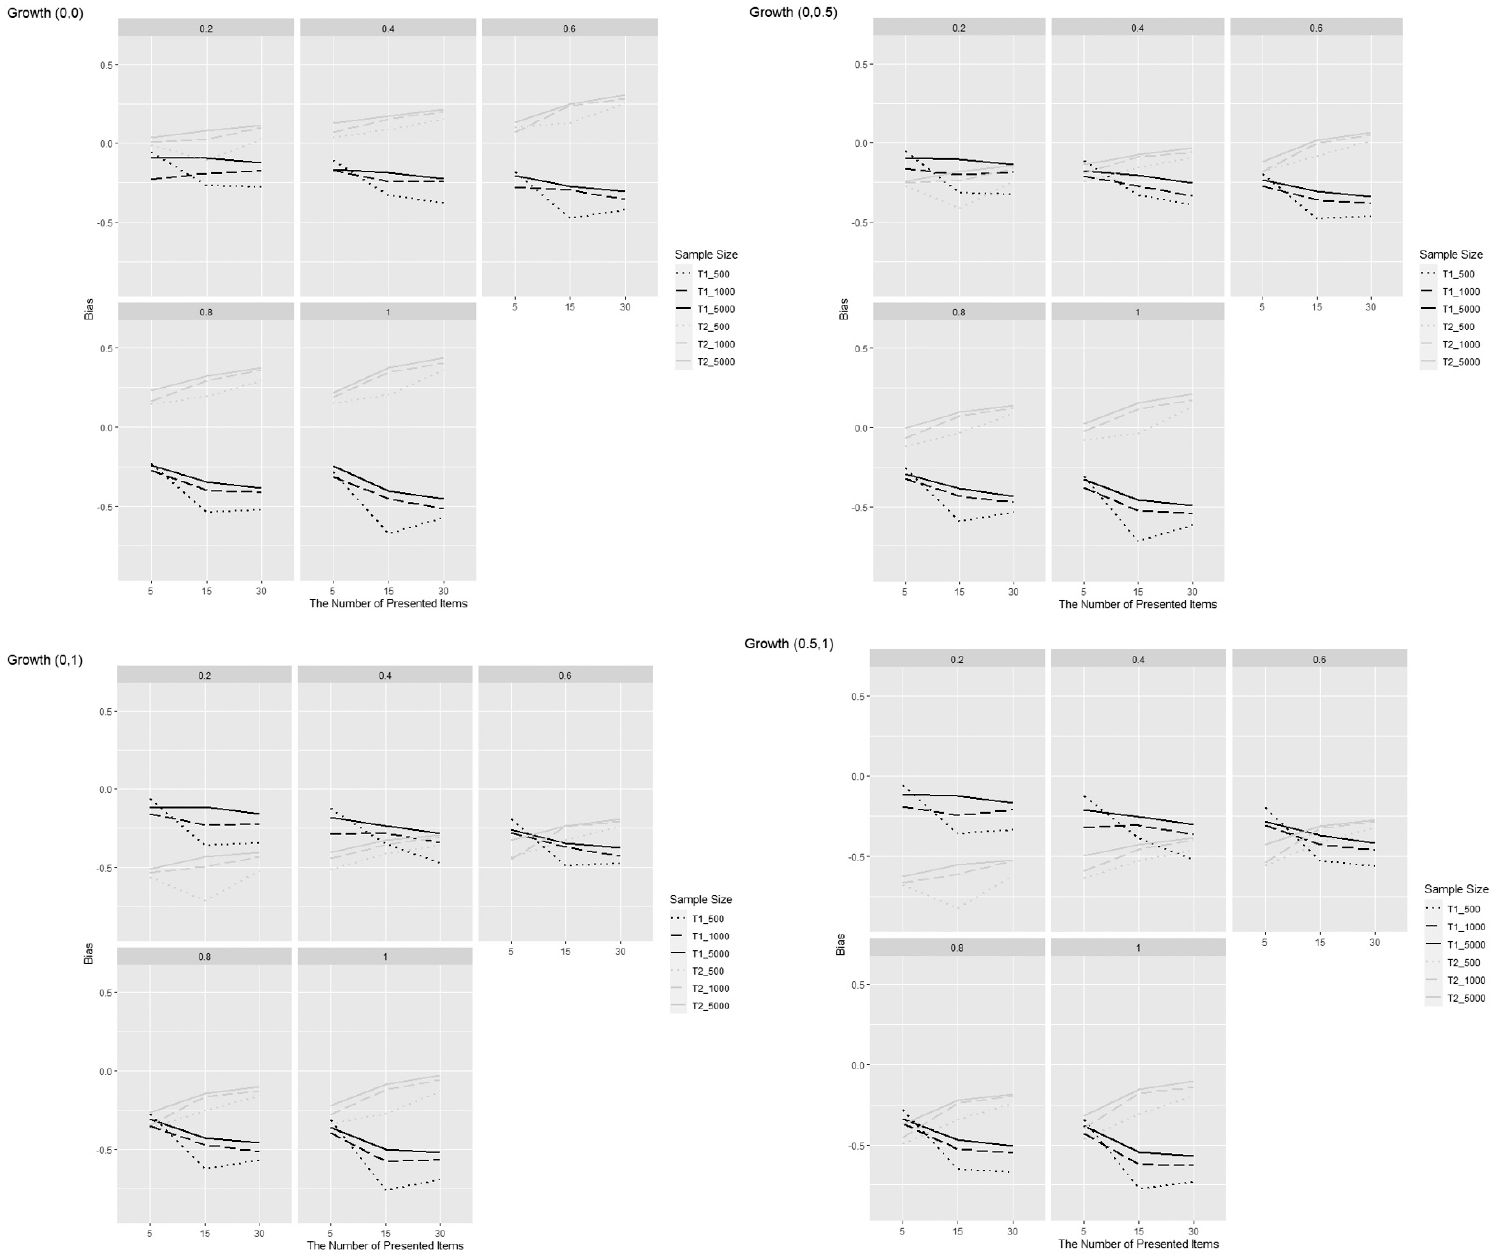
The Panel of Three-Way Comparison of the First- and Second-Attempt Ability Estimate Bias, When Controlling the Growth Ability.
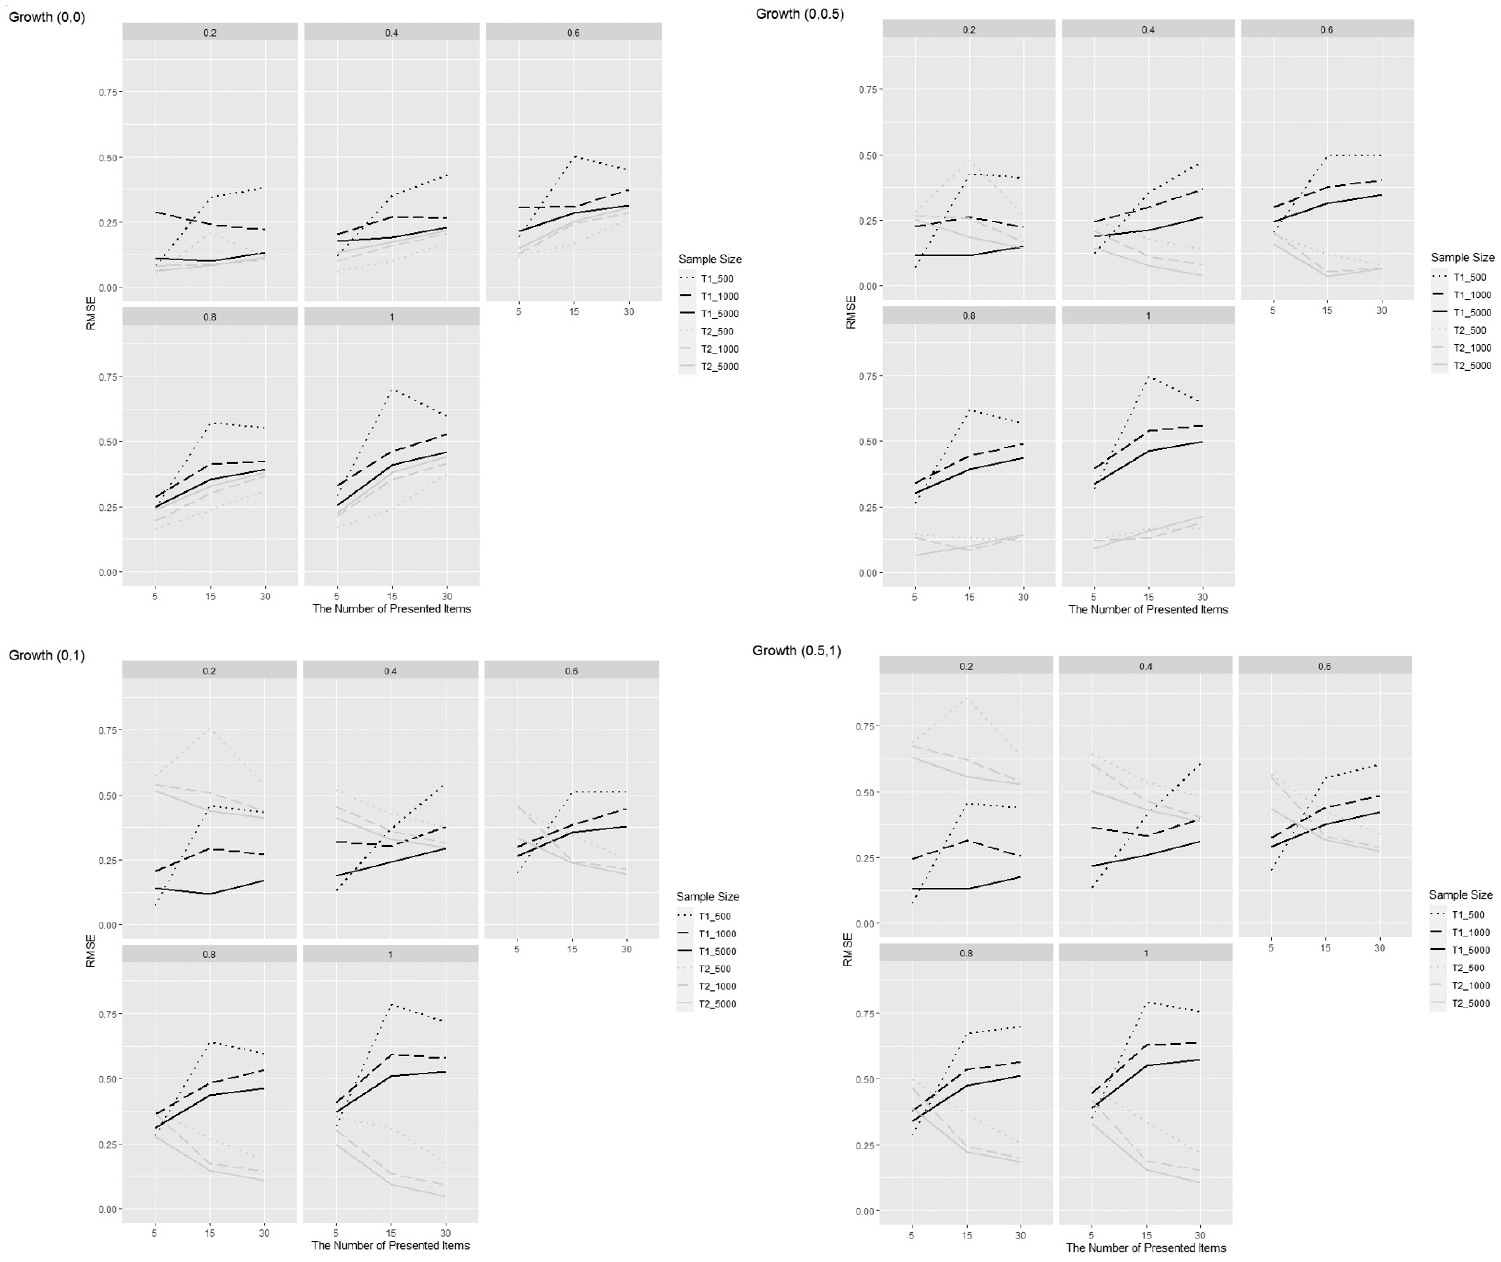
The Panel of Three-Way Comparison of the Change of Root Mean Square Error of the First- and Second-Attempt Ability Estimates When Controlling the Growth Ability.
Tables 3 and 4 showed that for the second-attempt ability estimates there was also a main effect on the bias and RMSE of the proportion of students making MA on items
ANOVA for Bias of the Second Ability Estimate.

Note. *p<0.05. ***p<0.001.
ANOVA for Root Mean Square Error of the Second Ability Estimate.

Note. *p<0.05. **p<0.01. ***p<0.001.
Regardless of the initial or the second-attempt ability estimates, Tables 1 to 4 showed that the impact of the proportion of students making MA neither depended on the sample size nor the number of presented items (see negligible Eta-squared effect sizes).
The magnitude of ability growth had small and even close-to-zero main effects on the bias and RMSE of the first-attempt ability estimates. However, it had statistically and practically significant main effects on the bias and RMSE of the second-attempt ability estimates
In addition, the magnitude of ability growth had an interaction effect with the number of presented items on the RMSE of the second ability estimates
The MNAR rate ranged from 0.24 to 0.43. Tables 1 to 4 showed that the MNAR rate had close-to-zero effects on the bias and RMSE regardless of the initial or the second-attempt ability estimates.
As a final finding of practical and statistical significance, there was an interaction between sample size and test length in their effects on the bias and RMSE of ability estimates, shown in Tables 1 and 2
Discussion
The purpose of this study was to evaluate the ability parameter recovery of the multidimensional sequential 2-PL IRT model when applied to unstructured MA item response data in VLEs. Results from the simulation study demonstrated that the multidimensional sequential 2-PL IRT model can recover ability parameters in some data contexts that contain mixed single and multiple attempts, various ability growth, and MNAR data. Importantly, even when the MNAR rate in the unstructured MA data reaches 42.9%, the multidimensional sequential 2-PL IRT model can recover ability parameters in a similar manner to when lower MNAR rate is present. However, some data conditions do result in increased bias and RMSE compared with other conditions.
We found that the recovery of ability parameters from the multidimensional 2-PL IRT model is affected by the proportion of students making MA on items, sample size, and the number of presented items. This is a positive finding because those factors are relatively manipulable in practice. When an unstructured MA data set contains a moderate proportion of students making multiple attempts on items (i.e., 40%–60%), the multidimensional sequential 2-PL IRT model has a strong recovery of the first-attempt and second-attempt ability parameters. Generally, if the unstructured MA data set has more than 60% of students making multiple attempts on items, the model can estimate the second-attempt ability with less bias to explore student ability growth with a known prior ability.
Based on our results, we recommend applying the multidimensional sequential 2-PL IRT model with a sample size of more than 1,000 and a test length of no less than 15 items to obtain acceptable estimates for both the first- and second-attempt ability. This study demonstrated that sample size and the number of presented items play nonignorable roles in obtaining unbiased estimates of ability. These findings related to the effects of sample sizes and test length on parameter recovery are redundant with traditional IRT research, but serve as a reminder that these features matter in both traditional measurement data as well as complex MA data from technology-enhanced platforms. For researchers and practitioners considering using a multidimensional sequential IRT model to estimate ability from the unstructured MA data in VLEs, we recommend paying close attention to sample sizes and the number of presented items.
Notably, we found that the magnitude of growth ability and the MNAR rate, which are not under the control of researchers and practitioners, have limited impacts, and in some cases no impact, on the recovery of ability parameters from the multidimensional sequential 2-PL IRT model. The only impact, at least based on our study outcomes, is that the model has a better performance in second-attempt ability recovery when the unstructured MA data set contains students with moderate growth ability and the rest without growth. But such an effect can be adjusted, to some extent, by setting the number of presented items to no less than 15. We also recommend setting a maximum or minimum amount of time between attempts to include in the data, as likely this can reduce variability in the magnitude of ability growth between attempts.
This study shows some promise for researchers and practitioners to consider using the multidimensional sequential 2-PL IRT model in their VLE data containing some MA to obtain unbiased ability estimates, assuming of course that the data are similar to our simulated conditions in which we found acceptable levels of bias and RMSE. In cases where the data conditions of a VLE are quite different from our studied conditions or align with our conditions in which bias and RMSE were larger, we encourage conducting a simulation like ours but with adjusted settings and comparing the model performance to other options for ability estimation. Indeed, we found our simulation very helpful in understanding how we can estimate ability in our data, and we believe other practitioners and researchers of VLE data may find the same benefits with adjusted simulations.
This discussion of data generation in our simulation study brings up recommendations for future studies. For every data set we generated in our simulation, we grouped students into two types, those who make a single attempt on items and those who make two attempts on items. Meanwhile, we related the number of multiple-attempt items to student ability and item difficulty. In other words, we simulated the amount of MA as a property of the interaction of students with particular items. This is supported by our operational data, which shows that students’ MA on items relates to their ability and item difficulty. However, others may want to consider simulating an environment in which MA is treated as a property of item-based features only (i.e., group items into those that have MA and those that do not) if that better represents their VLE unstructured MA item response data. Therefore, a recommendation for future studies is to evaluate the recovery ability of the multidimensional sequential 2-PL IRT model by simulating MA data based on item-level differences rather than person-item level interactions. Another recommendation for future studies is to consider the effect of more than two attempts on the model’s recovery of ability. Based on the characteristics of the operational data, we allowed students to attempt items up to twice. However, others may want to consider the ability recovery of the multidimensional sequential 2-PL IRT model with more than two attempts, such as in an “answer-until-correct” format. Such studies can enhance the target precision of the sequential IRT model application in broad VLEs with unstructured MA item response data.
Ultimately, our study results indicate acceptable recovery of ability estimates under some conditions, but not all conditions, from the multidimensional sequential 2-PL IRT model fit to unstructured MA data in our simulated VLE-like environments. Although the proportion of students making multiple attempts on items, the sample size, and the number of presented items have effects on the ability parameter recovery of the multidimensional sequential 2-PL IRT model, these factors are relatively manipulable in practice. For those factors that are not under the control of measurement practitioners and researchers (i.e., the magnitude of growth ability and the MNAR rate), they mostly do not affect the ability estimation from the multidimensional sequential 2-PL IRT model with unstructured MA data. Only the magnitude of growth ability has an effect on the second-attempt ability estimates, but it can be reduced by adjusting test length. Therefore, we conclude that the multidimensional sequential 2-PL IRT model poses much promise for evaluating student ability and change in ability in VLE systems.
Footnotes
Declaration of Conflicting Interests
The authors declared no potential conflicts of interest with respect to the research, authorship, and/or publication of this article.
Funding
The authors disclosed receipt of the following financial support for the research, authorship, and/or publication of this article: The research reported here was supported by the Institute of Education Sciences, U.S. Department of Education, through Grant R305C160004 to the University of Florida. The opinions expressed are those of the authors and do not represent views of the Institute or the U.S. Department of Education.