
Abstract
A Monte Carlo study was conducted to compare the performance of a level-specific (LS) fit evaluation with that of a simultaneous (SI) fit evaluation in multilevel confirmatory factor analysis (MCFA) models. We extended previous studies by examining their performance under MCFA models with different factor structures across levels. In addition, various design factors and interaction effects between intraclass correlation (ICC) and misspecification type (MT) on their performance were considered. The simulation results demonstrate that the LS outperformed the SI in detecting model misspecification at the between-group level even in the MCFA model with different factor structures across levels. Especially, the performance of LS fit indices depended on the ICC, group size (GS), or MT. More specifically, the results are as follows. First, the performance of root mean square error of approximation (RMSEA) was more promising in detecting misspecified between-level models as GS or ICC increased. Second, the effect of ICC on the performance of comparative fit index (CFI) or Tucker–Lewis index (TLI) depended on the MT. Third, the performance of standardized root mean squared residual (SRMR) improved as ICC increased and this pattern was more clear in structure misspecification than in measurement misspecification. Finally, the summary and implications of the results are discussed.
Keywords
Introduction
The multilevel structural equation model (MSEM) is extensively used in behavioral and social sciences. For MSEM, the model fit evaluation is a primary methodological issue because model fit determines the degree to which a model matches the observed data. Many researchers have used the traditional simultaneous (SI) approach to evaluate MSEM. However, the SI approach has a potential limitation in locating the source of lack of model fit, especially at the between-group level (Ryu, 2014; Ryu & West, 2009). Because sample size is generally much larger at the within-group level than at the between-group level, the model fit is expected to be dominated by the within-group level. Therefore, the SI approach may not be sensitive to model misspecification at the between-group level.
To overcome limitations of the SI approach, the level-specific (LS) approaches, such as the partially saturated model (PS; Ryu & West, 2009) and the segregating (SEG) methods (Yuan & Bentler, 2007), have been proposed. The PS method uses a saturated model to obtain chi-square test statistics and the degrees of freedom for each level. On the contrary, the SEG method requires the following two steps: (a) computing estimates of unrestricted covariance matrices at each level, and (b) conducting single-level covariance structure analysis with estimated covariance matrices as input data. Comparing the two methods, the PS method was reported to be superior to the SEG method in detecting model misspecification (Jung, 2016; Ryu & West, 2009). In addition, it was reported to perform better than the SEG method in terms of convergence rates and Type 1 error rates regardless of the sample size (Ryu & West, 2009).
Recently, Yuan et al. (2016) proposed equivalence testing with adjusted fit indexes that does not depend on conventional model fit criteria. The equivalence testing was considered as a way to advance the inferential nature of structural equation model (SEM) as a confirmatory tool. Some simulation studies (Finch & French, 2018; Marcoulides & Yuan, 2017) showed that the equivalence testing provides additional information for assessing fit of SEM. Marcoulides and Yuan (2020) attempted to extend the equivalence testing to MSEM, but they only used empirical data under very limited conditions (e.g., a group size [GS] of 31). That is, more studies are needed to consider equivalence testing as a better alternative to the PS method. Moreover, in Marcoulides and Yuan’s (2020) study, the PS method and equivalence testing had an almost similar performance for detecting the model misspecification at each level. In addition, a recent study (Rappaport et al., 2020) also recommended the use of the PS method by providing the implementation of an algorithm within open source SEM package OpenMx for PS method users. Therefore, this study would focus on the PS method (Ryu & West, 2009) to calculate LS fit indices.
Since Ryu and West (2009) proposed the LS approach based on PS method, many previous simulation studies have compared the performance of the SI approach with that of the LS approach (Boulton, 2011; Jung, 2016; Ryu & West, 2009). Most studies demonstrated that the LS approach was superior to the SI approach for detecting model misspecification, particularly at the between-group level. In addition, the previous studies have examined the LS approach’s performance under certain design factors, such as intraclass correlation (ICC) and sample size. In particular, the ICC condition was considered as the most important factor for the performance of LS approach. Boulton (2011) and Hsu et al. (2016) verified the performance of the LS approach by diversifying the ICC conditions. Boulton (2011) considered a small ICC value less than .30 and Hsu et al. (2016) considered ICCs with a range of .09 to .50. They showed that the LS approach’s performance was more promising in detecting misspecified between-level models as ICC increased. On the contrary, the effect of sample size on its performance was inconsistent. Boulton (2011) demonstrated that LS approach’s performance improved as the sample size decreased, whereas others (Hsu et al., 2015; Ryu & West, 2009) reported that the effect of sample size on its performance was trivial. Some researchers proposed to consider unbalanced GSs (Boulton, 2011; Hsu et al., 2015; Schermelleh-Engel et al., 2014). However, only Jung (2016) considered unbalanced GSs and she showed that convergence rates were generally higher with equal GSs rather than with unequal GSs. Therefore, LS’s performance across different group balance (GB) conditions needs to be more tested, in that most of the empirical studies tended to use not only the balanced groups but also the unbalanced ones.
Hsu et al. (2015) investigated the performance of the fit indices across misspecification type (MT) conditions. He showed that the performance of Standardized Root Mean Squared Residuals for between-group level
Despite the richness of previous simulation studies, the form of the analysis model is still limited. Previous studies have focused on two-factor multilevel confirmatory factor analysis (MCFA) models only with an identical factor structure across levels (Boulton, 2011; Hsu et al., 2015, 2016; Jung, 2016; Ryu, 2011; Ryu & West, 2009; Schermelleh-Engel et al., 2014). Jung (2016) tried to test the three-factor MCFA model, but it was a model with the same factor structure across levels. The models used in previous studies could be inappropriate when the meaning and conceptual attributes of the construct differ depending on the analysis level (Dunn et al., 2015; Huang & Cornell, 2016). They may be challenging to use in real data settings. In this context, Ryu and West (2009) suggested that it is necessary to investigate the performance of LS approach in MCFA models with different factor structures across levels. In this sense, this study would extend the performance of the LS approach to MCFA models with different factor structures across levels.
In summary, this study would focus on the performance of the LS fit evaluation for MCFA models with different types of factor structures across levels. To this end, five design factors would be examined: ICC, number of groups (NG), GS, GB, and MT. Taken together, the results of this study would fill the literature gap by considering different types of MCFA models and additional design factors. Furthermore, we would aim to present useful guidelines on using the LS approach under various conditions for empirical researchers. The following research questions are addressed using a simulation study:
Literature Review
Multilevel Structural Equation Model
For MSEM, the group is a simple random sample from a population, whereas the individual is a simple random sample within each group. Therefore, the individual observations are not completely independent. Assuming that the data are collected from
Let


or

where
On the contrary, we used the maximum likelihood estimation (MLE), which estimates the parameters of a probability distribution by maximizing likelihood functions. It supposes that the observed variables follow the multivariate normality. Specifically, the two assumptions are as follows (Liang & Bentler, 2004; Ryu & West, 2009). The first assumption is that the observed variables consist of two uncorrelated random components: within-group variation
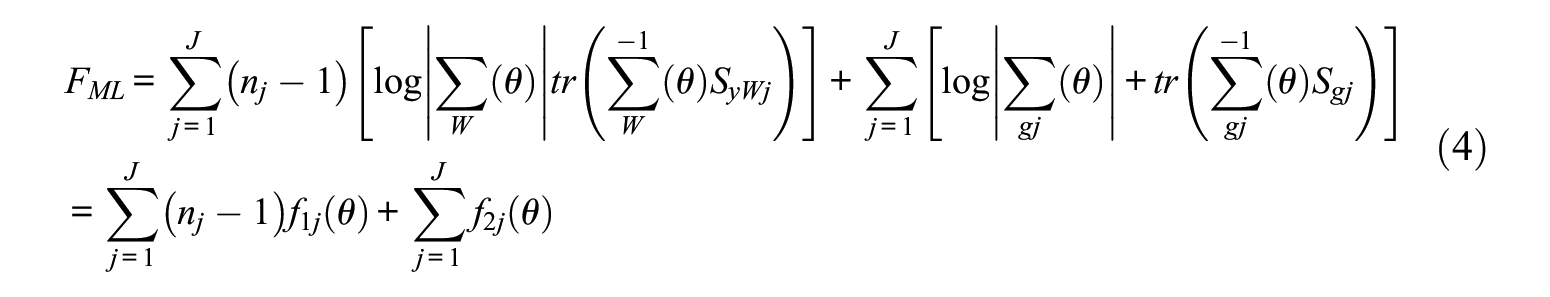
where
Simultaneous Fit Evaluation
The SI approach is based on the model fit evaluation for single-level SEM. It evaluates the model fit for the entire model across both levels. The following paragraphs describe the formulation and features of chi-square test statistics and fit indices (i.e.,
Simultaneous Chi-Square Test Statistics
The chi-square test is a statistical method for evaluating the goodness of fit for a model. When the observed variables follow a multivariate normal distribution and the sample size is large enough, the product of
Simultaneous RMSEA

where
Simultaneous CFI

where
Simultaneous TLI
The

where
Level-Specific Fit Evaluation
To deal with LS approach, the PS (Ryu & West, 2009), the SEG (Yuan & Bentler, 2007), and equivalence testing (Marcoulides & Yuan, 2020) methods have been proposed. We focus on the PS method to calculate the LS fit indices because the good performance of PS method has been continuously verified and many researchers have recommended the PS method for evaluating model fit in MSEM (Jung, 2016; Marcoulides & Yuan, 2020; Rappaport et al., 2020; Ryu & West, 2009). In the PS method, the model fit statistics are calculated using a saturated model that freely estimates the correlation between all observed variables. The following paragraphs describe the formulation and features for the chi-square test statistics and fit indices derived from the PS method. Note that the subscripts PS_B and PS_W are used to present LS statistics derived from the PS method.
Level-Specific Chi-Square Statistics
The value of

where

Similarly, the misspecified within-level models can be determined. The hypothesized model is set at the within-group level and the saturated model is set at the between-group level. The value of


Level-Specific RMSEAs
With

where

Level-Specific CFIs

The calculation method for

Level-Specific TLIs
TLI can evaluate the model fit by comparing the independence model with the hypothesized model. The methods for calculating


Level-Specific Standardized Root Mean Squared Residuals (SRMRs)
SRMR is an alternative LS fit index produced by Mplus, namely, SRMR for the within-group level (

where
Previous Simulation Studies
Many studies demonstrated the effectiveness of the LS approach to detect the lack of model fit at any level in MSEM, whereas the SI approach failed to detect misspecified between-level models (Boulton, 2011; Hsu et al., 2015, 2016; Jung, 2016; Ryu, 2011; Ryu & West, 2009; Schermelleh-Engel et al., 2014; Sessoms, 2019). These studies examined the performance of LS and SI fit evaluation relating to the analysis model and design factor. The details are as follows.
Studies have considered several analysis models such as a two-factor MCFA model (Boulton, 2011; Hsu et al., 2015, 2016; Ryu & West, 2009), a three-factor MCFA model (Jung, 2016), and a moderating effect model (Schermelleh-Engel et al., 2014). Although the performance of the LS approach was verified in several analysis models, they focused only on the MCFA model with an identical factor structure across levels. However, the conceptual characteristics of a construct might have different meanings depending on the level of analysis in real data. Specifically, the collective variables, such as positive values (Huang & Cornell, 2016), school environment (Dunn et al., 2015), or collective efficacy (Huang et al., 2015) are reported to have different interpretations across levels. For example, Huang and Cornell (2016) found that positive values have a two-factor structure at the within-group level and a one-factor structure at the between-group level. Therefore, the performance of the LS approach for MCFA models with different factor structures across levels should be investigated.
On the contrary, previous studies have considered various design factors such as ICC, sample size, GB, and MT. First, ICC was related to the performance of LS fit indices (Boulton, 2011; Hsu et al., 2016; Jung, 2016). LS fit indices were more promising for detecting misspecified between-level models with an increase in ICC (Boulton, 2011; Hsu et al., 2016). However, the ICC factor did not affect the performance of SI fit indices.
Second, several studies have considered sample size as a design factor (Boulton, 2011; Hsu et al., 2015; Ryu & West, 2009). Boulton (2011) adopted five levels of sample size ranging from 1,000 to 2,500 and showed that the performance of both SI and LS approaches commonly improved with a decrease in sample size. In addition, if the NG increased with a specific GS (i.e., 20), the performance of both SI and LS fit indices improved. However, other studies found that their performance did not change across different sample sizes (Hsu et al., 2015; Ryu & West, 2009). These studies focused only on large sample sizes (e.g., 2,500–50,000); therefore, more various sample sizes should be investigated.
Third, GB might be related to the performance of SI and LS approaches (Hox et al., 2010; Hox & Maas, 2001; Jung, 2016). Based on reported results, convergence rates were generally higher with equal GSs, rather than with unequal GSs (Hox & Maas, 2001; Jung, 2016). Furthermore, the chi-square model test was more accurate in the balanced group than in the unbalanced group for an MCFA model (Hox & Maas, 2001). Recently, Jung (2016) showed that the performance of SI and LS fit indices was consistent regardless of GB. However, she examined only a limited GB condition with small GSs (e.g., 5–75). Thus, further research is needed to explore the effect of GB with more various GSs.
Finally, MT, which is defined as MM or SM, affected the performance of LS and SI approaches. According to Hsu et al. (2015) and Jung (2016), the SI fit indices were more sensitive to MM than to SM. On the contrary, SRMRs were more sensitive to SM than to MM at either levels. Moreover, the effect of ICC on the LS’s performance might depend on MT. Boulton (2011) showed that the performance of
Method
Data Generation
Data were generated based on the three types of population models (Figure 1). Model1 was set as a two-factor MCFA model with the same factor structure across levels, whereas Model2A was set as a two-factor structure at the within-group level and a one-factor structure at the between-group level. In addition, Model2B was set as a one-factor structure at the within-group level and a two-factor structure at the between-group level. All three models have six observed variables (
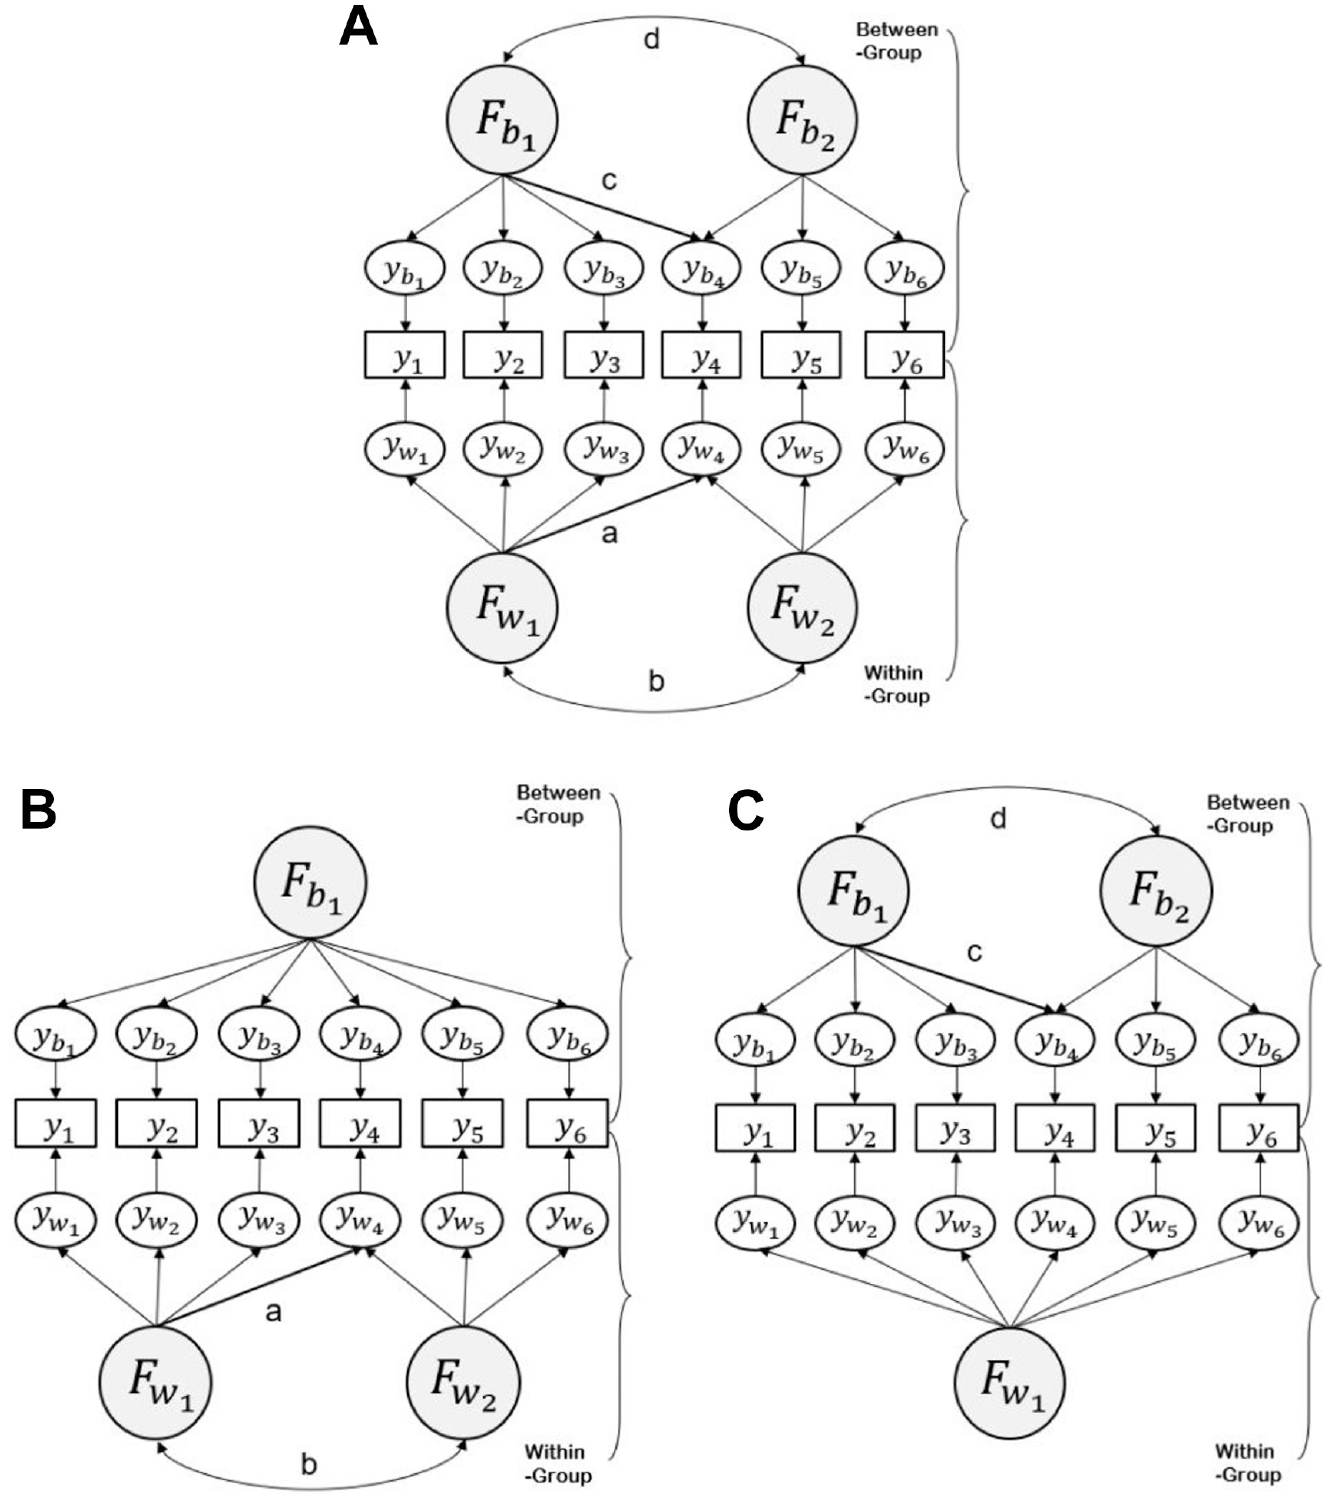
(A) Model1, (B) Model2A, and (C) Model2B
Table 1 provides all population parameter values for the three models. For three ICC levels (.10, .20, and .30), factor loadings and residual variances were manipulated. Residual variances were uncorrelated. In addition, the factor variance was fixed at 1, and covariance was fixed at .5 for all cases, based on previous studies (Hsu et al., 2015; Jung, 2016; Sessoms, 2019).
Population Parameter Values for Data Generation
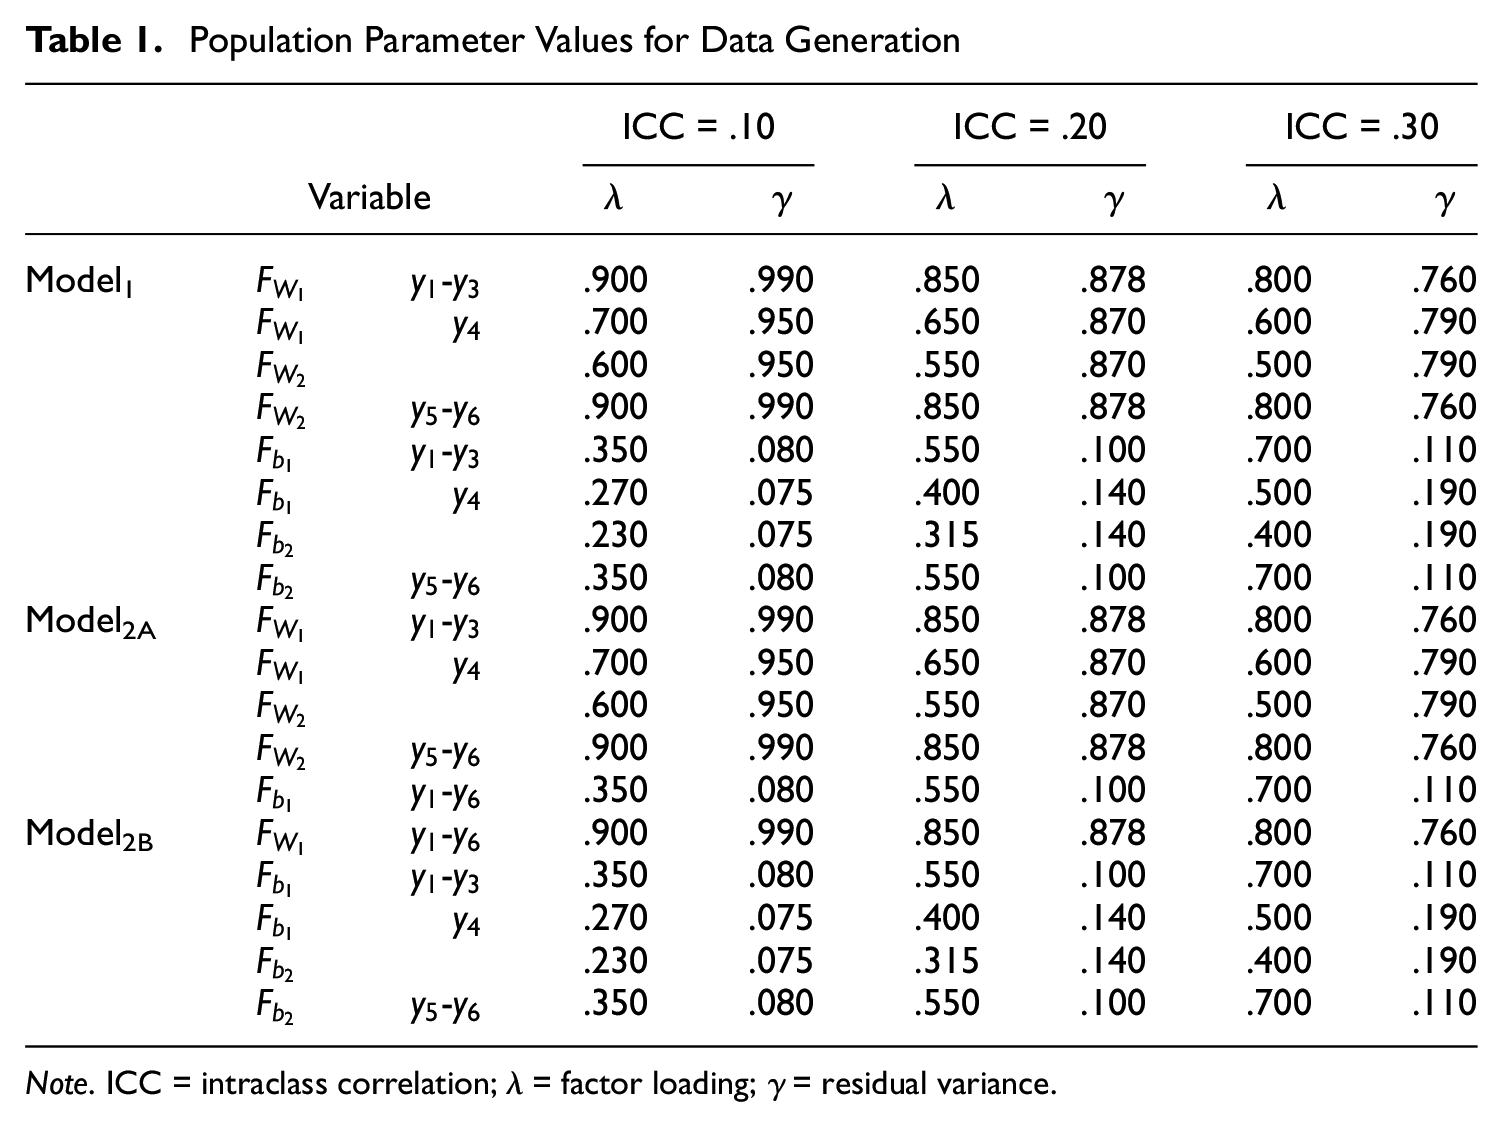
Note. ICC = intraclass correlation;
For data generation, a Monte Carlo simulation was conducted using Mplus 8.3 (Muthén & Muthén, 1998–2019), with TYPE = TWOLEVEL. Data sets were generated based on multivariate normality in all simulations and ML estimation was used.
Design Factors
Five design factors for simulations were considered: ICC, NG, GS, GB, and MT. The details of simulation conditions are described below.
Intraclass Correlation
A low ICC was related to low convergence rates and biased parameter estimates (Hox & Maas, 2001; Hsu et al., 2016). In a review of multilevel factor analysis applications (Kim et al., 2016), the ICC ranged from .13 to .34 on average. Previous simulation studies considered the ICC levels ranging from .05 to .30 (Boulton, 2011; Hsu et al., 2016; Sessoms, 2019). In some cases, ICC was set at .50 (Hsu et al., 2016; Ryu & West, 2009) but this ICC level might be unusual for real data. This study assumed that ICC was generally less than .20 and rarely exceeds .30 in real data (Hox & Maas, 2001; Lüdtke et al., 2008). Accordingly, three levels of ICC (i.e., .10, .20, and .30) were chosen for this study.
Number of Groups
NG was related to the stability of the model estimation and convergence rates at the between-group level (Meuleman & Billiet, 2009; Wu et al., 2017). It has been reported that at least 40 to 60 groups are required for accurate estimation (Hox, 2010; Meuleman & Billiet, 2009). In previous simulation studies, NG generally ranged from 20 to 1,000 (Jung, 2016; Sessoms, 2019), however, NG = 1,000 is unrealistic for practical studies. Furthermore, the model estimation at the between-group level is sufficiently stable when NG exceeds 100 (Hox & Maas, 2001); therefore, we adopted three values of NG (20, 50, and 100).
Group Size
Although GS did not affect the accuracy of the parameter estimates and standard errors (Hox & Maas, 2001), it could be a critical design factor in detecting the misfit of MSEM (Jung, 2016). In Kim et al.’s (2016) literature review of multilevel factor analysis applications, median and mean of GS were found to be about 19 and 26, respectively. Most of previous simulation studies have examined GS in the range of 10 to 60 (Hsu et al., 2015; Wu & Kwok, 2012), while a large GS (GS = 100; Hsu et al., 2016; Ryu & West, 2009) was also considered. This study adopted three GSs (20, 50, and 100) based on previous studies.
Group Balance
The convergence rates were higher in the balanced case with equal GS than in the unbalanced case with unequal GS (Hox & Maas, 2001; Jung, 2016). In previous studies, the unbalanced case was manipulated with half the group being a small GS and the other half being a large GS (Hox & Maas, 2001; Jung, 2016). Furthermore, a large GS was set to be 3 times larger than the small GS to maximize the unbalanced effect (Hox et al., 2010; Hox & Maas, 2001). In line with previous studies, we manipulated the unbalanced conditions to (10, 30), (25, 75), and (50, 150).
Misspecification Type
This study manipulated a, b, c, and d values to the misspecified models (Figure 1). For Model1 (Figure 1A), the five types of models were compared: (a) the correct model, which was the same as the population model; (b) MM in within-level model only (a = 0 in Figure 1A); (c) SM in within-level model only (b = 0 in Figure 1A); (d) MM in the between-level model only (c = 0 in Figure 1A); and (e) SM in the between-level model only (d = 0 in Figure 1A). For Model2A, three types of models, such as a correct model in addition to MM or SM in within-level model only (a = 0 or b = 0 in Figure 1B) were explored. On the contrary, Model2B considered a correct model and also MM or SM in between-level model only (c = 0 or d = 0 in Figure 1C).
Analysis
As stated above, 270 conditions (3
The performance of SI and LS approaches was evaluated by reporting convergence rates,
If needed, two-way analysis of variance (ANOVA) was conducted to verify the interaction effects between ICC and MT on the performance of LS fit indices. The dependent variable was fit index mean differences (i.e., fit index of correct model minus that of misspecified model; Jung, 2016). That is, a large absolute value of the dependent variable was taken to indicate that a fit index was more promising for detecting misspecified between-level models (i.e., better performance of fit index). In addition, the total sum of squares (SOS) of each fit index demonstrated variability of the corresponding fit index under a specific condition. Furthermore, the partial eta-squared measure (
Results
The performance of SI and LS approaches was evaluated for convergence rates, chi-square test statistics, and fit indices for all the analysis models. The pattern of results was generally consistent across three models (i.e., Model1, Model2A, and Model2B), so we focused on common results for those models. Details of results were presented in Lee (2020).
Convergence Rates
For all the three correct models, the LS approach had generally higher convergence rates than the SI approach. The convergence rates of the SI approach were positively associated with NG or GS for the three models, while those of the LS approach were close to 1 across all design factors.
Nonconvergence occurred when the NG was 20 for all three models, consistent with the results of Jung (2016). Therefore, a total of 500 replications without convergence problems were included in the analyses. Note that the convergence rates of misspecified models were lower than those of the correct models.
Means of χ2 Test Statistics and Fit Indices
Correct Model
For all correct models, the means of all
The results showed that both SI and LS fit indices indicated a good model fit across all design factors. Specifically, the means of
Misspecified Within-Level Model (Model1, Model2A)
For all types of misspecified models, the means of
Tables 2 and 3 show the performance of SI and LS fit indices across design factors. No difference exists between SI and LS fit indices for detecting the misspecified within-level model. That is, both SI and LS fit indices were sensitive to the model misspecification at the within-group level. In addition, the results showed that the performance of SI and LS fit indices was generally consistent across all design factors. However, their performance was more sensitive (i.e., more likely to detect the misspecified within-level model) to SM than to MM.
Means of SI and LS Fit Indices in Misspecified Within-Level Model (Model1)
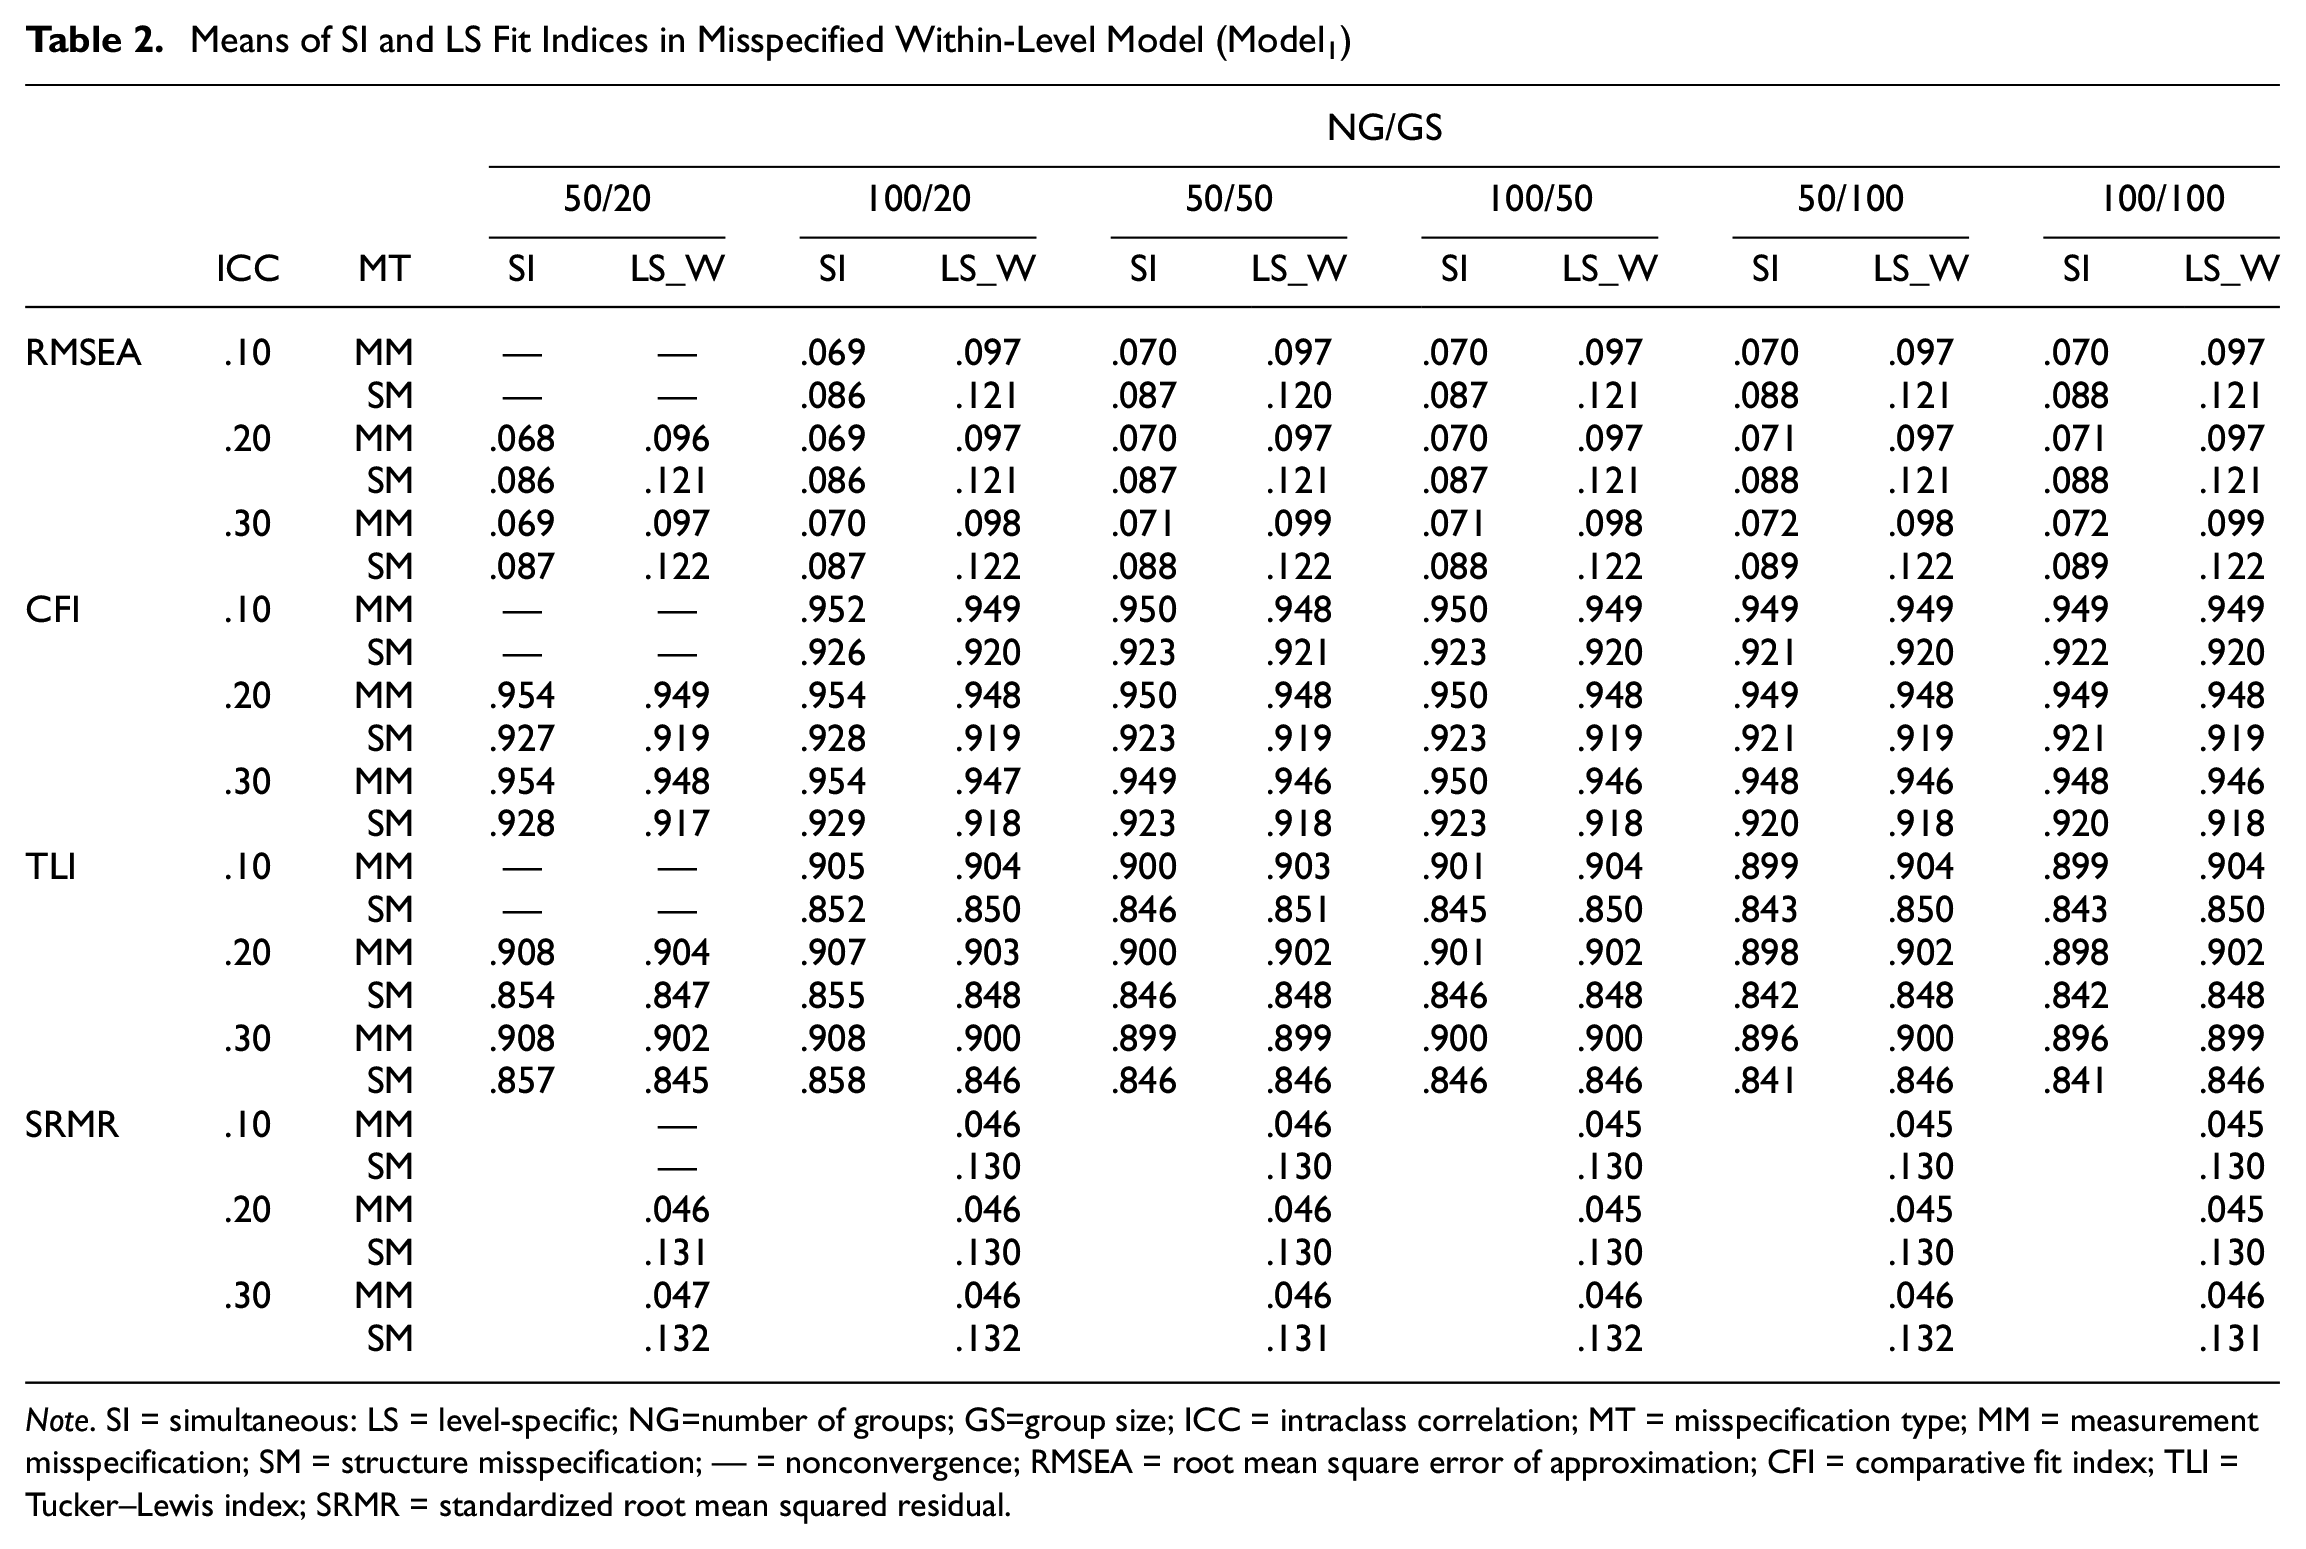
Note. SI = simultaneous: LS = level-specific; NG=number of groups; GS=group size; ICC = intraclass correlation; MT = misspecification type; MM = measurement misspecification; SM = structure misspecification; — = nonconvergence; RMSEA = root mean square error of approximation; CFI = comparative fit index; TLI = Tucker–Lewis index; SRMR = standardized root mean squared residual.
Means of SI and LS Fit Indices in Misspecified Within-Level Model (Model2A)

Note. SI = simultaneous: LS = level-specific; NG=number of groups; GS=group size; ICC = intraclass correlation; MT = misspecification type; MM = measurement misspecification; SM = structure misspecification; RMSEA = root mean square error of approximation; CFI = comparative fit index; TLI = Tucker–Lewis index; SRMR = standardized root mean squared residual.
Misspecified Between-Level Model (Model1, Model2B)
For the misspecified models, the means of
Tables 4 and 5 show the performance of SI and LS fit indices across design factors. The results showed that all design factors did not affect the performance of SI fit indices, but affected that of LS fit indices. Specifically, their performance depended on the types of MT. For MM, the means of
Means of SI and LS Fit Indices in Misspecified Between-Level Model (Model1)
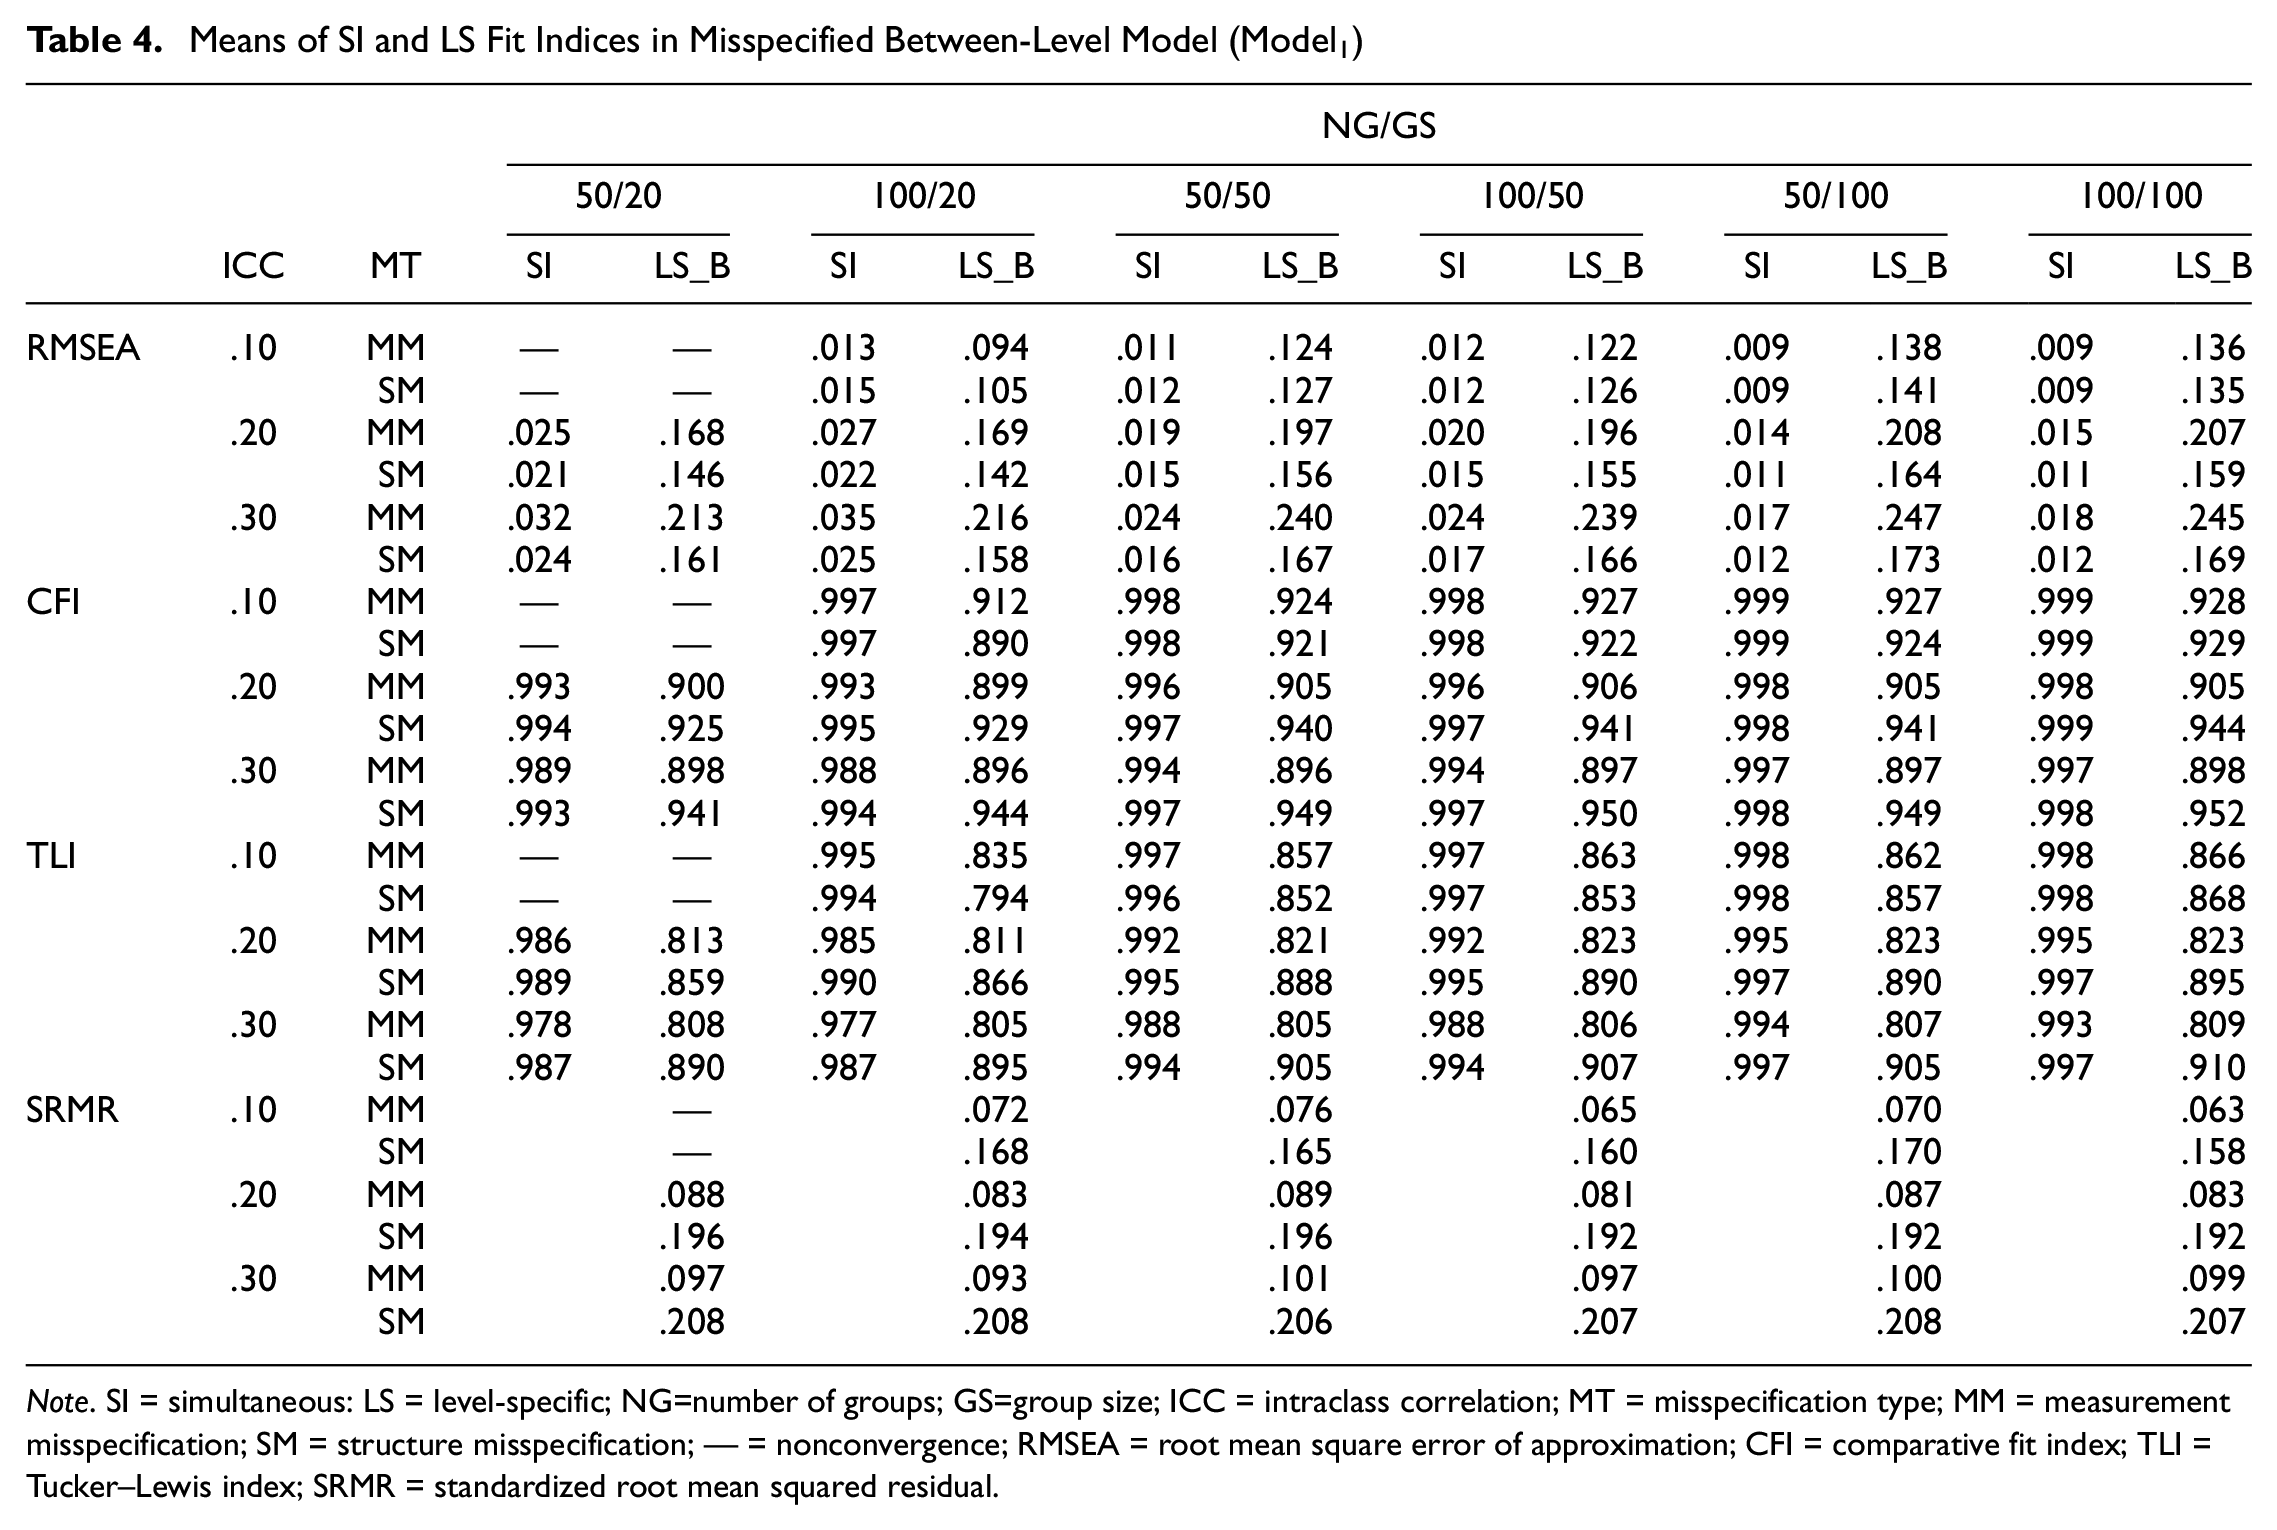
Note. SI = simultaneous: LS = level-specific; NG=number of groups; GS=group size; ICC = intraclass correlation; MT = misspecification type; MM = measurement misspecification; SM = structure misspecification; — = nonconvergence; RMSEA = root mean square error of approximation; CFI = comparative fit index; TLI = Tucker–Lewis index; SRMR = standardized root mean squared residual.
Means of SI and LS Fit Indices in Misspecified Between-Level Model (Model2B)
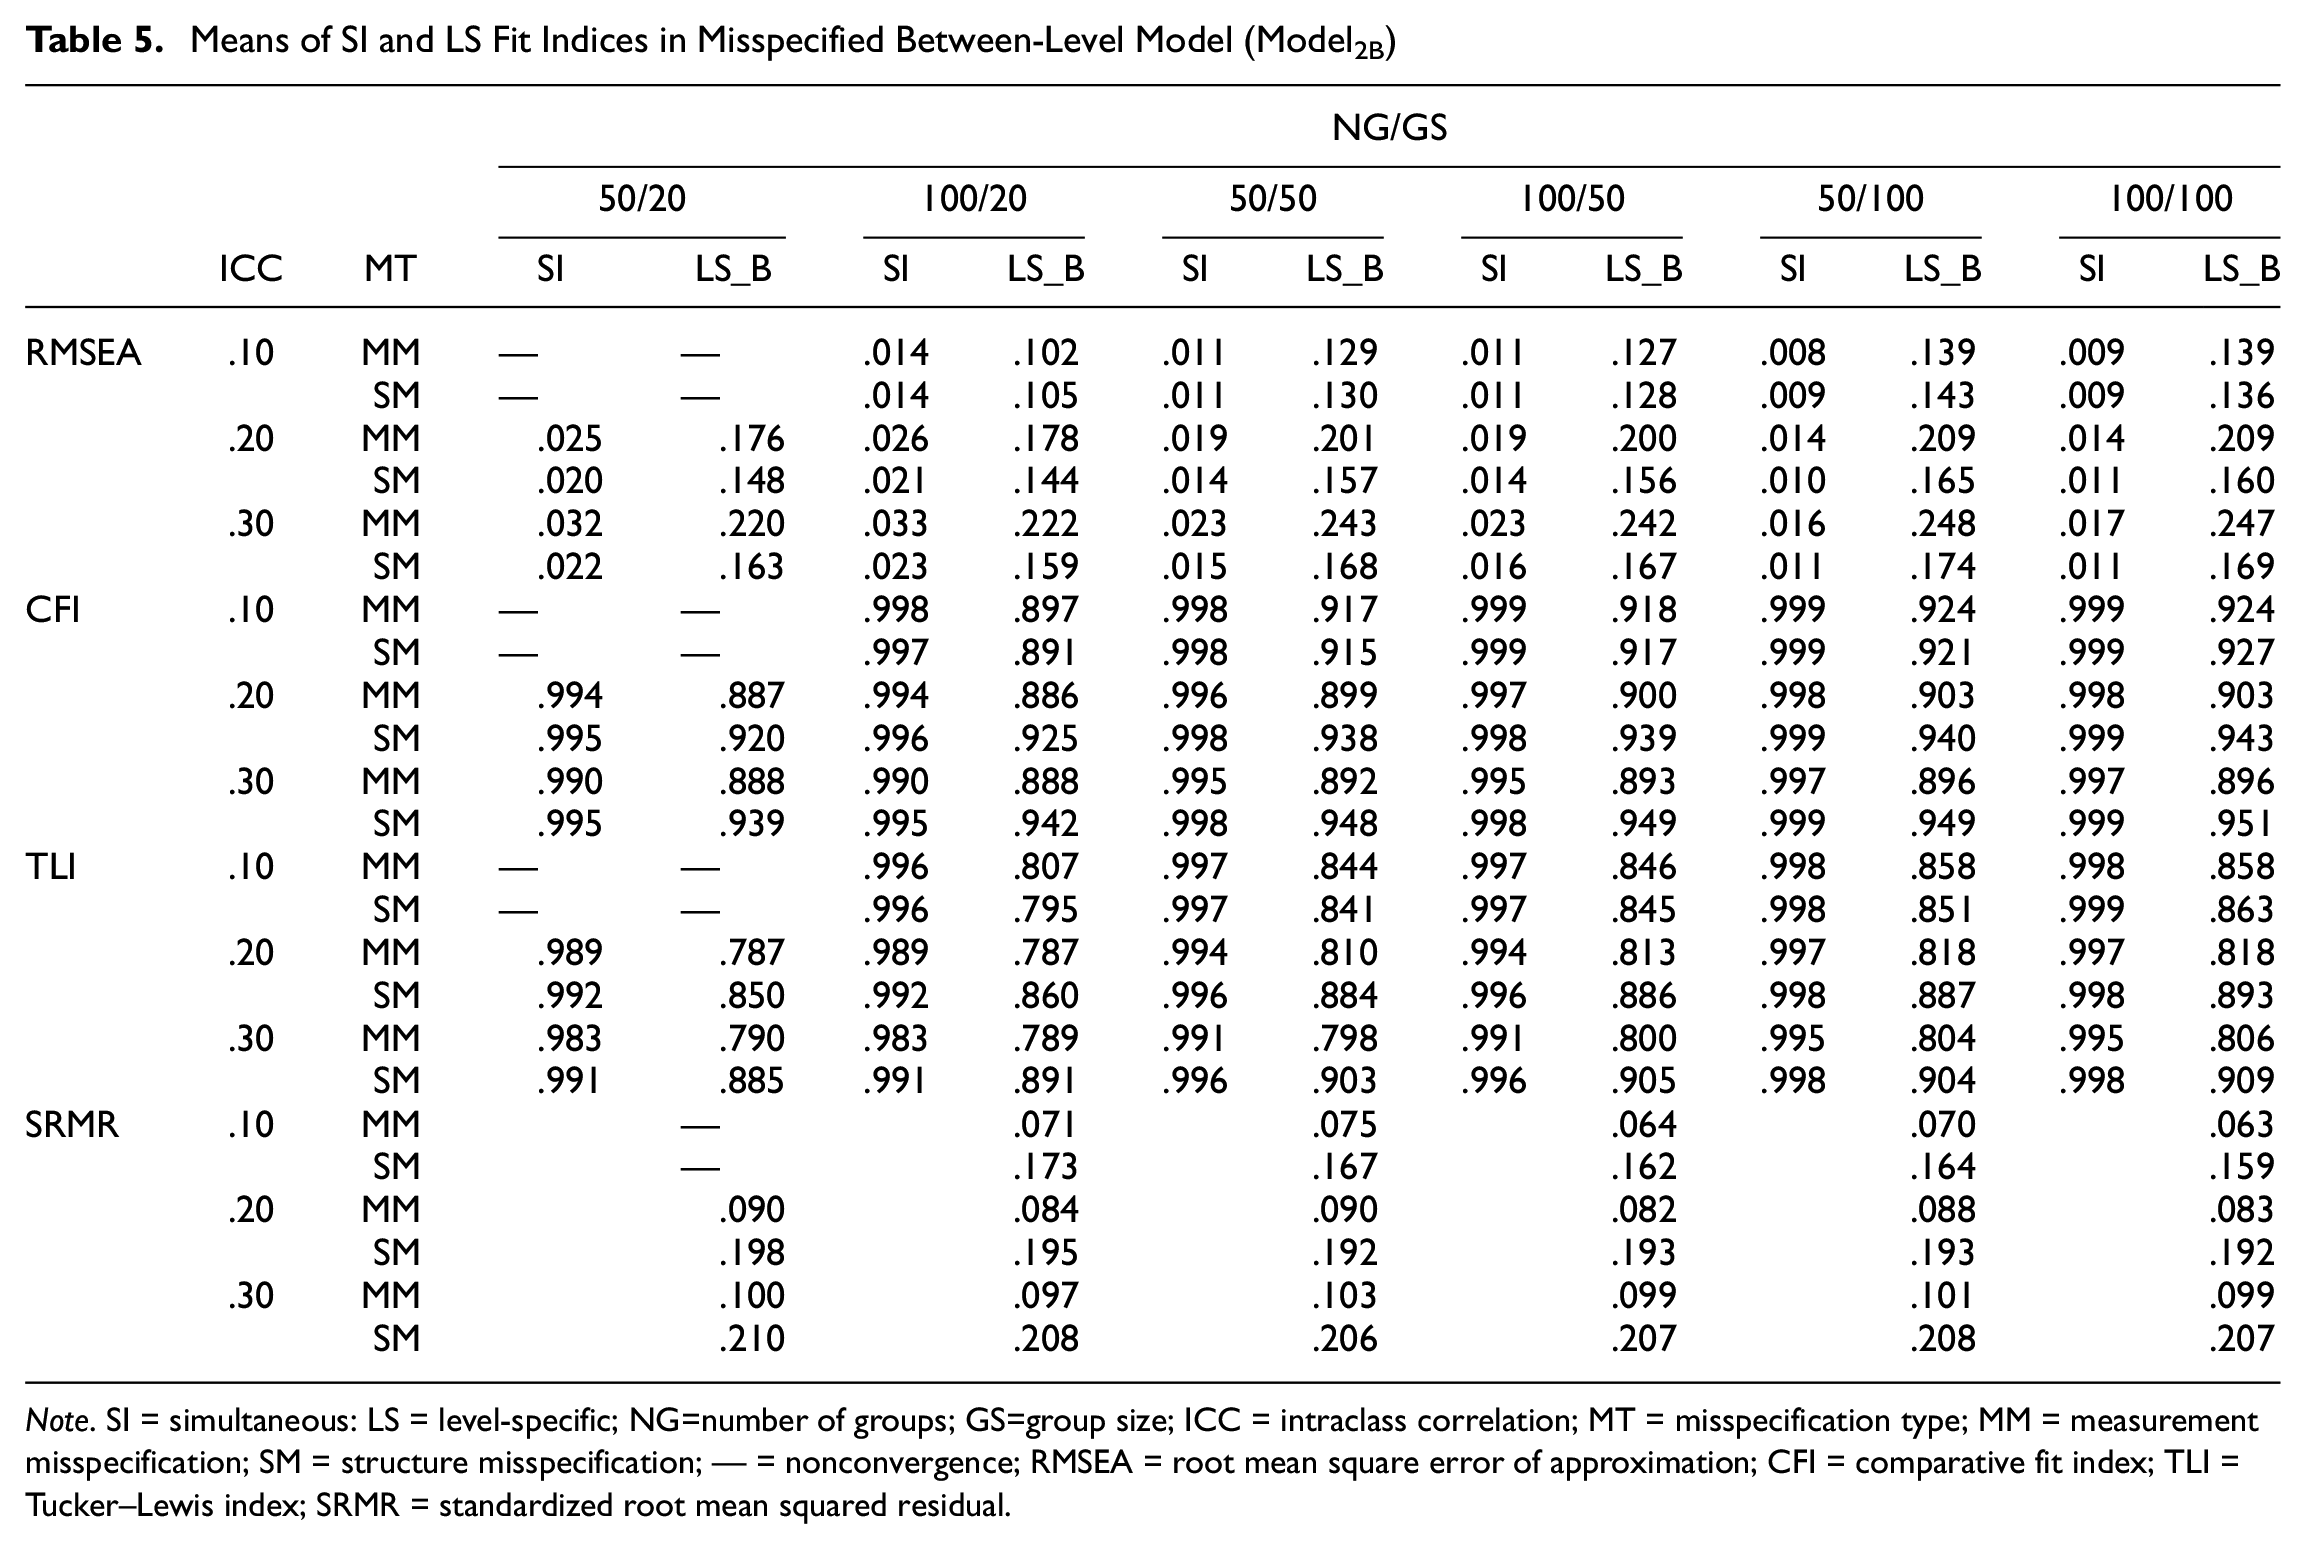
Note. SI = simultaneous: LS = level-specific; NG=number of groups; GS=group size; ICC = intraclass correlation; MT = misspecification type; MM = measurement misspecification; SM = structure misspecification; — = nonconvergence; RMSEA = root mean square error of approximation; CFI = comparative fit index; TLI = Tucker–Lewis index; SRMR = standardized root mean squared residual.
As per the aforementioned discussion, ICC and MT influenced the performance of LS fit indices. We additionally conducted two-way ANOVA to verify the interaction effects of ICC and MT on the performance of LS fit indices (i.e., fit index of correct model minus that of misspecified model: Δ
Figure 2 shows the patterns of the interaction effects for the performance of LS fit indices. The results for each fit index are as follows. First, when ICC was equal to .10, the performance of
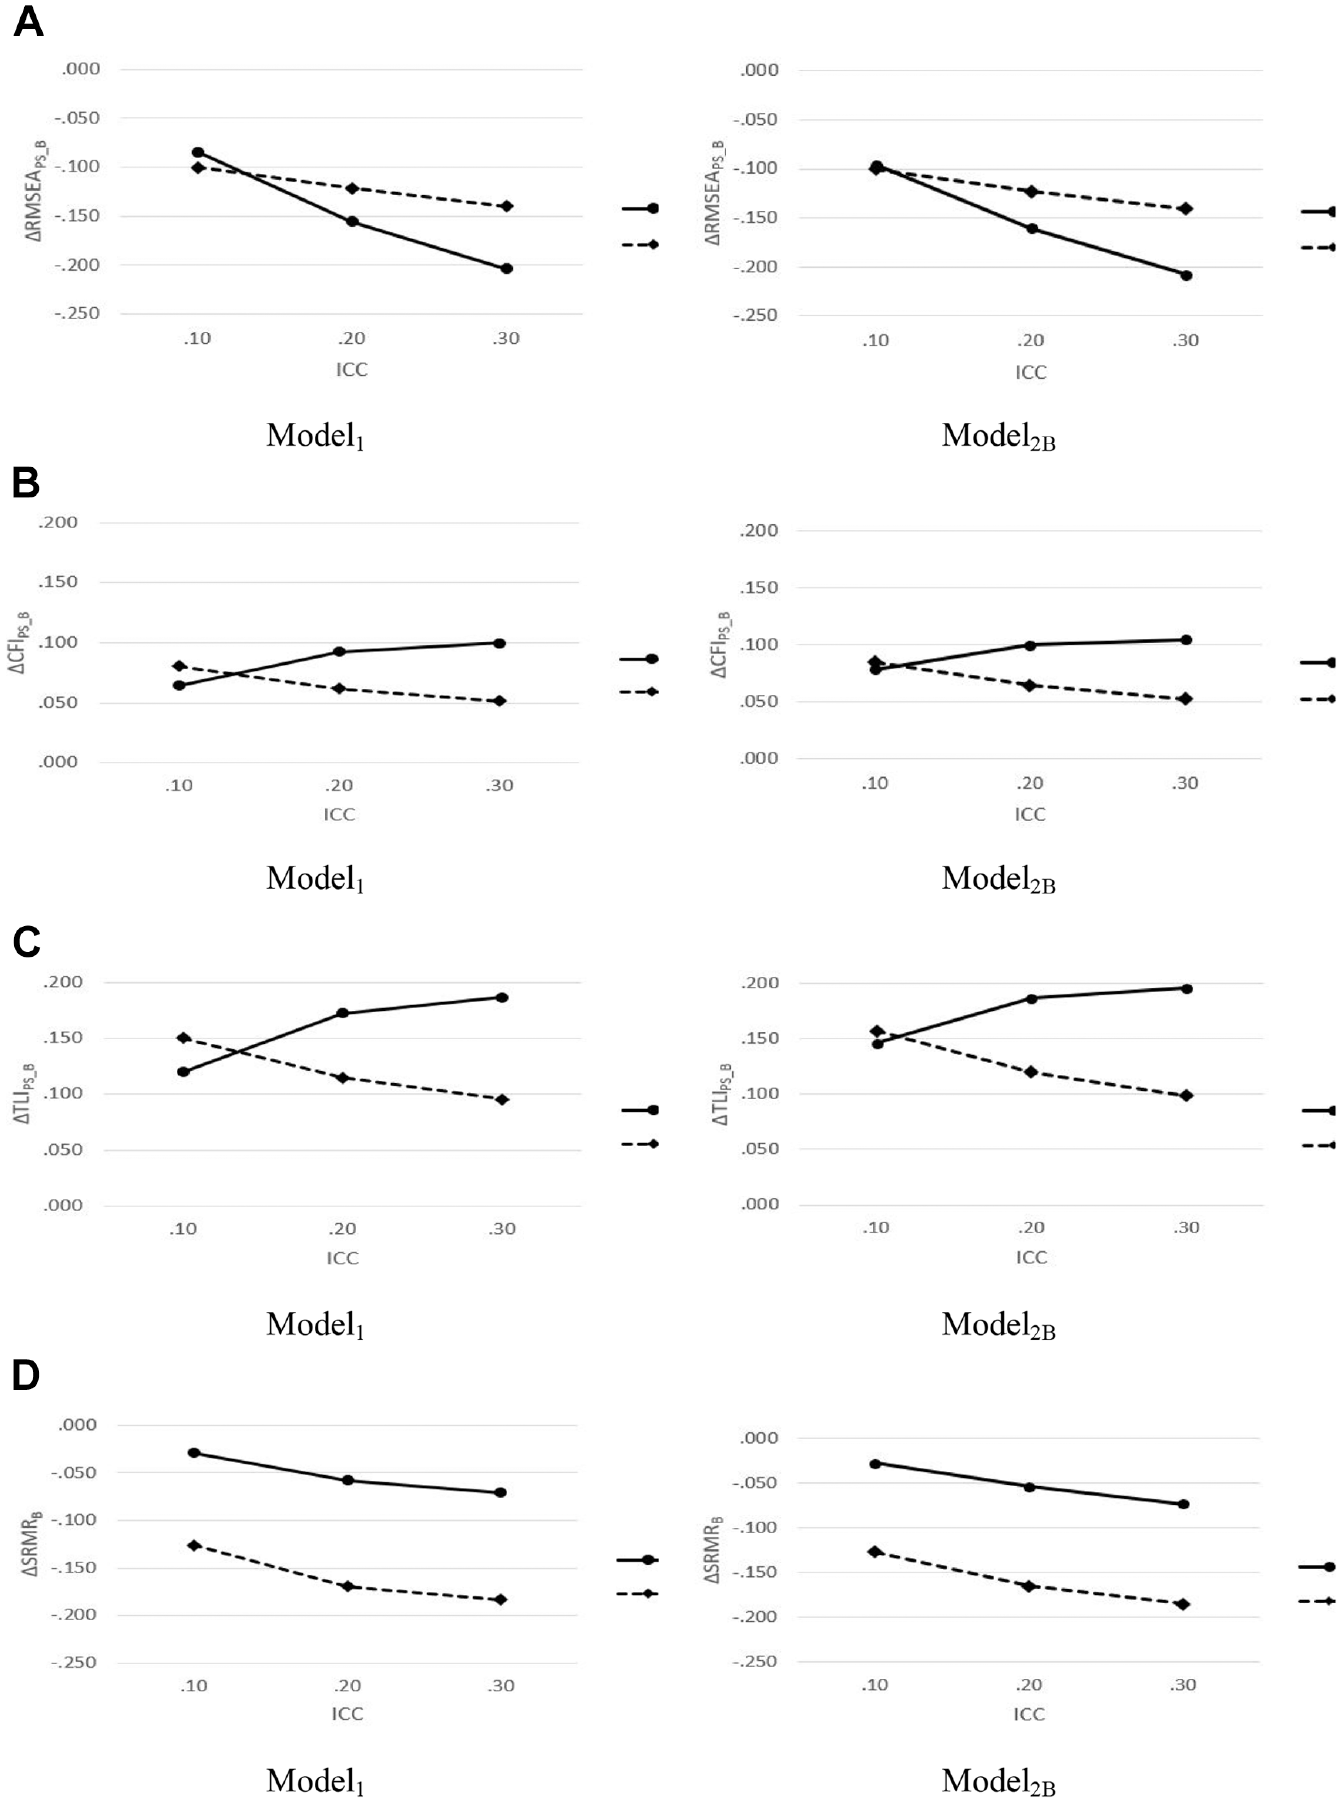
The Effect of ICC * MT on the Performance of LS Fit Indices for Misspecified Between-Level Model:
Discussion
Summary
This study examined the performance of SI and LS fit indices across various design factors, such as ICC, NG, GS, GB, and MT for three different MCFA models (Model1, Model2A, and Model2B). The results for this study were as follows. First, the results showed that the convergence rates of the SI approach generally increased with an increase in ICC or GS, whereas those of the LS approach were close to 1 across all design factors for correct models. This result is consistent with Jung (2016) who considered the three-factor MCFA model with the same factor structure across levels. Accordingly, previous findings were replicated for MCFA models with different factor structures across levels by this study.
Second, both SI and LS fit indices were sensitive to detecting misspecified within-level models, and design factors rarely affected their performance. This finding is consistent with previous studies where both SI and LS fit indices performed equally well at the within-group level for MCFA models regardless of design factors such as ICC, sample size, and GB (Hsu et al., 2015, 2016; Jung, 2016; Ryu & West, 2009). This study confirmed that the performance of SI and LS fit indices was consistently excellent for detecting misspecified within-level models even in the MCFA model with different factor structures across levels.
Third,
Fourth,
Fifth,
Finally, the effect of GS, NG, or GB on the performance of LS fit indices was comparatively trivial. Especially, the impact of GS or NG on it was unclear, partly consistent with those of previous studies (Hsu et al., 2015; Jung, 2016; Ryu & West, 2009) that the effect of the sample size on the performance of LS fit indices did not appear for MCFA model. Based on the findings from previous studies, and also this study, the performance of LS fit indices seems to be generally consistent across the sample sizes exceeding 1,000. In addition, the effect of GB on the performance of LS fit indices was relatively trivial, which is consistent with Jung’s (2016) study. This study focused only on the ratio of 1 to 3 (3 times) in the unbalanced group by considering practical issues. To generalize the results of this study, more various unbalanced conditions for GB factor should be explored as a further study.
In summary, the results showed that (a) the LS fit indices could detect the lack of model fit at any level for MCFA models with different factor structures across levels, (b) the performance of
Implications and Recommendations
The results of this study have several implications. First, this study verified the performance of the LS approach in the MCFA model even with different factor structures across levels. Previous studies (Boulton, 2011; Hsu et al., 2015, 2016; Jung, 2016; Ryu, 2011; Ryu & West, 2009; Schermelleh-Engel et al., 2014; Sessoms, 2019) have only demonstrated its performance using the MCFA model with an identical factor structure across levels. Therefore, we recommend using the LS approach to empirical researchers who might consider the MCFA model with different factor structures as well as identical ones across levels.
Second, this study fills the literature gap by considering additional design factors such as GB and MT that were not sufficiently examined in previous studies. We found that the effect of GB on the performance of LS fit indices was trivial, whereas the effect of MT was verified in the MCFA model with different factor structures across levels. This would provide useful information to researchers in that no previous studies have been interested in the effect of MT on LS fit indices except for
Finally, this study demonstrated the interaction effect between ICC and MT on the performance of the LS fit indices. This is partly consistent with Boulton’s (2011) finding that the effect of ICC on the performance of the LS fit indices increased as the misspecification severity (i.e., manipulating a value of the between-group latent factor correlation) increased. In addition, the inconsistent performance of
Based on the results of this study, recommendations for empirical researchers using MCFA models are as follows. First, either LS or SI fit indices for the model fit evaluation are recommended for studies focusing on the within-level model. Both fit indices tend to perform well in detecting the misspecified within-level models regardless of any ICC, NG, GS, and GB levels. Second, researchers are highly encouraged to use LS fit indices (
Limitations and Future Directions
Future directions based on the limitations of this study are as follows. First, this study considered a limited number of levels for some design factors such as NG and GB. For example, we only adopted two levels of NG (50 or 100) and only explored a ratio of 1 to 3 for the unbalanced group (the large GS was set to be 3 times larger than the small GS). To generalize the results, additional scenarios using different NG or GB levels are required in future studies. Second, this study considered a simple MCFA model with a limited number of latent factors. This type of model might not be reasonable with real data, although it is frequently used for simulation research. To generalize these findings, further research could consider different models (e.g., structural models) suitable for practical research. Third, this study did not consider a multivariate normality condition as a design factor. However, the assumption of multivariate normality might not always be met in real data. Therefore, future research on the performance of the LS approach under the violation of multivariate normality is needed. Fourth, this study confirmed the interaction effect between ICC and MT on the performance of LS fit indices. However, to generalize the results, these findings should be reverified under various models and conditions. Furthermore, additional MT conditions (e.g., ignoring the nonzero residual correlations or fitting a single-factor model to two-factor data) should be considered. Finally, future research comparing the performance of PS method and equivalence testing is needed. Marcoulides and Yuan (2020) attempted to show the performance of equivalence testing for MSEM, but they only used empirical data. Therefore, the performance of this method needs to be verified using simulation data.
Footnotes
Declaration of Conflicting Interests
The authors declared no potential conflicts of interest with respect to the research, authorship, and/or publication of this article.
Funding
The authors received no financial support for the research, authorship, and/or publication of this article.