
Abstract
The recommendation of using “multiple measures” is common in policy guidelines for gifted and talented assessment systems. However, the integration of multiple test scores in a system that uses cut-scores requires choosing between different methods of combining quantitative scores. Past research has indicated that OR combination rules (where any one score must meet the cutoff) have been shown to identify the largest number of students compared with AND (where all scores must meet cutoff) and AVERAGE (where the numerical average is used) rules. We extended this work to a real data set (Grades K to 5 from the CogAT 7 national standardization data) and found that the different combination rules led to differences in the number and diversity of students identified. However, we found these diversity differences were due mainly to the identified pool size and not to the effects of the particular combination rule. This has important implications for practice.
A man with a watch knows what time it is. A man with two watches is never sure. —Bloch (2003, p. 36)
Ask any gifted program coordinator about best practices in identifying gifted and talented students for instructional services and the recommendation to use “multiple measures” will certainly come up. For identifying a student’s instructional needs, the multiple measures recommendation refers to the use of more than one assessment result in making instructional plans for the student. The measures can include ability test scores, achievement scores, portfolios, student self-assessments, or teacher- or parent-ratings of gifted characteristics. The National Association for Gifted Children (NAGC, 2008) as well as many other professional organizations and researchers make strong recommendations for the use of multiple measures, especially when high stakes, test-based decisions are being made, such as classroom assignment (American Educational Research Association, American Psychological Association, & National Council on Measurement in Education, 2014; McClain & Pfeiffer, 2012). This practice is also widely used by states and districts, with over half of the states surveyed by the most recent State of the States reporting the required use of multiple criteria (NAGC, 2015). It is also an area that Plucker and Callahan (2014) argue requires greater study to promote diversity and other desired outcomes for these types of educational programs.
What is discussed less often by practitioners and research literature is how to make decisions about gifted and talented services for students using those multiple pieces of information. Many coordinators and teachers are not sure what to make of “conflicting” results from different measures and are uncertain of how to make valid interpretations from multiple measures. This tension arising from multiple measures is reflected in this quote from an NAGC (2008) position statement: While NAGC advocates for the use of multiple assessments in the identification of gifted students, NAGC also believes that combining disparate data from multiple assessments must be done in such a way as to identify not only those students who are in immediate need of instruction beyond the regular curriculum, but also those students who display the potential for high-level learning beyond the regular curriculum. (p. 2)
This statement reflects the importance of not using multiple measures simply to be more certain of a student’s placement but also to gain better understanding of their current and future instructional needs. The belief that multiple measures should be used to increase program diversity in terms of instructional needs is strongly implied in this statement. The need to serve diverse instructional needs is also critical in serving groups of students whom researchers have found to be less likely to show current advanced instructional needs and more likely to have potential for advanced learning if given sufficient support and encouragement (e.g., underrepresented minorities and English Learners; Borland, 2004; Pfeiffer, 2002; Plucker, Burroughs, & Song, 2010). The NAGC statement also implies that the use of general ability or total scores is less preferred than methods that allow students to qualify for services with high scores on one or more narrower measures.
This is further supported by portions of the NAGC Pre-K to Grade 12 Gifted Education Programming Standards (NAGC, 2010), which have a number of programming standards related to the use of assessments in identification. Most notably, Standard 2.1 on identification states that the assessments used must allow students “to demonstrate diverse characteristics and behaviors that are associated with giftedness.” Such a standard strongly suggests a preference for programs that select based on an “OR” combination rule. These combination rules are discussed next.
Making Sense of Multiple Scores
The recommendation to use multiple measures for identification is well established in the literature (Worrell, 2009). It is also reasonably well established in state policy (NAGC, 2015). Often, these multiple criteria include more than one assessment of ability or achievement that have to be aggregated in some way to make a placement decision (NAGC, 2015; see also Lohman, 2012b; McClain & Pfeiffer, 2012).
Research has generally focused on three general mechanisms or combination rules for incorporating multiple measures. Both Lohman’s (2012b) recommendations as well as McBee, Peters, and Waterman’s (2014) research has focused on these three combination rules: AND, AVERAGE, and OR rules. Figure 1 shows an adaptation of Lohman’s (2012b) representation of the three rules. First, there is the AND combination rule (McBee et al.’s conjunctive model) where students must meet the required cut-score on each of the administered measures. Note that, depending on the type of measures used, these cut-scores may vary (i.e., the cut-score for a teacher rating would be determined separately from the cut-score set for ability test scores). Lohman notes that this is the most restrictive use of multiple measures as it limits the identified sample only to students who excel in all of the focal areas, with no opportunity to compensate for low scores in one area with higher scores in another. This model will result in the most homogeneous students in terms of abilities and current skills.
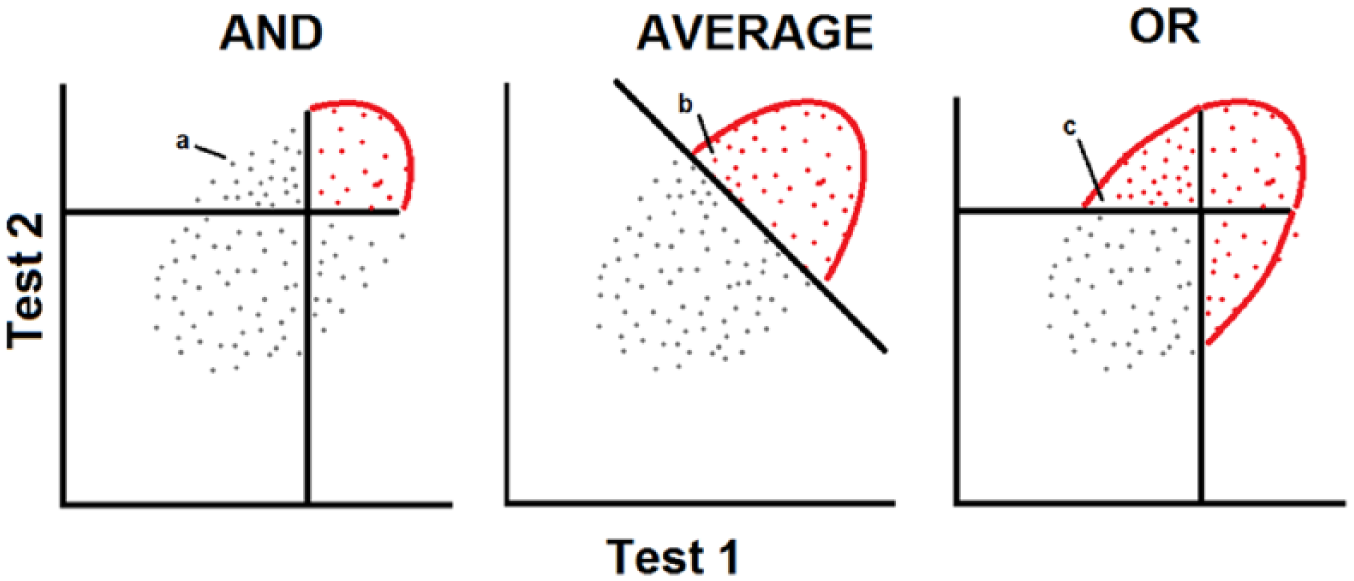
Three combination rules. a = students with relatively high scores on Test 2 who are not identified. b = same students now identified. c = students with relatively low Test 1 scores but high Test 2 scores who are identified.
In a numerical analysis of this issue, McBee et al. (2014) confirmed that the AND rule resulted in overall smaller numbers of students selected for the program, which was not surprising as students had to have consistently high scores on 2 to 4 assessments to qualify. Importantly, they also found that as the correlation between measures increased, the program size increased, because higher correlations meant more consistency in students’ scores across the tests that were being combined. However, although the identified pool increased in size, the heterogeneity of the students in terms of strengths and instructional needs would not increase because of the choice to use highly related (possibly redundant) measures.
In contrast to the AND rule, the AVERAGE rule (McBee et al.’s, 2014, “Mean” or compensatory model) allows students to excel more in one area and compensate for somewhat lower scores in another. As can be seen in Figure 1, this results in a larger pool of students in need of instructional differentiation and allows students to show stronger skills on one measure and somewhat weaker skills on other measures as long as their overall performance is reasonably high. This larger pool of identified students may require different instructional strategies to shore up relative weaknesses. The AVERAGE rule was not as directly affected by test correlations or the number of scores provided because scores are averaged before the cut-score is applied.
The OR rule (McBee et al.’s, 2014, disjunctive model) is most notable for the heterogeneity of skills it allows in identified students. Because there is no requirement that a student have overall high scores, a student might be identified for services while having a relative strength on only one measure (see Figure 1 Note c). This results in the largest and most heterogeneous (in terms of ability) identified pool of students. The heterogeneity of identified students has important implications for instructional differentiation, which will be addressed below.
In summary, McBee et al.’s (2014) numerical calculations demonstrated that the combination rule influenced the identified pool of students. When the OR rule was used, where a high score on any of 2 to 4 assessments would qualify a student for placement, McBee et al. found that the overall program size was much larger, especially when correlations between measures were low (so that it was quite likely that different students would have high scores on different measures).
In looking at the heterogeneity of ability among selected students (i.e., the range of abilities that resulted from selection), the OR rule resulted in the most variability in scores in McBee et al. (2014), followed by the AVERAGE rule, then the AND rule, which resulted in the least variability. The mean scores followed a similar trend, where the AND rule resulted in the highest average scores, and the OR rule resulted in the lowest average scores. Both of these results would have implications for the type of instruction needed and differentiation required by selected students.
One key aspect of identification that this research study did not consider was the demographic diversity of students selected under the various methods. One goal of the present study is to replicate their findings regarding combination rules in a real data set based on student test data. Another was to extend their findings to the issue of program diversity in terms of student demographics (gender, race, ethnicity, socioeconomic status, and English learner [EL] status).
Combination Rules and Student Diversity
Existing research shows that combination rules can have substantial impacts on the diversity of skills and abilities among students identified for services. What is unknown is what effect combination rules have on the diversity of identified students in terms of their demographic background, particularly students from historically underrepresented groups such as African American students, EL students, and students from lower socioeconomic status background.
Whether combination rules will affect program diversity in terms of student background characteristics is a source of some debate but little empirical evidence. Lohman (2012b) has previously argued that multiple measures policies can be a mechanism for promoting diversity in gifted and talented services in terms of gender, race, ethnicity, socioeconomic status, EL status, and more. In one example of empirical support for this claim, Heath (2002) took advantage of a natural experiment when a new identification pathway was added in a Georgia school district. Prior to this new policy, students were required to achieve a 99 National Percentile Rank (NPR) on the Cognitive Abilities Test (CogAT) composite score (an AVERAGE of the three battery scores) to be automatically identified. Under the new policy, the percentile rank on CogAT was relaxed to a 96 NPR on any one CogAT Battery, a substantial change from an AVERAGE combination rule with a stringent cutoff to an OR combination rule with a somewhat relaxed cutoff score. In addition to CogAT, students were assessed with teacher rating scales for motivation (using Scales for Rating the Behavioral Characteristics of Superior Students; Renzulli et al., 2002), creativity (Torrance Tests of Creative Thinking; Torrance, 1998), and achievement on the Iowa Test of Basic Skills (Hoover, Dunbar, & Frisbie, 2001). Students not automatically identified by the 99 NPR on the CogAT (Pathway 1—automatic eligibility) now had the option of qualifying by meeting cut-scores on any three of the four measures available (ability, teacher ratings, creativity, or achievement; Pathway 2—multiple criterion eligibility; see also Krisel & Cowan, 1997). This policy is not as straightforward as those considered in previous work (e.g., Lohman, 2012b), or even this study, but the three-out-of-four rule is similar to the AVERAGE rule because it allows one area of weakness to be offset by three strong scores.
Importantly, Heath (2002) considered the diversity of students identified by the two pathways. She found that the inclusion of the multiple criterion pathway somewhat decreased the overrepresentation of White students in the program, but did not achieve representation close to the population’s distribution of races and ethnicities. The representation of African American and Hispanic students did increase marginally (from 7.8% to 13.1% and from 0.4% to 1.0%, respectively). More relevant to this study, she compared the proportion of students who met eligibility requirements under each of the two pathways. She found that African American students were more likely to meet the eligibility requirements under the multiple criterion pathways (11% for multiple vs. 6% for automatic/ability criterion).
Another important detail of the new regulations in this Georgia system was that identification would result in services in any areas of identified need. Along with Heath’s (2002) observation that more students overall were identified by the new system, this indicates that changes in identification precipitated changes to the services offered. Any discussion of changes to identification practices must consider the implications for the range of services that must be offered.
Along with this limited empirical data, there is a substantial area of research arguing that talents and abilities may be manifested differently, or developed differently, across different cultural backgrounds (Castellano, 2003a). Research developing culture-specific instruments, such as the Hispanic Bilingual Gifted Screening Instrument (Fultz, Lara-Alecio, Irby, & Tong, 2013), suggests the belief that students should be allowed to demonstrate their need for differentiated instruction in different ways. Such a claim strongly lends itself to an OR combination rule where the student is not required to demonstrate traditional abilities as well as nontraditional abilities, which would be required by an AND combination rule. Similar research on differences in abilities has been put forth for ELs in general (Castellano, 2003a; Cohen, 1988), Latino students (Castellano, 2003b; Irby & Lara-Alecio, 1996), African American students (Dickson, 2003), as well as students with spatial talents who are believed to struggle more with traditional school domains (Lohman, 1994; Sword & Director, 2000). Each of these lines of research suggest that programs must have flexibility in how abilities are displayed and how programs should seek to develop abilities among diverse student populations.
The use of multiple indicators with an “OR” or “AVERAGE” rule rather than an “AND” rule should be preferred by those that argue that students from different cultural backgrounds manifest talents in different ways. A selection method that requires exceptional performance in both traditional and nontraditional domains (particularly true for AND combinations) will not have the desired effects on diversity intended by the use of nontraditional measures. That said, this effect of combination rule on diversity has not been fully explored empirically. The goal of this article is to demonstrate the effects that different combination rules will have on the diversity of identified students. We address this gap with a nationally representative sample that can provide insight into the diversity implications of combination rules.
Current Study
In this article, we begin by considering a common situation: that a school program has administered one or more assessments that result in multiple ability or achievement test scores for students. They then want to apply a cut-score (often mandated by district or state policies) to make a curricular placement decision. We will discuss how these test scores may be combined and the impact of those combination procedures on program diversity and composition (size, ability homogeneity, etc.). Three combination rules will be considered: (a) the AND rule, where the student must meet the prescribed cut-score on all assessments; (b) the OR rule, where students may meet the cut-score on any one assessment; and (c) the AVERAGE rule, where the student’s average across available assessments must meet the cut-score (Lohman, 2012b). Additional research will be needed to explore how different types of evidence (including teacher evaluations or portfolio assessments) that are not treated as quantitative test scores might be integrated to make programming decisions. The following research questions were addressed:
Method
The CogAT Form 7 consists of three separate batteries measuring verbal, quantitative, and nonverbal reasoning (Lohman, 2011). The three batteries correspond to the three subfactors that define general fluid reasoning (Gf): sequential reasoning (best exemplified by verbal tasks), inductive reasoning (best exemplified by figural tasks), and quantitative reasoning (Carroll, 1993; Lohman, 2012a). CogAT shows strong convergent validity with other measures of cognitive ability (Lohman, 2003a, 2003b). Reliability for battery level scores is uniformly high across grade levels and battery (r = .80-.93). The composite score, an average of the three battery scores, has reliability estimates of .91 to .96.
Each battery consists of three subtests that use different item formats. Battery-level (averaging across the three subtests) and Total (averaging across batteries) scores are reported. National Age Percentile Ranks were used to identify students meeting ability cutoffs for the different combination rules. These ranks are based on age group (defined by quarter years). Results were also reported on the Standard Age Scale (an IQ-like scale with M = 100, SD = 16).
Sample
The data for this study were collected as part of the standardization and norms development for CogAT Form 7 (Lohman, 2011). 1 The program used a nationally stratified sampling method to collect a diverse sample of students that was proportional to their representation in the school population. This included proportional representation of Hispanic students, African American students, EL students, and students receiving free or reduced-price lunch (FRL; a common proxy for socioeconomic status). For the purposes of this study, we used unweighted data from Grades K to 5 for the results. These are the grades where CogAT scores are most commonly used for the types of decisions explored in this study. See Table 1 for descriptive statistics for this sample.
Cross-Battery Descriptive Statistics.

Note. Total sample N = 36,889.
All mean differences significant (p < .05).
Analysis
As described in the results section, different combination rules were applied to the Grades K to 5 standardization data using SPSS syntax to select different samples according to test performance. We used a 90th National Age Percentile Rank as our initial cut-score with each combination rule. The AND combination rule requires that the student receive a score of at least the 90th percentile on all three CogAT batteries. The OR rule required that students receive a score of at least the 90th percentile on at least one of the three CogAT batteries. Finally, the AVERAGE rule required that the student’s average performance across the three batteries fell above the 90th percentile. This average is equivalent to the Total Score or the VQN (verbal, quantitative, and nonverbal reasoning) composite score reported by the CogAT program.
After each combination rule was applied, we then computed the percentages and other descriptive statistics that were used to address each research question. To assess the importance of differences in these statistics, we calculated confidence intervals based on standard errors for each descriptive statistic of interest. We considered differences of 1.96 standard errors (a 95% confidence interval) to be substantial differences. Smaller differences were considered nonsignificant and trivial.
To address the final research question, we were interested in what effect the identified pool had on the diversity, independent of the number of students identified by each selection rule. Therefore, we adjusted the percentile ranks used for each combination rule until roughly equal numbers were identified by each combination rule. This resulted in three identified pools of approximately the same size. The same procedures for descriptive statistics and standard errors were then used to consider the characteristics of the identified pools.
Results
We applied the three selection mechanisms to the standardization data to collect the comparative data needed to address our research questions. Our first observation of the results was that the OR rule, not unexpectedly, resulted in the largest number of students identified as eligible for services. In fact, the number of students identified with this rule was nearly 10 times larger than the group identified by AND, the most restrictive rule.
Table 1 and Figure 2 show descriptive statistics for each decision rule (averaging across the three batteries to identify the total SAS for each student). The means and medians confirmed our expectations that the OR rule resulted in the lowest average and median scores and the most variability (in terms of standard deviations) in total score (equivalent to the average SAS across batteries). This is because students can have any profile of scores as long as one is above the cutoff and it will not influence eligibility. As a result, the OR group was almost one full IQ standard deviation (15 points) lower in ability than the AND group. AVERAGE fell firmly in the middle, with means and medians in between the OR and AND groups. It also showed somewhat less variability than the AND group.

Boxplots for descriptive statistics for the different combination rules with the same cut-scores.
Given the much larger number of students identified with the OR rule, we expected that this combination rule would also result in the greatest student diversity. Using standard errors for proportions, we confirmed this expectation, finding that the OR rule resulted in identifying a significantly greater proportion of girls, underrepresented racial and ethnic minorities, students eligible for FRL, and students who are ELs (see Table 2). The AND rule identified the least diverse pool of students, although it should be noted that none of the combination rules resulted in a perfectly representative identified group (comparing results to the “complete sample” column).
Percent of Identified Students From Each Demographic Group.
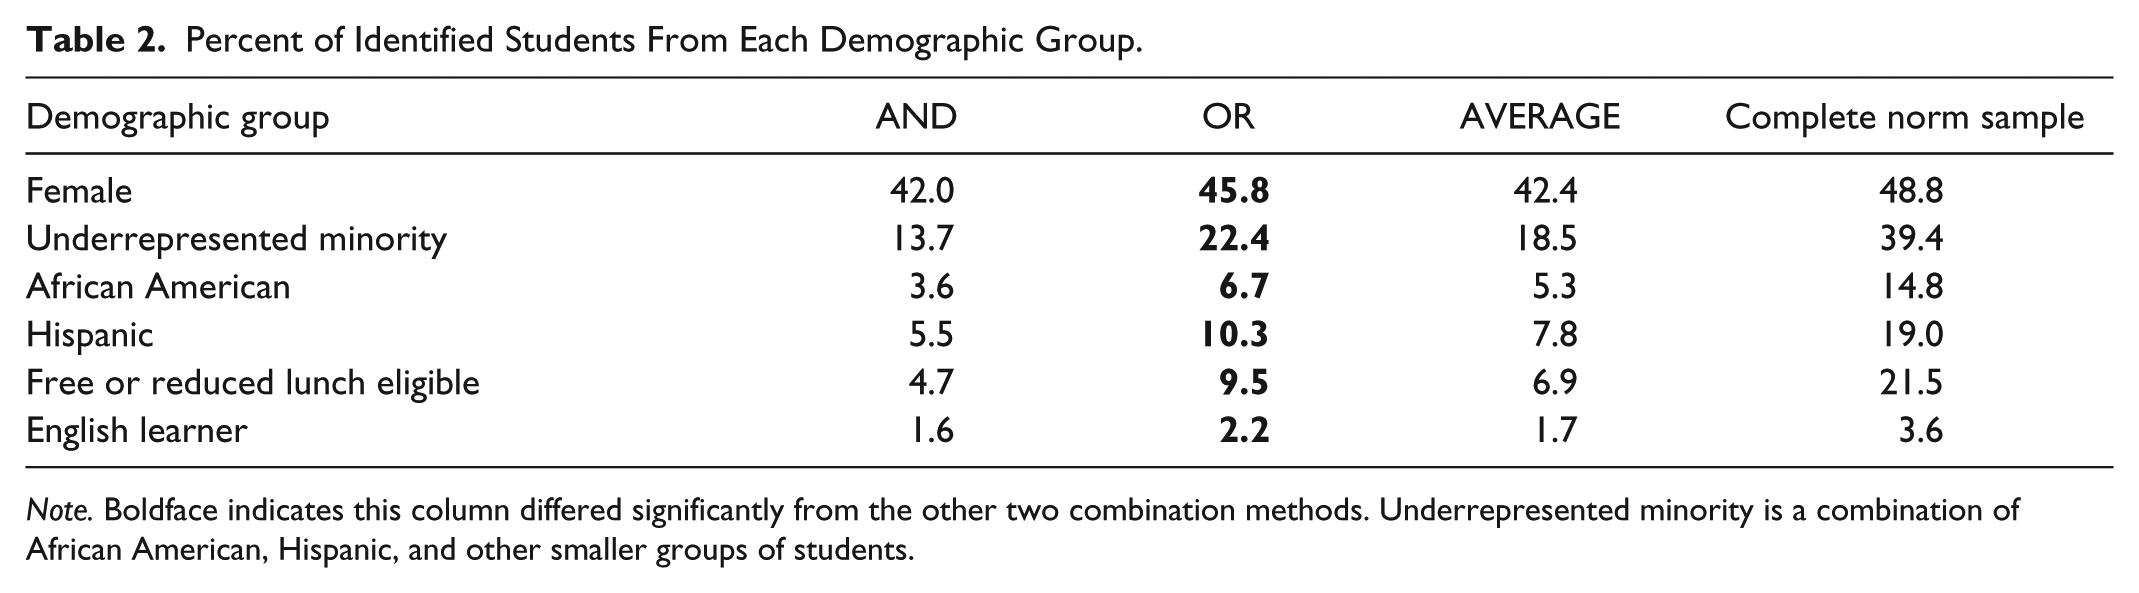
Note. Boldface indicates this column differed significantly from the other two combination methods. Underrepresented minority is a combination of African American, Hispanic, and other smaller groups of students.
As another perspective, we considered the percentage of students within each demographic group (girls, FRL-eligible students, etc.) who were identified under each combination rule. We then calculated the ratio of the identified pool for each combination rule. This highlighted proportionally how many more students in focal groups were identified by the more lenient combination rules (see Table 3). Overall, the OR rule identified a more diverse population of students. The ratios in Table 3 highlight the drastic effects. The number of underrepresented minorities identified increased by a ratio of 17 for African American and Hispanic students. This rule also increased the number of FRL students by a factor of 18 and EL students by a factor of 12. Comparing the AVERAGE rule to AND, the ratios were smaller, but still indicated that the largest gains were for minority students and students eligible for FRL.
Percent and Ratio of Each Demographic Group Identified Under Each Combination Rule.
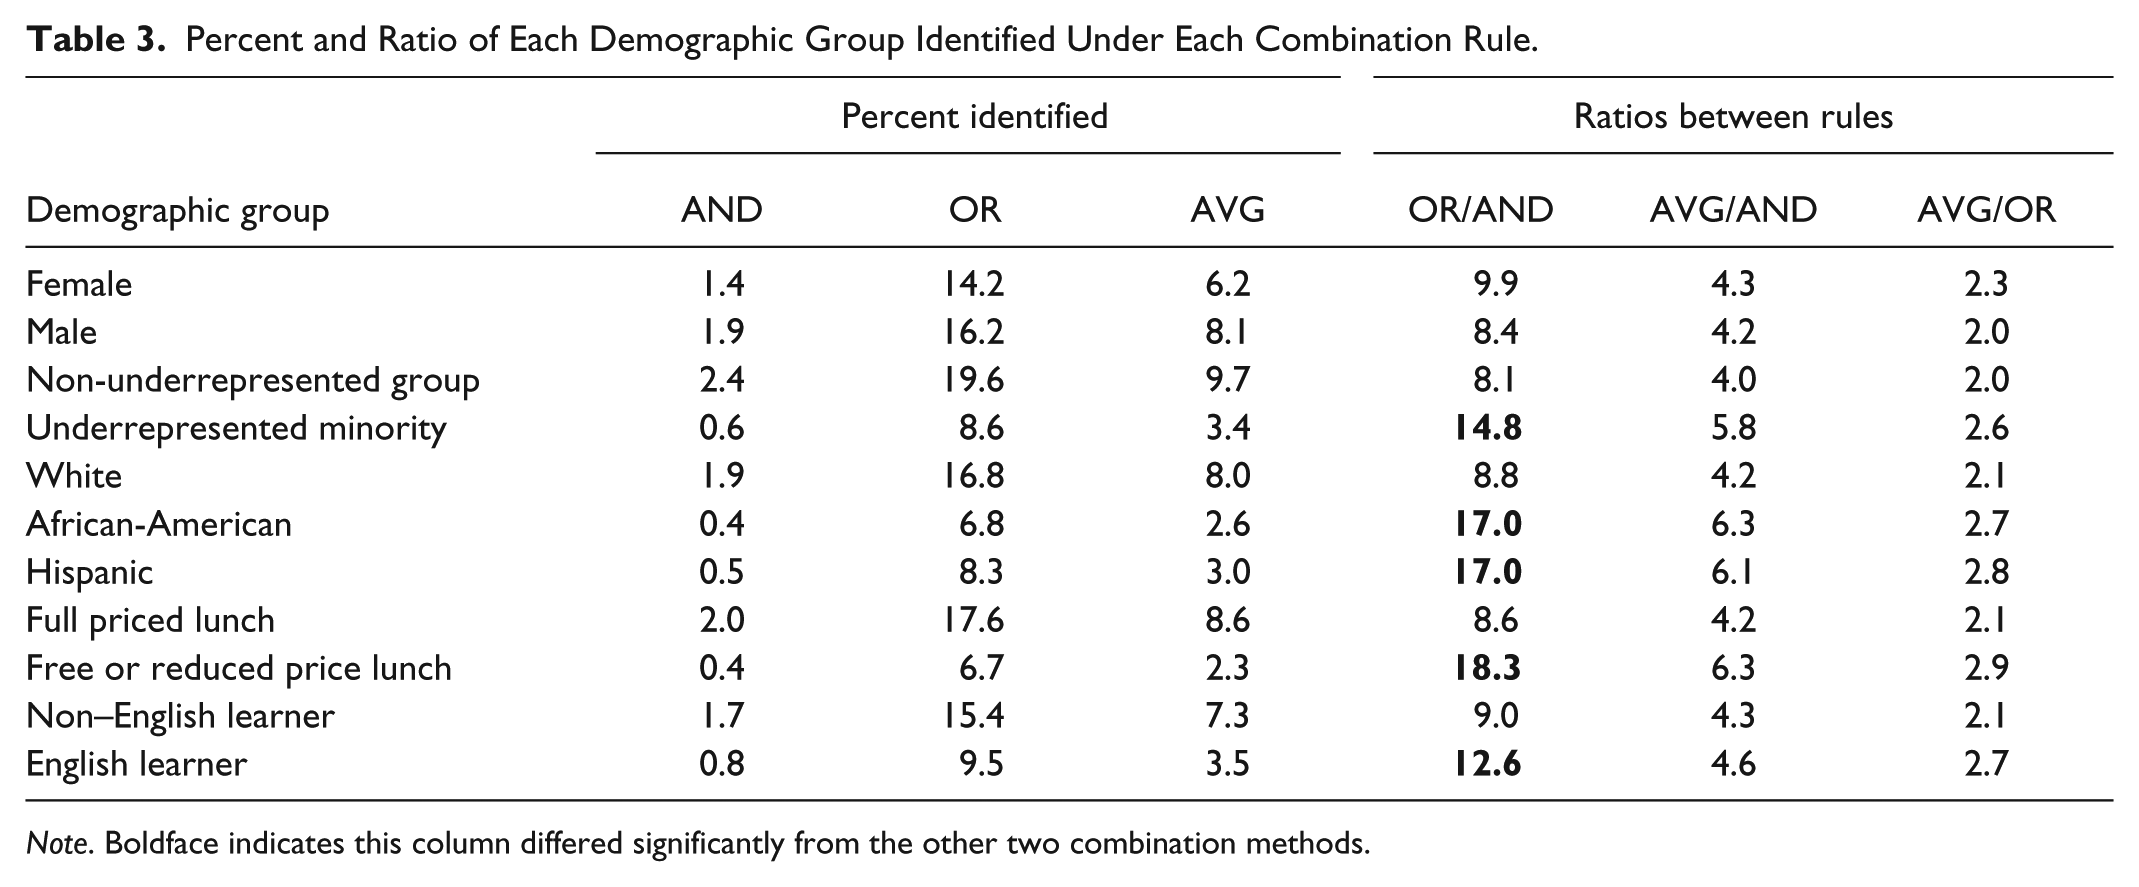
Note. Boldface indicates this column differed significantly from the other two combination methods.
When the Size of the Program Is Held Constant
One interpretation of the previous result is that the diversity advantage of the OR combination rule might be due to the flexibility offered by such a program. In other words, by letting students have a substantial relative weakness, and a strength in any one area, perhaps the OR rule inherently promotes a more diverse pool of identified students, such as allowing for lower Verbal scores as we would expect for EL students. On the other hand, the diversity might be due solely to the larger number of students included. To test this belief, we ran the previous analyses again while adjusting the percentile rank of the cutoff so that each combination rule resulted in roughly the same number of students. In other words, we held the size of the program constant across the three combination rules.
To identify similar numbers, we relaxed the cut-score for the AND rule to the 76th national percentile and increased the OR cut-score to the 96th percentile to achieve 3 pools of around 2,600 students. We found that the differences in mean total score were still significant, but the effects were substantially smaller than when the cut-scores were the same. These remaining differences may be attributable to minor variations in the sample size (because we had to use whole number adjustments in percentile points, exact matching of sample size was not possible). In this case, the AVERAGE rule resulted in the highest average score, followed by OR. The AND rule, which previously had the highest average, was now the lowest (see Table 4 and Figure 3). The differences in selectivity in the earlier analyses therefore were due to the number of students selected by the combination rule and not some other effect.
Cross-Battery Descriptive Statistics When Rules Identify Similar Numbers of Students.
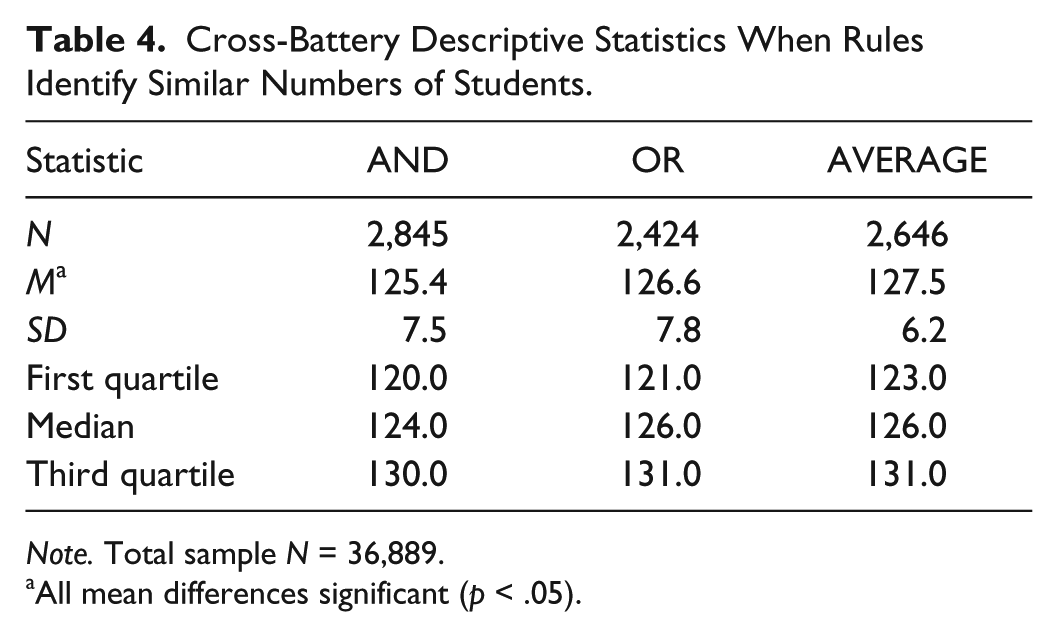
Note. Total sample N = 36,889.
All mean differences significant (p < .05).
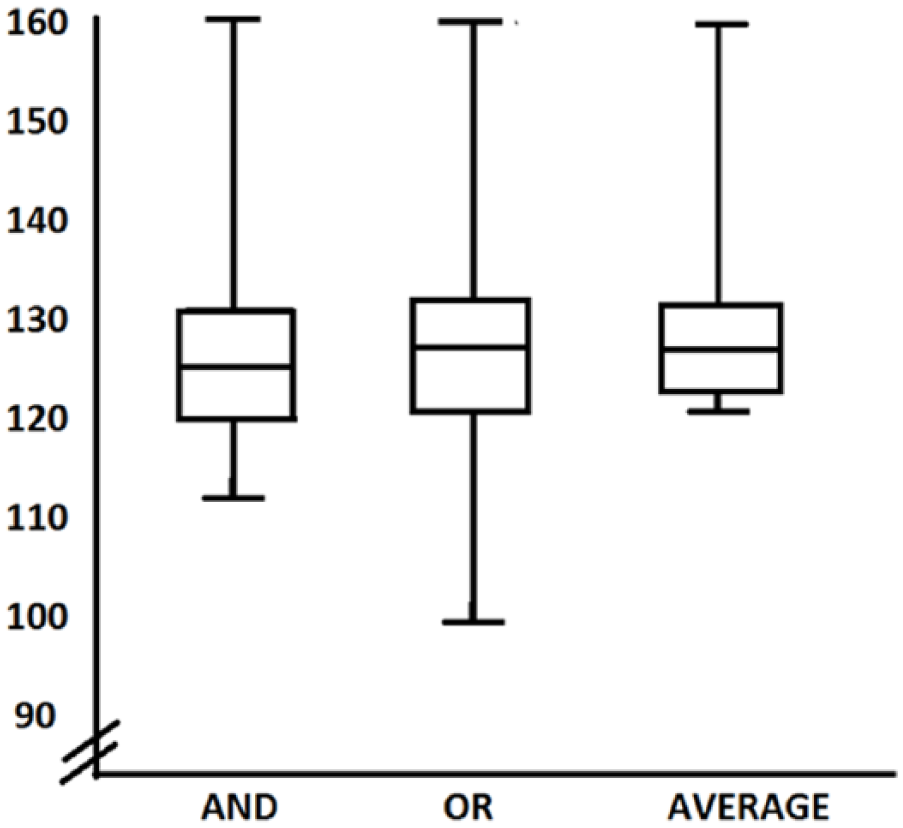
Boxplots for descriptive statistics for the different combination rules when pool size was held constant.
In terms of variability (captured by the standard deviation), the AVERAGE rule resulted in the most homogenous scores, but now both AND and OR rules produced similarly variable pools of students. This would have implications for how heterogeneous the instructional needs of identified students will be.
To look at the diversity of identified students, we again calculated standard errors for proportions to determine if the identified pools varied in their diversity across the three combination rules. In this case, we found only one significant difference—the AND rule identified significantly more girls (around 2%-3% more; see Table 5). For the most part, the combination rules resulted in similar diversity when the identified pool was similar in size. Therefore, we can conclude that the diversity of the OR rule comes from the increased pool rather than through its flexibility.
Percent of Identified Students From Demographic Group When Rules Identify Similar Numbers of Students.

Note. Significantly larger group value in each row in boldface.
To further explore these results, we looked at crosstab comparisons (Table 6) of each combination rule for each subset of students (girls vs. boys, EL vs. non-EL, etc.). We found remarkably high consistency in which students were identified by each model (AND/OR/AVERAGE). We found that the three different rules identified 96% to 98% of the same students. When broken down by demographic group, the consistency was still high at 95% to 99% agreement across combination rules for all students. This indicates relatively little variation in which students were identified under each combination rule; although it might be interesting in future research to explore the characteristics of this small group of students who were not identified by all models. This result is affected by the use of three related and reliable measurements. A more varied test battery would demonstrate less overlap in students who were identified by the different combination rules.
Percent Overlap of Students Identified by Each Combination Rule, Split by Demographic Group.

Note. Boldface indicates this column differed significantly from the comparison group.
Discussion
Researchers have argued that using the OR rule increases program diversity in terms of student demographic characteristics (e.g., Lohman, 2012b). This was found to be the case here when a single cut-score was used (as would be the case in any district or state with a mandated cut-score). However, our findings using different cut-scores, to hold constant the number of students identified, showed us that the benefit to diversity was primarily a function of the number of students identified and not a particular effect of using the OR combination method. When program size was held constant, all three combination rules resulted in similar diversity of students.
A reader might be concerned that only ability measures were addressed in this study, and that these findings might not apply to cases where more diverse types of measures are used (e.g., teacher ratings or creativity measures). However, we argue that these results do generalize to these other cases where these three combination rules could be applied. Specifically, no matter the measures used, if a child must have high scores on ALL measures, there will be a much smaller pool identified than if a child must have high scores on just one measure. This would have the result of limiting the demographic diversity of students identified. Likewise, the variation in ability or creativity in the selected group will be MUCH greater if the OR rule is used rather than average or AND rule, consistent with the McBee et al. (2014) findings. The benefits of incorporating more diverse measures will be achieved more readily when using the OR rule while allowing the program (and program services) to expand to the larger and more diverse (in terms of abilities) pool of students. That said, the inclusion of less highly correlated measures (or less reliable measures) will lead to an exacerbation of our findings for the OR rule. For example, if a creativity measure or teacher rating of motivation is used, the range of cognitive abilities and current achievement, the size of the identified pool, and the nonoverlap of identified students from each measure will be increased substantially.
Combination Rules and Program Design
The diversity of the measures used in identification in conjunction with the combination rules applied will have sweeping effects on the heterogeneity of the students identified for services. Although not studied here, these changes will undoubtedly affect the services that a program must offer. If a program uses diverse tests (i.e., weakly correlated) with the OR combination rule, they will end up with a strongly heterogeneous population of students to work with where students will have strengths in some areas and profound weaknesses in others. For example, if teacher ratings of creativity are given equal weight as achievement test scores (i.e., when an OR rule is applied), the pool of identified students will include a large number of students with creative ways of thinking but weaker current achievement. The needs of these students will differ greatly from the needs of students with strong current academic ability (but perhaps weak creativity skills). A similar result would occur if measures of artistic, musical, academic, and other aptitudes were used to identify students with potential talent. Selecting a heterogeneous pool demands that the programs offered be tailored to the students identified.
The Schoolwide Enrichment Model (Renzulli & Reis, 1997) with three tiers of services suggests one approach to providing services to academically diverse students in the identified pool. Additionally, the Lohman and Renzulli (2007) identification matrix provides a valuable strategy for using multiple measures to make placement decisions when varied levels of interventions are offered and diverse identification measures are used (e.g., teacher ratings of student skills alongside achievement and ability data). By combining measures of aptitude or potential with measures of current achievement, their method of identification and services provides some of the best features of both the AVERAGE and OR combination rules.
The situation studied here is one where the district uses National Percentile Ranks to make identification decisions. When local cut-scores can be chosen, program size will the driving factor in increasing the diversity of students served by a program. The more students who can be served, the greater the diversity will be in terms of ability and demographics. As McBee et al. (2014) and this study confirmed, the AND rule will result in the most homogeneous student group and have relatively consistent instructional needs. This was true even when we held program size constant. Homogeneity may be a good or a bad thing, depending on the program. Homogeneity might not be consistent with program goals, if the program values developing diverse abilities and talents among students. It also might not serve discipline-focused programs, such as STEM (Science, Technology, Engineering, and Mathematics) oriented programs, when identification should probably emphasize math and nonverbal scores over verbal or cross-battery (total score) performance. Therefore, the design of the program, rather than the convenience of homogeneity, should drive the choice of combination rule.
Footnotes
Declaration of Conflicting Interests
The author(s) declared no potential conflicts of interest with respect to the research, authorship, and/or publication of this article.
Funding
The author(s) received no financial support for the research, authorship, and/or publication of this article.