
Abstract
Objective:
In this study, we aimed to quantify and compare performance of middle-aged and older drivers during a naturalistic distraction paradigm (visual search for roadside targets) and to predict older drivers’ performance given functioning in visual, motor, and cognitive domains.
Background:
Distracted driving can imperil healthy adults and may disproportionally affect the safety of older drivers with visual, motor, and cognitive decline.
Method:
A total of 203 drivers, 120 healthy older (61 men and 59 women, ages 65 years and older) and 83 middle-aged drivers (38 men and 45 women, ages 40 to 64 years), participated in an on-road test in an instrumented vehicle. Outcome measures included performance in roadside target identification (traffic signs and restaurants) and concurrent driver safety. Differences in visual, motor, and cognitive functioning served as predictors.
Results:
Older drivers identified fewer landmarks and drove slower but committed more safety errors than did middle-aged drivers. Greater familiarity with local roads benefited performance of middle-aged but not older drivers. Visual cognition predicted both traffic sign identification and safety errors, and executive function predicted traffic sign identification over and above vision.
Conclusion:
Older adults are susceptible to driving safety errors while distracted by common secondary visual search tasks that are inherent to driving. The findings underscore that age-related cognitive decline affects older drivers’ management of driving tasks at multiple levels and can help inform the design of on-road tests and interventions for older drivers.
Introduction
Epidemiological studies project an increase in the percentage of older drivers who are at greater risk for fatal crashes (Evans, 2000; Lyman, Ferguson, Braver, & Williams, 2002). Empirical models of older-driver safety require better understanding of the challenges faced by older as opposed to middle-aged drivers. Research is needed that involves consideration of key functional domains other than basic vision to predict variability in older drivers’ performance and to identify and model early functional declines that threaten older drivers’ safety and mobility in the real world (see Fisher, Rizzo, Caird, & Lee, 2011, for a review). We addressed these issues in the context of naturalistic challenges on the road.
Studies of distracted driving have focused on cell phones, interactions with GPS, and in-vehicle music systems (e.g., see Ranney, 2008, for a review; Janssen & Brumby, 2010; Strayer & Drew, 2004; Strayer, Drew, & Johnston, 2003). Secondary tasks inherent to driving can also be distracting. For example, traffic signs allow drivers to wayfind within legal limits, and landmarks, such as restaurants, grocery stores, or other roadside buildings, may be destinations or may index current location and turning points (Golledge, 1999). Searching for such roadside targets draws on perceptual, cognitive, and motor resources and can interfere with driver ability to watch the road for hazards and with vehicle control responses to changing conditions. Such interference can increase the risk of driver errors (Ho, Scialfa, Caird, & Graw, 2001; McPhee, Scialfa, Dennis, Ho, & Caird, 2004). Recent taxonomies of distracted driving include search for roadside targets as a type of distraction that bears on driver safety (Regan, Hallet, & Gordon, 2011). Although search for roadside targets is essential for safe navigation, it may lead to distracted and unsafe driving, particularly in older drivers (Rizzo, 2011; Boer, Cleij, Dawson, & Rizzo, 2011).
The first goal of this study was to examine performance differences in the naturalistic secondary driving task of searching for roadside targets (landmarks and traffic signs) and concurrent driving safety in older adults and middle-aged drivers. Greater familiarity with the roads driven and greater current exposure to driving hazards are factors that can diminish performance differences between older and middle-aged adults. For example, greater familiarity with the area should improve landmark and traffic sign identification; greater current exposure to driving hazards (i.e., greater practice) indexed by miles and days driven may mitigate the effects of secondary tasks. Slower overall speed is another potential strategy to compensate for age-related functional decline. It is possible for age to moderate the effects of those factors on safety-relevant performance. For example, it is possible that relative decrements in older adults’ performance are particularly evident when drivers are unfamiliar with the area and have diminished current exposure to roadway hazards. Consequently, we investigated the main effects and two-way interactions of familiarity, exposure to roadway hazards, and average speed with age on driving performance metrics.
The second goal was to examine the unique predictive power of motor and cognitive functioning over and above basic vision relative to performance in naturalistic secondary tasks of identifying landmarks and traffic signs and the primary task of concurrent driving safety among older drivers. Current licensing regulations designate basic vision as an important functional domain to driver safety (Levy, Vernick, & Howard, 1995), but basic vision tests are inadequate for distinguishing safe and unsafe older drivers. Recent reviews (Anstey, Wood, Lord, & Walker, 2005) and mounting evidence underscore that cognitive functioning adds uniquely to older drivers’ performance in on-road tests (e.g., Aksan et al., 2012; Anstey & Wood, 2011; Dawson, Uc, Anderson, Johnson, & Rizzo, 2010; Wood, Anstey, Kerr, Lacherez, & Lord, 2008) and state-recorded crash statistics (Ball et al., 2006; Ball, Owsley, Sloane, Roenker, & Bruni, 1993). Empirical models of older-driver safety that account for variability in older drivers’ performance must consider domains of functioning besides basic vision.
Assessment batteries used in research on older driver safety vary considerably in test choice and functional domains assessed (e.g., Aksan et al., 2012; Ross et al., 2009; Sims, McGwin, Allman, Ball, & Owsley, 2000; Wood et al., 2008). Basic visual sensory functioning (e.g., acuity, contrast sensitivity) tests and useful field of view (UFOV; Owsley et al., 1998) are pervasive, whereas motor and cognitive function tests vary widely across studies. For example, some groups rely on reaction time tests that require coordination of both motor and cognitive responses to driving-related stimuli (Anstey & Wood, 2011; Wood et al., 2008). Others rely on standardized neuropsychological tests, such as block constructions, copying complex figures, and others (e.g., Anderson et al., 2012; Dawson et al., 2010; Uc et al., 2009). Nonuniform test selection across studies is a barrier to translating evidence-based recommendations to clinical practitioners and driving officials who may not have access, expertise, or resources to implement expensive or specialized tests. A useful and fruitful alternative approach is to characterize domains of cognitive functioning on the basis of clinical practice (Strauss, Sherman, & Spreen, 2006; Uc et al., 2009) or factor analytic results (Anderson et al., 2012, Anstey & Wood, 2011) without implying that there is any one unique or definitive way to measure functioning in a specific domain, consistent with our collective empirical understanding to date.
The current study relied on standard neuropsychological tests to tap key aspects of lower-order visual processing, higher-order visual cognition, executive function (set shifting and fluency), and motor function. Performing two simultaneous tasks requires executive control of attentional allocation. Identifying landmarks and signs is likely to tap lower-order visual processing and higher-order visual cognition for rapid parsing of objects and events across the visual fields. Motor functions are critical for primary operation of vehicle controls for safe braking and lane maintenance. In the multivariate setting, we tested whether functioning in these domains predicted unique variance in the naturalistic secondary driving tasks of identifying landmarks and traffic signs and concurrent driving safety over and above functioning in basic vision. As functioning in these domains is correlated, we did not hypothesize superiority of functioning in one domain to another in performance prediction in the multivariate setting.
To summarize, the first goal of this study was to examine whether performance in the naturalistic distraction paradigm of searching for roadside targets, such as landmarks and traffic signs, and concurrent driving safety were comparable between normally aging older adults and middle-aged adults. The second goal was to examine the unique predictive power of motor and cognitive functioning over and above basic vision in older drivers’ performance.
Method and Materials
Participants
We recruited 120 older drivers (61 men and 59 women, ages 65 to 89 years) and 83 middle-aged drivers (38 men and 45 women, ages 40 to 65) from the local community through public service announcements and advertisements in newspapers, senior centers, and churches. All participants were licensed and active drivers. Exclusion criteria included acute illness or active confounding medical conditions, such as vestibular disorders, sleep disorders, neurologic disease (e.g., brain tumors, stroke, traumatic brain injury, epilepsy, depression, dementia), major psychiatric disease not in remission, alcoholism or other forms of drug addiction, and diseases of the optic nerve, retina, or ocular media with corrected visual acuity worse than 20/50. Drivers taking stimulants, antihistamines, narcotics, anxiolytics, anticonvulsants, or neuroleptics were also excluded. The institutional review board at the University of Iowa approved this study, and informed consent procedures adhered to institutional and federal guidelines.
Landmark and Traffic Sign Identification Test (LTIT)
The LTIT was conducted in an instrumented vehicle named ARGOS, a midsized Ford Taurus station wagon with an automatic transmission. The LTIT was part of an (approximately 45-min) experimental drive including multiple road types and challenges (e.g., Dawson et al., 2010), conducted during daylight and in good weather conditions, with a trained research assistant in the front passenger seat. The LTIT occurred just after the midpoint of the overall drive. Participants drove approximately 1.5 miles along a suburban commercial strip with a speed limit ranging between 30 and 45 mph. Participants were asked to verbally identify each traffic sign they saw on the right side of the road (16 possible) and each restaurant they saw on either side of the road (13 possible), and all responses were recorded by the research assistant.
Experimental performance data, including vehicle speed, acceleration, and steering wheel position, were recorded by unobtrusively placed sensors digitized at 10 Hz. Mean speed, lateral and longitudinal acceleration, and steering wheel position were calculated across the length of the LTIT segment. A four-view video of the drive was recorded and later reviewed by a certified driving instructor (different person from the research assistant who administered the drive) according to the standards of the Iowa Department of Transportation (September 7, 2005, version). The scoring generated information on frequency and types of safety errors the participants committed (Dawson et al., 2009). The taxonomy of 76 error types (e.g., incomplete stop, straddles lane line) is organized into 15 categories (e.g., stop signs, lane observance, lane change, turns). The frequency of safety errors committed by each participant during LTIT was tallied for use in the analyses. For total number of errors per drive, the primary reviewer’s intrarater correlation was .95, and the interrater correlation was .73.
Off-Road Testing Battery
Information on demographic and driving characteristics and a battery of visual, motor, and cognitive tests were collected as potential predictors of LTIT performance. Demographic measures were age, gender, and years of education. The UAB Driving Habits Questionnaire (DHQ) assessed self-reported driving habits and exposure, including average number of days and miles driven per week (Sloane, Ball, Owsley, Roenker, & Bruni, 1990). The participants rated their familiarity with the Iowa City area on a 3-point scale (familiar, somewhat, or not familiar). Participants completed all assessments in basic vision, motor, and cognitive functioning using any corrective glasses or lenses normally worn while driving. Measures of motor function were Get-Up and Go (Alexander, 1994; Mathias, Nayak, & Isaacs, 1986; Podsiadlo & Richardson, 1991), Functional Reach (Alexander, 1994; Duncan, Weiner, Chandler, & Studenski, 1990), and Grooved Pegboard Test (Heaton, Grant, & Matthews, 1991). Basic vision tests included Near Visual Acuity (Ferris, Kassoff, Bresnick, & Bailey, 1982), Far Visual Acuity (Ferris et al., 1982), and Contrast Sensitivity (Pelli, Robson, & Wilkins, 1988).
Tests that required visual processing of information were divided into those that placed lower-order demands (e.g., visual perception) and those that placed higher-order demands (e.g., visual cognition). For example, lower-order visual perception was assessed with Judgment of Line Orientation (JLO; Strauss et al., 2006), Structure from Motion (Rizzo, Nawrot, & Zihl, 1995; Rizzo, Reinach, McGehee, & Dawson, 1997), and UFOV (Ball & Owsley, 1993; Edwards et al., 2005). In contrast, higher-order visual cognition, including visuospatial construction and memory, was assessed with the Wechsler Adult Intelligence Scale–III Block Design (Wechsler, 1981), Complex Figure Test–Copy (Stern et al., 1994), Complex Figure Test–Recall (Stern et al., 1994), and errors from the Benton Visual Retention Test (Sivan, 1992). All four of those tests require that the participant parse and reason about elements of complex visual stimuli.
Executive function refers to the variegated set of higher-order abilities necessary for planning and organizing or goal-directed behavior. When deficits in planning and organizing are noted, several neuropsychological tests can be sensitive to those deficits. For example, set shifting can be assessed with the difference in seconds it takes to complete Trail Making Tests A and B (Reitan & Davison, 1974). Verbal fluency, via the Controlled Oral Word Association (COWA; Benton & Hamsher, 1978), is also sensitive to deficits of executive function. COWA involves recalling distinct words that begin with the letters C, F, and S and is challenging to those with executive function deficits because it requires the person to organize concepts in a novel way. Finally, Auditory-Learning Verbal Test–Recall (Strauss et al., 2006) was used as a measure of anterograde verbal memory.
To reduce the number of predictors while retaining the ability to test the relative importance of specific domains of functioning to performance, we formed smaller composite scores that summarized functioning more specifically in the domains of basic vision, motor function, and four cognitive domains: visual perception, visual cognition, verbal memory, and executive function. We formed the composites by standardizing constituent test scores described above and averaging them after appropriate reversals. High scores represented better functioning.
Statistical Analyses
Demographics, driving characteristics, and neuropsychological tests (motor, visual, and cognitive) were considered as predictor variables. Performance in landmark and traffic sign identification and concurrent driver safety errors were considered as the three outcome measures.
The first goal of the study was to specify and describe the differences between middle-aged and older adults on the three outcome measures. Descriptive statistics (means, standard deviations, etc.) of predictors and outcomes were calculated within each age group, as were between-group comparisons via independent-sample t tests. Factors that could account for differences between age groups included familiarity with the area; driving habits, such as current exposure (miles and days driven); and vehicle speed. Those factors were examined in multivariate least square regressions as predictors of the three outcome measures along with age group.
The second goal of the study was to examine the relative and unique predictive power of functioning in motor and cognition domains over and above vision among older drivers for each of three outcome measures. Within older drivers, relationships between predictor variables and outcomes were assessed with correlations. In explaining variability in the LTIT performance metrics in the multivariate setting, each regression controlled for variability in the remaining two LTIT metrics so as to isolate variability in each task outcome measure. As an additional safeguard, we verified our findings by using nonparametric tests (e.g., Wilcoxon rank-sum test for group comparisons) and by repeating regression models with outliers removed as a way to examine the robustness of our findings. The inferences were not altered; hence we report the results of the parametric tests with the full data.
Results
The older drivers performed worse on all domains of functioning, including basic vision, motor, and cognition, compared with the middle-aged drivers. Consistent with pervasive effects of aging (Anderson et al., 2012; Dawson et al., 2010), differences were significant in all four cognitive domains. See Table 1 for details.
Comparisons of Predictor Variables Between Middle-Aged and Older Drivers
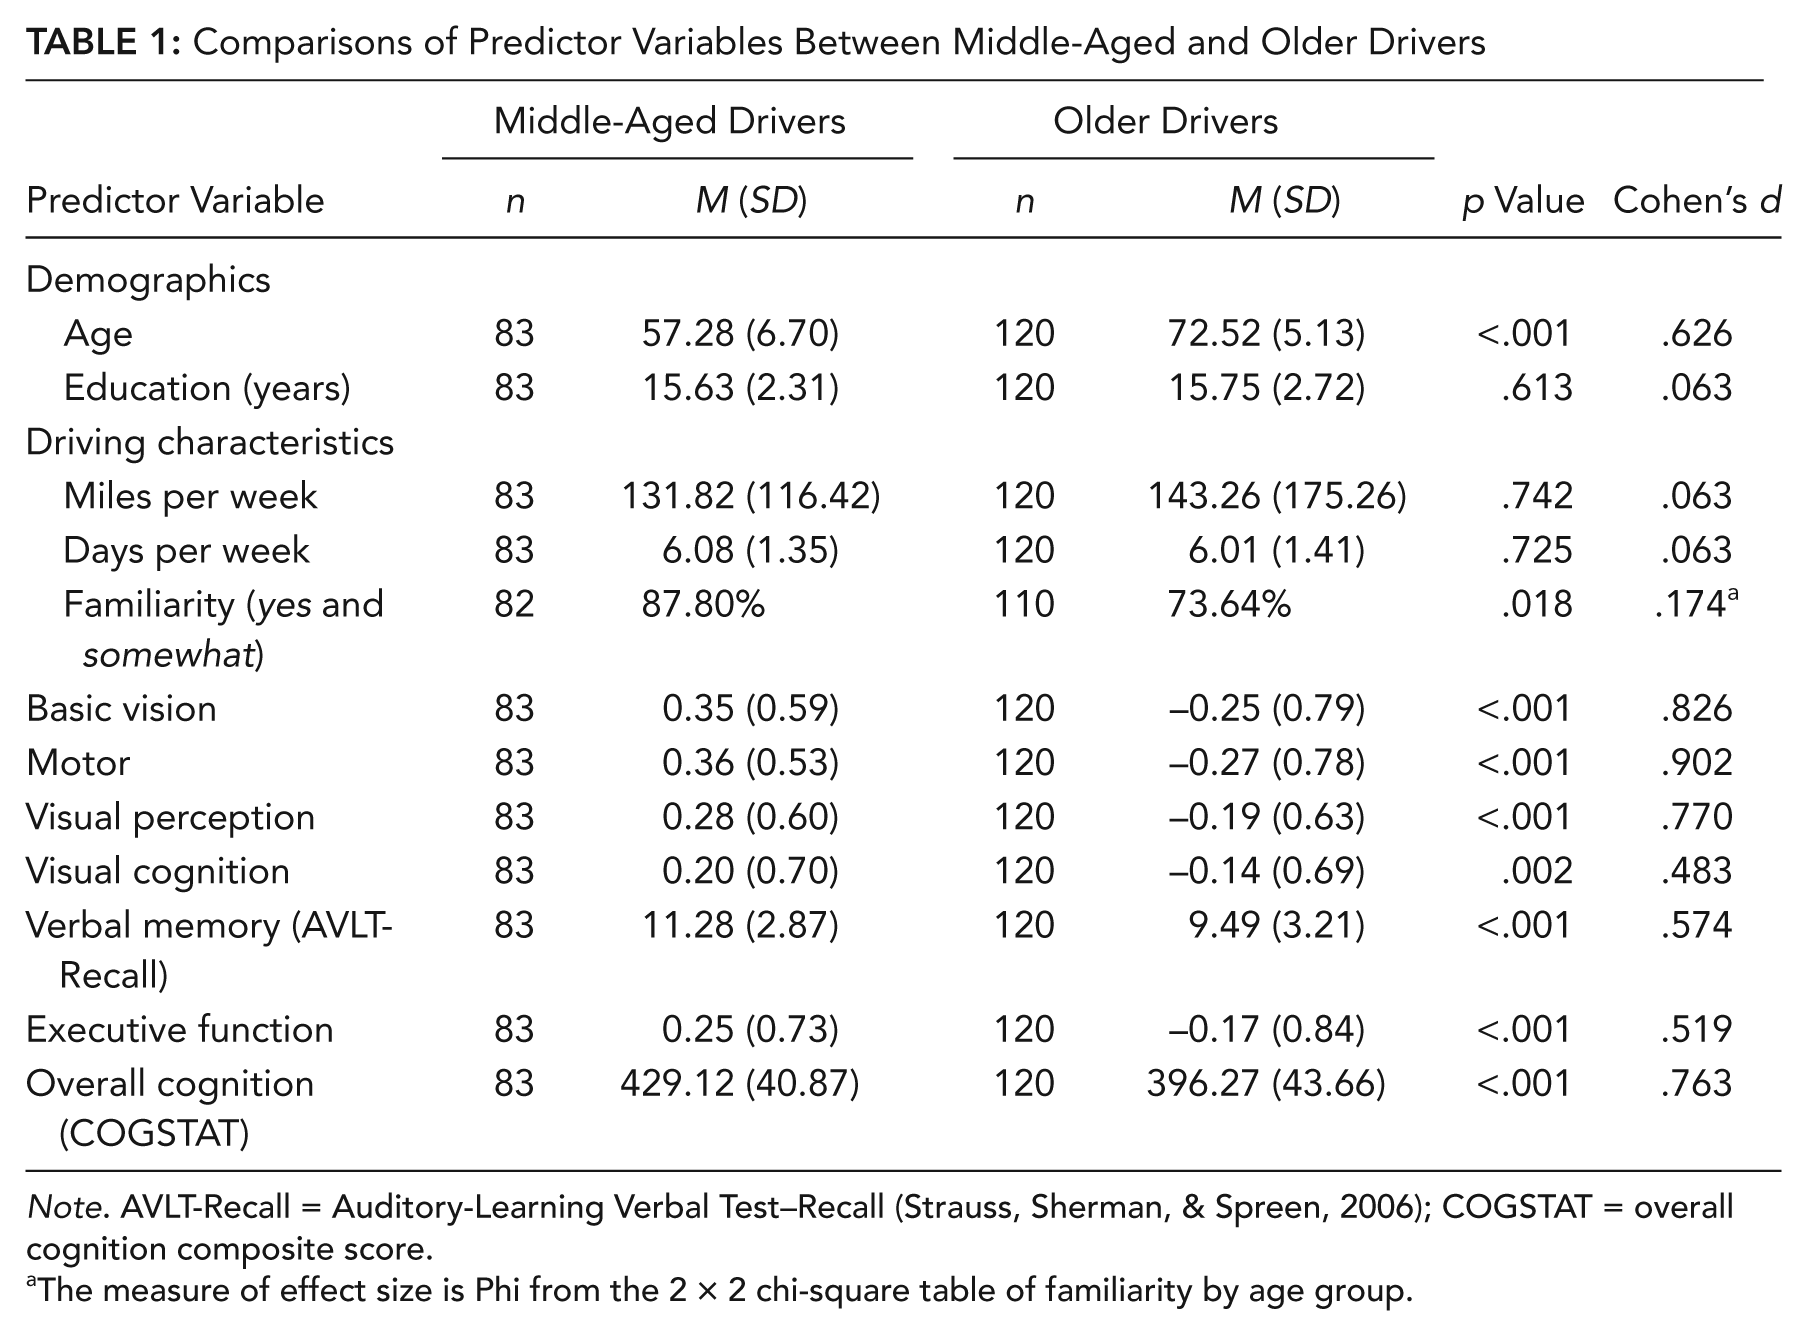
Note. AVLT-Recall = Auditory-Learning Verbal Test–Recall (Strauss, Sherman, & Spreen, 2006); COGSTAT = overall cognition composite score.
The measure of effect size is Phi from the 2 × 2 chi-square table of familiarity by age group.
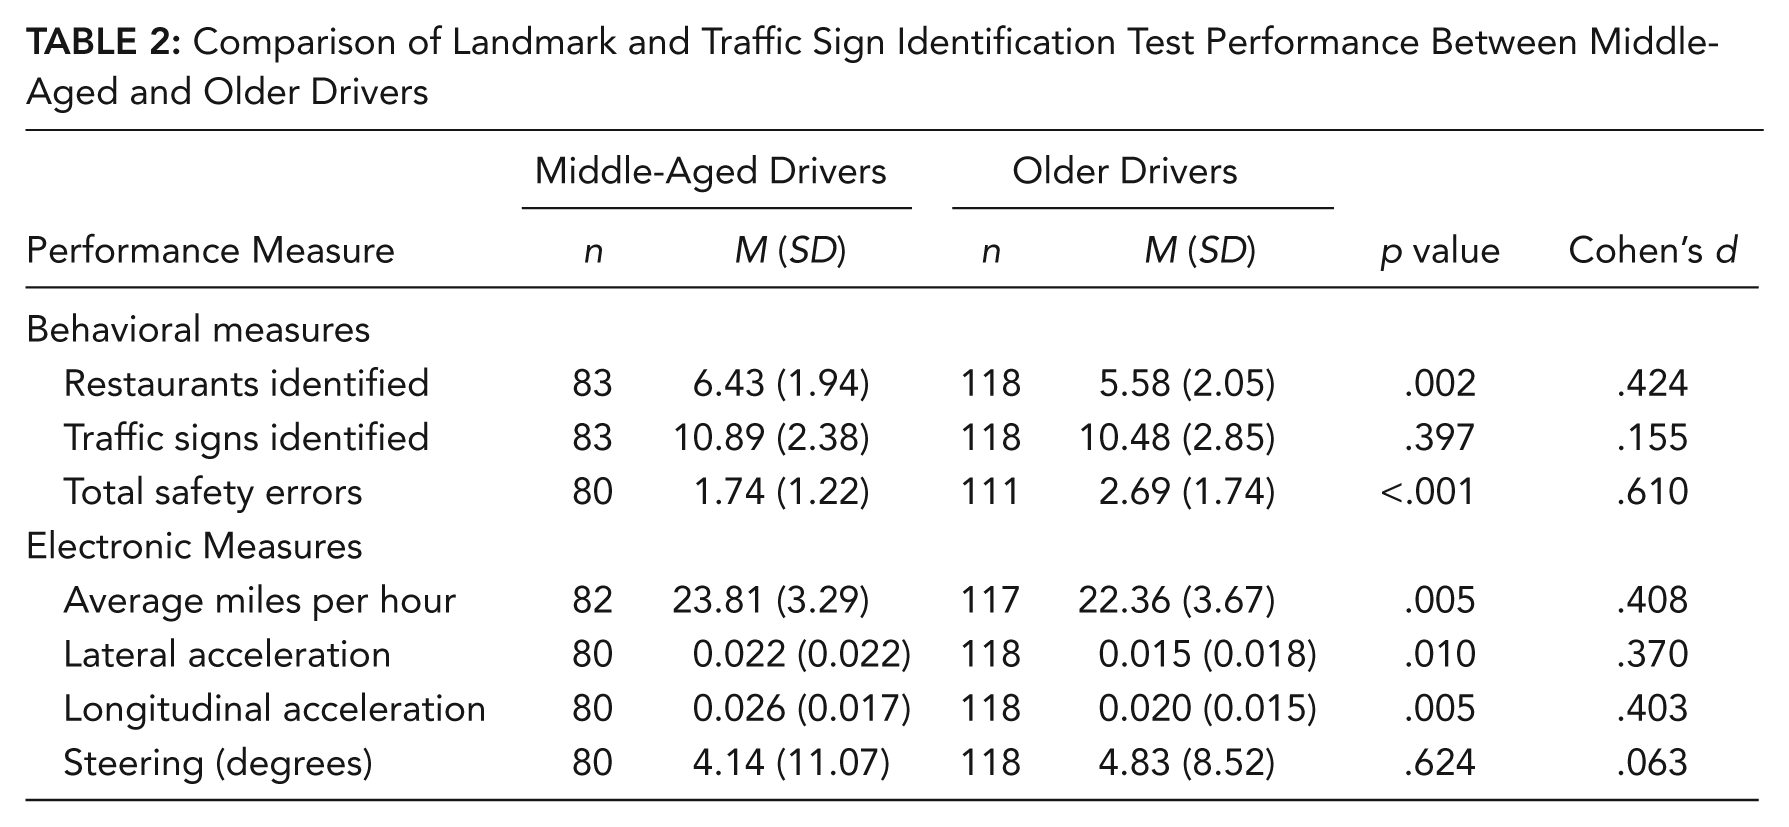
On the LTIT, older drivers identified fewer restaurants compared with middle-aged drivers but showed no significant disadvantage with respect to sign identification (Table 2). The older drivers drove at lower speeds and had lower average lateral and longitudinal accelerations, but despite those differences favoring safer driving, the older drivers committed more safety errors. Consistent with the nature of the roadway during LTIT, most safety errors involved lane changes, lane observance, turns, and turn signals (see Table 3). In addition, older adults but not younger adults were observed to show speed control errors and to drive slower than 10 miles below the posted speed limit. Table 3 shows the proportion of middle-aged and older adults making a specific error type at least once during LTIT.
Comparison of Landmark and Traffic Sign Identification Test Performance Between Middle-Aged and Older Drivers
Proportion of Middle-Aged and Older Participants Making a Specific Safety Error Type at Least Once During Landmark and Traffic Sign Identification Test (LTIT)

Note. For brevity, the 10 categories of errors that were not observed during LTIT are not listed. Please see Dawson, Uc, Anderson, Johnson, and Rizzo (2010) for a full list of error types.
To better understand the factors that differentially explain differences in behavioral measures of LTIT for middle-aged versus older adults, we conducted multivariate least square regressions. The first step in each regression controlled for the remaining two behavioral LTIT task measures to isolate variability in each of the task outcome measures in addition to age group. In the second step, characteristics, including familiarity with the Iowa City area, exposure (composite of standardized miles driven per week and days of week driving), and average speed during LTIT, were entered; and in the third step, the interactions of those three driver characteristics with age group were entered with a stepwise entry algorithm. The last step informs whether driver characteristics explain unique variability in LTIT behavioral performance measures differentially for middle-aged versus older adults. Table 4 shows the standardized betas from the final equation (six forced variables simultaneously from Steps 1 and 2, plus significant interactions, if any), with footnoted descriptions of the method of entry for predictor sets.
Standardized Beta Values From the Final Equation in Multivariate Least Square Regressions
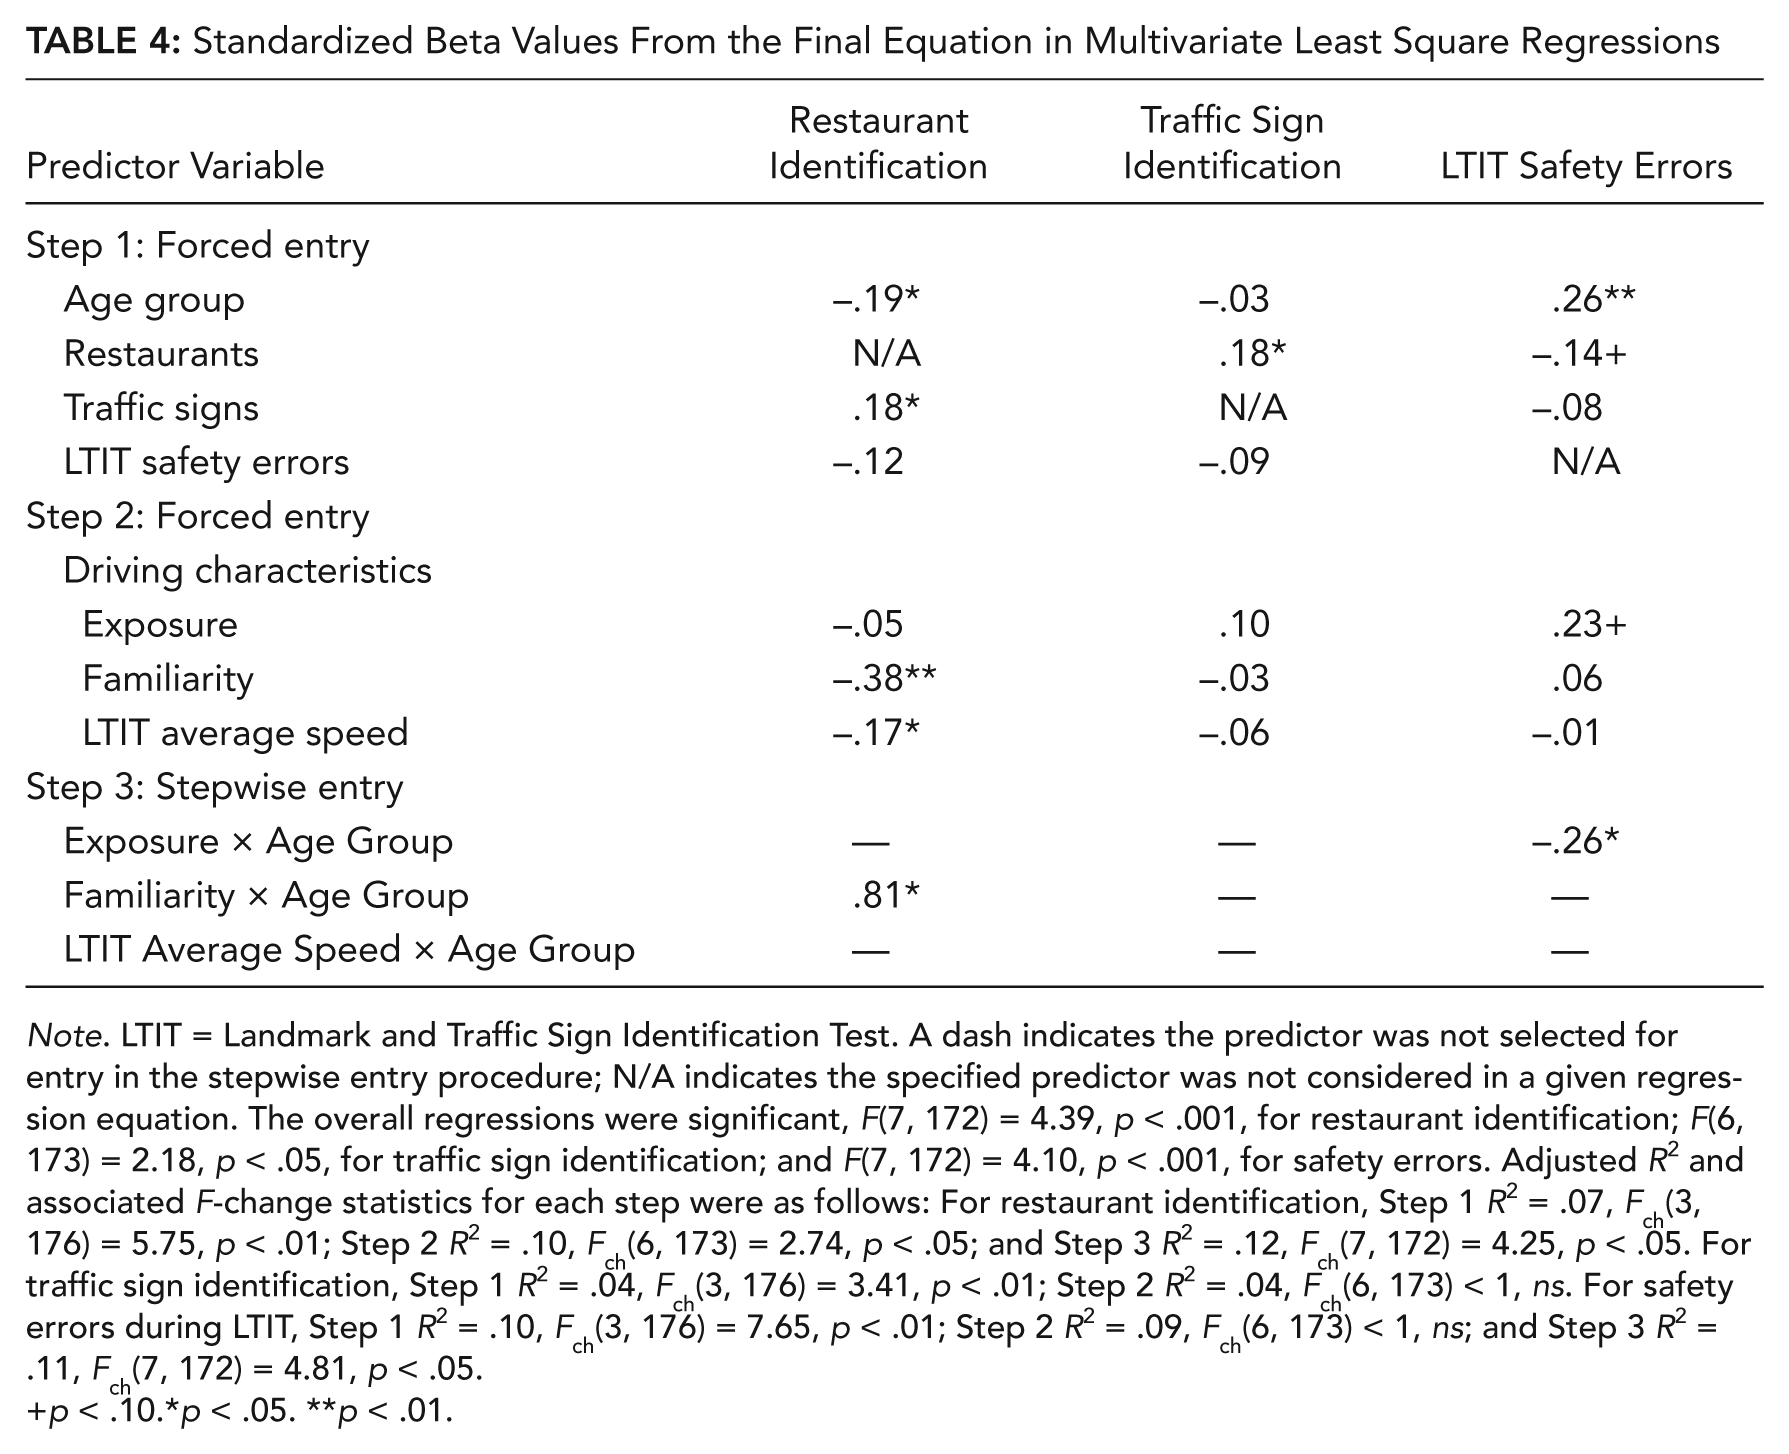
Note. LTIT = Landmark and Traffic Sign Identification Test. A dash indicates the predictor was not selected for entry in the stepwise entry procedure; N/A indicates the specified predictor was not considered in a given regression equation. The overall regressions were significant, F(7, 172) = 4.39, p < .001, for restaurant identification; F(6, 173) = 2.18, p < .05, for traffic sign identification; and F(7, 172) = 4.10, p < .001, for safety errors. Adjusted R2 and associated F-change statistics for each step were as follows: For restaurant identification, Step 1 R2 = .07, Fch(3, 176) = 5.75, p < .01; Step 2 R2 = .10, Fch(6, 173) = 2.74, p < .05; and Step 3 R2 = .12, Fch(7, 172) = 4.25, p < .05. For traffic sign identification, Step 1 R2 = .04, Fch(3, 176) = 3.41, p < .01; Step 2 R2 = .04, Fch(6, 173) < 1, ns. For safety errors during LTIT, Step 1 R2 = .10, Fch(3, 176) = 7.65, p < .01; Step 2 R2 = .09, Fch(6, 173) < 1, ns; and Step 3 R2 = .11, Fch(7, 172) = 4.81, p < .05.
p < .10.*p < .05. **p < .01.
The findings in Table 4 show that predictors entered in the first step remained significant in the final equation and are therefore important to isolating variability unique to performance challenges of identifying restaurants, traffic signs, and driving safety errors. Those predictors together explained 7% to 12% of the variability in the LTIT outcome measures. The findings also show that familiarity with the Iowa City area uniquely explained performance in restaurant identification and did so differentially for middle-aged and older adults. An examination of the point biserial correlation indicated that although familiarity predicted better performance for middle-aged adults, r(81) = –.32, p < .001, it failed to predict performance for older adults, r(110) = –.08, p = .390. Findings also showed that greater current exposure to driving hazards, as indexed by the exposure composite score (miles per week and days driving), predicted more safety errors during LTIT for middle-aged adults, r(81) = .22, p < .05, but did not predict safety errors for older adults, r(110) = –.09, p < .36. Those findings suggest that neither familiarity nor greater ongoing driving exposure helped improve behavioral performance in LTIT among older adults. Although lower average speed improved restaurant identification, greater slowing of speed did not differentially benefit older adults versus middle-aged adults.
Within the older drivers only, additional multivariate regressions focused on predicting the three LTIT outcomes for basic vision, motor, and cognitive functioning. Table 5 shows the correlational analyses between individual predictors and each of the three outcomes. Note that out of a total 30 correlations, 17 were significant, with the majority of the significant findings noted for restaurant and sign identification measures. Table 6 shows the standardized betas from the final equation in multivariate regressions and highlights the method of entry for predictor sets. The first step in each regression controlled for the remaining two behavioral LTIT task measures to isolate variability in each of the task outcome measures in addition to basic vision. In the second step, demographic predictors (age, education, and gender) along with motor and cognitive functioning composite scores were entered with a stepwise entry procedure, while forcing the three variables from the first step.
Pearson Correlation Coefficients (and p Values) of Predictors and Older Drivers’ LTIT Performance
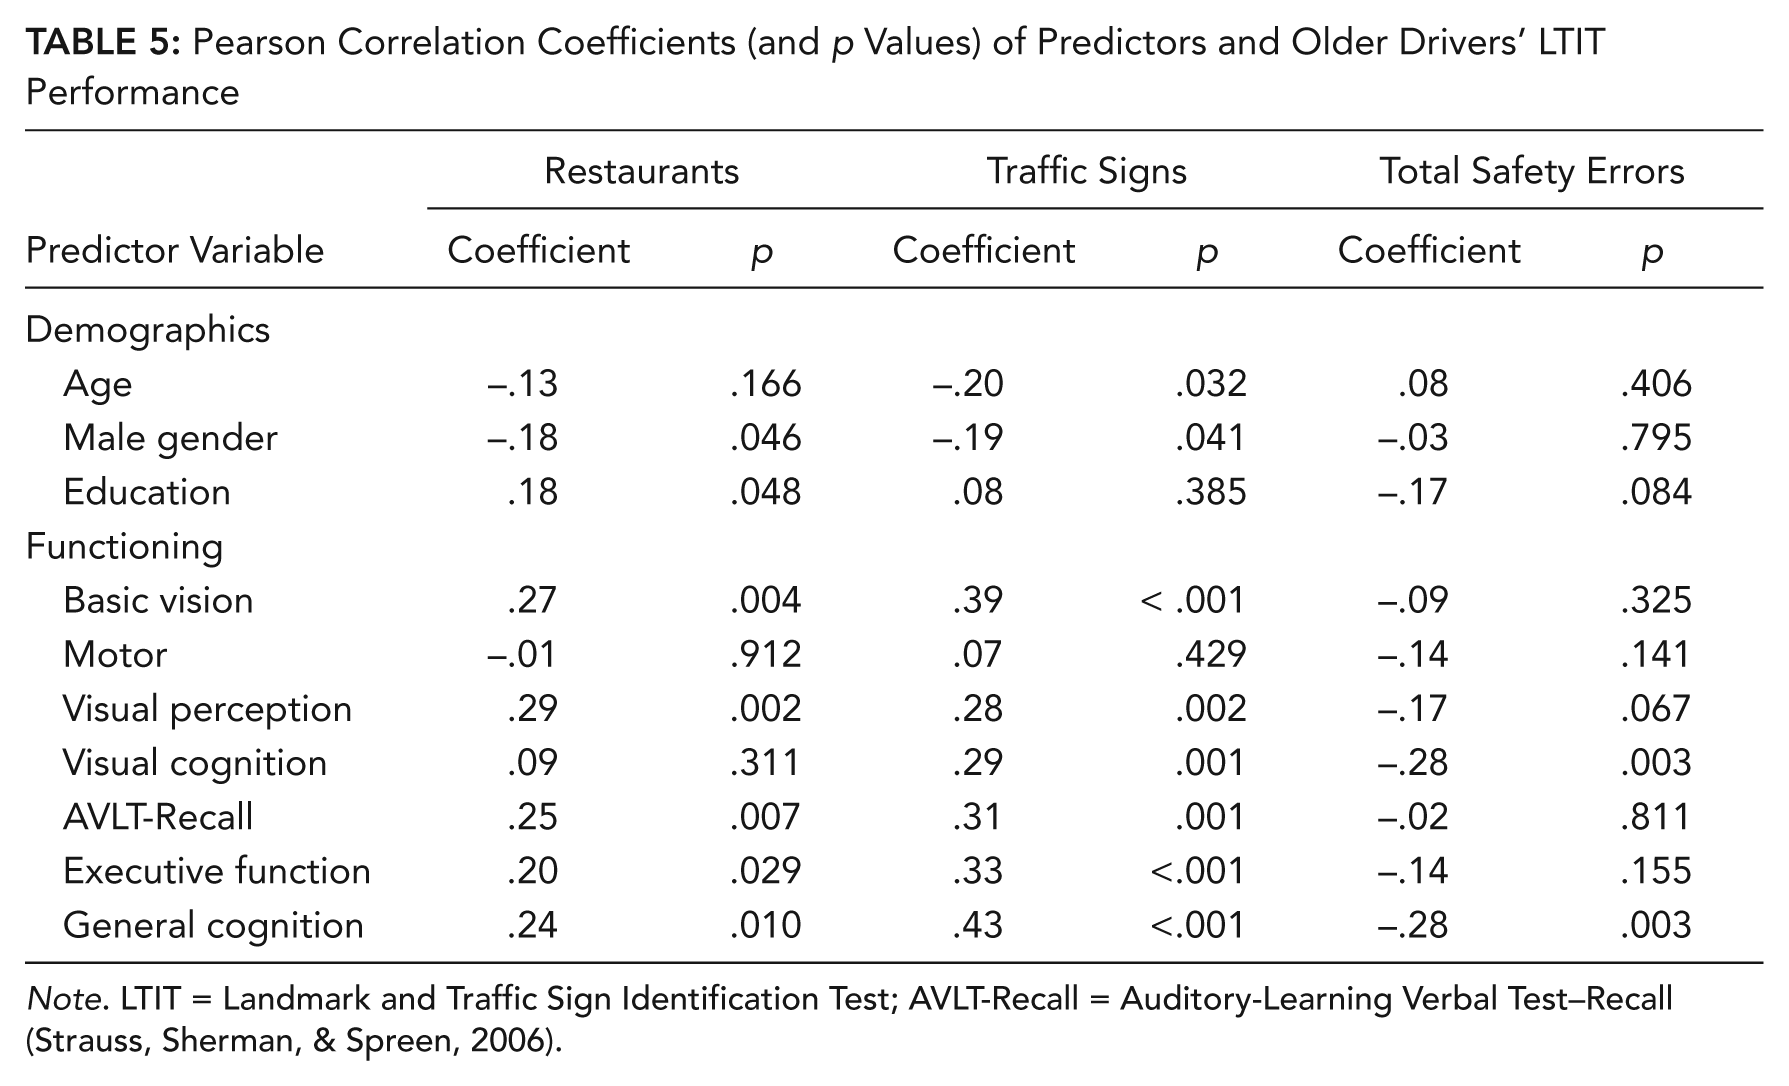
Note. LTIT = Landmark and Traffic Sign Identification Test; AVLT-Recall = Auditory-Learning Verbal Test–Recall (Strauss, Sherman, & Spreen, 2006).
Standardized Beta Values and p Values from the Final Equation in Multivariate Least Square Regressions

Note. LTIT = Landmark and Traffic Sign Identification Test; AVLT-Recall = Auditory-Learning Verbal Test–Recall (Strauss, Sherman, & Spreen, 2006). A dash indicates the predictor was not selected for entry in the stepwise procedure; N/A indicates the specified predictor was not considered in a given regression equation. The overall regressions were significant, F(4, 105) = 4.97, p = .001, with adjusted total R2 = .13, for restaurant identification; F(6, 103) = 6.48, p < .001, with adjusted total R2 = .23, for traffic sign identification; and F(4, 105) = 2.91, p = .025, with adjusted total R2 = .07 for safety errors.
The findings show that although functioning in basic vision predicted both restaurant and sign identification, it did not predict safety errors on the road. Men in general performed worse than women in restaurant and sign identification. Importantly, functioning in visual cognition predicted unique variability in both sign identification and safety errors over and above basic vision. In addition, functioning in executive function predicted unique variability in sign identification.
Discussion
Motor vehicles are the most common form of transportation for individuals older than 65 years (Kostyniuk & Shope, 1999), and the safety behavior of these drivers is important to all road users. We considered the possibility that distraction from naturalistic secondary tasks inherent to safe driving, such as identifying landmarks and traffic signs, may be more challenging for older drivers than for middle-aged drivers and asked whether motor and cognitive functioning could predict performance in both driving safety and secondary task performance over and above basic vision for older drivers (Duchek et al., 2003; Fildes, Fitzharris, Charlton, & Pronk, 2001; Hills, 1980; Rizzo, 2011; Shinar & Schieber, 1991).
Older drivers performed worse than middle-aged drivers in landmark identification and concurrent safety errors but were comparable in traffic sign identification. They also drove at slower speeds and showed lower average lateral and longitudinal accelerations. Even though those differences would appear to favor safer driving, older drivers still committed more safety errors. Those findings are similar to a recent study of performance differences in a closed-road circuit (Chaparro, Wood, & Carberry, 2005). In that small sample study of younger and older adults, findings showed that older drivers identified significantly fewer signs, hit more road hazards, misjudged more gaps, and increased their time to complete the course in dual-task (visual and auditory) conditions than otherwise. The older participants also drove slower than the younger drivers, particularly in the visual dual-task condition.
In the real-world setting of the current study, we also found that none of the mean performance differences between age groups could be accounted for by familiarity with or greater exposure to roadway hazards or average speed during the road segment, as multivariate models showed that age group remained a significant predictor in the last step of the regressions. Furthermore, the pattern of interactions of age group with familiarity and exposure indicated that these factors helped explain performance differences within the middle-aged but not the older adults. For example, middle-aged adults who reported being not familiar with the area identified fewer restaurants compared with middle-aged adults who reported being familiar or somewhat familiar with the area. Surprisingly, middle-aged adults who reported greater exposure, indexed by miles and days driven, committed more safety errors than did middle-aged adults with lower levels of exposure. This finding may suggest greater tolerance for risky driving behavior among middle-aged adults with greater exposure and functional abilities to compensate for roadway hazards. However, benefits of familiarity or greater exposure were not evident for older adults. Also, slowing of speed improved landmark identification for middle-aged and older adults, yet greater slowing of speed for older adults did not differentially benefit their LTIT performance.
The findings suggest that familiarity and greater exposure to road hazards did not mitigate performance decrements in older drivers. Of note, the safety errors observed during LTIT did not primarily involve errors, such as rolling stops, that are generally not critical to safety. Instead, common errors included lane observance, lane change, speed control, turns, and turn signaling. Although statistical effect sizes ranged from modest to moderate for performance decrements, the practical significance of one more error per mile may appear small. However, the real-world consequences of those decrements may be important, depending on context and timing. The LTIT constituted only a 1.5-mile segment, and larger performance differences should be evident on longer drives.
Earlier findings in our study sample of healthy older adults showed that they performed better and committed fewer safety errors during LTIT compared with drivers with neurological diseases of the elderly (Uc et al., 2006; Uc, Rizzo, Anderson, Shi, & Dawson, 2005a, 2005b). Together with the finding from the current report that those healthy adults performed worse than their middle-aged counterparts, paradigms such as LTIT may be useful components to design of future on-road tests that discriminate between safe and unsafe elderly drivers. The findings also inform clinical recommendations for mitigating specific trouble spots in real-world driving, such as development of training programs including competent use of GPS devices to support safe wayfinding by older drivers.
The pattern of predictions of older drivers’ safety and secondary task performance is in broad agreement with reports that cognitive functioning helps discriminate among older drivers over and above basic vision (e.g., Aksan et al., 2012; Anstey & Wood, 2011; Ball et al., 2006; Dawson et al., 2010). Although the road segment analyzed in the current study was relatively brief (only 1.5 miles long, lasting 3 to 7 min), the naturalistic distraction paradigm could efficiently probe differences between healthy older adults and their middle-aged counterparts as well as discriminate between drivers with and without neurological disease.
In the bivariate setting, both overall cognitive functioning and several specific cognitive dimensions predicted LTIT performance. Lower-order visual processing (e.g. UFOV, JLO) and executive function predicted all three performance outcomes. Higher-order visual cognition, including visuospatial construction and memory, predicted traffic sign identification and safety. In the multivariate setting, visual cognition predicted performance in both safety errors and traffic sign identification, and executive function emerged as a predictor of traffic sign identification over and above vision. Motor functioning failed to predict either in the bivariate or the multivariate setting. This finding is consistent with observations in recent reviews that the added contribution of motor functioning to driver safety in advancing age appears to be the most tenuous or the least consistent across studies (Anstey et al., 2005).
The current findings point to two challenges that face empirical models of older-driver safety. First, we need creative ways of implementing and quantifying performance in specific driving tasks, typically tested in simulator studies, in the real world. Challenges of vehicle control and safety, such as headway maintenance, lane observance, speed control, lane changes, gap judgments during distraction, wayfinding, left turns, and merges, must be quantified and described in comparable frameworks in both platforms. Note that standard on-road tests in instrumented vehicles may present challenges to drivers that they normally avoid; naturalistic studies involving event recorders that collect key vehicle and video data from participants’ own cars for several weeks are an increasingly viable alternative (Rizzo, 2011; Thompson, Read, Anderson, & Rizzo, 2011).
Second, studies are needed that identify domains of motor and cognitive functioning that are particularly relevant to older drivers’ safety. The evidence can help clinicians and policy makers develop more fair and accurate criteria for advising and assisting older drivers. Guidelines would be most useful if they offer clinicians flexibility in assessing patients with tests available and familiar to them and if they offer recommendations for driving cessation, curtailment, rehabilitation, and further testing early in the course of aging declines—before fatal crashes occur. An example of such empirical efforts for specifying domains of cognitive functioning is a recent large-sample study by Anderson et al. (2012) involving confirmatory factor analytic methods to specify relevant domains of cognitive functioning, such as memory, speed of processing, and visuospatial construction. They showed that a subset of tests from each cognitive domain recovered correlations with driver safety similar in magnitude to the complete battery of tests. This approach permits clinicians to select from among various widely available standardized tests to assess driver safety risk.
Conclusions
Cognitive aging is associated with declines in many of the functions necessary for safely operating a motor vehicle (Anderson, Rizzo, Shi, Uc, & Dawson, 2005; LaPointe, Stierwalt & Maitland, 2010; Rizzo, 2011). Healthy older adults struggled with the naturalistic secondary task of searching for roadside targets and committed more concurrent driving safety errors compared with their middle-aged counterparts. These performances were predicted by age-related cognitive decline, over and above the effects of vision, and the performance decrements were not offset by familiarity with the roadway or slower speed. Including naturalistic secondary tasks inherent to driving as part of on-road tests of older drivers’ safety may increase the precision of on-road tests that can discriminate among safe and unsafe older drivers.
Key Points
A total of 120 older and 83 middle-aged drivers participated in an on-road test of performance differences during a naturalistic distraction paradigm of searching for roadside targets while driving through a commercial strip.
Older drivers identified fewer landmarks, drove slower, and committed more safety errors compared with middle-aged drivers.
Greater familiarity benefited middle-aged but not older adults’ performance.
Cognitive functioning, particularly, executive function and visual cognition, predicted driver performance over and above vision among healthy older adults.
Results have implications for design of on-road tests for older drivers and support cognitive testing.
Footnotes
Acknowledgements
This research was supported by National Institutes of Health R01 Grants AG17177, AG026027, and NS044930.
Nazan Aksan received her PhD in psychology from University of Wisconsin-Madison in 2001.
Jeffrey D. Dawson received his ScD in biostatistics from Harvard University in 1991.
Jamie L. Emerson received her BA in psychology from DePauw University in 2008.
Lixi Yu received her MS in Biostatistics from University of Iowa in 2012.
Ergun Y. Uc received his MD from University of Istanbul in 1988.
Steven W. Anderson received his PhD in clinical psychology from University of Iowa in 1987.
Matthew Rizzo received his MD from Johns Hopkins University in 1979.