
Abstract
Objective:
The aim of this study was to examine whether the Situation Present Assessment Method (SPAM) and the Situation Awareness Global Assessment Technique (SAGAT) predict incremental variance in performance on a simulated submarine track management task and to measure the potential disruptive effect of these situation awareness (SA) measures.
Background:
Submarine track managers use various displays to localize and track contacts detected by own-ship sensors. The measurement of SA is crucial for designing effective submarine display interfaces and training programs.
Method:
Participants monitored a tactical display and sonar bearing-history display to track the cumulative behaviors of contacts in relationship to own-ship position and landmarks. SPAM (or SAGAT) and the Air Traffic Workload Input Technique (ATWIT) were administered during each scenario, and the NASA Task Load Index (NASA-TLX) and Situation Awareness Rating Technique were administered postscenario.
Results:
SPAM and SAGAT predicted variance in performance after controlling for subjective measures of SA and workload, and SA for past information was a stronger predictor than SA for current/future information. The NASA-TLX predicted performance on some tasks. Only SAGAT predicted variance in performance on all three tasks but marginally increased subjective workload.
Conclusion:
SPAM, SAGAT, and the NASA-TLX can predict unique variance in submarine track management performance. SAGAT marginally increased subjective workload, but this increase did not lead to any performance decrement.
Application:
Defense researchers have identified SPAM as an alternative to SAGAT because it would not require field exercises involving submarines to be paused. SPAM was not disruptive, but it is potentially problematic that SPAM did not predict variance in all three performance tasks.
Keywords
Introduction
Situation awareness (SA) is essential for effective decision making in complex work systems. Although SA has been formally defined in many ways, Endsley’s (1988) definition—“the perception of elements in the environment within a volume of time and space, the comprehension of their meaning, and the projection of their status in the near future” (p. 97)—is the most cited. Put simply, SA represents an operator’s understanding of the task and his or her ability to anticipate the future consequences of task events or actions. A number of different tools have been used to measure operator SA in task domains as diverse as air traffic control (ATC; Durso et al., 1998), piloting (Jones & Endsley, 1996), surgery (Manzey et al., 2011), and process control (Tharanathan, Bullemer, Laberge, Reising, & Mclain, 2012).
Another task domain where it is essential to measure SA is submarine track management. Submarine track managers localize and track contacts detected by own-ship sensors. Gaining an unobtrusive measure of SA that can predict performance is crucial for evaluating submarine display interface designs and training programs. The Situation Awareness Global Assessment Technique (SAGAT; Endsley, 1995) is the most validated and publicized SA measure. However, both U.S. and Australian Defense Departments have identified the Situation Present Assessment Method (SPAM; Durso & Dattel, 2004) as a potential alternative because, unlike SAGAT, it does not require submarine task operations to be paused (i.e., it would be difficult to freeze a large-scale simulation or field exercise involving submarines).
We developed a submarine track management simulation, and SA questions, based on a goal-directed task analysis conducted with Royal Australian Navy submariners. The first aim was to examine whether SPAM and SAGAT could predict incremental variance in performance after controlling for subjective measures of SA (Situation Awareness Rating Technique; SART) and workload (NASA Task Load Index [NASA-TLX], Air Traffic Workload Input Technique [ATWIT]). If adding SPAM or SAGAT to hierarchical regression models increases the variance in performance explained, then this would indicate that SAGAT and SPAM can provide predictive information not contained in subjective measures. Practically speaking, it is crucial that SPAM and SAGAT can demonstrate this incremental predictive validity, because there is no doubt that subjective SA and subjective workload measures are more cost-effective than SPAM or SAGAT.
One additional potential problem, however, is that either SPAM or SAGAT may impose measurement effects, such as additional cognitive loading. The second aim was to examine whether SPAM or SAGAT increased subjective workload or interfered with performance. Although there is no prior evidence that SAGAT impacts subjective workload or performance, there are mixed findings regarding the effects of SPAM on subjective workload and performance (e.g., Durso, Bleckley, & Dattel, 2006; Pierce, 2012), although most of these prior studies have been conducted in simulated ATC settings.
Domain Background and Simulation
The task of determining the range, course, and speed of contacts in a submarine where the primary sensor is passive sonar is called target motion analysis (Kirschenbaum, 2011). When something makes noise underwater, that noise is picked up by hydrophones, processed by electronics, and monitored by a sonar technician. The track manager employs various techniques to compile a tactical picture. This tactical picture is composed of contact tracks plotted in accordance to the bearing, range, and speed of contacts and to the likely geospatial position of contacts in relation to own-ship position and strategic landmarks. The tactical picture is communicated by the track manager to the officer of the watch, who can order the submarine to maneuver to obtain additional sonar information. The officer of the watch decides when the “solution” is sufficiently accurate for the task at hand, which can include surfacing, submarine warfare, intelligence gathering, aircraft carrier protection, or blockading.
Our simulation focused on the track manager. Participants interacted with two displays. The left monitor presented a tactical display, and the right monitor presented a sonar bearing history or “waterfall” display (see Figure 1). The contact classification task required participants to judge how long each contact spent inside landmarks and how many times a contact abruptly changed direction. A second task required participants to monitor changes in track gradient on the waterfall display and changes in contact headings on the tactical display in order to determine the closest point of approach (CPA) of contacts. The emergency surface task required participants to integrate information from both these aforementioned tasks to determine when the submarine could safely surface. The simulation emulated the requirement to track the cumulative behavior of contacts, but for military security reasons, we could not simulate the uncertainty in the position of contacts provided by passive sensors.
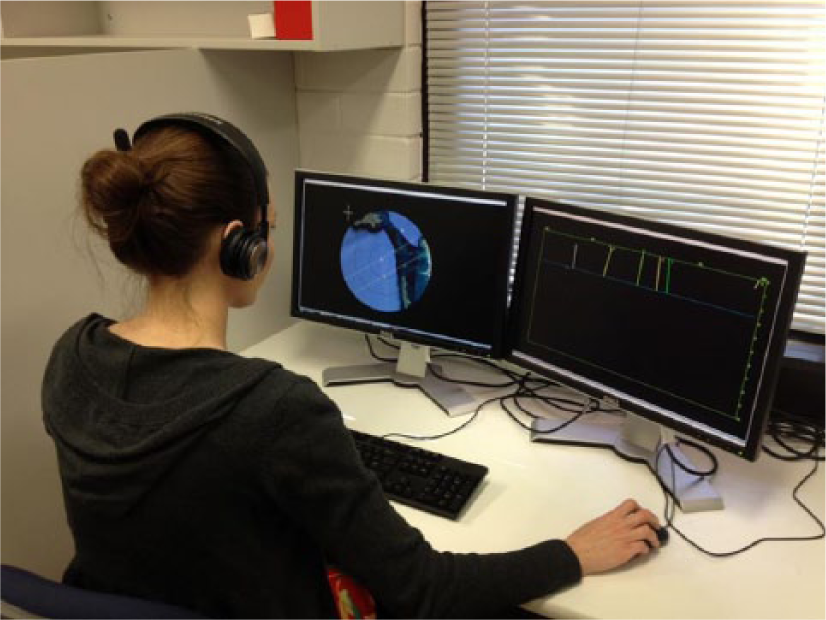
Photograph showing the experimental setup. The left monitor shows the tactical display, and the right monitor shows the waterfall display. Participants wore headphones throughout the experiment and responded with a combination of mouse and keyboard entries.
Incremental Predictive Validity of SPAM and SAGAT
SPAM presents queries one at a time and in real time without blanking task displays. SPAM distinguishes workload from SA by warning the operator that a query is ready. The time taken for the individual to accept the SPAM query is referred to as “SPAM accept response time [RT]” and often correlates with subjective workload (Strybel, Vu, Kraft, & Minakata, 2008; Vu et al., 2012). The accuracy or time taken to then answer the SPAM query reflects SA (Durso & Dattel, 2004), and several studies have shown that these SPAM measures correlate with performance (Bacon & Strybel, 2013; Loft, Morrell, & Huf, 2013; Vu et al., 2012). In addition, SPAM has been shown to predict variance in ATC performance after controlling for cognitive variables, such as working memory (Durso et al., 2006) or after controlling for subjective workload (Durso et al., 1998).
SAGAT suspends the task and blanks the display while the operator responds to multiple SA queries, with the accuracy of responses reflecting SA (Endsley, 1995). SAGAT has been shown to correlate with performance (Jones & Endsley, 2004; Salmon et al., 2009; Sulistyawati, Wickens, & Chui, 2011) and to be sensitive to manipulations of task demand (Jones & Endsley, 2004), display design (Tharanathan et al., 2012), and automation (Manzey et al., 2011). In addition, SAGAT has been shown to predict variance in ATC performance after controlling for subjective workload (Durso et al., 1998).
If SPAM truly allows workload and SA to be distinguished, we should find that SPAM accuracy, or SPAM RT, can predict performance after statistically controlling for SPAM accept RT. In addition, we examined whether SPAM and SAGAT predicted variance in performance after controlling for SART, ATWIT, and the NASA-TLX. To our knowledge, no authors of prior studies, in any task domain, have examined whether SPAM or SAGAT can predict performance after controlling for all three of these subjective workload and SA measures.
The Disruptive Effects of Situation Awareness Measurement
In simulated ATC and piloting, SPAM has been shown to either have no effect on performance (Bacon & Strybel, 2013; Durso et al., 2006; Morgan, Chiappe, Kraut, Strybel, & Vu, 2012) or to temporarily degrade performance (Pierce, 2012; Strybel et al., 2008). No studies have reported any effect of SAGAT on performance (e.g., Endsley, 1995, 2000; Strybel et al., 2008). SPAM administration may have been disruptive because participants needed to assimilate the mismatch between pre- and postinterruption display scenes (St. John & Smallman, 2008; Tremblay, Vachon, Lafond, & Kramer, 2012). For example, in the ATC study in which SPAM negatively impacted performance (Pierce, 2012), the positions of aircraft may have significantly evolved during the time when SPAM queries were posed and answered. In contrast, in track management, the position of contacts changes very little during the time a SPAM query is posed because of the slow-evolving nature of the task. Thus, it was not clear whether SPAM would impact performance in the current study. To date, no studies have reported any effect of SPAM or SAGAT on postscenario subjective workload. In addition to examining postscenario workload (NASA-TLX), we used the ATWIT to examine whether subjective workload increased immediately after a SPAM or SAGAT query administration.
Method
Participants
Undergraduates (N = 171; 119 female; mean age = 21.24) from the University of Western Australia participated for course credit.
Submarine Track Management Simulation
Participants observed and interacted with two 22-in. monitors (Figure 1). The left monitor presented a tactical display and the right monitor a waterfall display (see Figure 2). There were two practice scenarios (Fremantle coastal map) and three experimental scenarios (Exmouth, Broome, and Cockatoo Island coastal maps).
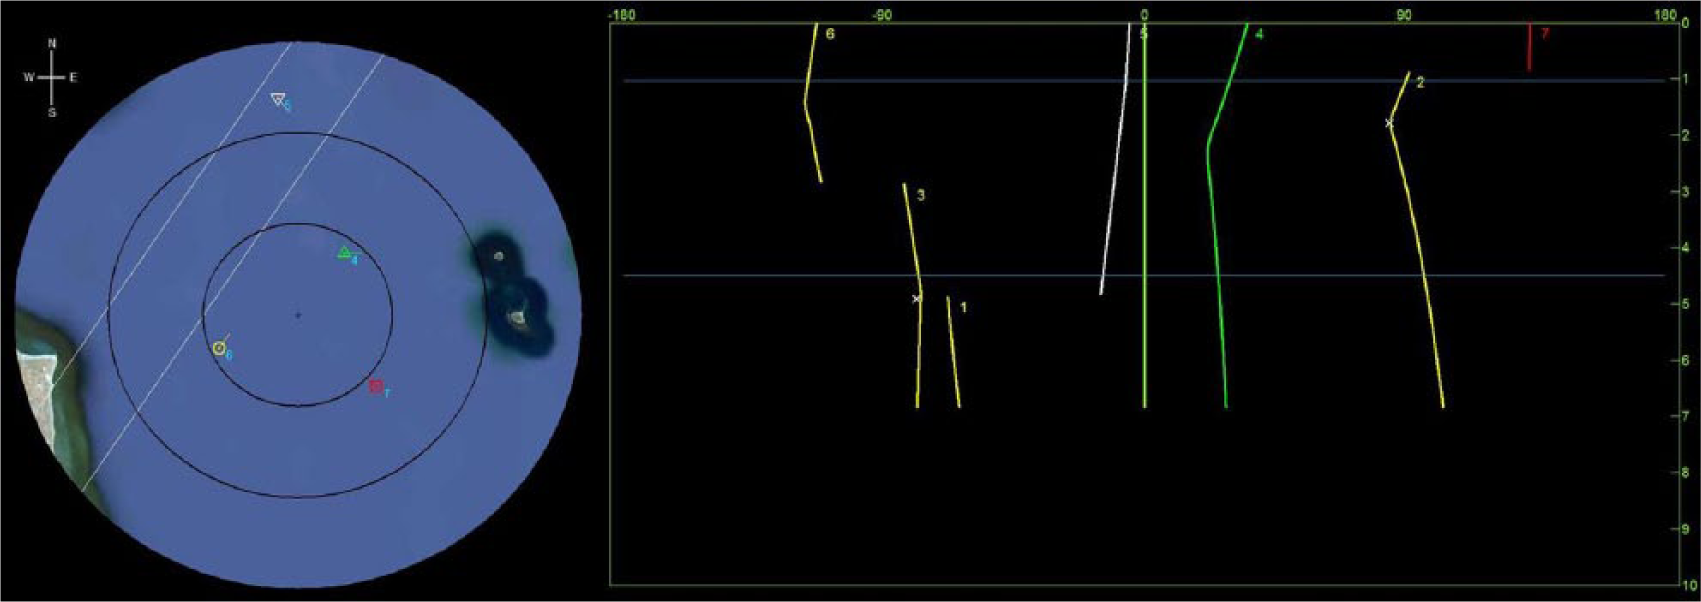
The left image is the tactical display, and the right image shows the waterfall display. On the tactical display, the concentric rings indicate the distance from own ship in the center of the screen. The rings extend in 5-km increments. The parallel white lines indicate a shipping lane. Four contacts are displayed in this figure: The red square indicates a contact that has been classified as an enemy, the green triangle is a friendly, the white inverted triangle is a merchant, and the yellow circle has yet to be classified. The lines projecting from the center of each icon indicate the current heading of each contact, and the numbers indicate which contact each is. The waterfall display has the angle relative to own ship on the x-axis and the time elapsed in minutes on the y-axis. Each contact track is numbered, and the color matches the classification given to the contact. Participants can mark the closest point of approach with a small white x and can mark horizontal blue lines to keep track of timing. When a contact abruptly moves off the screen (e.g., Vessel 3), the track terminates.
Contact classification task
Participants classified contacts presented on tactical display as “friendly,” “enemy,” or “merchant.” To be classified as friendly, the contact must have remained within 5 km of own ship for at least 4 min. To be classified as enemy, the contact must have zigged three times within a 6-min period (a zig was an angular change in direction of at least 45°, performed over less than 30 s). To be classified as merchant, the contact must have remained within a shipping lane for at least 4 min. To assist with tracking time, the y-axis of the waterfall display indicated the time elapsed. By clicking on the waterfall display, participants could leave a horizontal line to denote the beginning or end of a contact behavior. Participants could determine which waterfall track belonged to which contact by checking the contact number.
Participants used the mouse to select a contact and then entered a classification with the keyboard (F for friendly, E for enemy, and M for merchant). The icon on the tactical display then changed from a yellow circle to green triangle for friendly, red square for enemy, or inverted white triangle for merchant, and the associated track on the waterfall display changed from a yellow line to the classified contact color.
During each scenario, there were a total of nine contacts that remained on the tactical display long enough to be classified. These contacts were on screen for 8 min each. There were always four contacts on the tactical display. Every 2 min, a contact would “abrupt out” (disappear from the tactical display and cease to be updated on the waterfall display), and a new unclassified contact would abrupt in. Contact movement on the display was constant at 30 km/h, and position/heading was updated every 0.25 s. Own ship remained stationary.
CPA task
A CPA was the point where the radial distance between a contact and own ship changed from decreasing to increasing. Participants marked CPAs by clicking the CPA on the contact waterfall display track (see Figure 2). There were between 9 and 12 CPAs in each scenario.
Emergency surface task
Participants indicated that the submarine could safely surface by pressing S. Each scenario lasted 24 min, and within each scenario, there was a single 2- to 3-min window when the emergency surface conditions were satisfied: no unidentified or enemy vessels within 5 km of own ship and at least one CPA occurring within the last 5 min.
SA Measurement
SPAM
There were 160-s, 220-s, or 280-s delays between SPAM queries delivered over the headphones. Each query began with a ready prompt (“Are you ready for a question?”), and participants were told to accept the SPAM query when ready by pressing Y, after which the SPAM query was delivered. Participants were told to then answer the SPAM query as quickly and as accurately as possible by pressing numeric keys (0–9), Y for yes, or N for no. As shown in Table 1, participants were presented with three SPAM queries relating to past events and three SPAM queries relating to current/future events per scenario.
SPAM and SAGAT Queries

Note. SAGAT = Situation Awareness Global Assessment Technique; SPAM = Situation Present Assessment Method.
SAGAT
The SAGAT procedure was based on recommendations by Jones and Kaber (2005). The simulation was paused and the screen blanked four times per scenario, and participants were presented six SAGAT queries each pause. First, a blank tactical display was presented, and participants were asked to “place vessel X on the screen.” This query was always presented first. At each freeze, participants were then presented five additional SAGAT queries from the pool of queries presented in Table 1. A subset of SAGAT queries was identical to SPAM queries. Five of the SAGAT queries concerned past events, and six concerned current/future events.
SART
Following each scenario, participants completed the 10-dimension paper-based SART. Participants rated (a) the demands on their resources, (b) their supply of resources, and (c) their understanding of the situation. A SART score provided a measure of subjective SA [SA = Understanding – (Demand-Supply)] (Selcon & Taylor, 1990).
Workload Measurement
NASA-TLX
The NASA-TLX was administered after each scenario. Participants made magnitude of workload ratings on six 20-point scales: Mental Demand, Physical Demand, Temporal Demand, Performance, Effort, and Frustration. After each scenario, participants completed 15 pairwise scale comparisons for each task, rating which source of workload (e.g., mental demand vs. frustration) contributed most to their workload for that task. These pairwise comparisons provided the unique relative weighting for each scale. Participants’ overall NASA-TLX score was determined by multiplying the magnitude of workload ratings for each scale by the corresponding workload weighting for the corresponding scale, adding the values for all the scales together, and then dividing the total by 15 (see Hart & Staveland, 1988).
ATWIT
The ATWIT prompted participants to indicate their workload on a 10-point scale (Stein, 1985). ATWIT was delivered four times during each scenario, either 15 s before a SAGAT query set or 15 s after a SAGAT query set. ATWIT was also delivered 15 s before or after a SPAM query. To ensure ATWIT could not be used to predict that SPAM or SAGAT would follow, ATWIT was not presented before every SPAM or SAGAT query. Specifically, ATWIT probes were presented before (and after) two of the six SPAM queries and before (and after) two of the four SAGAT query sets.
Procedure
The experiment was conducted over 2 days (with 1-day separation). A 2-hr training session on Day 1 introduced participants to the task, starting with a 30-min computer-driven training presentation. Task instructions emphasized the importance of accuracy on the classification, CPA, and emergency surface tasks over the speed of the response. Following this, participants completed two practice scenarios (Fremantle map) for which they received feedback on their accuracy on the three tasks. One practice scenario contained SAGAT queries and one SPAM queries. Both practice scenarios included the NASA-TLX, ATWIT, and SART. On Day 2, participants received a 10-min refresher presentation and completed the three experimental scenarios (counterbalanced order), again receiving feedback regarding their accuracy on the three tasks after each scenario. In one scenario, participants responded to SPAM queries. In another scenario, participants responded to SAGAT queries. In a third scenario, participants were not presented with SPAM or SAGAT queries (control condition). NASA-TLX, ATWIT, and SART were administered for all experimental scenarios. The assignment of the three experimental scenarios (Exmouth, Broome, and Cockatoo Island) to condition (SPAM, SAGAT, and control) was counterbalanced.
Results
RTs more than 2.5 standard deviations from a participant’s mean were excluded. This process resulted in one data point from each of 2 participants being trimmed for the classification task. The distribution of RTs for SPAM and the three tasks invited a logarithmic transformation.
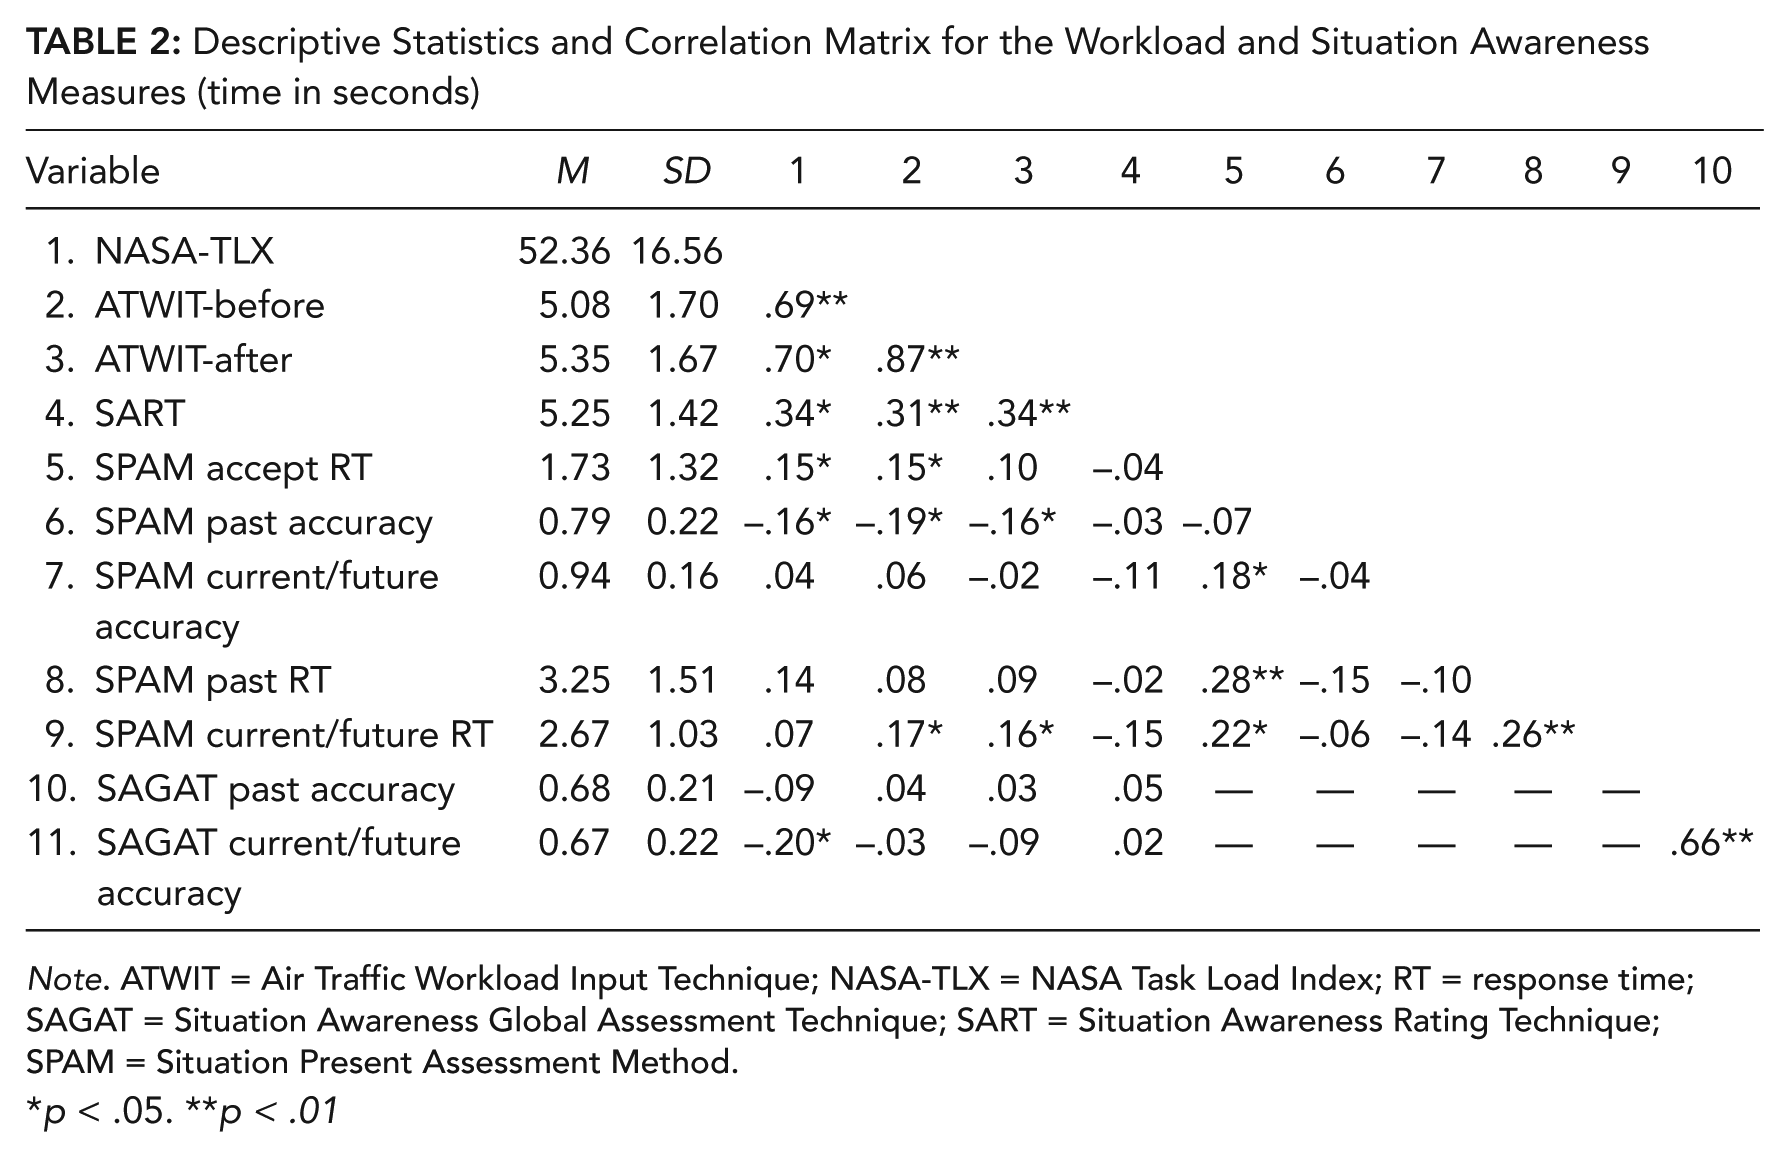
Descriptive statistics and the correlation matrix for the workload and SA measures are presented in Table 2. SPAM accept RT was the time taken for the individual to accept the SPAM query. SPAM RT was then measured from the onset of the query until the participant responded (correct responses only). Participants made more accurate, and faster, responses to SPAM current/future queries compared to SPAM past queries, t(170) = 7.54, p <.001, d = .78, and t(167) = 4.65, p <.001, d = .45, respectively. There was no difference between SAGAT past accuracy and SAGAT current/future accuracy, t < 1.
Descriptive Statistics and Correlation Matrix for the Workload and Situation Awareness Measures (time in seconds)
Note. ATWIT = Air Traffic Workload Input Technique; NASA-TLX = NASA Task Load Index; RT = response time; SAGAT = Situation Awareness Global Assessment Technique; SART = Situation Awareness Rating Technique; SPAM = Situation Present Assessment Method.
p < .05. **p < .01
Neither SPAM nor SAGAT significantly correlated with SART. SART moderately positively correlated with ATWIT and the NASA-TLX, and ATWIT and the NASA-TLX were highly positively correlated. SPAM past accuracy and SPAM current/future accuracy were not correlated, and the two SPAM RT measures were only moderately correlated. In contrast, a strong positive correlation was found between SAGAT past accuracy and SAGAT future accuracy. There are several other weak to moderate correlations in Table 2, the most notable that objective SA, as measured by SPAM or SAGAT, decreased as subjective workload increased, yet participants reported increased subjective SA when their subjective workload increased.
Incremental Predictive Validity
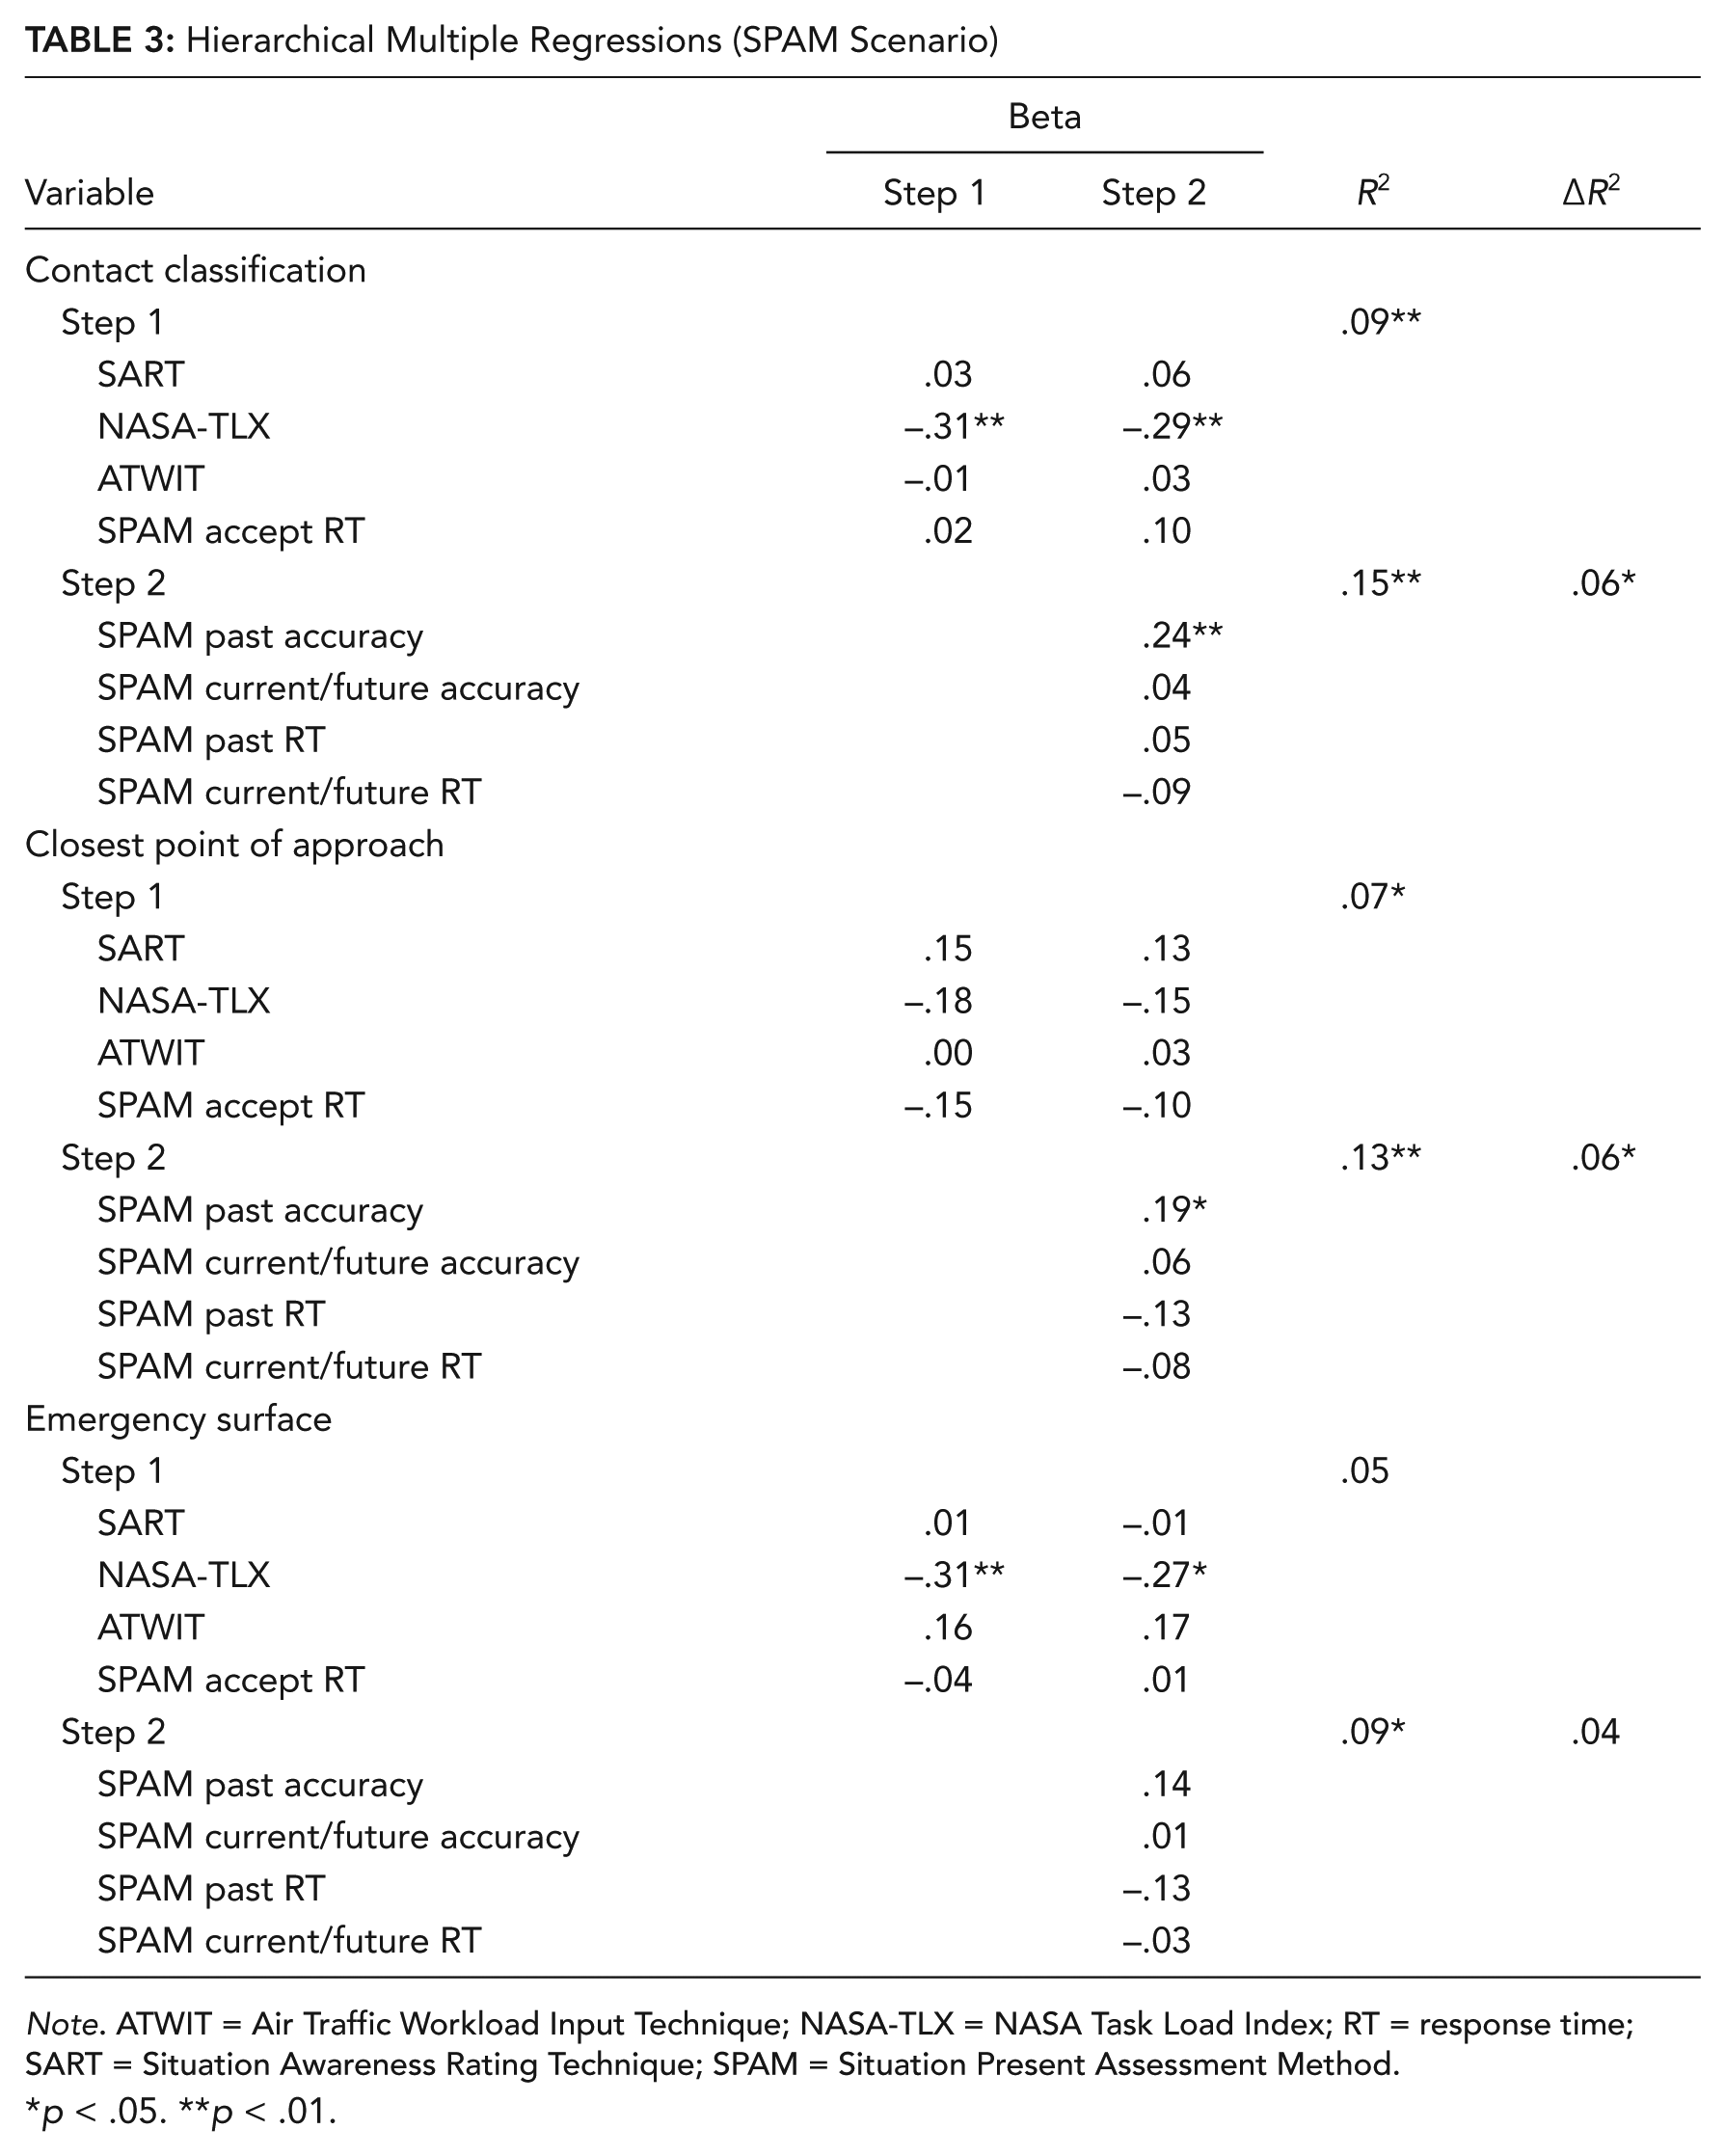
Hierarchical multiple regressions were conducted to examine the extent to which SPAM (Table 3) and SAGAT (Table 4) predicted incremental variance in task accuracy. At Block 1 (the control model) we entered SART, ATWIT, and the NASA-TLX. For SPAM scenarios, SPAM query accept time was also entered in the control model. At Block 2 (the SPAM model or SAGAT model), we entered the relevant SPAM or SAGAT measures.
Hierarchical Multiple Regressions (SPAM Scenario)
Note. ATWIT = Air Traffic Workload Input Technique; NASA-TLX = NASA Task Load Index; RT = response time; SART = Situation Awareness Rating Technique; SPAM = Situation Present Assessment Method.
p < .05. **p < .01.
Hierarchical Multiple Regressions (SAGAT Scenario)

Note. ATWIT = Air Traffic Workload Input Technique; NASA-TLX = NASA Task Load Index; SAGAT = Situation Awareness Global Assessment Technique; SART = Situation Awareness Rating Technique.
p < .05. **p < .01.
Contact classification
The classification hit rate was .75 (SD = .22). For SPAM scenarios, the control model was significant and accounted for 9% of variance in classification, with the NASA-TLX a significant predictor. The SPAM model accounted for an additional 6% of variance, with the NASA-TLX and SPAM past accuracy significant predictors.
For SAGAT scenarios, the control model was significant and accounted for 8% of variance in classification, with the NASA-TLX a significant predictor. The SAGAT model accounted for an additional 16% of variance, with the NASA-TLX and SAGAT past accuracy significant predictors.
CPA
To be scored as correct, participants needed to mark CPAs on the waterfall display within ±5° on the x-axis and ±0.4 min on the y-axis from the position that the CPA occurred. The hit rate was .56 (SD = .24). CPAs marked outside this area were false alarms, and the false alarm rate was .04 (SD = .03). D prime was then calculated as a measure of sensitivity and was used as the criterion for regression. For SPAM scenarios, the control model was significant and accounted for 7% variance in CPA, but no predictors reached significance. The SPAM model accounted for an additional 6% variance, and SPAM past accuracy was the only significant predictor.
For SAGAT scenarios, the control model was significant and accounted for 5% of the variance in CPA, with the NASA-TLX a significant predictor. The SAGAT model accounted for an additional 10% of variance and SAGAT past accuracy was a significant predictor.
Emergency surface task
This task was scored as correct if the surface recommendation was made during the correct time window. The hit rate was .75 (SD = .43). Participants made an average .58 (SD = .71) false alarms per scenario. To calculate emergency surface performance, we subtracted each participant’s false alarms from his or her correct responses. For SPAM scenarios, the control model was not significant. The SPAM model was significant and accounted for 4% additional variance, but the NASA-TLX (β = −0.27, p = .02) was the only significant predictor.
For SAGAT scenarios, the control model was not significant. The SAGAT model was significant and accounted for an additional 11% of variance, with SAGAT past accuracy a significant predictor.
For brevity, we have presented only the regression models for task accuracy and not correct RT. Accuracy is more relevant because the task instructions emphasized accuracy. Correct RTs to the three tasks were variable: classification task (M = 18.90, SD = 13.13), CPA task (M = 30.44, SD = 35.59), and emergency surface task (M = 33.91, SD = 41.48). SPAM past accuracy and SAGAT past accuracy both predicted 6% variance in classification RT (over and above subjective SA and workload) but did not predict CPA RT or emergency surface RT.
The Effect of SA Measurement on Subjective Workload
Subjective workload as a function of condition is presented in Table 5. NASA-TLX ratings were higher for the SAGAT compared to control condition (2.6% increase), t(170) = 3.04, p = .003, d = .17, and for the SAGAT compared to SPAM condition (1.59% increase), t(170) = 2.11, p = .04, d = .10, with no difference between the SPAM and control condition, t(170) = 1.21, p = .23.
Workload (NASA-TLX and ATWIT) as a Function of Situation Awareness Condition

Note. Standard deviations shown in parentheses. ATWIT = Air Traffic Workload Input Technique; NASA-TLX = NASA Task Load Index; SAGAT = Situation Awareness Global Assessment Technique; SPAM = Situation Present Assessment Method.
A 3 (condition: SPAM, SAGAT, control) × 2 (probe placement: before, after) repeated-measures ANOVA was conducted to determine whether SPAM or SAGAT increased subjective workload as measured by ATWIT. There were main effects of condition, F(2, 340) = 3.51, p = .02, and probe placement, F(1, 170) = 51.95, p < .001. These main effects were qualified by an interaction between condition and probe placement, F(2, 340) = 5.35, p = .03. There was no difference in the ATWIT-before score for the SPAM compared to control condition, t(170) = 1.16, p = .25; for the SAGAT compared to control condition, t < 1; or for the SPAM compared to SAGAT condition, t < 1. However, there was a significant difference in the ATWIT-after score for the SAGAT compared to control condition, t(170) = 4.16, p < .001, d = .20, and for the SAGAT compared to SPAM condition, t(170) = 2.61, p = .01, d = .14, but there was no difference between the SPAM and control condition, t(170) = 1.25, p = .21.
The Effect of SA Measurement on Performance
We compared performance for the SAGAT condition compared to the control condition, the SPAM compared to the control condition, and the SAGAT compared to the SPAM condition. There were no effects on accuracy, or RT for correct responses, for any of the three tasks (ts < 1).
General Discussion
To our knowledge, this is the first demonstration that SPAM or SAGAT can predict performance after controlling for both subjective ratings of SA (SART) and workload (NASA-TLX and ATWIT). On average across the three tasks, SPAM and SAGAT predicted 5.3% and 12.3% incremental variance in track management performance, respectively. SAGAT predicted significant variance in performance on all tasks, whereas SPAM was predictive of classification and CPA but not emergency surfacing. Convergent validity was found between the NASA-TLX and ATWIT workload measures, and both were correlated with SART (see Selcon, Taylor, & Koritsas, 1991). The NASA-TLX predicted classification performance after controlling for SPAM and SAGAT, and the NASA-TLX predicted emergency surface performance after controlling for SPAM.
SAGAT may have been a stronger predictor of performance than SPAM because the increased number of queries collected with SAGAT (4 times that of SPAM) provided a more stable SA measure. In line with this finding, SAGAT past accuracy and SAGAT current/future accuracy were strongly correlated (i.e., strong split-half reliability). It is the fact that SA is measured offline that allows more queries to be posed, and the subsequent increased reliability in SA measurement could be an important advantage in field exercises that would typically involve a smaller sample of submariners. The SAGAT query set also contained a greater variety of queries than SPAM, but in further analyses, we found that the pattern of hierarchal regression results were similar when we used only those queries common to both SAGAT and SPAM.
Accuracy was lower, and RTs longer, for past SPAM queries compared to current/future SPAM queries, suggesting that determining the past behavior of contacts was more difficult than determining the current/future behaviour of contacts. SPAM is based on the assumption that operators do not store SA information in memory; rather, they store where that information is located on the display and access it when needed. However, although display information would have been useful for answering SPAM past queries, participants likely needed to combine that display information with memory. For example, the SPAM past query “What was the latest vessel to be within 5 km of own ship?” requires the assessment of the current position of contacts but also possibly the assessment of previous contact movements. Given the importance of past SA for performance, participants may have preferred to store past SA information in memory. If so, it would make sense that SAGAT was the stronger predictor of performance because it more directly tapped this stored knowledge.
More generally, it makes intuitive sense that past SA, as measured by SPAM and SAGAT, was a much stronger predictor of performance than current/future SA. In contrast to tasks like ATC, where projecting the trajectory of “contacts” is crucial (see Loft, Bolland, Humphreys, & Neal, 2009), contacts on the track management display evolved slowly, and task decisions largely depended on the comprehension of cumulative contact behaviors. The use of SPAM measures alone would make it difficult to determine if past queries were most predictive because past information was crucial or because they were the only query type that relied at least somewhat on memory retrieval. SAGAT confirmed that the former explanation is correct, because all SAGAT queries relied on memory retrieval, and past SA was still the stronger predictor. If such a finding proves robust, then it may have implications for display design. That is, to assist performance in this task domain, we may need to develop systems that better assist memory (encoding or recall of display information).
SAGAT marginally increased subjective workload (average d = .19). After returning from SAGAT, it may have been difficult to reestablish the past behavior of contacts and to determine how this behavior related to the current position of contacts and current goals. However, the average time to complete a SAGAT query set was only 38 s, and Endsley (1995) reported that SAGAT could be collected for up to 6 min without memory decay problems. The extra workload may have instead been associated with carryover effects from the difficulty of completing the six-item SAGAT query set. Whatever the source, the increased workload with SAGAT is indicative of capacity utilized and, by inference, capacity remaining. Since workload overall was rated as moderate (as measured by the NASA-TLX and ATWIT), individuals may have responded to the marginal workload increase by changing their task strategies, without compromising performance (Loft, Sanderson, Neal, & Mooij, 2007).
The administration of SPAM did not impact subjective workload or performance. Many Royal Australian Navy submariners also noted that SPAM emulates the command team interactions in submarine control rooms where the officer of the watch solicits the track manager for tactical information (e.g., is the hostile submarine getting into a position from which it can attack a merchant ship?). However, it is potentially problematic that SPAM could not predict variance in all three tasks and predicted less than half the variance than SAGAT could predict.
The aforementioned conclusions notwithstanding, care must be taken when making generalizations to naval operations given we did not simulate contact uncertainty and that we used student participants. Although many previous SA studies have used student participants (e.g., Durso et al., 2006; Pierce, 2012), we do not dispute the potential problems in generalizing from naive participants to experts. Nevertheless, our simulation and SA queries were informed by observation of submarine combat systems and by submariner expert opinion. This method allowed us to construct a task that students could learn relatively quickly but was nevertheless representative of track management.
Although there are a number of different measurement tools available for practitioners to assess SA, there remains considerable debate over which measures are most appropriate for particular types of task contexts (Salmon, Stanton, Walker, & Green, 2006). Defense researchers have identified SPAM as an alternative to SAGAT because it does not require large-scale simulations or field exercise involving real submarines to be paused. SPAM was not disruptive, but SPAM did not predict variance in all three tasks.
Key Points
Submarine track managers localize and track contacts detected by own-ship sensors to compile a tactical picture using various displays. Situation awareness (SA) measurement is crucial for evaluating submarine displays and training programs.
The Situation Present Assessment Method (SPAM) and the Situation Awareness Global Assessment Technique (SAGAT) predicted variance in submarine track management performance after controlling for subjective measures of SA and workload.
SPAM predicted significant variance in performance for two out of three submarine track management tasks, whereas SAGAT was predictive of performance on all three tasks.
SA for past display information predicted performance, but SA for current/future display information did not. Performance in this task domain is largely dependent on the comprehension of cumulative contact behaviors.
Ratings of subjective workload were marginally increased after SAGAT administration but not after SPAM administration. However, neither SPAM nor SAGAT negatively impacted performance.
Footnotes
Acknowledgements
This research was supported by Research Funding Agreement No. 555370 from the Australian Defence Science and Technology Organisation and by Research Funding Agreement No. AOARD-12-4028 from the (U.S.) Asian Office of Aerospace Research and Development. We thank Daphne Tan for assistance in data collection and Bob Bolia, Peter Henley, Kate Ponton, Stephanie Chen, and Megan Schmitt for their assistance during various stages of the project.
Shayne Loft is an associate professor at the University of Western Australia. He received his PhD in experimental psychology in 2004 from the University of Queensland.
Vanessa Bowden is a postdoctoral research fellow at the University of Western Australia. She received her PhD in visual science in 2012 from the University of Western Australia.
Janelle Braithwaite is a PhD candidate at the University of Western Australia (Oceans Institute).
Daniel B. Morrell is a research fellow at the University of Western Australia. He received his master’s degree in organizational psychology in 2010 from the University of Western Australia.
Samuel Huf is a team leader of Submarine Human Systems and Analysis, Maritime Operations Division, at the Defence Science and Technology Organisation, Australia.
Francis T. Durso is a professor of psychology at the Georgia Institute of Technology. He received his PhD in cognitive psychology in 1980 from the State University of New York at Stony Brook.