
Abstract
Objective:
The objective of this article is to examine the extent to which interruptions negatively impact situation awareness and long-term performance in a submarine track management task where pre- and postinterruption display scenes remained essentially identical.
Background:
Interruptions in command and control task environments can degrade performance well beyond the first postinterruption action typically measured for sequential static tasks, because individuals need to recover their situation awareness for multiple unfolding display events. Participants in the current study returned to an unchanged display scene following interruption and therefore could be more immune to such long-term performance deficits.
Method:
The task required participants to monitor a display to detect contact heading changes and to make enemy engagement decisions. Situation awareness (Situation Present Assessment Method) and subjective workload (NASA–Task Load Index) were measured. The interruption replaced the display for 20 s with a blank screen, during which participants completed a classification task.
Results:
Situation awareness after returning from interruption was degraded. Participants were slower to make correct engagement decisions and slower and less accurate in detecting heading changes, despite these task decisions being made at least 40 s following the interruption.
Conclusion:
Interruptions negatively impacted situation awareness and long-term performance because participants needed to redetermine the location and spatial relationship between the displayed contacts when returning from interruption, either because their situation awareness for the preinterruption scene decayed or because they did not encode the preinterruption scene.
Application:
Interruption in work contexts such as submarines is unavoidable, and further understanding of how operators are affected is required to improve work design and training.
Keywords
An “interruption” refers to the suspension of one stream of work prior to completion, with the intent of returning to and completing the original stream of work (Boehm-Davis & Remington, 2009). Modern work environments are susceptible to interruptions due to their reliance on a range of information and communication technologies, frequent interpersonal communication, and multiple concurrent task demands. Understanding the processes by which humans manage interruptions is therefore crucial for ensuring workplace safety and efficiency. The majority of research has focused on the effects of interruptions on static sequential primary tasks (e.g., Tower of Hanoi task, VCR programming, trivia questions), which do not change during the interruption, and whereby participants need to remember to return to the correct point of a primary task sequence (for a review, see Trafton & Monk, 2007). Such research examines the time period immediately following the interruption—that is, the time participants take to return to the correct next step of the primary task (resumption time; e.g., Monk, Trafton, & Boehm-Davis, 2008) or whether participants remember to return to this next step of the primary task (e.g., Dodhia & Dismukes, 2009). After participants restart the primary subtask (usually in less than a few seconds), it is assumed that they have recovered from the interruption.
These task resumption metrics are not adequate indicators of interruption recovery in command and control (C2) environments, such as air traffic control and military settings, where operators are required to monitor and control multi-item spatial dynamic displays. In such work contexts, multiple display events have variable onsets and durations. The situational context unfolds over an extended period of time, and operators have multiple concurrent task goals. It is crucial that operators adequately understand the current overall state of the relevant elements of the spatial task environment and how these elements might change in the future; this is known as maintaining situation awareness (SA) (Endsley, 1988). Degraded SA can negatively impact how individuals prioritize attention, comprehend events, and predict the future, leading to possible long-term performance decrements. In line with this, two recent studies have demonstrated that interruption recovery in multi-item dynamic display tasks can extend well beyond the first postinterruption action. Tremblay, Vachon, Lafond, and Kramer (2012) found that task-monitoring effectiveness was impaired on a firefighting control task for up to 30 s following a 20-s interruption. Hodgetts, Vachon, and Tremblay (2014) found that participants’ decision-cycle times in an air combat control task were slower for up to 20 s following a 24-s interruption. In addition, Hodgetts et al. (2014) reported that eye fixations increased, and were shorter, for up to 40 s after interruptions, suggesting participants were updating their SA.
Participants in the Tremblay et al. (2012) and Hodgetts et al. (2014) studies likely needed to reinstate episodic primary task goals (i.e., “What was I about to do?” and “What was I doing?”), similar to interruption recovery for static tasks that cause short-term task resumption lags or errors (Trafton & Monk, 2007). In addition, the process of switching between tasks itself is likely to incur a cumulative response time (RT) overhead (Rogers & Monsell, 1995). However, as Tremblay et al. and Hodgetts et al. conclude, these explanations alone do not fully explain the long-term performance decrements. These authors concluded that the effects were also due to the need for participants to determine how the displays had changed during the interruption—that is, the need to assimilate the mismatch between their memory for the preinterruption scene and their current perception of the postinterruption display scene (St. John & Smallman, 2008).
We examined the extent to which interruptions can negatively impact long-term performance in a multi-item display task where the positions of items on the display during an interruption barely change position (see Figure 1). To do this, we used a simulated submarine track management task, because the submarine control room is a prototypical work environment where display elements move very slowly (Kirschenbaum, Schunn, & Trafton, 2014). Although there may be costs to performance associated with reinstating task goals or task switching, if participants retain their SA for the preinterruption display scene throughout the interruption, then track management should be relatively immune to the adverse effect of interruptions on long-term performance suggested by recent research, because the pre- and postinterruption scenes will be essentially identical. There is some precedent in the literature for the proposal that SA for the preinterruption scene will not decay. Endsley (1995) showed that participants were able to retain SA for a multi-item display task for up to 5 min after an interruption during which no task changes occurred. Other research has shown that individuals are able to accurately locate the preinterruption positions of multiple display objects following short-term interruption (Gartenberg, Breslow, McCurry, & Trafton, 2013; Ratwani & Trafton, 2008) and can do so more accurately than finding the new positions of displaced objects (Hunter & Parush, 2010).

Example of a preinterruption (left panel) and postinterruption (right panel) display scene for Barrow Island Scenario (high task-load condition). The 30º arcs in each figure that are facing due north are for illustration purposes only and were not displayed to participants.
The Current Study
A low-to-medium fidelity task was developed in consultation with domain experts to emulate a subset of submarine track manager duties. Track managers coordinate the localization and tracking of contacts in order to compile a tactical picture of the position and behavior of contacts in relation to Ownship and to landmarks. Given the collaboration and multitasking involved, there is a high potential for interruption. Participants were required to monitor a display containing a number of contacts (see Figure 1). The Ownship position was represented by a cross at the center of the display. Contacts appeared and moved very slowly about the display throughout the trial, before disappearing some time later. Contacts were enemies, friends, or neutral. Participants were required to (a) make decisions about the Ownship’s ability to engage enemy contacts using rules of engagement for submarine torpedoes (contact engagement task) and (b) detect contact heading changes (which may indicate hostile activity). An interruption was introduced by replacing the display with a blank screen for 20 s, during which participants completed a paper/pencil contact classification task. The specific interruption duration was chosen because it was similar to prior studies reporting long-term performance effects of interruptions in multi-item display tasks (e.g., Tremblay et al., 2012). No critical events occurred during the interruption (e.g., no contacts started to change their heading or crossed important map boundaries). Moreover, as Figure 1 illustrates, contacts barely changed their display position during the 20-s interruption. The very slow movement of display elements is typical of submarine environments.
To determine whether SA was degraded upon return to the primary task, we measured participants’ SA approximately 6 s after each interruption using the Situation Present Assessment Method (SPAM; Durso & Dattel, 2004; Loft et al., 2015). The impact of interruptions on subjective workload was measured using the NASA–Task Load Index (TLX) (Hart & Staveland, 1988). We also examined whether interruptions had long-term effects on the accuracy or speed of decisions made regarding task events that occurred more than 1 min postinterruption. Specifically, participants were asked contact engagement task questions on average 71 s after each interruption (min. = 61 s, max. = 91 s), and the commencement (i.e., the first signs) of contact heading changes occurred on average 89 s after interruptions (min. = 42 s, max. = 165 s). We varied task load (the number of contacts on the display), expecting that SA and performance were more likely to be affected by interruptions under higher task load conditions where there are more contacts on the display.
Method
Participants
Sixty students from the University of Western Australia participated in the study for either course credit or remuneration of AU$30. Five participants were excluded because they did not attempt to complete the heading change task at any time throughout the experiment and therefore may not have understood the instructions. The final sample contained 55 participants (28 female) with a mean age of 21.18 years (SD = 4.31 years).
Experimental Design
A 2 Interruption (No Interruption, Interruption) × 2 Task Load (Low, High) within-subjects design was used. Each participant completed four 12-min track management scenarios, each of which contained unique contacts presented on an Australian coastal map (Broome, Exmouth, Fremantle, and Barrow Island). The assignment of the four scenarios to the four conditions (low task load no interruption, low task load interruption, high task load no interruption, and high task load interruption), and the order of presentation of the conditions, were counterbalanced.
Submarine Track Management Task, Measures, and Procedures
The display presented an operational area with a 15-km radius (Figure 1). Ownship was represented by a centered cross. Two black circles indicated range rings of 5 km and 10 km from Ownship. Contacts were presented at the start of a scenario and remained on the display until the scenario’s end (no contacts entered or exited the display midscenario). Green triangles represented friendly contacts, white triangles merchant contacts, and red squares enemy contacts. Contacts were labeled with a unique number and had a colored line protruding from their center, which refreshed every 2 s to indicate heading, and each had a yellow cross superimposed to indicate four 90° direction quadrants around its center. These were intended to be used by participants to judge whether a contact’s direction marker was facing north (315°–45°), east (45°–135°), south (135°–225°), or west (225°–315°). In Figure 1, Enemy 2 was heading south because its direction marker was in the south-facing quadrant. The upper right-hand corner of the display indicated the distance each type of contact would travel during a 5-min period (4 km for merchant and 2.5 km for friendly and enemy).
For the contact engagement task, participants were required, when prompted, to decide whether enemy contacts were clear to be fired upon. Engagement task questions were presented in the upper left-hand corner of the display, accompanied by an auditory tone. An example was “Are we clear to fire on Enemy 2?” where the response to be entered by the participant was either “yes” or “no” using the “y” and “n” keys. No target could be fired upon if any other contact was present within a 30° arc of Ownship’s line of sight to the enemy (including the area behind the enemy) or if there was any contact within 5 km of the Ownship. There were four engagement questions per 12-min scenario.
Participants also detected heading changes. A heading change occurred if a contact’s direction marker moved into a different direction quadrant, as depicted by the yellow crosses associated with each contact icon. For example, in Figure 1, Merchant 5 was heading north, but its direction marker was close to entering the west-facing quadrant. If its direction marker were to move from the north-facing quadrant to the west-facing quadrant, a heading change would have occurred. In each 12-min scenario, there were six heading changes. Direction markers moved at a rate of 10° every 2 s. The period of time over which a heading change occurred, from the commencement of a marker’s movement to the movement conclusion, varied between 8 s and 30 s (M = 17.81 s, SD = 5.06 s). Participants indicated heading changes by clicking the contact’s icon and then pressing the direction key that corresponded to the contact’s new heading.
Task load
Task load was manipulated by varying the number of contacts (low = 6; high = 12) in a scenario. Each scenario was designed to accommodate either 6 or 12 contacts without this manipulation impacting the tasks. For example, the additional 6 contacts added to create a high task load version of Scenario A did not exhibit a heading change and were programmed such that their movement did not affect the correct answers to the engagement task.
Interruption
Under interruption conditions, each scenario contained four separate 20-s periods where the primary task screen was blanked. These interruptions occurred without warning, and participants were instructed to immediately commence a paper/pencil contact classification task. Participants had access to an information sheet displaying the features of each category of contact. Features included the presence or absence of letters, numbers, and symbols and the positioning of flags, guns, and cargo. Some features were unique to a single contact category, whereas other features were common to two categories. Participants indicated whether the correct classification was “friendly,” “merchant,” “enemy,” or “unclear.” This interrupting task, although conceptually related to track management, had no functional relationship to the primary task. After 20 s, a tone sounded to signal that the participants should return to track management (regardless of whether they had completed the interruption task). No task-critical events related to the engagement task or the heading change task occurred during the interruption. Thus, the interruption manipulation had no impact on the task-critical information available to the participant.
SA measure
The SPAM method has been used previously to examine SA in track management (Loft et al., 2015; Loft, Morrell, & Huf, 2013). SPAM allows workload to be distinguished from SA by presenting the SA query only when the operator indicates a willingness to accept the query (Durso & Dattel, 2004). SPAM queries were presented in the upper left-hand corner of the screen. First, the message “Are you ready for a question?” was displayed (accompanied by a tone), and participants pressed the “y” key when ready. The time the participant took to accept the query is referred to as SPAM accept RT, and this measure is often positively correlated with subjective workload (Loft et al., 2015).
Once readiness was indicated, the SPAM query was posed and participants responded using the “y” and “n” keys or the numerical keys. The underlying logic was that participants with better SA would better know where to find the appropriate information to answer the query and thus be able to respond faster or more accurately to the SPAM query after they had accepted it (Durso & Dattel, 2004). There were four SPAM queries per scenario, two measuring SA for the current situation and two SA for the future situation (see Table 1).
Examples of SPAM Queries
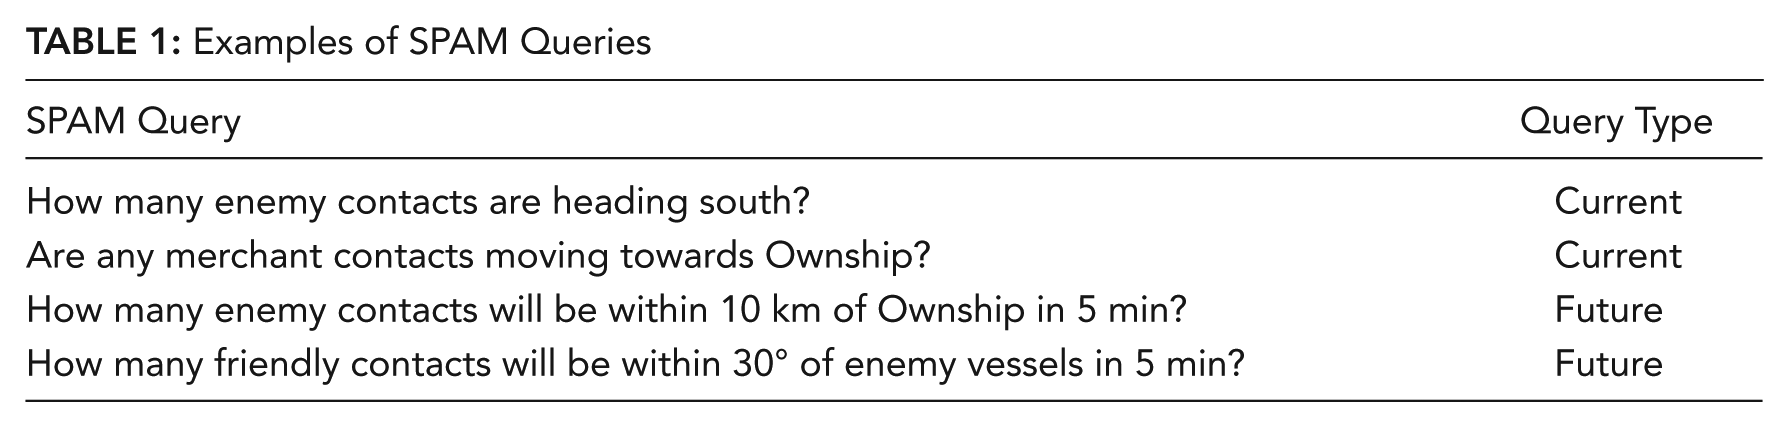
The time between the conclusion of an interruption and the presentation of a SPAM query varied between 5 and 7 s. Note that because the assignment of the four scenarios to the four conditions was counterbalanced, both the content and presentation timing of SPAM queries was identical across the interruption and no-interruption conditions. On two occasions per scenario, the SPAM query was followed by a heading change, which was then followed by an engagement task question. On the other two occasions per scenario, the SPAM query was followed by an engagement task question, then a heading change. To further prevent task presentation order pattern detection (specifically, that an engagement task often followed a SPAM probe), a filler question (e.g., “Is there a contact labeled ‘Friendly 6’?”) was presented once during each scenario between a SPAM query and a subsequent engagement question.
Subjective workload measure
Following each scenario, participants provided magnitude of load ratings on six 20-point scales: mental demand, physical demand, temporal demand, performance, effort, and frustration (NASA-TLX). Then, after finishing all four scenarios, participants completed 15 pairwise comparisons for each task type (heading and engagement). These pairwise comparisons were unique combinations of the scales (e.g., mental demand vs. physical demand) and required participants to indicate the scale from each pair that made the most important contribution to the workload. Sources of workload weightings for each participant were determined by counting the number of times each scale title was selected from the pairwise comparisons. Overall scores were then calculated by multiplying the magnitude ratings by the source weightings for each scale, adding these values together, and dividing the total by 15.
Results
For each scenario, we removed RTs more than 3 SDs above the mean (Ratcliff, 1979) for a given task or SPAM query (1.44% of raw RTs were trimmed). Effect sizes were estimated using partial eta squared (small = .01, medium = .06, large = .14; Cohen, 1988).
Performance
Accuracy on the engagement task approached the ceiling (95%), and there were no effects (F < 1). Figure 2 presents contact engagement task RT as a function of task load and interruption. There was a main effect of task load on engagement task RT, F(1, 54) = 7.23, p < .01, ηp2 = 12, with participants making slower contact engagement decisions under high (M = 5.21 s, SD = 0.98 s) than low (M = 4.97 s, SD = 0.89 s) task load. There was also a main effect of interruption, F(1, 54) = 27.97, p < .01, ηp2 = 34, with participants slower to make contact engagement decisions under interruption (M = 5.39 s, SD = 1.09 s) compared to no interruption (M = 4.79 s, SD = 0.84 s) conditions. There was no interaction (F < 1).
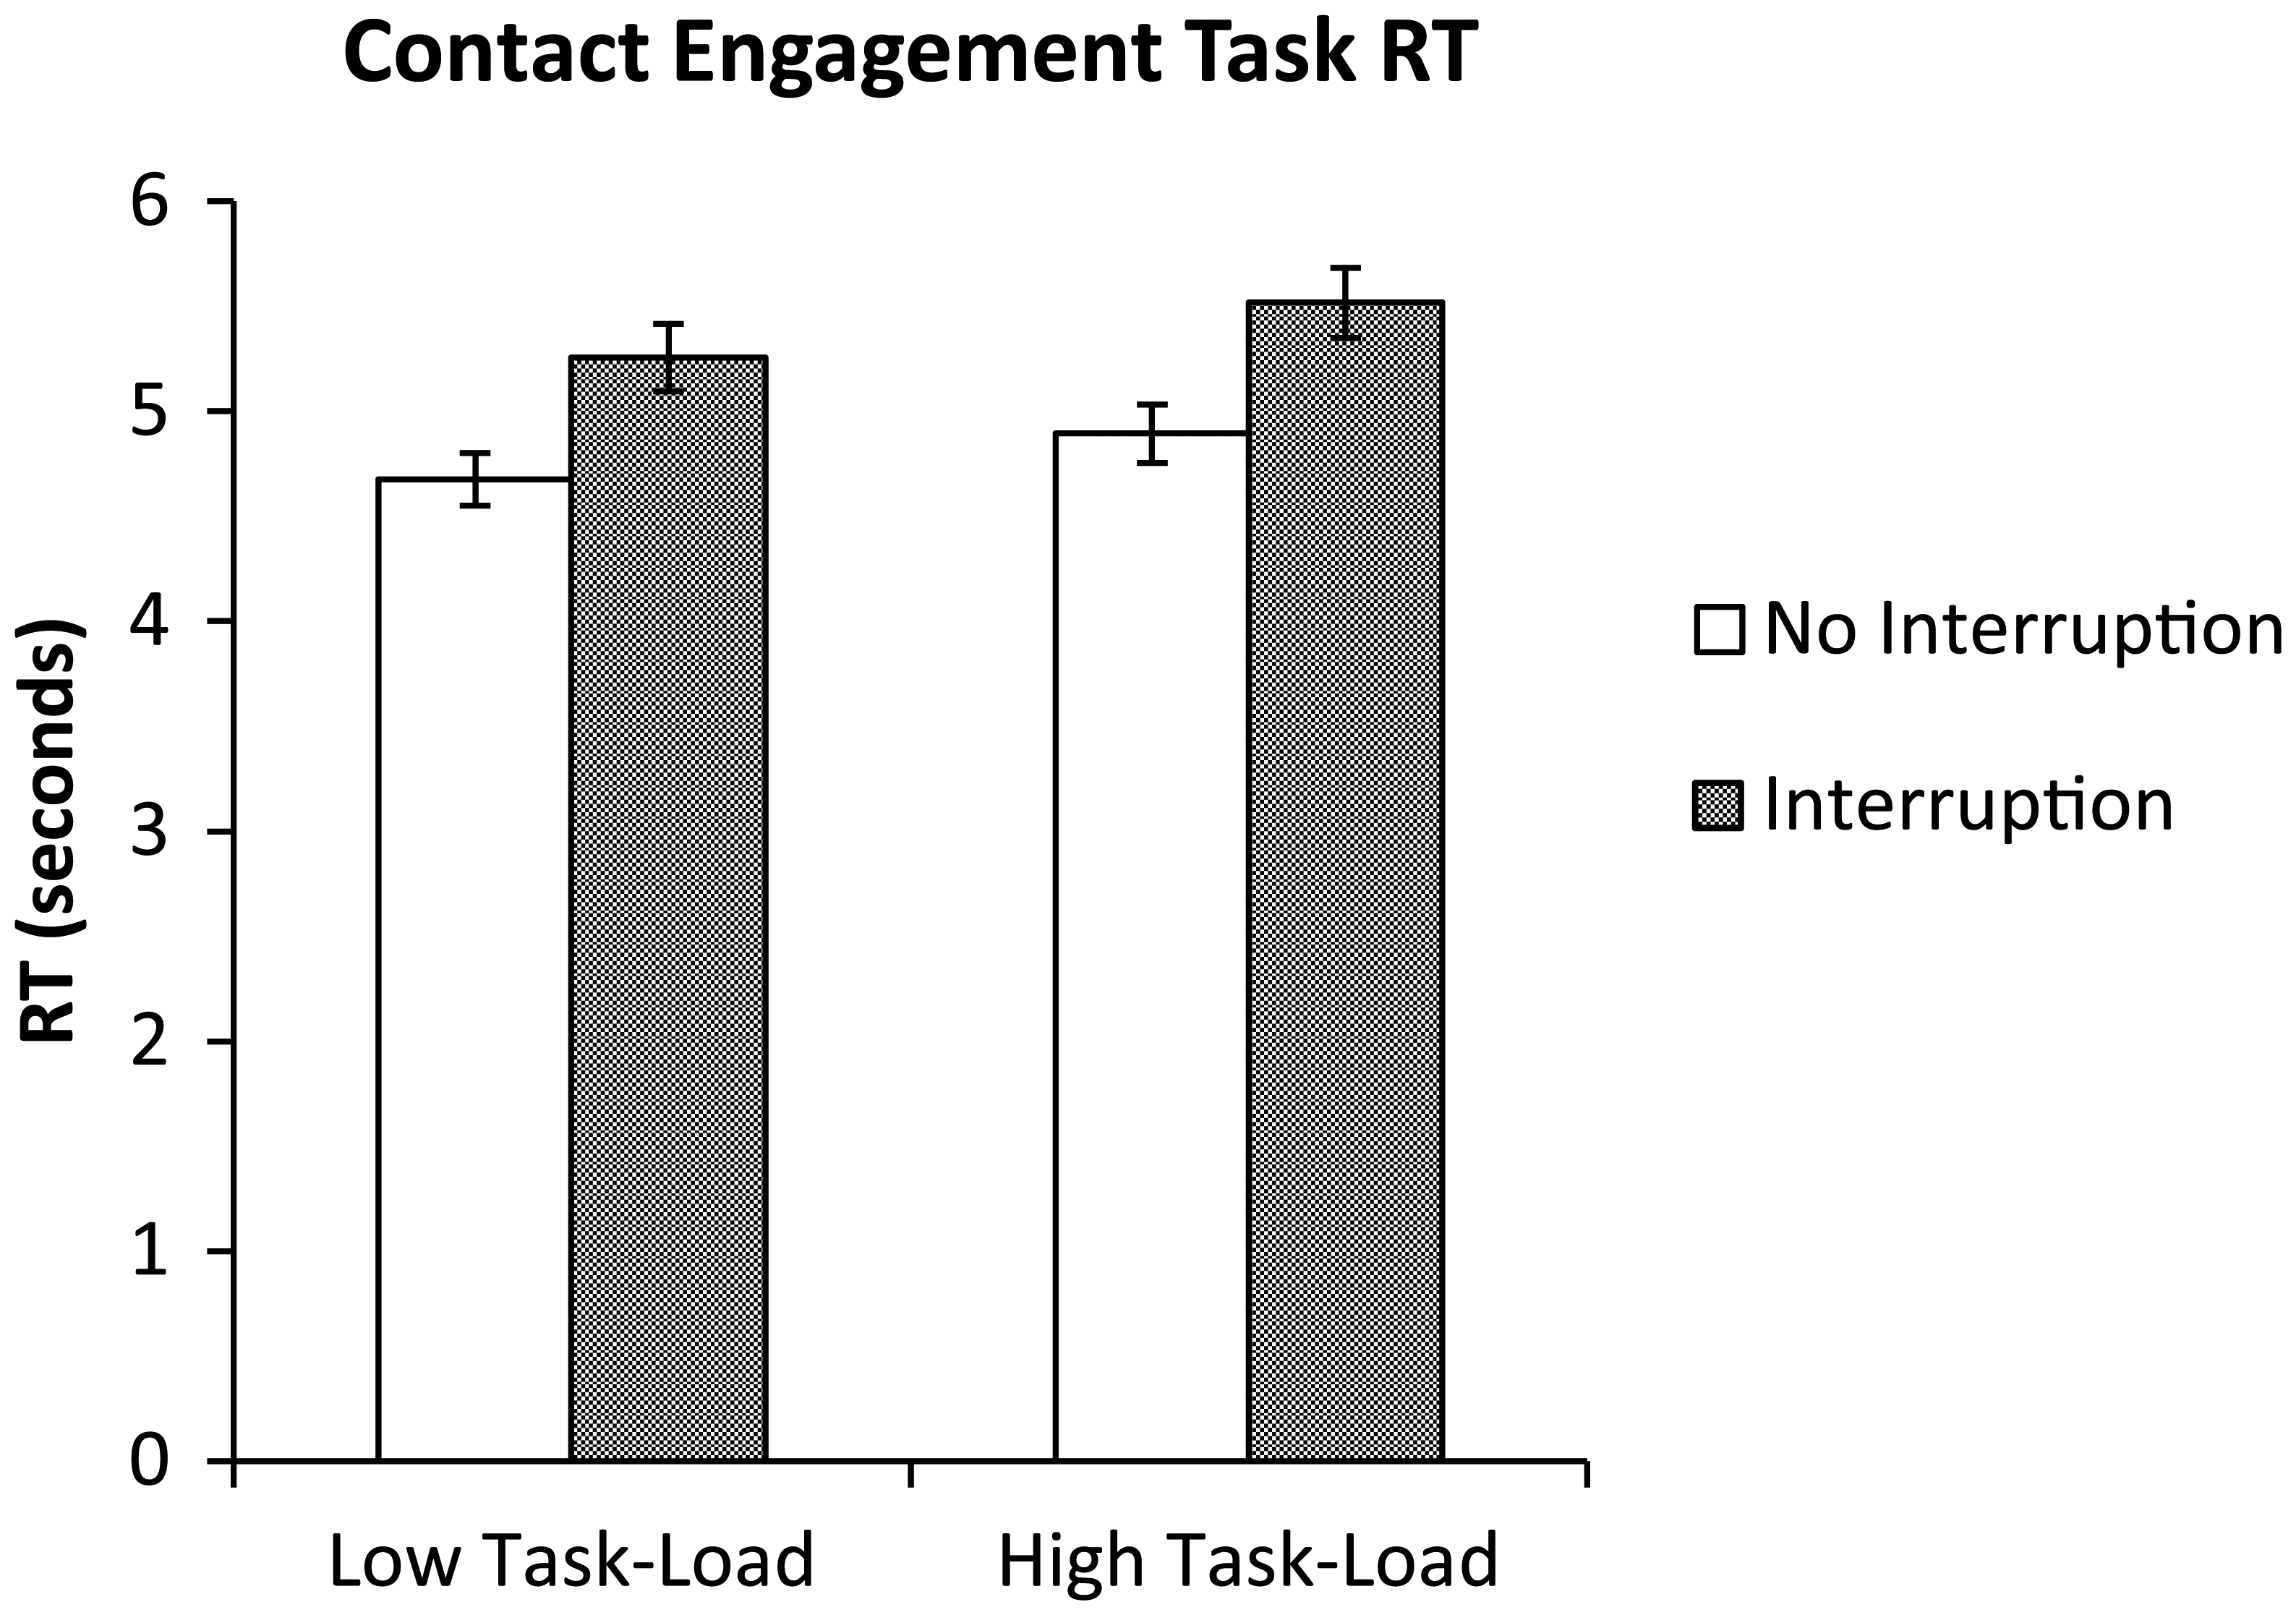
Engagement task RT as a function of task load and interruption. Error bars represent ±1 SEM.
Figure 3 presents heading change accuracy and RT as a function of task load and interruption. There was a main effect of interruption on heading change accuracy, F(1, 54) = 30.45, p < .01, ηp2 = .36, with participants correctly identifying fewer heading changes under interruption (M = .85, SD = .19) compared to no interruption (M = .73, SD = .24) conditions. There was no effect of task load and no interaction (Fs < 1). There was also a main effect of interruption on heading change RT, F(1, 50) = 7.43, p < .01, ηp2 = 13, with participants slower to detect heading changes under interruption (M = 11.73 s, SD = 7.19 s) compared to no interruption (M = 8.71 s, SD = 6.22 s) conditions. There was no effect of task load and no interaction (Fs < 1).

Heading change task accuracy (left panel) and RT (right panel) as a function of task load and interruption. Error bars represent ±1 SEM.
SA
SPAM accept RT
The time taken to accept SPAM queries should reflect current participant workload. On average, it took participants 2.43 s to indicate that they were ready to accept a SPAM query. Participants were unaware of the query type (current, future) when alerted that a query was available. Thus, we averaged SPAM accept RT across SPAM type and conducted a 2 Task Load (Low, High) × 2 Interruption (No Interruption, Interruption) repeated measures ANOVA. Figure 4 presents SPAM accept RT as a function of task load and disruption. There was a main effect of task load, F(1, 54) = 37.59, p < .01, ηp2 =.41, with participants slower to accept SPAM queries under high (M = 2.71 s, SD = 0.84 s) than low (M = 2.15 s, SD = 0.44 s) task load. Participants were slower to accept SPAM queries after a task interruption (M = 2.51 s, SD = 0.78 s) compared to when there was no interruption (M = 2.34 s, SD = 0.56 s), but this trend did not reach significance, F(1, 54) = 3.19, p = .08, ηp2 = .06. There was no interaction (F < 1).
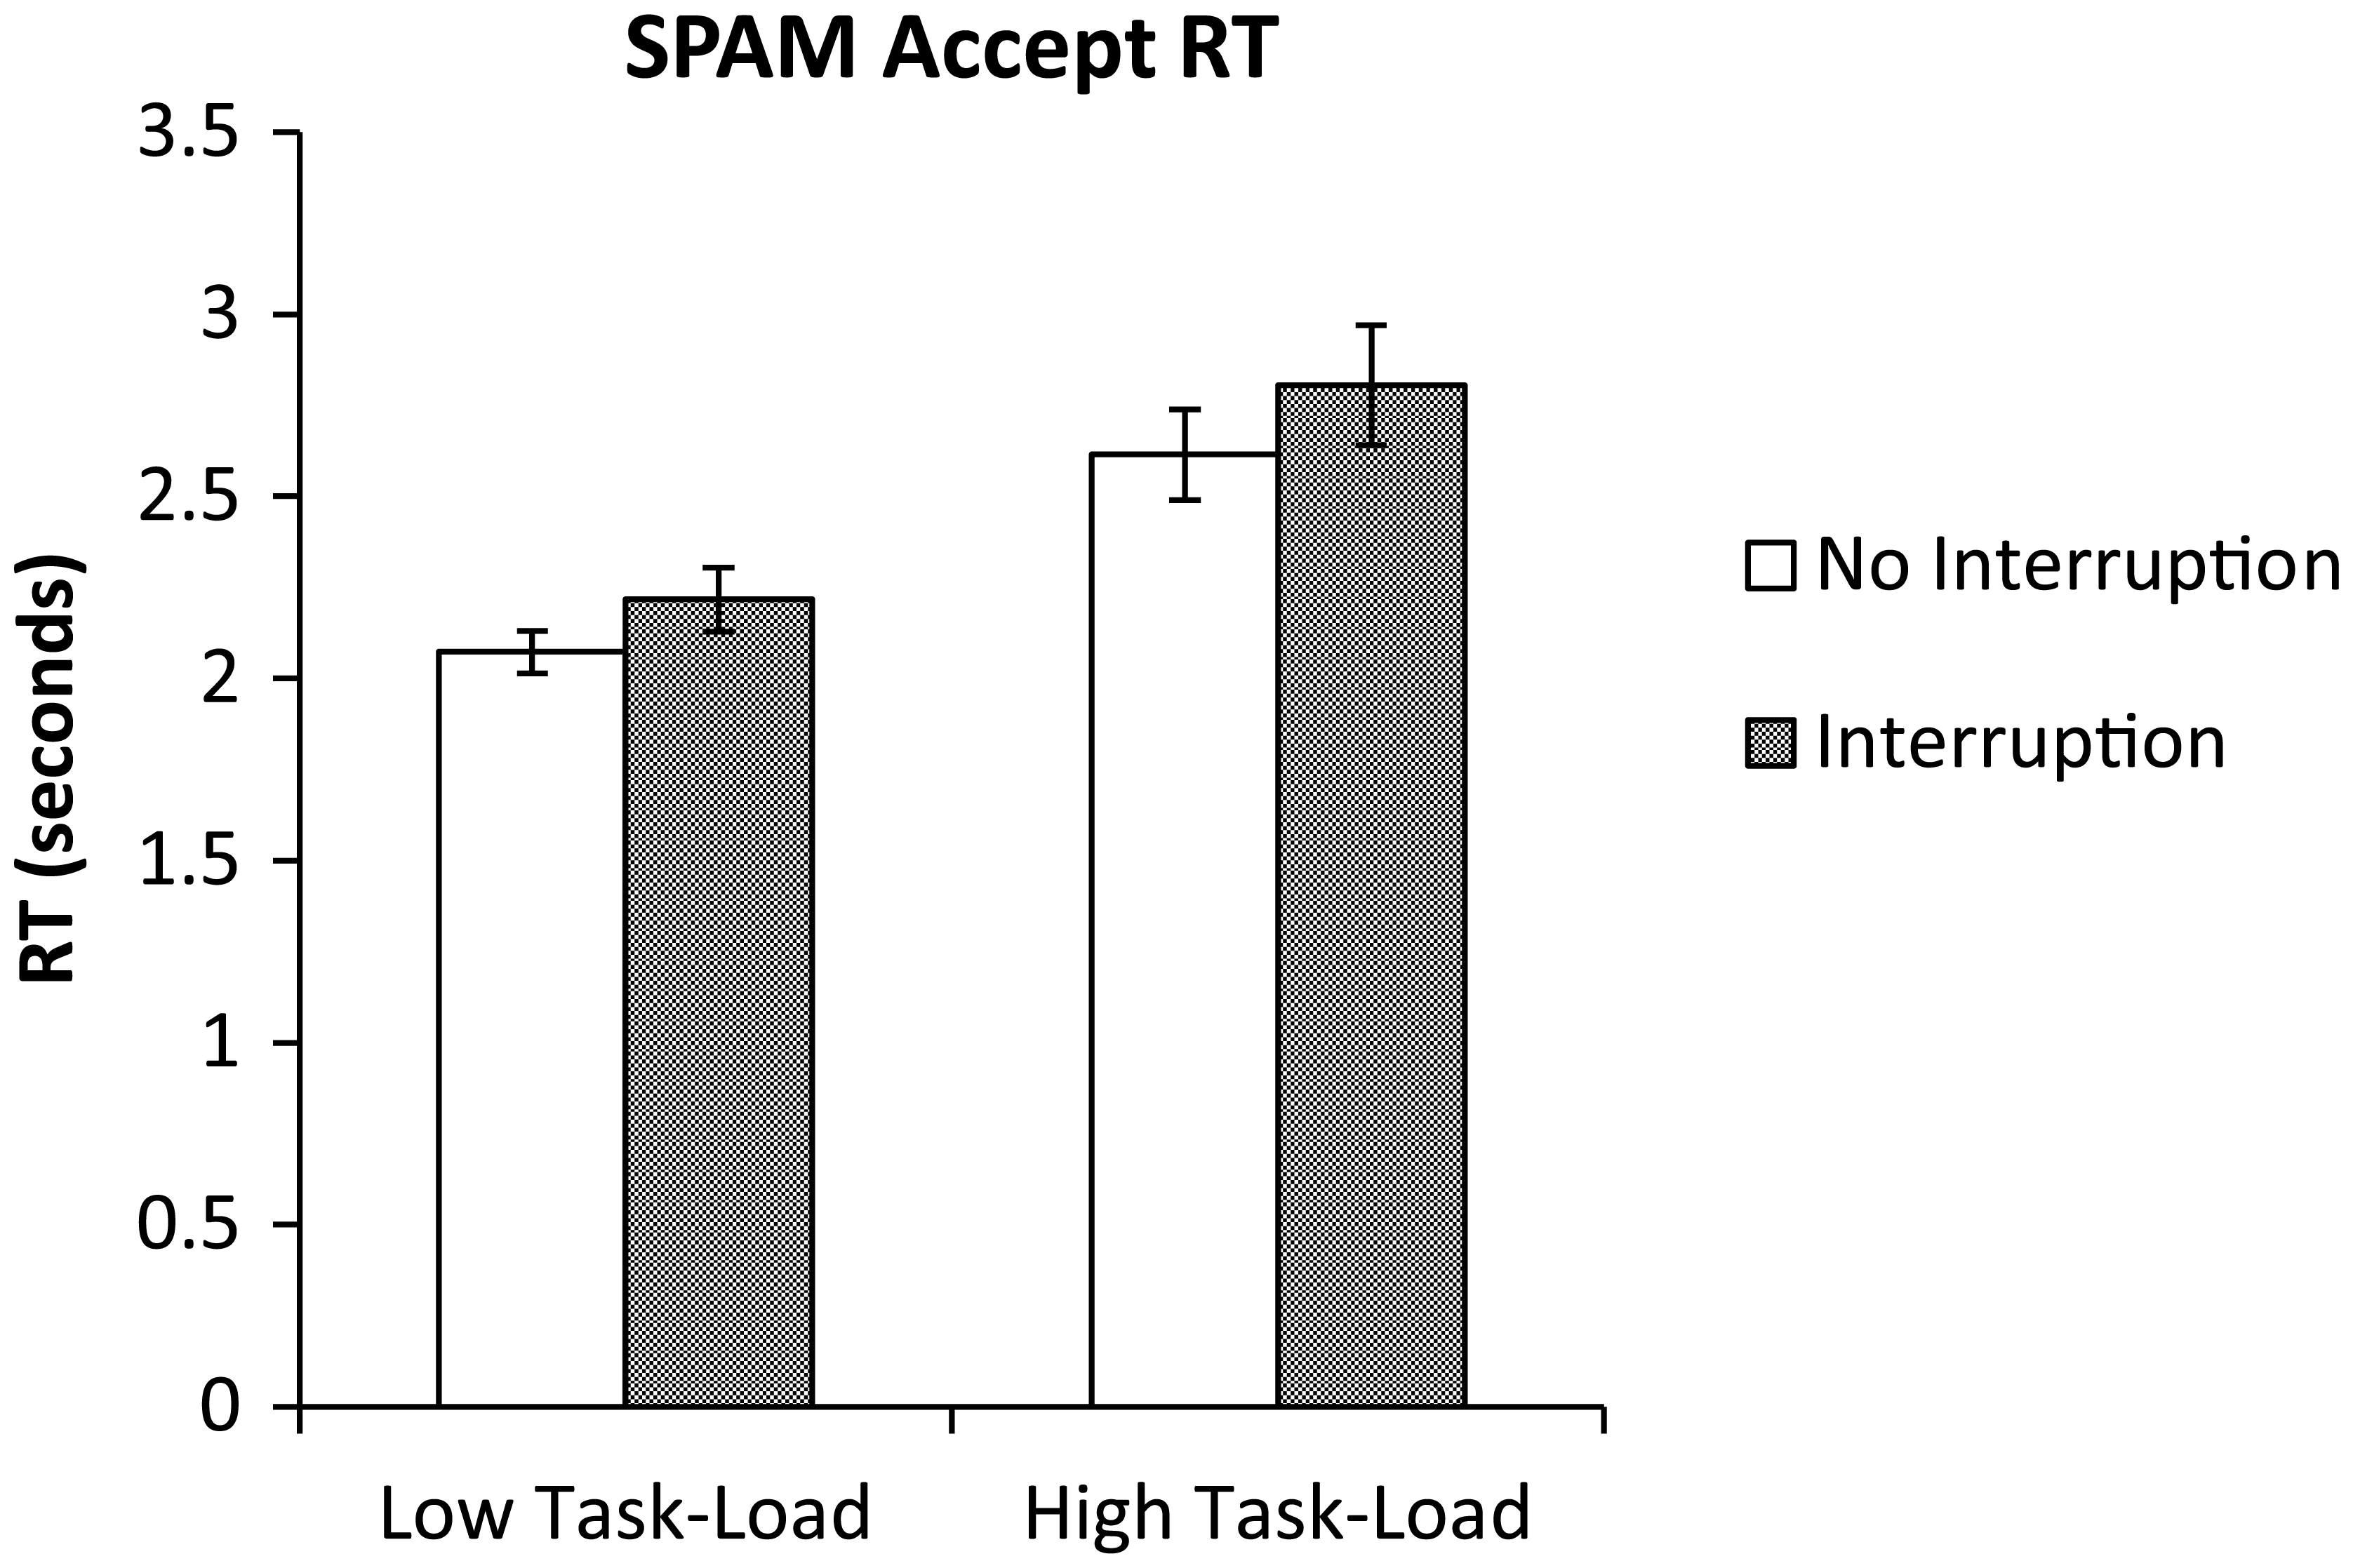
SPAM accept RT as a function of task load and interruption. Error bars represent ±1 SEM.
SPAM accuracy and SPAM RT
Participants with better SA should respond faster or more accurately after accepting SPAM queries. A 2 SPAM Type (Current, Future) × 2 Task Load (Low, High) × 2 Interruption (No Interruption, Interruption) repeated measures ANOVA was conducted on SPAM accuracy and SPAM RT. These accuracy and RT analyses revealed no main effects of task load (both Fs < 1) and no interactions between task load and other variables (Fs < 1). Thus, for simplicity, we averaged across task load when presenting the data in Figure 5.
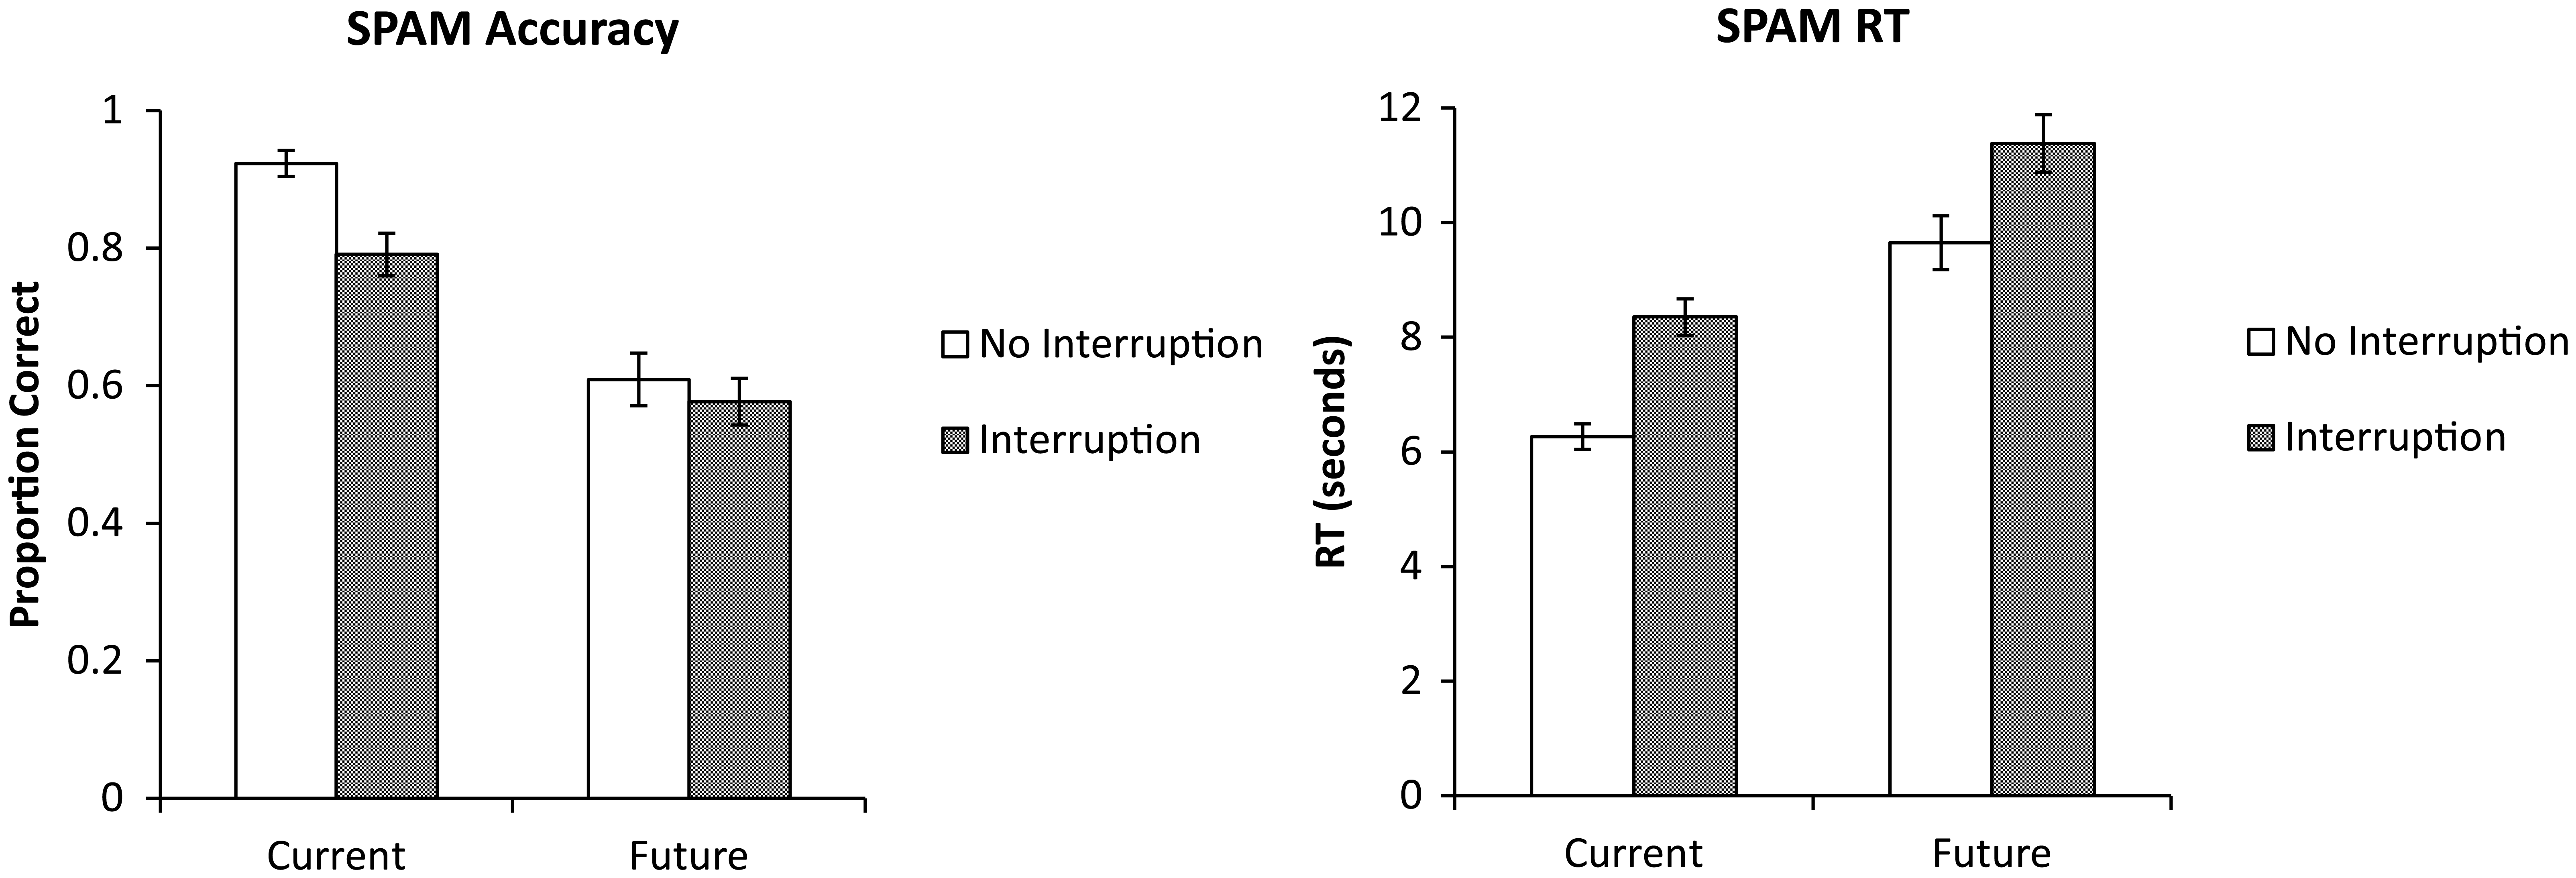
SPAM accuracy (left panel) and SPAM RT (right panel) as a function of SPAM query type and interruption. Error bars represent ±1 SEM.
There was a main effect of SA type on SPAM accuracy, F(1, 54) = 135.72, p < .01, ηp2 = .72, with participants responding less accurately to future (M = .59, SD = .16) compared to current (M = .86, SD = .13) SPAM queries. There was a main effect of interruption, F(1, 54) = 5.01, p < .05, ηp2 = .09, with participants responding less accurately to SPAM queries after an interruption (M = .68, SD = .19) compared to when there was no interruption (M = .77, SD = .16). There was no interaction, F(1, 54) = 2.23, p = .14, ηp2 = 04.
There was a main effect of SA type on SPAM RT, F(1, 49) = 95.80, p < .01, ηp2 = .66, with participants making slower correct responses to future (M = 10.51 s, SD = 2.93 s) than current (M = 7.31 s, SD = 1.68 s) SPAM queries. There was a main effect of interruption, F(1, 49) = 44.74, p < .01, ηp2 = .48, with participants making slower responses to SPAM queries presented after an interruption (M = 9.87 s, SD = 2.43 s) compared to when there was no interruption (M = 7.96 s, SD = 2.19 s). There was no interaction (F < 1).
Subjective workload
Figure 6 presents the NASA-TLX ratings as a function of task load and interruption. The pattern of findings is consistent with the SPAM accept RT data. There was a main effect of task load, F(1, 52) = 58.48, p < .01, ηp2 = .53, with participants reporting higher workload under high (M = 47.87, SD = 13.24) than low (M = 35.46, SD = 12.66) task load. There was a main effect of interruption, F(1, 52) = 10.98, p < .01, ηp2 = .17, with participants reporting higher workload under interruption (M = 44.06, SD = 12.78) compared to no interruption (M = 39.27, SD = 12.56) conditions. There was no interaction between task load and interruption, F(1, 52) = 1.71, p = .20, ηp2 = .03.

NASA-TLX ratings as a function of task load and interruption. Error bars represent ±1 SEM.
General Discussion
The two main findings were that (a) SA was degraded upon immediate return to the submarine track management task after an interruption and (b) interruptions had long-term effects on both the speed and accuracy of task performance. More specifically, when an SA query was presented 5–7 s after an interruption, participants were 9% less accurate and were nearly 2 s slower to make correct responses. Despite contact engagement questions being presented on average 71 s after an interruption, participants were 0.6 s slower to make correct engagement decisions following an interruption. In addition, despite the commencement of heading changes occurring on average 89 s after interruptions, participants missed 12% more heading changes and were 3 s slower to detect them. Ratings of subjective workload were 4.8% higher for scenarios that contained interruptions. These effects of interruptions on SA, performance, and workload did not interact with task load (i.e., number of contacts on the display). An impact of task load manipulation was evident, however, in that high task load increased ratings of subjective workload by 12.4%, slowed SPAM query acceptance times by 0.56 s, and slowed contact engagement task decisions by 0.24 s.
The current research adds to recent literature showing that interruption recovery in multi-item display tasks can extend well beyond the first postinterruption action (Hodgetts et al., 2014; Tremblay et al., 2012). Conceivably, some of the decrements in these recent studies and in the current study could have been due to the need to reinstate task goals (Trafton & Monk, 2007) or task switching (Rogers & Monsell, 1995), but these factors alone could certainly not explain the current decrements in performance, which were measured on average 80 s after interruption. Such long-term impacts are quite remarkable, given that interruptions to static sequential task have only been shown to impact performance for a few seconds or less. Hodgetts et al. (2014) and Tremblay et al. (2012) attributed their observations of extended interruption recovery to the need for participants to determine how the task display had changed during interruptions. In the track management task, pre- and postinterruption scenes were essentially identical, and given the very slow movement of contacts, it should have been quite obvious to participants that the display would change very little during the interruption. Nonetheless, the observed long-term performance decrements, and the immediate effect of interruptions on SA, suggest that participants still needed to redetermine the location and relationship between task display elements when returning from interruption. More specifically, participants may have needed to redetermine the location of enemy contacts to Ownship and to other contacts (engagement), the location of contacts to the Ownship 5-km zone (engagement), or the current heading of contacts (heading change). However, the effect of interruptions did not interact with task load, which is surprising as one might reasonably expect that the difficulty of reestablishing SA would increase with more displayed contacts.
One interpretation of the data is that participant SA for the preinterruption display scene decayed. However, this would not be consistent with past research indicating that individuals are accurately able to locate the preinterruption position of multiple objects following interruption (Ratwani & Trafton, 2008). In addition, Endsley (1995) found that individuals could provide accurate SA reports for up to 5 min following interruption. However, the fact that Endsley’s participants were answering SA queries about the preinterruption scene during the interruption may have helped maintain SA. Nonetheless, although our participants performed a functionally unrelated interrupting task, they only did so for a relatively short time compared to Endsley’s 5-min interruption, and it was thus reasonable for us to assume SA could be maintained over such a brief time. Perhaps a more important point to make here is that the impact of interruptions would likely have been even greater if participants had performed some form of spatial memory task during the interruption, because this would interfere with memory for the primary track management preinterruption spatial scene (Edwards & Gronlund, 1998; Ratwani & Trafton, 2008). Therefore, the current data may well represent an underestimation of the potential impact of interruptions in simulated track management and C2 tasks more generally.
An alternative interpretation is that participants did not encode the location of contacts in memory to the extent we assumed they would. According to the soft constraint hypothesis (Gray & Fu, 2004), when information is readily available within a task environment, humans prefer to acquire information “just as it is needed” rather than storing items in memory. Arguably, all the information that participants needed to perform the track management tasks, and to answer SA queries, was available on the display, and therefore the “cost” associated with accessing information was quite low. After returning from interruption, it would have been difficult for participants to perform tasks if they had no memory of the preinterruption scene, because they would need to reestablish their SA. If this is the case, memory storage, and the associated capacity to recover from interruption, could be facilitated by making a subset of display information (which is vulnerable to the effects of interruption) more difficult to routinely access. Broader approaches to strengthening memory for the preinterruption scene include training strategies such as rehearsal or the creation of “external memory” prompts that capture important state information (Boehm-Davis & Remington, 2009). The effect of internal and external mnemonic strategies can be further enhanced by giving operators advanced knowledge about the nature (e.g., modality, length, importance) of pending interrupting tasks (Ho, Nikolic, Waters, & Sarter, 2004).
The above conclusions notwithstanding, care must be taken when making generalizations to submarine operations given the low-to-medium fidelity task and the use of student participants. Submariners are highly practiced at their tasks, and the information they monitor and control is not abstract but is rather embedded in an operational context. Furthermore, one of the strengths of domain experts is the ability to internalize regularities from contextualized situations (Loft, Bolland, Humphreys, & Neal, 2009), which could benefit interruption recovery. In addition, interruptions can become less disruptive following extended practice on the resumption process (Cades, Boehm-Davis, Trafton, & Monk, 2011). Nonetheless, submarine track management is a prototypical example of a slowly evolving display task that contains mission-critical interruptions. Further understanding of the cognitive limitations of the human operator and how interruptions can affect them is crucial for further improving work design and training.
Key Points
Task resumption metrics used for static sequential tasks are not adequate indicators of interruption recovery in C2 environments. Interruption recovery in these work contexts can extend well beyond the first postinterruption action because individuals need to recover SA for multiple unfolding display events.
We examined the extent to which interruptions could negatively impact SA and long-term performance in a submarine track management task. Despite pre- and postinterruption display scenes remaining essentially identical, participant SA after returning from interruption was degraded, and participants made poorer decisions on tasks that were measured at least 40 s following interruption.
Participants needed to redetermine the location and spatial relationship between the displayed contacts when returning from interruption, either because their SA for the preinterruption scene had decayed or because they had not encoded SA of the preinterruption scene due to low information access costs.
Footnotes
Acknowledgements
This research was supported by Research Funding Agreement 353520 from the Defence Science and Technology Organisation, Australia. We thank Peter Henley, Megan Schmitt, and Michael Wilson for advice during various stages of the project.
Shayne Loft is an associate professor at The University of Western Australia. He received his PhD in experimental psychology in 2004 from The University of Queensland.
Andreas Sadler was a master’s student at the University of Western Australia. He received his master’s degree in organisational psychology in 2012 from the University of Western Australia.
Janelle Braithwaite was a PhD student at The University of Western Australia (Oceans Institute).
Samuel Huf is a team leader of submarine human systems and analysis at the Maritime Division at the Defence Science and Technology Organisation, Australia.