



Abstract
Objective:
The aim of this study was to compare continuous versus bandwidth haptic steering guidance in terms of lane-keeping behavior, aftereffects, and satisfaction.
Background:
An important human factors question is whether operators should be supported continuously or only when tolerance limits are exceeded. We aimed to clarify this issue for haptic steering guidance by investigating costs and benefits of both approaches in a driving simulator.
Methods:
Thirty-two participants drove five trials, each with a different level of haptic support: no guidance (Manual); guidance outside a 0.5-m bandwidth (Band1); a hysteresis version of Band1, which guided back to the lane center once triggered (Band2); continuous guidance (Cont); and Cont with double feedback gain (ContS). Participants performed a reaction time task while driving. Toward the end of each trial, the guidance was unexpectedly disabled to investigate aftereffects.
Results:
All four guidance systems prevented large lateral errors (>0.7 m). Cont and especially ContS yielded smaller lateral errors and higher time to line crossing than Manual, Band1, and Band2. Cont and ContS yielded short-lasting aftereffects, whereas Band1 and Band2 did not. Cont yielded higher self-reported satisfaction and faster reaction times than Band1.
Conclusions:
Continuous and bandwidth guidance both prevent large driver errors. Continuous guidance yields improved performance and satisfaction over bandwidth guidance at the cost of aftereffects and variability in driver torque (indicating human–automation conflicts).
Application:
The presented results are useful for designers of haptic guidance systems and support critical thinking about the costs and benefits of automation support systems.
Introduction
Lane keeping is an essential driving task, and measures of lane-keeping performance are important indicators of driver vigilance and impairment (Brookhuis & De Waard, 1993). An investigation of the crash records of the Fatality Analysis Reporting System (FARS) showed that lane departure warning/prevention systems could potentially prevent/mitigate 31% of fatal single-vehicle crashes (Jermakian, 2011). The present study focuses on haptic feedback on the steering wheel as a means to assist drivers to stay in their lane.
Fenton (1966) was probably the first to introduce haptic feedback as a means to assist car drivers. A protruding “finger” at the head of the control stick informed the driver about the headway of a car in front (see also Fenton & Montano, 1968). Development of haptic feedback systems have been relatively stagnant until the 1990s, but in the past 20 years, the human factors field has seen a surge of research in this area (e.g., Jamson, Hibberd, & Merat, 2013; Janssen & Nilsson, 1992; Mars, Saleh, Chevrel, Claveau, & Lafay, 2011; Nirsch & Eck, 1994; Steele & Gillespie, 2001).
There are two fundamentally different approaches to providing haptic feedback to car drivers. The first is to provide continuous guidance (Abbink, Mulder, & Boer, 2012; Flemisch et al., 2008; Griffiths & Gillespie, 2005), also called haptic shared control, and the second is to provide binary feedback when the driver exceeds a tolerance limit (e.g., Mohebbi, Gray, Tan, & Lafayette, 2009; Scott & Gray, 2008; Stanley, 2006).
With continuous haptic guidance, the driver and the system simultaneously share control over the steering task (Goodrich, Schutte, Flemisch, & Williams, 2006). Studies have shown that haptic shared control improves lane-keeping performance (Forsyth & MacLean, 2006; Griffiths & Gillespie, 2005; Mulder, Abbink, & Boer, 2008) and decreases workload (Flemisch et al., 2008; Kienle, Damböck, Bubb, & Bengler, 2012) compared to manual control. These effects are generally stronger for systems providing higher feedback torques (Damböck, Weißgerber, Kienle, & Bengler, 2013; Flemisch et al., 2008; Mars, Deroo, & Hoc, 2014). Abbink et al. (2012) argued that continuous haptic guidance adheres to the principles of human-centered automation, namely, that the operator is always in control, receives continuous feedback about the automation functionality, and continuously interacts with the automation. Thus, haptic shared control can be seen as a human–automation interface that allows continuous interaction and communication and facilitates awareness of the functional limitations of the system compared to supervisory control of automation.
However, there may be downsides to continuous haptic guidance. Several studies (Flemisch et al., 2008; Mulder, Abbink, & Boer, 2012) reported large driver-induced steering torques, indicating conflicts between human and machine. Indeed, some research participants have complained that they were “fighting” the system, which refers to the fact that the haptic shared control guided the driver in a direction that was contrary to his or her intentions (Abbink et al., 2012; de Winter & Dodou, 2011). Moreover, research in motor learning has shown that providing a human with force feedback results in so-called aftereffects when the force field is withdrawn (Shadmehr & Brashers-Krug, 1997). Shadmehr and Brashers-Krug (1997) defined an aftereffect as “the trajectory that results when a subject is expecting a force field but the robot is producing a null field” (p. 411). Similarly, in the present study, we define an aftereffect as the steering behavior that occurs after haptic feedback torque is suddenly disengaged. In a literature review, de Winter and Dodou (2011) argued that continuous haptic guidance may impair learning of the relationship between steering wheel input and car heading output, which in turn could yield aftereffects during subsequent manual driving. De Winter and Dodou further argued that continuous guidance may yield similar adverse human performance consequences to those that occur when automation fails (cf. Lee & See, 2004; Onnasch, Wickens, Li, & Manzey, 2013; Stanton, Young, & McCaulder, 1997).
Continuous haptic steering guidance usually provides feedback torques with respect to a target path (often the middle of the lane). However, as early as 1938, Gibson and Crooks introduced the concept of “the field of safe travel,” which represents a constraint in which the car can move without danger. According to Godthelp, Milgram, and Blaauw (1984), drivers do not strive to minimize the lateral error with respect to the lane center but, rather, perform corrective steering movements when they exceed certain safety limits. More generally, various human factors researchers have emphasized that operators should not be expected to behave like an optimizer but should be seen as a satisficer instead (Hancock & Scallen, 1999; Reason, 1987). This suggests that an approach that supports the driver only when really needed might be a suitable alternative to continuous guidance.
Bandwidth haptic feedback systems may constitute such an alternative, by providing vibrations or a feedback torque whenever a predefined threshold (e.g., a lane boundary) is exceeded. De Groot, de Winter, García, Mulder, and Wieringa (2011) provided drivers with seat vibrations when driving more than 0.5 m from the lane center. This system resulted in a higher percentage of driving time within the 1-m-wide tolerance zone compared to manual driving. They also showed that drivers who had received this bandwidth feedback performed better than the no-feedback group in a delayed retention trial without haptic feedback. One advantage of bandwidth feedback is that the human is not “disturbed” when performing acceptably but receives assistance only when it is needed (Gordon & Gottlieb, 1967; Swinnen, 1996; Williams & Briggs, 1962).
Bandwidth feedback systems have limitations too. A well-known issue with any binary feedback is the establishing of correct threshold values. Early warnings may result in false alarms, which in turn can result in the “cry-wolf phenomenon,” whereas late warnings may give the driver too little time to react to impending hazards (Breznitz, 1984; Parasuraman & Riley, 1997).
Based on this cost-benefit analysis of continuous versus bandwidth feedback, we investigated the idea of altering existing haptic guidance to guide only when outside a relevant bandwidth, a potentially interesting innovation that may prevent overreliance on haptic guidance.
The aim of this study was to quantify the benefits and limitations of continuous versus bandwidth guidance in a driving simulator experiment. We hypothesized that continuous haptic guidance results in an improved lane-keeping performance and a reduced mental workload compared to manual steering and bandwidth guidance and that drivers will show aftereffects when the system disengages. These benefits and limitations were expected to increase with stronger guidance. Bandwidth feedback was also expected to improve lane-keeping performance with respect to manual control, without undesirable aftereffects when the feedback shuts down.
This study evaluated two versions of a previously developed continuous guidance system (Mulder et al., 2012) as well as two types of the novel bandwidth guidance. Regarding the continuous guidance systems, we investigated a low-gain version, which provided gentle assistive torques, and a high-gain version, which provided more directive assistive torques. The first bandwidth system provided guidance when the predicted lateral error of the car exceeded 0.5 m with respect to the lane center. The second engaged exactly like the first system but disengaged once the lateral error had been reduced to 0.1 m. Hence, the second bandwidth may improve driver comfort compared to the first by preventing rapid on-off alternations of the feedback.
Method
Participants
Thirty-two participants (6 women and 26 men) between 23 and 38 years old (M = 25.8, SD = 3.3), licensed to drive for at least 1 year (M = 6.9, SD = 3.9), and with normal or corrected-to-normal vision volunteered to take part in the experiment.
Apparatus
The experiment was conducted in a fixed-base simulator, equipped with an active steering wheel and LCD-based dashboard instruments. The steering wheel was actuated by a Moog-FCS S-motor at 2500 Hz, controlled by a control-loading computer. The vehicle had a software-based automatic gearbox. The driving scene was projected on the wall in front and to the side of the driver by four projectors, resulting in a 180° horizontal and 40° vertical field of view.
Steering wheel angle, measured driver torque, torque applied by the steering motor, lateral position with respect to the lane center (negative = left; positive = right), speed, and coordinates of the car were recorded at a frequency of 100 Hz. For the secondary task, a computer mouse was attached upside down to the right side of the steering wheel (see Figure 1). Times of pressing and releasing the mouse buttons were recorded. Vehicle dynamics were identical to those used in earlier studies with this simulator (de Winter, Mulder, Van Paassen, Abbink, & Wieringa, 2008; Mulder et al., 2008, 2012). In all driving conditions, the steering wheel provided a mild centering torque, being a monotonic function of the steering wheel angle.
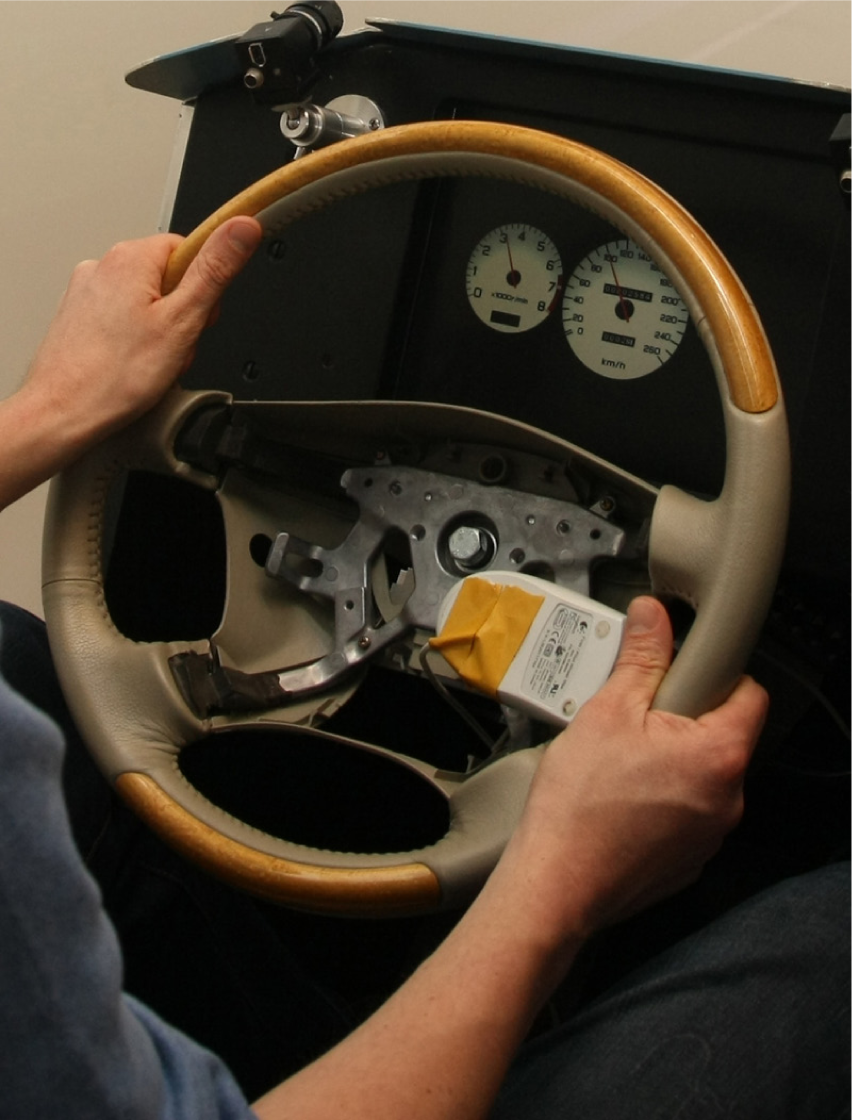
Close up of the steering wheel with the mouse attached.
Applied Steering Wheel Feedback Torque
Guiding torques were superimposed on the steering wheel (Tguidance) through a two-level control algorithm. First, an algorithm predicted the lateral error (elateral,future in meters) and heading error (eheading,future in degrees) of the car with respect to the lane center 1.0 s (look-ahead time) into the future by assuming a constant steering wheel angle. Second, the haptic algorithm used elateral,future and eheading,future to calculate Tguidance.
Two types of continuous guidance systems and two types of bandwidth guidance systems were evaluated. For continuous guidance, Tguidance (Nm) was calculated according to Equation 1.

For the normal continuous guidance (Cont), the feedback gains were D = 0.08, P = 0.9, and Kf = 2.0, identical to Mulder et al. (2012). For the strong continuous feedback (ContS), we used the same D and P, but Kf = 4.0.
For the normal bandwidth guidance (Band1), the system was designed to guide only when the predicted elateral,future exceeded 0.5 m. Tguidance was calculated according to Equation 2, using D = 0.08 and Kf = 2.0.

The second bandwidth guidance system (Band2) had two states of operation. In State 1, the Band2 controller was the same as Band1 (Equation 2). When elateral,future turned greater than 0.5 m, the system would switch to State 2. In State 2, the controller would exert torque until elateral,future was within 0.1 m of the lane center (Equation 3). Consequently, Band2 would initially operate as Band1, but once activated, the controller continued to guide the driver back toward the middle of the lane, deactivating only when within a predicted error of 0.1 m.

Experiment Design
A within-subjects, repeated-measures design was used. All participants drove one trial in each of the following five conditions: Manual, Band1, Band2, Cont, and ContS. Conditions were counterbalanced across participants.
The participants drove on a single-lane road 3.6 m wide and 12,232 m long. The speed was controlled automatically at 100 km/h, and therefore participants did not use the brake and gas pedals. No other vehicles shared the road. The trajectory was identical for each trial and consisted of straights and three types of curves with an inner radius of 1,500 m, 750 m, and 500 m. Each trial lasted 440 s. A movie of the driving scene is available in the online supplementary materials.
While driving, the participants had to perform a secondary peripheral detection task for determining visual/mental load. A red square would appear at random intervals between 4 and 8 s at one of 20 fixed locations (see Figure 2). The order of the locations was random. The stimuli would disappear when the participant clicked one of the mouse buttons or 3.0 s after the stimulus had appeared.
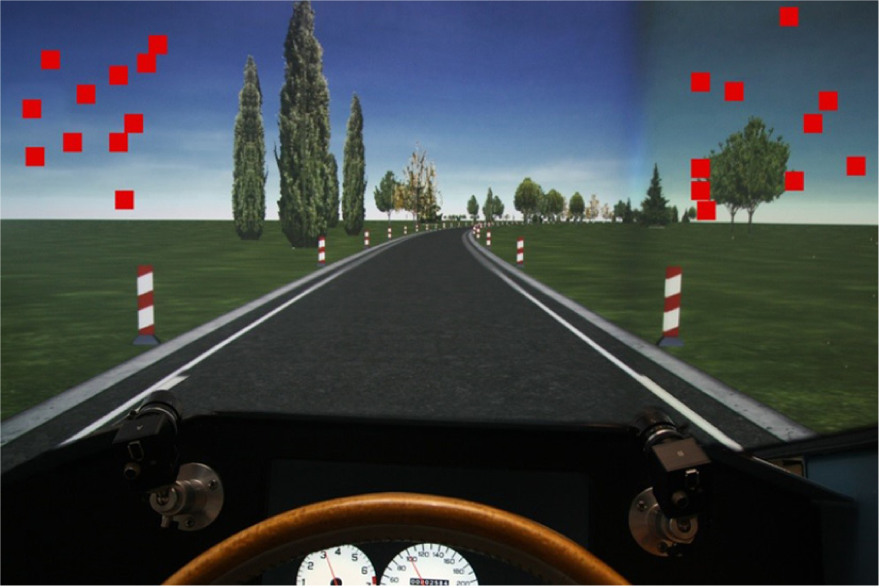
Photo of the driving simulator. The superimposed squares indicate the positions where visual stimuli could appear.
In order to investigate short-term aftereffects of driving with haptic guidance, the system shut down 1,503 m before to the end of the trajectory (41 m prior to a right curve with inner radius = 750 m and length = 500 m). Henceforth we refer to the curve after the shutdown as the shutdown curve. The actuator exerted no feedback torque for the remainder of the trial, which implied that the steering system was identical to the Manual condition. For reference purposes, a comparison curve was defined that had the same characteristics as the shutdown curve. The comparison curve started 1,500 m after the start of each trial.
Procedure and Instructions
The participants read and signed a written consent form, explaining the purpose and procedure of the experiment. The participants were informed that a “haptic support system will support you [the driver] in the lateral control task [staying inside the lane] by providing a torque on the steering wheel.” The form further informed the participants that the haptic support was “not 100% reliable” and that it was “possible that it shuts down during the trial.” Even though the shutdown moment occurred at the same point along the route in each trial, we expected that participants would not be able to anticipate the shutdown moment. The route featured no visual landmarks that allowed people to memorize their location in the virtual environment.
The form also stated that the participant’s primary goal was “to drive the car within the lane boundaries as you normally would,” explained the secondary peripheral detection task, and informed them that they could withdraw from the experiment at any time.
Next, the participant filled out a questionnaire regarding their demographics and driving experience before being asked to take place in the driver’s seat. The experimenter then repeated the driving tasks (primary task: lane keeping; secondary task: detection of red squares). For the secondary task, the participants had to react to the red stimuli as quickly as possible by clicking on either of the mouse buttons. Participants had to hold at least one finger of the right hand on one of the mouse buttons at all times and were free to place the left hand at any location on the steering wheel. Before the first trial, the participants practiced the secondary task in a stationary vehicle for 2 min.
After each trial, the participants left the simulator for a 5-min break and filled out the NASA Task Load Index (NASA-TLX; Hart & Staveland, 1988) for assessing workload and the Vanderlaan questionnaire (Van Der Laan, Heino, & De Waard, 1997) for assessing usefulness and satisfaction of the assistance system. Before entering the simulator again, the participants were asked to indicate whether they suffered from simulator sickness on a scale from 1 to 6 (1 = no sign of symptoms, 2 = arising symptoms, 3 = slight nausea, 4 = nauseous, 5 = very nauseous, 6 = vomiting). In case of a response of 4 or higher, the experiment would be stopped. The experiment took approximately 1 hr per participant to complete. The study was approved by the Human Research Ethics Committee of the Delft University of Technology.
Dependent Measures
First, the data were analyzed separately for the different sections (i.e., straights and curve types). As there were only small relative differences between conditions for the various road sections, we decided to combine curved and straight road segments in our analyses.
The following measures were calculated for each condition per participant for the trajectory up to the shutdown moment (i.e., across a 10,729-m long segment).
Mean and maximum of absolute lateral position (meters). These measures describe the lane-keeping accuracy.
Standard deviation of lateral position (meters). This is a commonly used measure to describe the driver’s lateral swerving behavior with respect to the mean lane center error.
Minimum absolute time to line crossing (seconds). This metric was approximated using the first and second derivative of the lateral position (i.e., lateral velocity and acceleration; Van Winsum, Brookhuis, & de Waard, 2000). The minimum absolute of the time to line crossing was the single lowest value over the evaluated trajectory and shows the closest the driver had been to leaving the lane.
Mean absolute driver torque (newton meters). This measure describes the torques measured on the steering wheel. A high torque occurs when the driver resists the torques applied by the feedback motor. A low torque occurs when the driver gives way to the applied torques.
Mean absolute steering wheel velocity (degrees per second). This is a measure of control activity; a higher value indicates that the driver applied more rapid steering wheel movements.
Mean reaction time (s) of the peripheral detection task. The reaction time was the time measured from the appearance stimulus until the participant pressed a mouse button. A stimulus was recorded as missed when the participant failed to press a mouse button within 3.0 s from its appearance. The number of stimuli slightly varied across the individual trials, because participants had different mean reaction times and because the stimuli appeared randomly between 4 and 8 s after clicking the mouse button. To discard any lead-in effects, we ignored the first four stimuli for every participant and calculated the mean reaction time across stimuli up to the shutdown curve.
Overall NASA-TLX score was determined with a software tool developed by Sharek (2011). The tool determined the weighted NASA-TLX score as a percentage using the six separate workload scales (Mental Demand, Physical Demand, Temporal Demand, Performance, Effort, and Frustration).
Satisfaction and usefulness scores of the Vanderlaan questionnaire. The usefulness and satisfaction scores, ranging from +2 to −2, were determined by taking the average score across five items (Item 1, useful–useless; Item 3, bad–good; Item 5, effective–superfluous; Item 7, assisting–worthless; Item 9, raising alertness–sleep-inducing) and four items (Item 2, pleasant–unpleasant; Item 4, nice–annoying; Item 6, irritating–likeable; Item 8, undesirable–desirable), respectively. Appropriate sign reversals were conducted for Items 3, 6, and 8.
We performed the following descriptive analyses to gain insight into the distribution of lateral position and individual differences in lane keeping performance.
Distribution of lateral position for all participants combined. The distribution was calculated per condition across all data points until the shutdown curve, between −1.0 and 1.0 m from the lane center with bins of 0.01 m.
The time-locked standard deviation of lateral position in the shutdown curve. The standard deviation was calculated across all participants per time point.
In order to investigate the aftereffects, we compared the measures of mean and maximum absolute lateral position, minimum absolute time to line crossing, and mean absolute steering wheel velocity between the shutdown and comparison curves. For the shutdown curve, the selected interval started at the shutdown moment (i.e., 41 m before the curve) and ended 389 m later (i.e., 348 m into the curve). For the comparison curve, the same 389 m interval was selected, starting 41 m before the curve.
Statistical Analyses
For each dependent measure, we obtained a matrix of numbers (i.e., 32 participants × 5 conditions). The numbers in this matrix were transformed to ranks (Conover & Iman, 1981) to cope with potentially non-normal distributions and unequal variances. The 32 × 5 matrix of rank-transformed numbers was submitted to analysis of variance (ANOVA) with the five conditions as within-subjects factor. Simulation studies have shown that this procedure compares favorably to the Friedman test when not testing for interaction (Conover, 1997; Iman, Hora, & Conover, 1984). Ninety-five percent confidence intervals were calculated of the ranked means to investigate statistical significance among pairs of conditions. A Tukey’s honestly significant difference criterion was used. A CSV file containing the matrices of the dependent measures and a computer script of the statistical analyses are available in the online supplementary materials.
Results
The distribution of the lateral position over the trajectory before the shutdown moment of all participants for the five conditions is shown in Figure 3. It can be seen that the ContS condition has the narrowest distribution, followed by the Cont condition. Band1 shows a sudden drop in the distribution around 0.5 m and −0.5 m. It can be seen that all four feedback systems (Band1, Band2, Cont, and ContS) prevented large absolute lane center errors (>0.7 m).
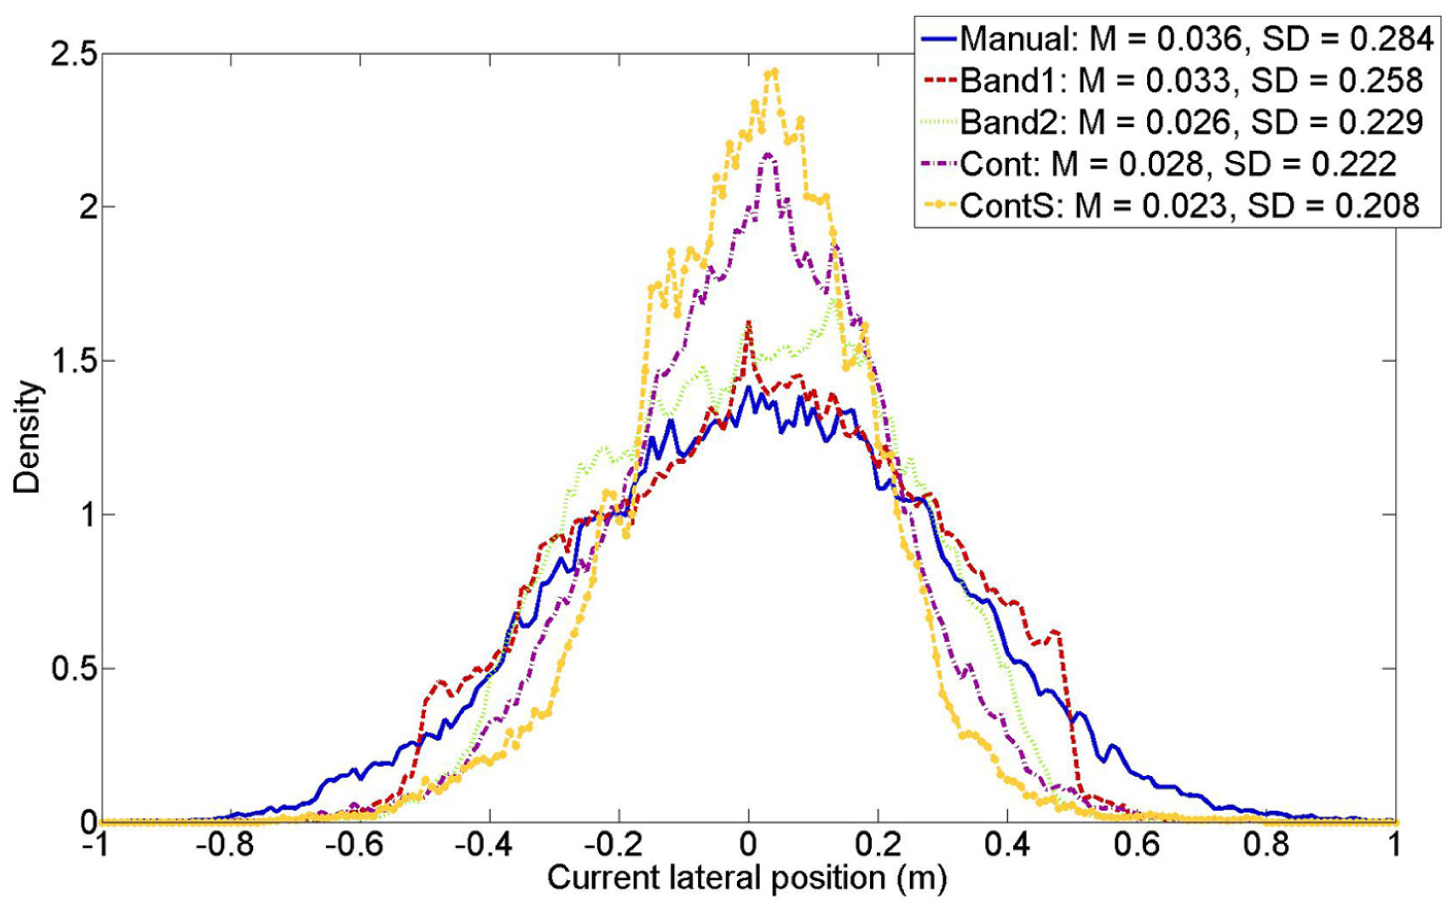
Distribution of the lateral position (m) over the trajectory before the shutdown moment of all participants per condition (i.e., Manual, Band1, Band2, Cont, ContS). Bins are 0.01 m. The area under each of the five curves equals 1.
Table 1 shows the means and standard deviations of the dependent measures across participants, including the p value of the ANOVA and pairwise comparisons among the conditions. ContS yielded better lane-keeping performance (i.e., lower mean and maximum absolute lateral error, lower standard deviation of lateral position, higher time to line crossing) than Cont. The Cont condition in turn yielded a better performance than Band1 and Band2. The Band1 and Band2 systems in turn showed a better performance than the Manual condition.
Means and Standard Deviations of the Dependent Measures
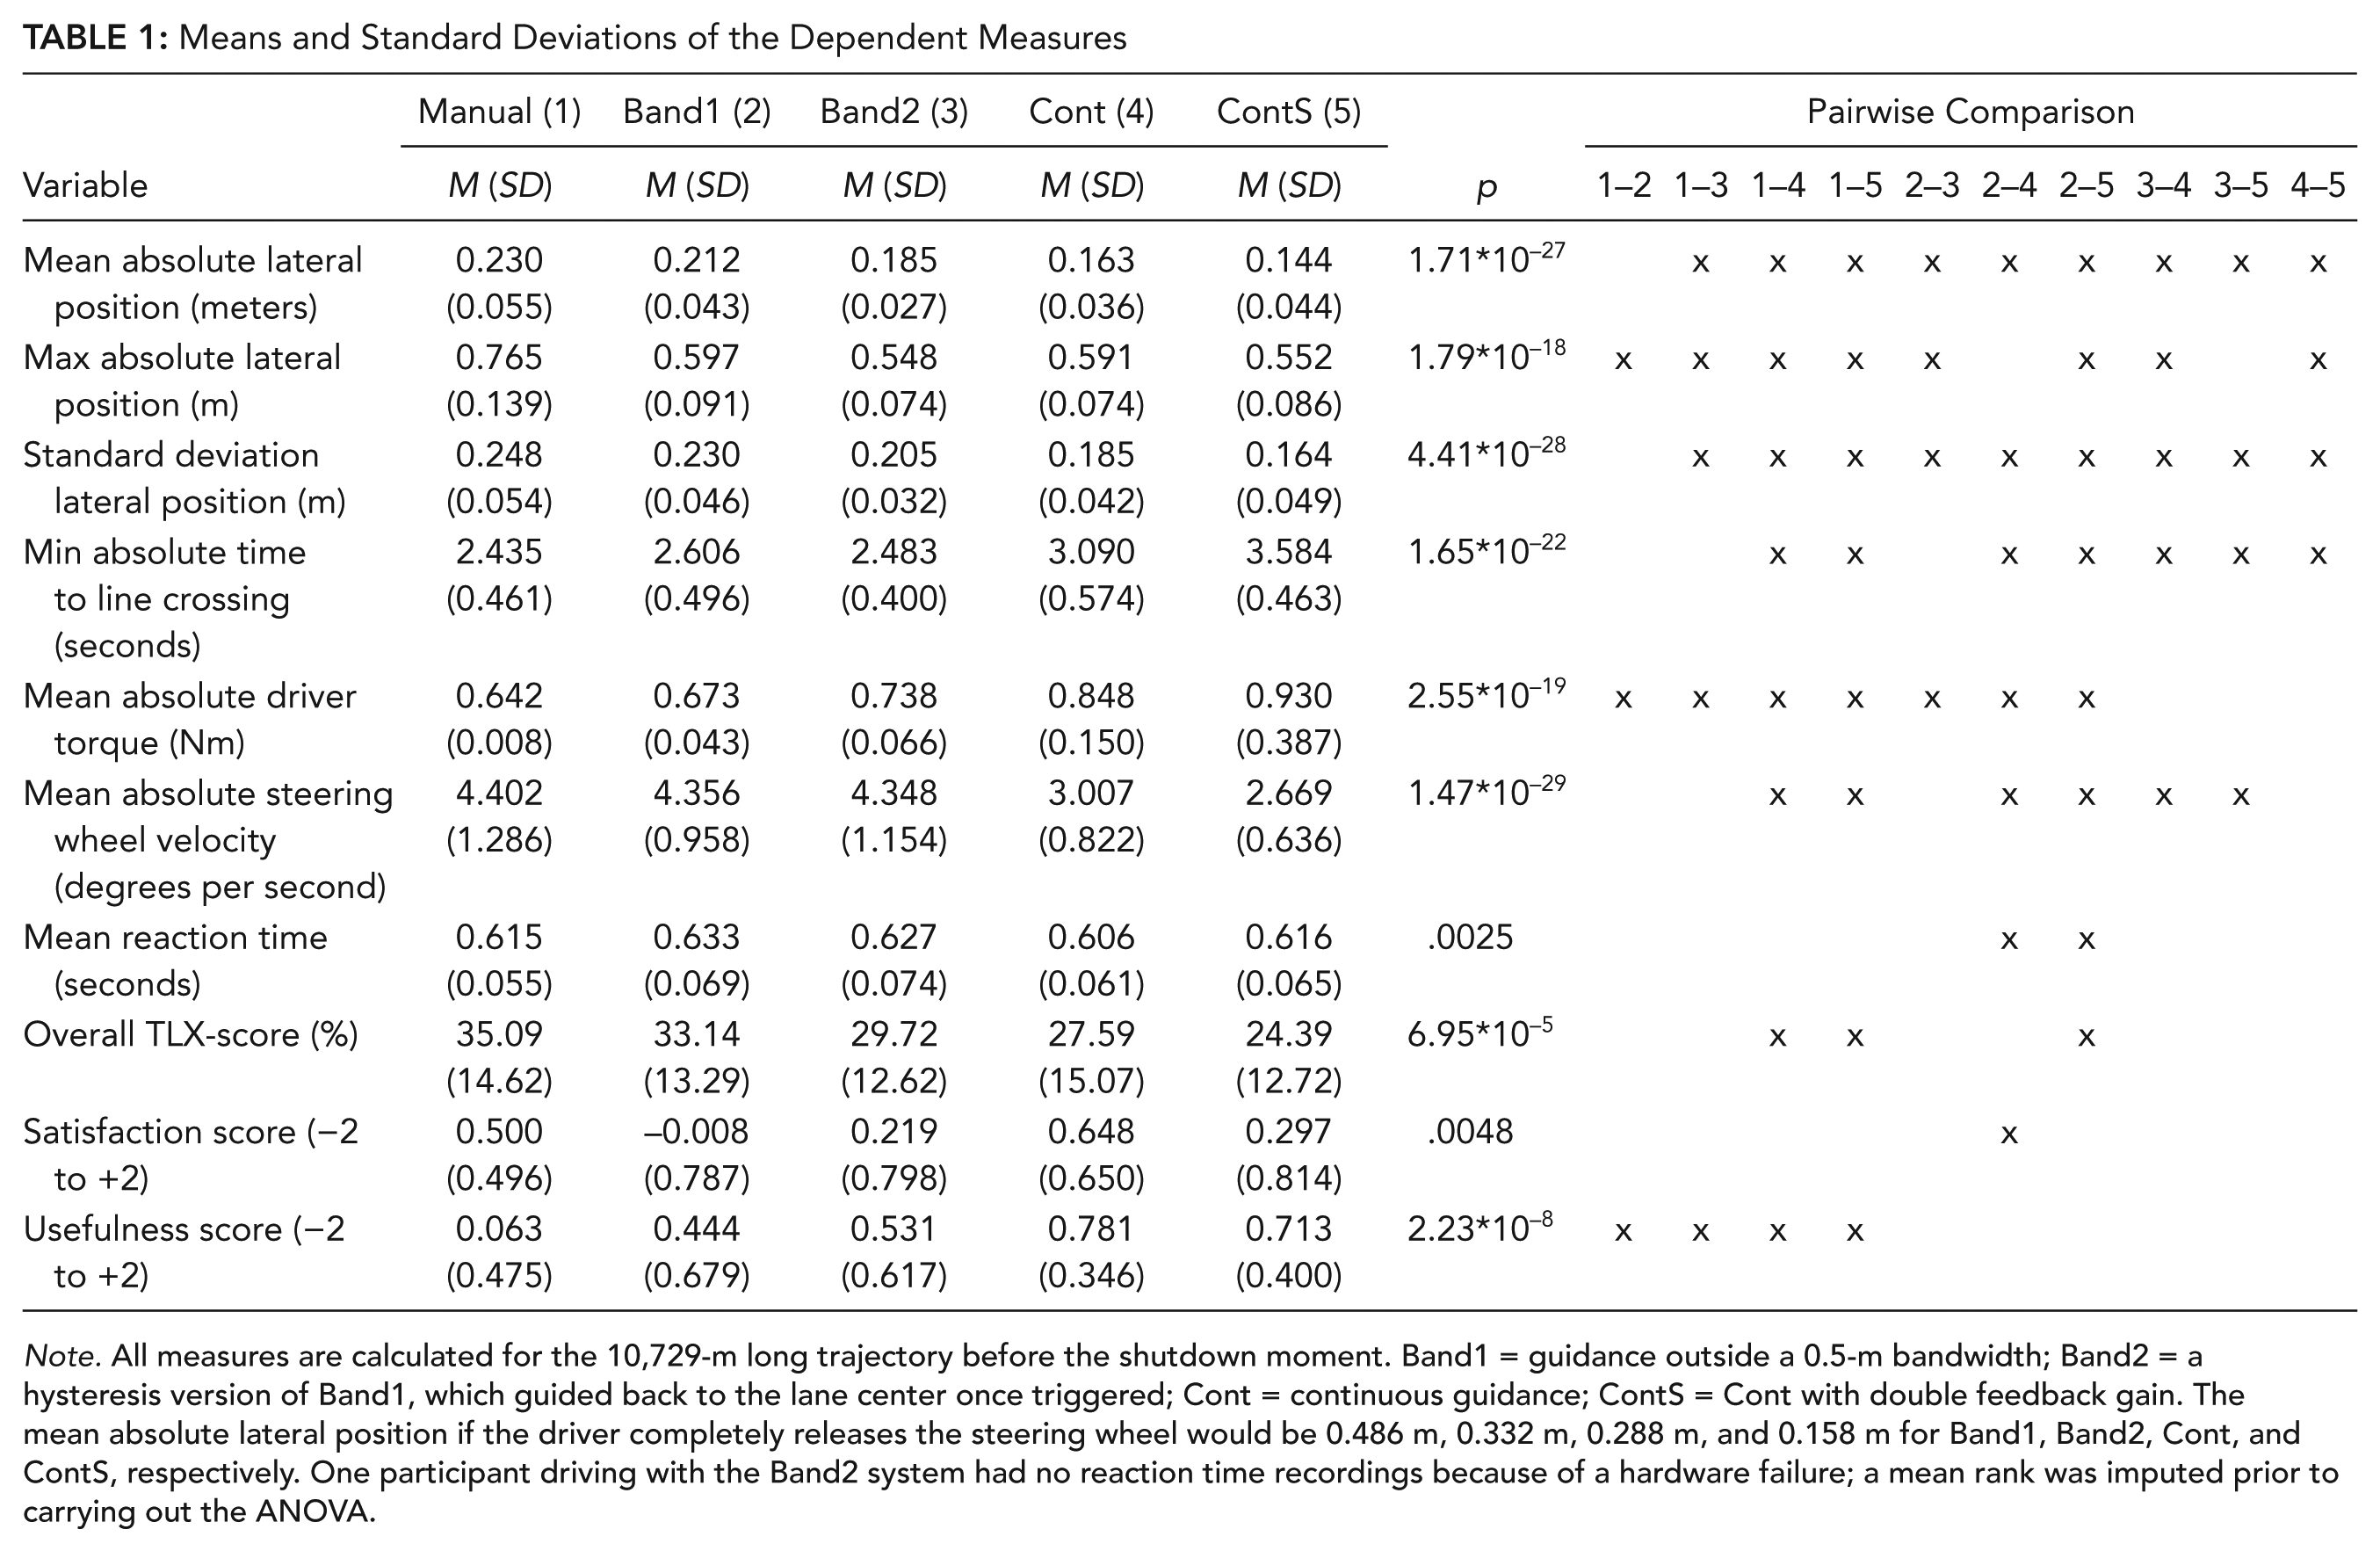
Note. All measures are calculated for the 10,729-m long trajectory before the shutdown moment. Band1 = guidance outside a 0.5-m bandwidth; Band2 = a hysteresis version of Band1, which guided back to the lane center once triggered; Cont = continuous guidance; ContS = Cont with double feedback gain. The mean absolute lateral position if the driver completely releases the steering wheel would be 0.486 m, 0.332 m, 0.288 m, and 0.158 m for Band1, Band2, Cont, and ContS, respectively. One participant driving with the Band2 system had no reaction time recordings because of a hardware failure; a mean rank was imputed prior to carrying out the ANOVA.
Cont and ContS yielded higher torques but lower steering wheel speeds than Band1 and Band2, indicating smoother steering behavior. It is interesting to observe that ContS yielded approximately the same level of mean absolute driver torque as Cont but with much higher standard deviations (see also Figure 4). In other words, there were large individual differences in the use of the ContS system: Some drivers resisted the feedback torques, whereas others almost released the steering wheel.
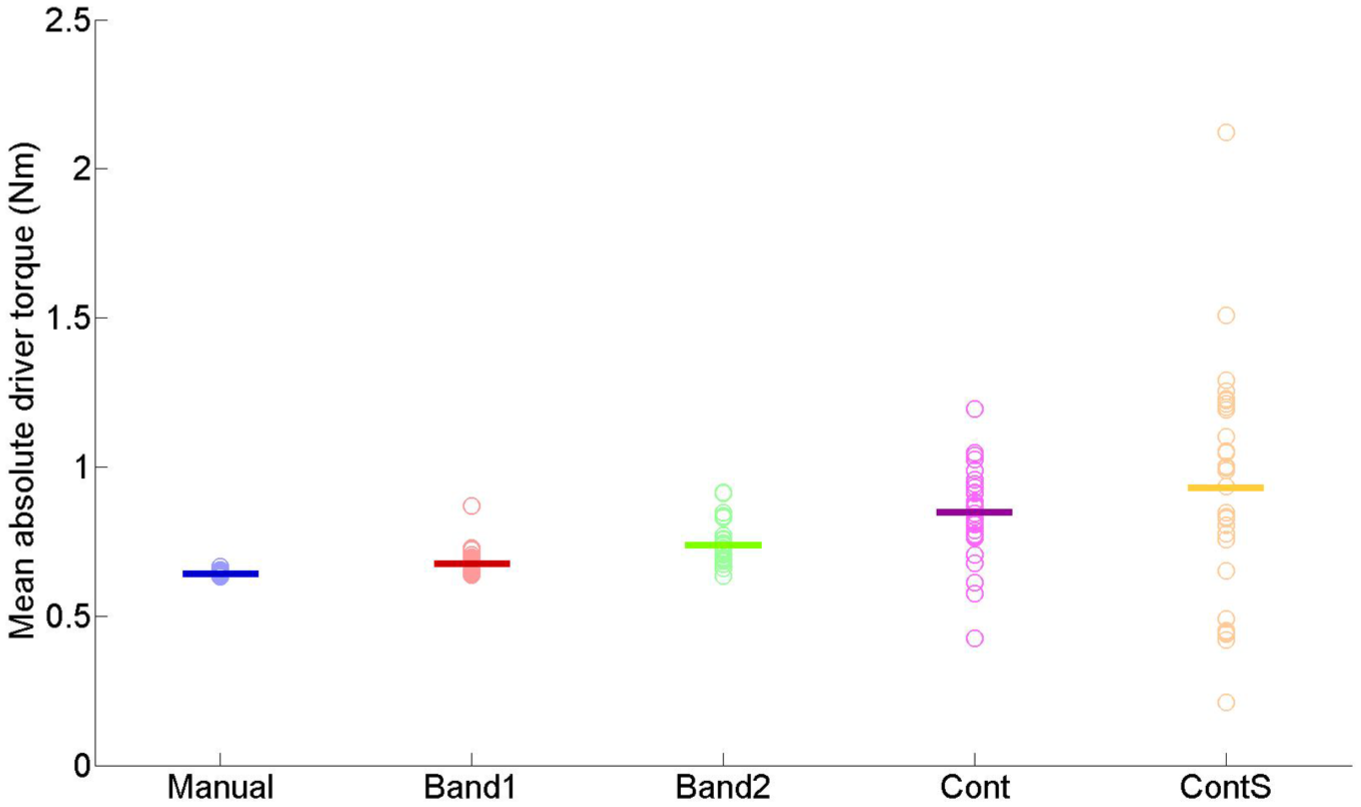
Mean absolute driver torque (Nm) for the 10,729-m long trajectory before the shutdown moment. Circles represent the individual participants. Horizontal lines indicate the means across the participants.
Band1 yielded a slower reaction time on the peripheral detection task than Cont and ContS, whereas all other combinations of conditions were not significantly different. The number of missed stimuli was low: Only 0.32, 0.16, 0.22, 0.16, and 0.11% of the stimuli were missed for the Manual, Band1, Band2, Cont, and ContS conditions, respectively.
Table 1 further shows that the participants found Cont more satisfactory than Band1. The usefulness scale showed that all feedback systems were considered more useful than manual control.
Figure 5 shows the time-locked standard deviation of lateral position for the trajectory between 16 s before and 19 s after the shutdown moment. It can be seen that the time-locked standard deviation of lateral position before the shutdown curve was fairly similar for all conditions. In the shutdown curve, the continuous conditions show a large peak at the beginning of the curve, indicating there were large individual differences in lateral position.

Time-locked standard deviation of the lateral position (m) between the participants across the time points in the shutdown curve. The failure moment occurs around 386 s (indicated by the vertical line). The shutdown curve starts 1.5 s (41 m) later. The top figure shows the curvature (= 1/radius in meters).
The dependent measures regarding aftereffects are shown in Table 2. Overall, Cont and ContS yielded better lane-keeping performance (i.e., in terms of lower mean maximum absolute lateral position, higher time to line crossing, and lower steering velocities) in the comparison curve as compared to Manual, Band1, and Band2 conditions. However, the opposite trend can be seen in the shutdown curve. Cont and particularly ContS yielded worse lane-keeping performance than the other three conditions. The maximum absolute lateral position in the comparison and shutdown curves is illustrated in Figure 6. Cont and ContS yielded significantly lower maximum lateral position than Manual and Band1 conditions in the comparison curve, but in the shutdown curve, ContS actually yielded a significantly higher maximum lateral position than Manual, Band1, and Band2 conditions.
Means and Standard Deviations of the Dependent Measures Used for Judging Aftereffects
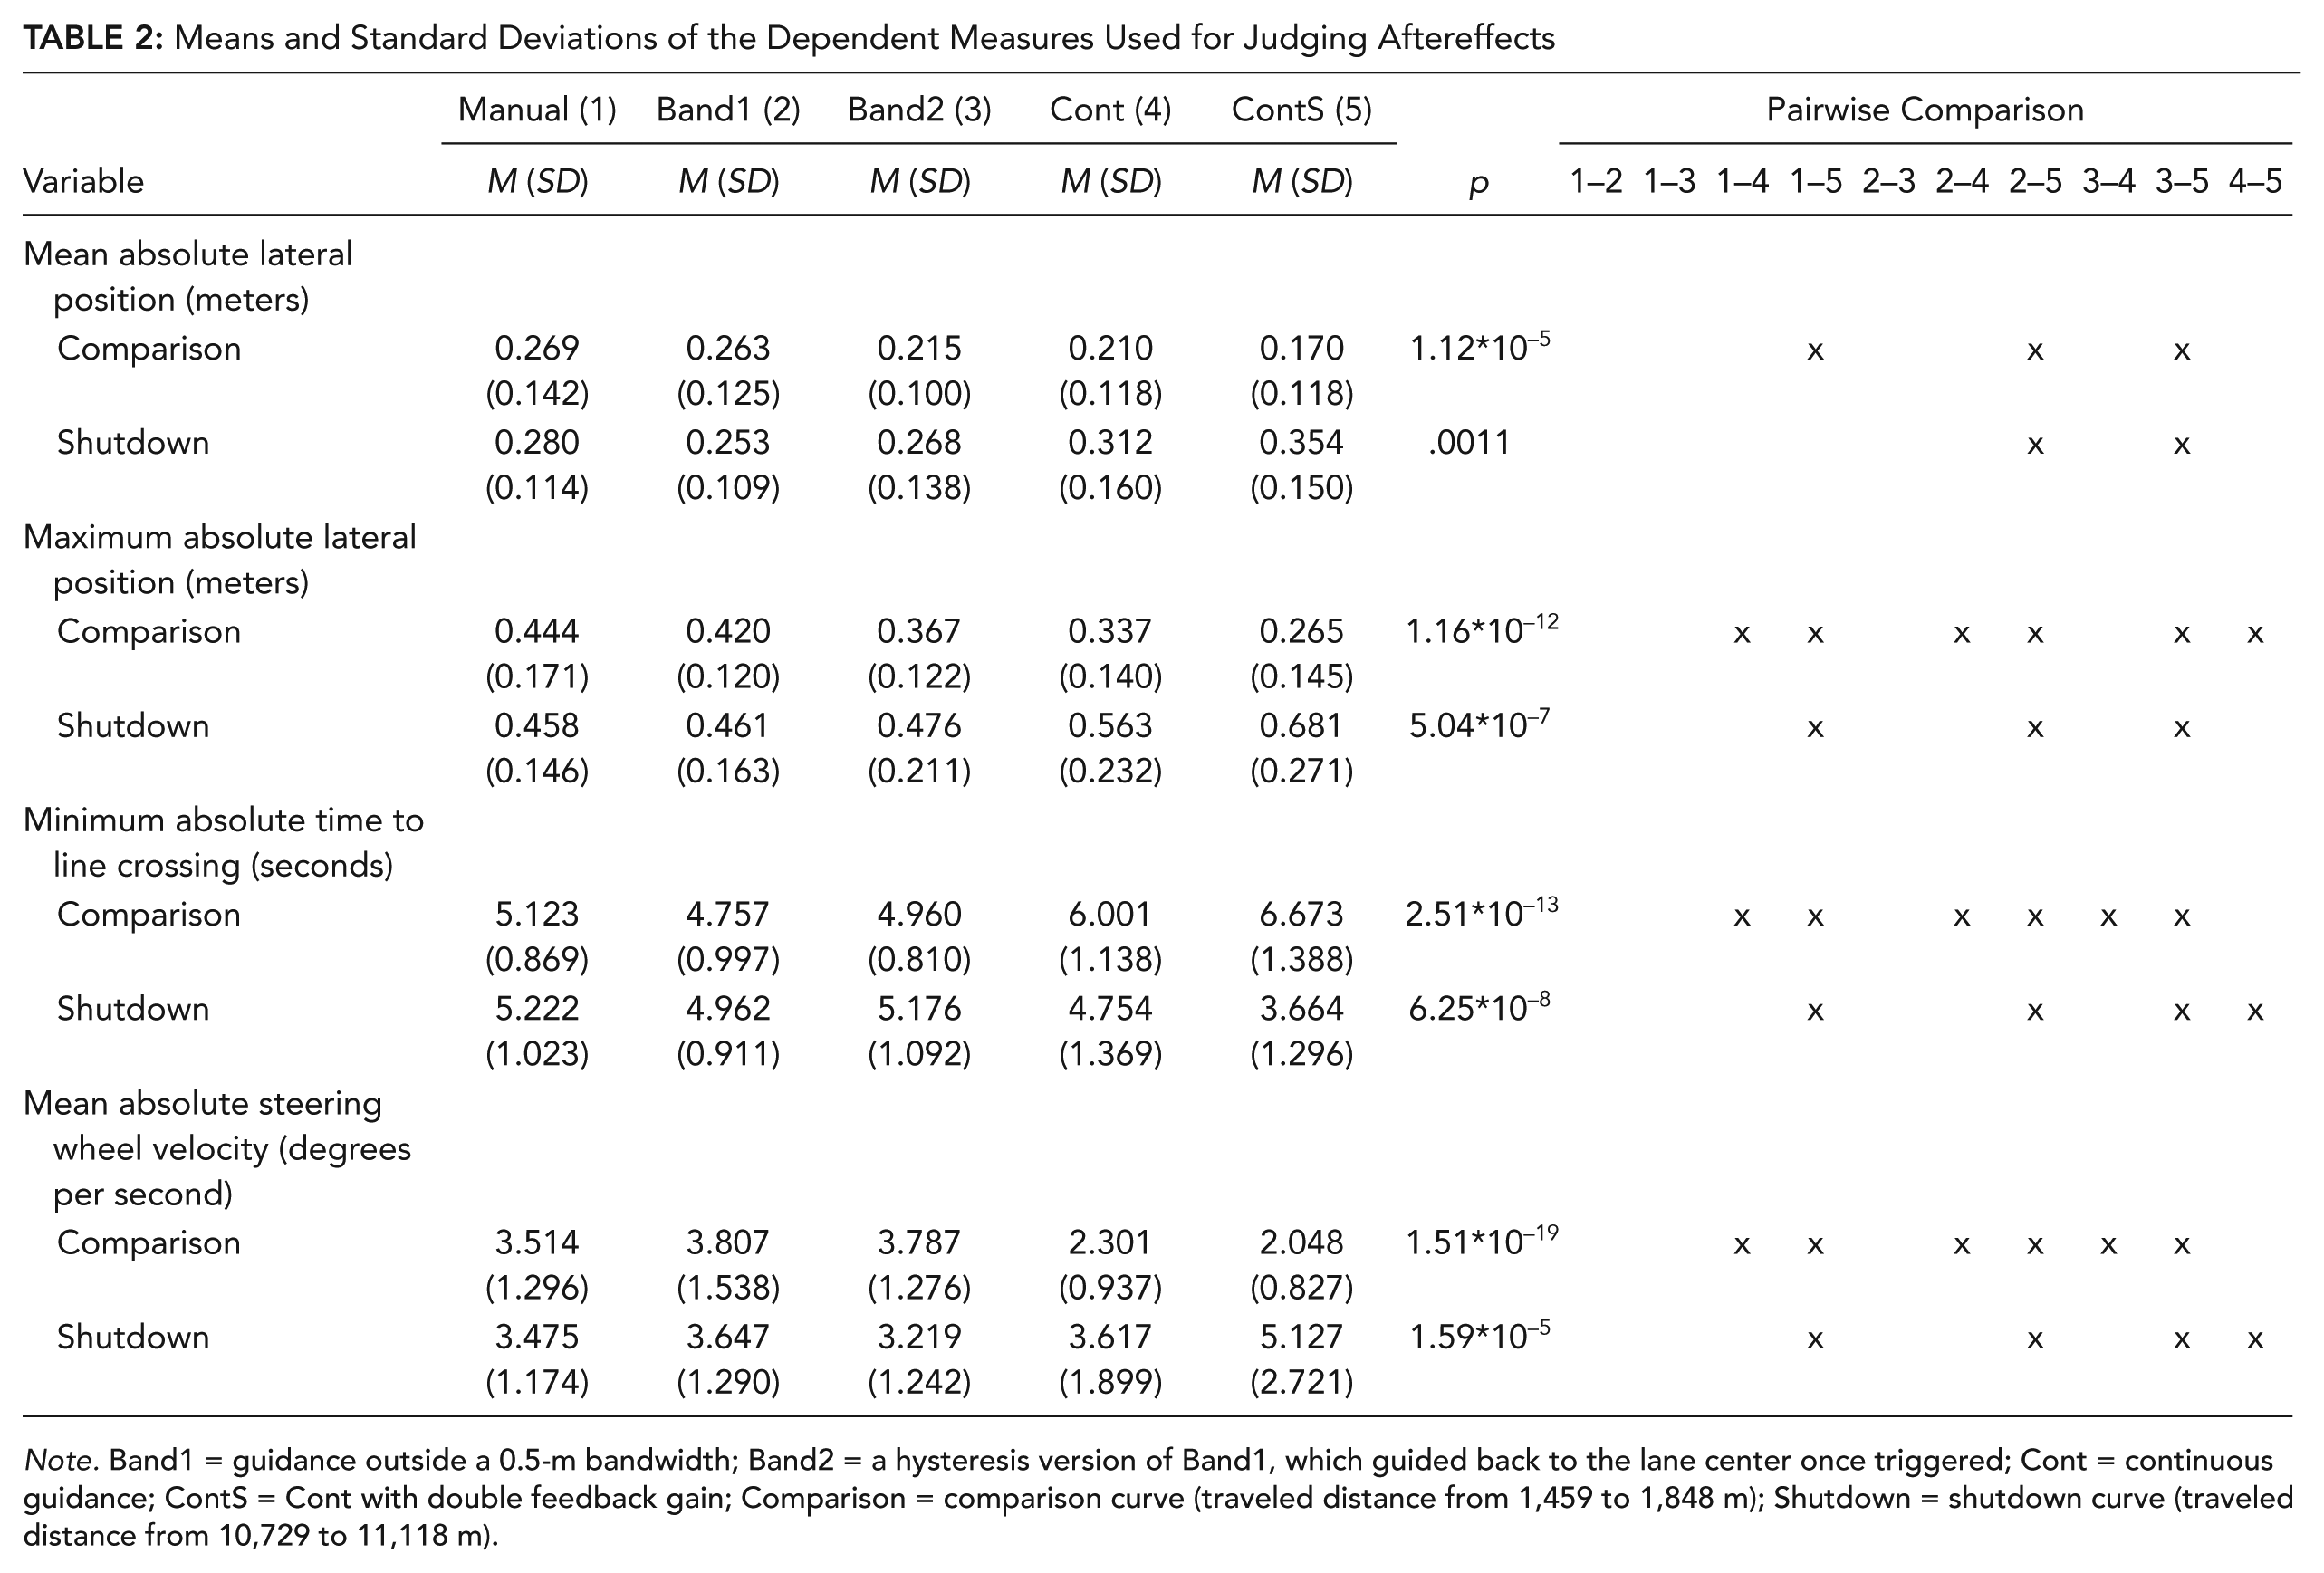
Note. Band1 = guidance outside a 0.5-m bandwidth; Band2 = a hysteresis version of Band1, which guided back to the lane center once triggered; Cont = continuous guidance; ContS = Cont with double feedback gain; Comparison = comparison curve (traveled distance from 1,459 to 1,848 m); Shutdown = shutdown curve (traveled distance from 10,729 to 11,118 m).
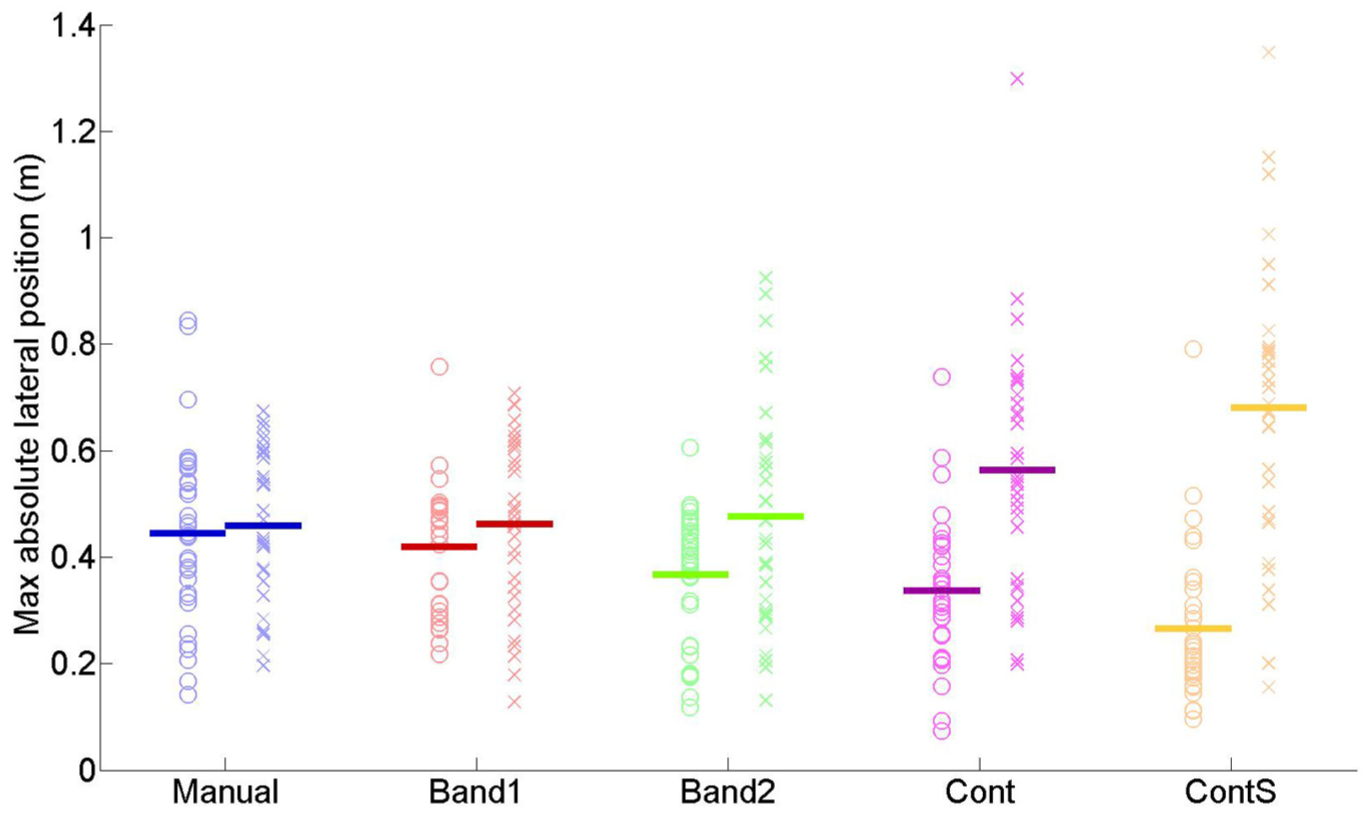
Maximum absolute lateral position (m) in the comparison (left) and shutdown curve (right). Circles represent the individual participants in the comparison curve; crosses represent the individual participants in the shutdown curve. Horizontal lines indicate the means across the participants.
In a supplementary analysis, we found that the mean absolute driver torque was not strongly correlated with the NASA-TLX score. Specifically, the corresponding Spearman correlation coefficients were .55 (p = .001) for Manual, .01 (p = .972) for Band1, .10 (p = .584) for Band2, −.17 (p = .363) for Cont, and .25 (p = .176) for ContS (N = 32 for each correlation coefficient). In other words, the objective physical workload was not clearly correlated with the self-reported workload.
The performance after the shutdown moment could be predicted from the way the participants held the steering wheel. Specifically, the Spearman correlation coefficients between the mean absolute driver torque in the straight before the shutdown curve (traveled distance from 10,570 to 10,729 m) and the maximum lateral position up to 3 s after the shutdown moment (traveled distance from 10,729 m to 10,812 m) were −.27 (p = .141) for Manual, .23 (p = .201) for Band1, .29 (p =.114) for Band2, .58 (p = .001) for Cont, and .54 (p = .002) for ContS. In this analysis, we defined maximum lateral position based on the maximum absolute lateral position and by subsequently assigning the correct sign with respect to the lane center (negative = left; positive = right). These positive correlations indicate that participants who resisted the continuous feedback torque prior to the failure moment tended to stray more to the right (i.e., toward the inside of the curve) in the 3 s after the shutdown moment.
We checked whether there were any session order effects, such as performance improvements due to learning. To this end, the 32 × 5 matrix of rank-transformed numbers was again submitted to ANOVA but now with the session order as within-subjects factor. From the 18 dependent measures shown in Tables 1 and 2, the mean absolute steering wheel velocity (p = .002; Session 1, M = 4.387° per second; Session 5, M = 3.398° per second), the mean NASA-TLX score (p = .017; Session 1, M = 34.36%; Session 5, M = 27.60%), and the mean absolute steering wheel velocity in the comparison curve (p = .006; Session 1, M = 3.901° per second; Session 5, M = 2.655° per second) were the ones that showed statistically significant session order effects. Applying a rank transformation correction to account for these session order effects hardly influenced our results. Specifically, the number of statistically significant pairs in Tables 1 and 2 increased from 90 out of 180 to 93 out of 180. The computer script of the session order analyses is provided in the online supplementary materials.
On the simulator sickness scale from 1 to 6, 143 out of 160 responses were 1, and 17 of 160 responses were 2. None of the respondents indicated a score of 3 or higher.
Discussion
We investigated the effects of continuous guidance and bandwidth guidance on driver performance, workload, and satisfaction. We tested the systems during nominal driving conditions but also when the support system was unexpectedly deactivated.
Benefits and Limitations During Normal Operation
We found benefits for continuous guidance that correspond to previous findings in the literature (Flemisch et al., 2008; Mulder et al., 2012). Specifically, drivers supported by continuous guidance had more accurate lane-keeping performance (in terms of lateral position and time to line crossing) than when steering manually or when supported by bandwidth feedback. We also found that bandwidth guidance was equally effective as continuous guidance in reducing the maximum absolute lateral position. Our results indicate that more (i.e., more frequently occurring or stronger) guidance implies improved lane-keeping performance, consistent with the idea that humans integrate visual and haptic information (Ernst & Banks, 2002).
Self-reported workload decreased monotonically with increasing levels of guidance (Table 1; see Damböck et al., 2013, and Flemisch et al., 2008, for similar findings). However, the peripheral detection task did not reveal clear effects. This discrepancy may have occurred because the peripheral detection task is sensitive to visual and mental load, whereas self-reports, such as the NASA-TLX, are also sensitive to other dimensions of workload, including physical demands. If drivers released the steering wheel during the strongest haptic guidance (ContS), they would still achieve a better performance (i.e., mean absolute lateral position = 0.158 m) than the average driver in the Manual condition (mean absolute lateral position = 0.230 m). This phenomenon may have contributed to the drivers’ impression of low workload.
Aftereffects
The continuous guidance (especially the strong variant, ContS) yielded aftereffects when the system was unexpectedly deactivated, whereas neither bandwidth system yielded identifiable aftereffects. When driving with a bandwidth feedback system, the driver essentially remains a manual controller for most of the time and receives a corrective steering torque only when the boundaries of acceptable driving performance are exceeded. Using this approach, the driver cannot become dependent on continuous corrective support.
The aftereffects were most pronounced for lateral position and less evident for time to line crossing. In fact, the mean minimum absolute time to line crossing after the shutdown moment was 3.7 s for the ContS system (Table 2), which was still greater than the 2.5 s for the Manual, Band1, and Band2 systems during the 6.5 min before the shutdown (Table 1). This result suggests that the dangers caused by aftereffects are less severe than the dangers caused by not using continuous feedback. Furthermore, the aftereffects for the continuous systems turned out to be short-lived (Figure 5), indicating that drivers quickly adapted to the system failure (cf. Abbink et al., 2012).
For the bandwidth systems, the majority of drivers did not (and could not) notice that the system disengaged, because their lane center error was above the threshold value of 0.5 m for only a small fraction of the driving time (2.8% for Band1). Contrastingly, participants usually verbally reported after the trial that they realized that the continuous guidance had been shut down. These comments are consistent with Mulder et al. (2012), who stated that continuous feedback results in awareness of the system’s functionality.
Future research could investigate ways to remediate negative effects after system failure. For example, it is possible to let drivers complete a “readiness test” (cf. Levitan, Golembiewski, & Bloomfield, 1998) or to provide a warning (cf. Gold, Damböck, Lorenz, & Bengler, 2013) before they are expected to resume manual control. Furthermore, our research suggests that adaptive automation approaches might be feasible, as we showed that it is possible to predict which drivers will be susceptible to aftereffects based on how firmly they hold the steering wheel prior to the shutdown moment.
In our experiment, the system failure resulted in a complete absence of the feedback torques on the steering wheel. Other types of system failures can be envisioned as well, such as nuisance feedback torques, attenuated feedback torques, or feedback torques that guide the driver along a lane that is prohibited for driving (cf. Nilsson, Strand, Falcone, & Vinter, 2013, for a study into the driver’s response for different types of adaptive cruise control failures). The advantage of bandwidth feedback is that some lane-detection sensor noise will not have an adverse consequence on driving performance. However, with bandwidth feedback, the driver will probably recognize the failing sensor later in time, as compared to continuous feedback. Not only the type of failure but also the failure rate will have an impact on performance as well as on the level of trust and (dis)use of automation (e.g., De Vries, Midden, & Bouwhuis, 2003; Parasuraman & Riley, 1997).
System Acceptance
System acceptance is probably an important factor in introducing haptic driver support systems in the real world. Some participants spontaneously reported after the experiment that the binary behaviour of the Band1 system was annoying and difficult to interpret. Suzuki and Jansson (2003) found similar response of participants who drove with a system that provided torque pulses on the steering wheel when a lateral error was exceeded. The hysteresis filter of the Band2 design is a good example of how a bandwidth algorithm can be modified to accomplish better satisfaction among drivers.
We found large individual differences in how participants responded to the continuous haptic systems: Some drivers resisted the steering feedback torques, whereas others gave way to them. Some participants reported that the ContS system imposed too much force on the steering wheel, leaving little room for the human to contribute to the lane-keeping task. This observation corresponds to previous research that shows the feedback gain to be an important design parameter, influencing driving behavior and acceptance (Abbink et al., 2012; Mars et al., 2014; Mulder et al., 2012).
Limitations and Implications for Future Work and Real-World Driving
Each participant drove 7 min 20 s per feedback condition, amounting to a total driving time of 37 min. Larssen (2012) showed that drivers who owned an adaptive cruise control system for a longer period of time were more aware of the system’s functional limitations. Regarding haptic shared control, research into such long-term effects is still lacking (Abbink et al., 2012; de Winter & Dodou, 2011).
In our experiment, the driving task was relatively uncomplicated, featuring a single-lane road with smooth curves and no traffic. For more complex driving environments, disagreements between haptic guidance and human intention may occur more often. For example, human–automation conflicts may arise in situations where drivers want to “hug” the inside of a curve while being guided to the lane center (Mulder et al., 2012). To solve conflicts for continuous guidance, its design must be based on a more intelligent driver model than the simple look-ahead controller employed in this study and should ideally allow for individual driving styles (cf. Mars et al., 2011). Bandwidth feedback inherently circumvents this issue by allowing different driving styles within the predefined tolerance zone.
In summary, continuous and bandwidth haptic guidance prevented large lane center errors equally well. However, we found benefits and limitations to each of the evaluated system designs. Compared to bandwidth guidance, continuous guidance resulted in more accurate lane-keeping performance, higher ratings of satisfaction, and lower reaction times to peripheral stimuli. On the downside, the continuous systems resulted in aftereffects and variability of steering torques, indicating reliance and conflicts between driver and support. The aftereffects and conflicts were less prominent for Cont than for ContS, indicating the importance of the feedback-gain parameter. The bandwidth systems did not result in detectible conflicts or aftereffects.
We investigated the topic of whether human operators should be supported continuously or should be seen as satisficers who need support only when acceptable tolerance limits are exceeded. The trade-offs between bandwidth versus continuous guidance may well generalize to other modalities, such as visual and auditory feedback, and to nonlocomotion tasks, such as teleoperation tasks. Our results are qualitatively similar to those of Schmidt and Wulf (1997), who showed that continuous visual feedback provided during discrete motor tasks improves performance but degrades short-term learning.
Authors of future research should investigate the best tolerance bandwidth and the best ways to trigger guidance and remove it again. We encourage further exploration of intelligent or adaptive guidance algorithms, with the goal of realizing human–automation interaction that maximizes performance and satisfaction but also mitigates aftereffects and conflicts.
Key Points
This driving simulator experiment showed that providing drivers with continuous haptic guidance or bandwidth haptic guidance prevented large lane center errors (>0.7 m), with each type of guidance showing specific additional benefits and limitations.
Continuous haptic guidance resulted in more accurate lane-keeping performance compared to bandwidth guidance and manual driving but evoked aftereffects during subsequent manual driving.
Large individual differences in exerted steering wheel torque were found between drivers supported by the continuous guidance.
Bandwidth guidance did not result in aftereffects or conflicts.
Footnotes
Acknowledgements
This work was completely conducted at the Delft University of Technology. The authors would like to thank Mark Mulder for his technical assistance regarding the preparation of the driving simulator. Sebastiaan Petermeijer and Joost C. F. de Winter are involved in the European Marie Curie ITN project HFAuto—Human Factors of Automated Driving (PITN-GA-2013-605817).

Sebastiaan M. Petermeijer is a PhD candidate in the Ergonomics Department at the Technische Universität München. He received an MSc degree (cum laude) in mechanical engineering from Delft University of Technology, Netherlands, in April 2014.
David A. Abbink is an associate professor in the BioMechanical Department at the Delft University of Technology. He received a PhD degree in mechanical engineering from Delft University of Technology, Netherlands, in 2006.
Joost C. F. de Winter is an assistant professor in the BioMechanical Engineering Department at the Delft University of Technology, where he received his PhD degree (cum laude) in 2009.
References
Supplementary Material
Please find the following supplemental material available below.
For Open Access articles published under a Creative Commons License, all supplemental material carries the same license as the article it is associated with.
For non-Open Access articles published, all supplemental material carries a non-exclusive license, and permission requests for re-use of supplemental material or any part of supplemental material shall be sent directly to the copyright owner as specified in the copyright notice associated with the article.
