
Abstract
Objective:
The aim of this study was to examine variations in drivers’ foot behavior and identify factors associated with pedal misapplications.
Background:
Few studies have focused on the foot behavior while in the vehicle and the mishaps that a driver can encounter during a potentially hazardous situation.
Method:
A driving simulation study was used to understand how drivers move their right foot toward the pedals. The study included data from 43 drivers as they responded to a series of rapid traffic signal phase changes. Pedal application types were classified as (a) direct hit, (b) hesitated, (c) corrected trajectory, and (d) pedal errors (incorrect trajectories, misses, slips, or pressed both pedals). A mixed-effects multinomial logit model was used to predict the likelihood of one of these pedal applications, and linear mixed models with repeated measures were used to examine the response time and pedal duration given the various experimental conditions (stimuli color and location).
Results:
Younger drivers had higher probabilities of direct hits when compared to other age groups. Participants tended to have more pedal errors when responding to a red signal or when the signal appeared to be closer. Traffic signal phases and locations were associated with pedal response time and duration. The response time and pedal duration affected the likelihood of being in one of the four pedal application types.
Conclusion and Application:
Findings from this study suggest that age-related and situational factors may play a role in pedal errors, and the stimuli locations could affect the type of pedal application.
Introduction
The pedal positions in a vehicle have evolved substantially over the years to minimize the likelihood of a pedal misapplication. The brake pedal is typically placed higher than the accelerator pedal (Pollard & Sussman, 1989), and the centers of the brake and gas pedals are separated by roughly one foot length (Pollard & Sussman, 1989; Snyder, 1976). The introduction of brake-to-shift interlocks (BTSI) in the early 1980s minimized pedal misapplication events from occurring at the beginning of the drive cycle (Pollard & Sussman, 1989), specifically for vehicles with automatic transmissions. With BTSI, the brake pedal must always be depressed while the driver shifts into any gear. This requirement prevents any abrupt shifting of the vehicle (Amagasa, 1991) and has been shown to reduce about 83% of unintended acceleration events (Schmidt, 1993). However, Schmidt, Young, and Ayres (1999) later showed that the system could not prevent pedal errors while the car was in motion.
Despite the decades of research in pedal designs, drivers still misapply the pedal. In 2004, approximately 6,000 to 7,000 crashes recorded in police reports in Japan were associated with pedal errors (Institute for Traffic Accident Research and Data Analysis, 2004). Tran, Doshi, and Trivedi (2011) referred to pedal errors as the situation when the driver mistakenly presses the wrong pedal or does not press any pedal at all. Rogers and Wierwille (1988) showed that about 0.2% of participants’ foot movements in a simulator study resulted in the wrong pedal or both pedals being pressed, and Tomerlin and Vernoy (1990) showed that 1 out of 169 drivers would continue to step on the wrong pedal.
In general, most pedal applications (braking or accelerating) are successful in that no safety situations occur. However, some drivers do confuse the pedals or may slip as they transition from one pedal to another. Such pedal misapplications are rare, but a safety concern still exists as to why drivers may confuse or misapply the pedals (Pollard & Sussman, 1989; Schmidt, 1989). Past studies have focused on driver’s pedal response time (Lee, McGehee, Brown, & Reyes, 2002; Muttart, 2005), but few researchers have examined the trajectory of the foot as it transitions from the accelerator to the brake pedal.
Police reports have been used to identify factors associated with crashes that involve pedal misapplication, including driver’s age, gender, and environmental context (Schmidt et al., 1999; Schmidt, Young, Ayres, and Wong, 1997). However, these data sets do not provide information on changes in foot movements. They also rely heavily on self-reports with little information available prior to the incident. More recently, data from integrated cameras, sensors, simulators, and instrumented vehicles provide insights on specific driver errors (Cantin, Blouin, Simoneau, & Teasdale, 2004; Kimura & Shinohara, 2012; Tran et al., 2011). For example, in a study on drivers’ pedal applications using colored stimuli with a stop signal that would interrupt participants’ responses, Kimura and Shinohara (2012) showed that older drivers had greater variability in foot movements when compared to young adults. However, the study did not specifically show a relationship between variability and wrong pedal placement.
Foot movements have also been examined using a vision-based approach to examine drivers’ intent to brake (McCall & Trivedi, 2007; Tran et al., 2011). These studies provide an understanding of foot behaviors from different perspectives. Because the strength and duration of the pedal press may also affect foot movements (Schmidt, 1989), additional studies could provide insights on drivers’ pedal touch movement for different events as well as insights on variability in drivers’ pedal responses.
There are also different classifications of pedal applications. Rogers and Wierwille (1988) defined three types of pedal errors—serious, catch, and scuff—and they also suggested four potential sequences of these applications. Tran et al. (2011), Schmidt and Young (2010), and Young, Heckman, and Kim (2011) considered two types: slip/miss and wrong pedal. Past studies provide definitions of pedal errors, but a complete examination of foot movements should also include types of correct pedal placements as well.
In an actual traffic environment, drivers need to respond to the color of the traffic signal (red, green, or amber), which becomes routine with more skill-based processing. That said, the driver might face situations when the signal transitions to another color at an unanticipated time. The proximity of the traffic signal can affect the quickness of the drivers’ pedal decisions, and any hesitation may result in severe consequences (Doshi, Tran, Wilder, Mozer, & Trivedi, 2012). There could also be significant differences in the mounting of traffic lights given various road types; traffic lights could be mounted on poles situated on street corners, hung over each lane of the road, or installed in the middle of an intersection. Thus, it is possible that different pedal applications may occur depending on whether the traffic lights are to the right, in front of, or to the left of the driver. That is, the external environmental could potentially influence drivers’ pedal applications.
The goal of this study is to identify characteristics of foot behavior and patterns associated with pedal misapplication using a real vehicle placed in a simulated environment (or a hybrid-driving simulator). The two main research questions addressed in this study include the following:
Do differences exist in foot behaviors given traffic signal color and location?
If differences exist, what factors are associated with a larger number of pedal errors?
Method
This study was designed to purposely overexpose drivers to pedal misapplication situations. Given that pedal misapplications are rare events, repeated scenarios were used to identify the likelihood of these situations. It was surmised that the ability to switch between responses is an executive function that has the closest relationship to pedal misapplications. Tasks that require switching of responses might impair human performance (Gilbert & Shallice, 2002; Philipp & Koch, 2005), and depending on the most recent events, the likelihood of a pedal misapplication could increase (Doshi et al., 2012).
Participants
Healthy adults with a valid driver’s license in the state of Iowa (United States) were invited through e-mail and web announcement to attend a 2-hr study. There were 62 drivers who participated in this study. Of these, 19 were removed because either the participant did not pass the screening procedure or portions of the experiment data were missing due to machine malfunctions. Hence, data for 43 subjects (20 males and 23 females) were used in the forthcoming analyses. The subjects ranged in age from 18 to 83 years old. A 2012 Toyota Camry was used in this current study, with none of the participants reporting owning this model year as their primary vehicle. Two participants did report owning a Toyota Camry of model year 2000 and 2011, respectively. Each participant was given a practice drive prior to the study and was compensated $40 for his or her time.
Apparatus
The study used an instrumented 2012 Toyota Camry XLE secured in a stationary position as the driving simulator. The foot pedals were decoupled from control of the vehicle, and sensors were installed to record pedal presses and touches made by the participant. A 70-in. screen was mounted over the hood of the car, on which the driving scenario was projected. Three foot-well cameras were installed to acquire video of foot movements on the pedals. In addition, cameras were installed to acquire videos of the forward view of the driving scenario and the view over the driver’s shoulder. Another video camera was positioned on the driver’s face.
Since the 2012 Toyota Camry was the only vehicle used for the study, the pedal was always in the same position (see Figure 1 for the pedal configuration). The pedals were 6.80 cm apart horizontally from edge to edge. The vertical separation for the brake and gas pedal was 5.80 cm. The gas pedal was 10.5 cm long and 4.0 cm wide. The brake pedal was 6.4 cm long and 11.50 cm wide.

Camera view and placement of reference line.
Road Scenario
The scenarios used (Figure 2a) were based on a previous study conducted in Japan (Abe et al., 2012) and included traffic around the participant’s vehicle, which moved at a moderate level of service. Horizontal traffic signals included red, amber, and green phases (Figure 2b), and the traffic signal could be located in the left, middle, or right of the center lane. The signals appeared at varying lengths of time ranging from 0.76 to 1.13 s (median = 1.04 s). The time interval between the two signals ranged from 0.33 to 2.30 s (median = 0.53 s). The drive encompassed 78 green traffic phases, nine red phases, and seven amber phases (for a total of 94 phases). Participants were not told how many green, red, or amber phases were included in the study. The focus of this study was on the driver’s immediate pedal applications to the red and green phases of the stimuli.

Example of (a) the simulated road environment and (b) the signal light states.
The task in this study was similar to Kimura and Shinohara (2012), who conducted a simple pedal response task using colored stimuli. The road condition (three lanes in one direction) was similar to Doshi et al. (2012), but their traffic signals would appear in the same location. In this current study, the signal varied across the three lanes and may appear closer or farther from the participant. That is, the signal appeared to be closer if the signal was larger in size on the projection screen and farther away if the signal was smaller. The modification was used to address our research question related to differences in foot behavior given traffic signal location. Only one road type was used because Ising, Droll, Kroeker, D’Addario, and Goulet (2012) showed that road condition was not a significant factor related to the delay in driver’s response.
The simulated environment was set up to be in “adaptive cruise control” mode, and the vehicle “steered” itself in the middle lane of the highway. In other words, the scene would move toward the driver at a predetermined rate. This scenario was used given the findings of Abe et al. (2012) that showed no differences in steering angle and lane deviations among drivers in a study on pedal operation.
Procedure
Participants signed an informed consent form upon arriving at the facility and agreeing to participate. They then filled out a questionnaire that included demographic and driving information. Instructions for the main study were provided along with a 2-min practice drive to familiarize participants with the simulator and the driving scenarios. In the main study, drivers were asked to respond as rapidly and accurately as possible in response to several traffic signal phases (stimuli). Their pedal selection was based on the following signal states:
If the signal was green, they were to press the accelerator pedal.
If the signal was amber, they were to do nothing.
If the signal was red, they were to apply the brake pedal.
According to Lococo, Staplin, Martell, and Sifrit (2012), most errors occur when the driver’s foot transitions from the floor toward the pedal(s). Hence, during the “null” state (in between signal lights), the driver was instructed to return his or her feet to a position behind a reference line located on the floor pan (Figure 1). There was no communication between the experimenter and the participant during the study.
Data Analysis
Independent Variables
The experiment included two between-subject factors: age group (four levels) and gender (two levels), and three within-subject factors: signal color (two levels: green and red), signal lane position (three levels: left, middle, and right), and signal distance (two levels: farther and closer). Drivers’ age and gender are included in the analysis given prior associations with pedal error incidents (Lococo et al., 2012). Participants were recruited from four age groups: young (<21 years old, n = 10), middle age (26–55 years old, n = 14), older (60–74 years old, n = 9), and oldest (≥75 years old, n = 10). Older drivers may have more variability in foot movements when compared to young adults (Cantin et al., 2004), and it was of interest to explore whether this greater variability would increase the likelihood of a wrong pedal press.
Dependent Variables
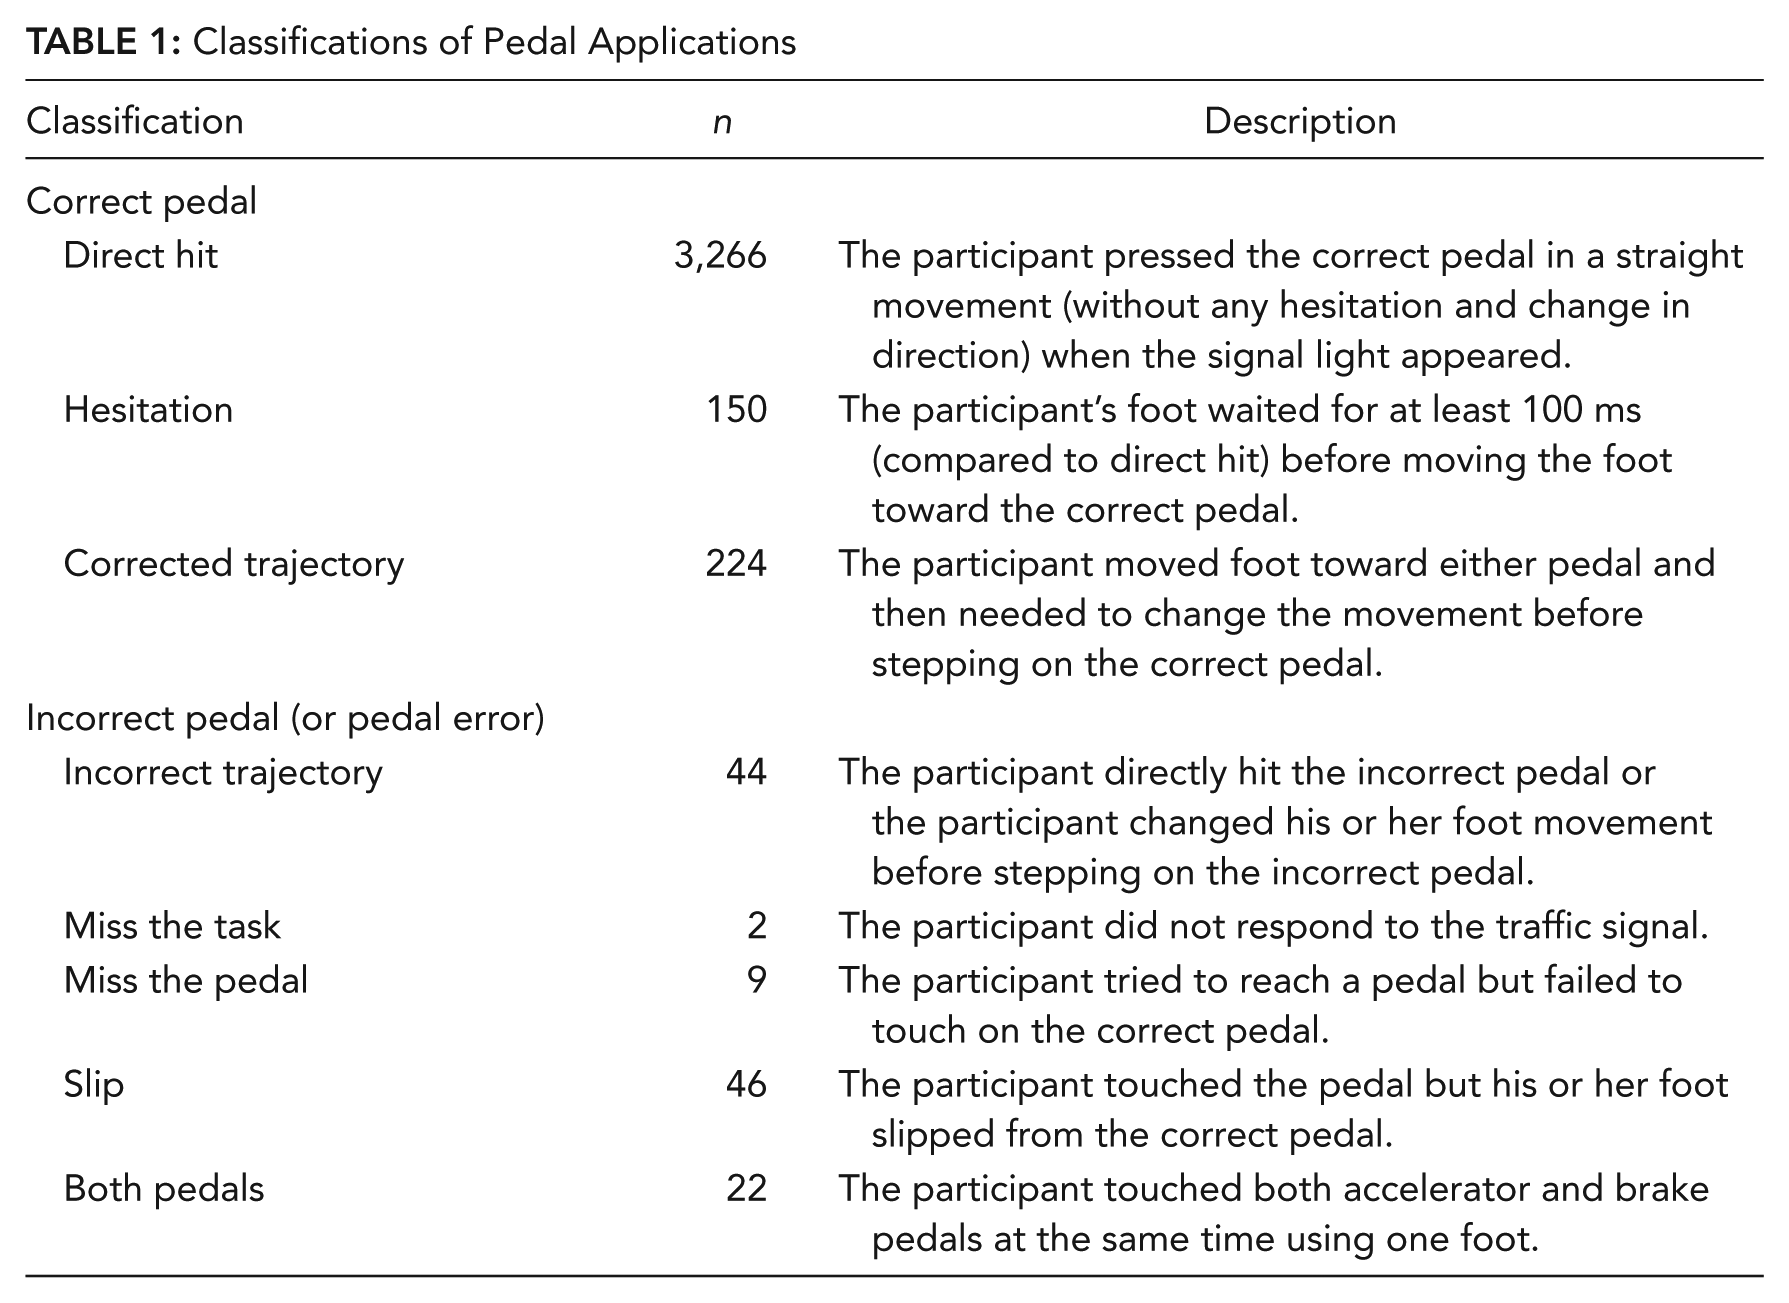
Pedal applications were classified based on video analyses of the trajectory of foot movements. In total, there were three classifications of correct pedal placement and four classifications of incorrect pedal placement (or pedal errors) identified (Table 1). In most cases, the participant would press on the correct pedal in a straight movement (“direct hit”). Other times, some hesitation was observed. A pedal movement was classified as hesitation if the participant’s foot hesitated for at least 100 ms before any action took place (Doshi et al., 2012).
Classifications of Pedal Applications
The foot toe position was plotted based on the video data. Figure 3 shows examples of the foot-to-pedal trajectories for different pedal application types for only one participant. The positions were plotted (in pixels) based on the two-dimensional camera view. The very left end point in each plot identifies when the participant depressed the pedal. The direct hit typically has the highest touch point, whereas “miss” has the lowest. For example, the participant in Figure 3 depressed the pedal at coordinates (385, 270) for a direct hit and at coordinates (381, 205) when there was a miss. In general, movements that had an ending point larger than 250 y pixels was associated with a successful hit on the pedal. However, if the end point was lower (i.e., closer to 200 y pixels), then the trajectory might result in a slip or miss.

Examples of the foot-to-pedal trajectory for each pedal application type for only one participant. Dotted line represents the vertical middle position of the brake pedal.
Figure 3 does not show an incorrect trajectory or both-pedals error, but the paths are similar to a direct hit except that the participant would directly hit a wrong pedal or two pedals. There were very few incorrect pedal placements classified as incorrect trajectory (n = 44), miss the task (n = 2), miss the pedal (n = 9), slip (n = 46), or touched both pedals (n = 22). Therefore, these five types were combined for the forthcoming analysis.
Pedal response time was computed from the time that the traffic signal appeared on the screen to the moment the participant touched either pedal. Pedal duration was computed as the total time the participant’s foot was on the pedal and included the time any pressure was detected on the pedal to the time when pressure was no longer detected. The combination of the response time and the pedal duration was used to describe the pedal application process. These two variables were examined and considered in the context of the four application categories. Response time may be quicker for different types of foot movements/categories. Alternatively, some drivers might continue to press a wrong pedal for a longer time given the signal color.
Statistical Models
A mixed-effects multinomial logit model (MMNL) was used to predict the likelihood of a pedal application being in one of four categories: direct hit (baseline), corrected trajectory, hesitation, and pedal errors. The explanatory variables (or independent factors) included in the model were age, gender, signal location, signal color, and signal distance.
The traditional multinomial logit model relates each individual outcome to a set of independent/explanatory variables but ignores correlated effects caused by variation within driver. In this study, there were on average 87 data points (repeated measures) for each study participant. Hence, an MMNL was used to account for data with a group structure. That is, the random effects were included to appropriately account for the within-group correlation (Harrel, Lee, Califf, Pryor, & Rosati, 1984). This model considered drivers and tasks as random effects using the Bayesian Markov chain Monte Carlo (MCMC) method.
The relative utility associated with each pedal application type i for each driver d and each task t is represented with the following general equation (Hensher & Greene, 2001; Train, 2009):

The parameter estimates are denoted by β d for the matrix of independent variables xidt. The residuals are represented by η idt and ε idt , where η idt is the residual with zero mean whose distribution over individuals and alternatives depends on the underlying parameters and observed data related to task t, driver d, and pedal application type i; and ε idt is the residual of the random effect associated with each pedal application type i and is independently and identically distributed extreme value. Given the assumptions of the residuals, the conditional probability for the pedal application type Li is defined similarly to McFadden and Train (2000) and Milton, Shankar, and Mannering (2008) as

The Bayesian methods based on MCMC simulation provides a more effective approach for model estimation when compared to traditional maximum likelihood estimation (Burda, Harding, & Hausman, 2008; Mok, Sohn, & Ju, 2010). The multinomial logit model with repeated measures was performed in R (Version 2.15.2) with a Bayesian MCMC using the MCMCglmm package, with significance assessed at α < .05. For the fixed-effects priors, the variance-covariance matrix was set up to be exchangeable with the variance fixed at 1 for all of the diagonal terms and 0.5 for all of the off-diagonal terms (covariance; Hadfield, 2009). When priors were not fixed, they were inverse-Wishart distributed. The burn in period equaled 30,000. The goal was to converge on a set of stable estimates for the model parameters. After the burn in period, we sampled each parameter from the model 60,000 times.
The other two dependent variables, pedal duration and pedal response time, were examined using linear mixed models with repeated measures, conducted with the lme function in the statistical package R (Version 2.15.2). The independent variables—signal color, signal lane position, and signal distance—were considered in the model as well as the pedal application type. The pedal duration and response times were included for both pedal presses (brake and accelerator pedal). Pedal duration was log transformed to meet the normality assumption. The residuals for pedal response time were normally distributed and included in the model as collected.
Results
Pedal Application Types
Pedal application types were examined by age group (Table 2). The majority of applications were direct hits, and each person had multiple direct hits (ranging from n = 73 for those 75 and older to n = 83 for those 21 and younger). There were very few multiple occurrences for the other categories.
Summary Statistics for the Four Pedal Application Types

The multinomial logit model (Table 3) shows that when the stimuli were red, drivers were less likely to have a direct hit toward the correct pedal. More specifically, participants were 68.87 times more likely to respond with a corrected trajectory than a direct hit when there was a red signal. At a red signal, participants were 28.36 times more likely to be hesitant and 3.48 times more likely to respond with a wrong pedal, slip, miss, or touch both pedals than to apply a direct hit.
Likelihood of a Corrected Trajectory, Hesitation, or Pedal Error When Compared to Direct Hit (Baseline)
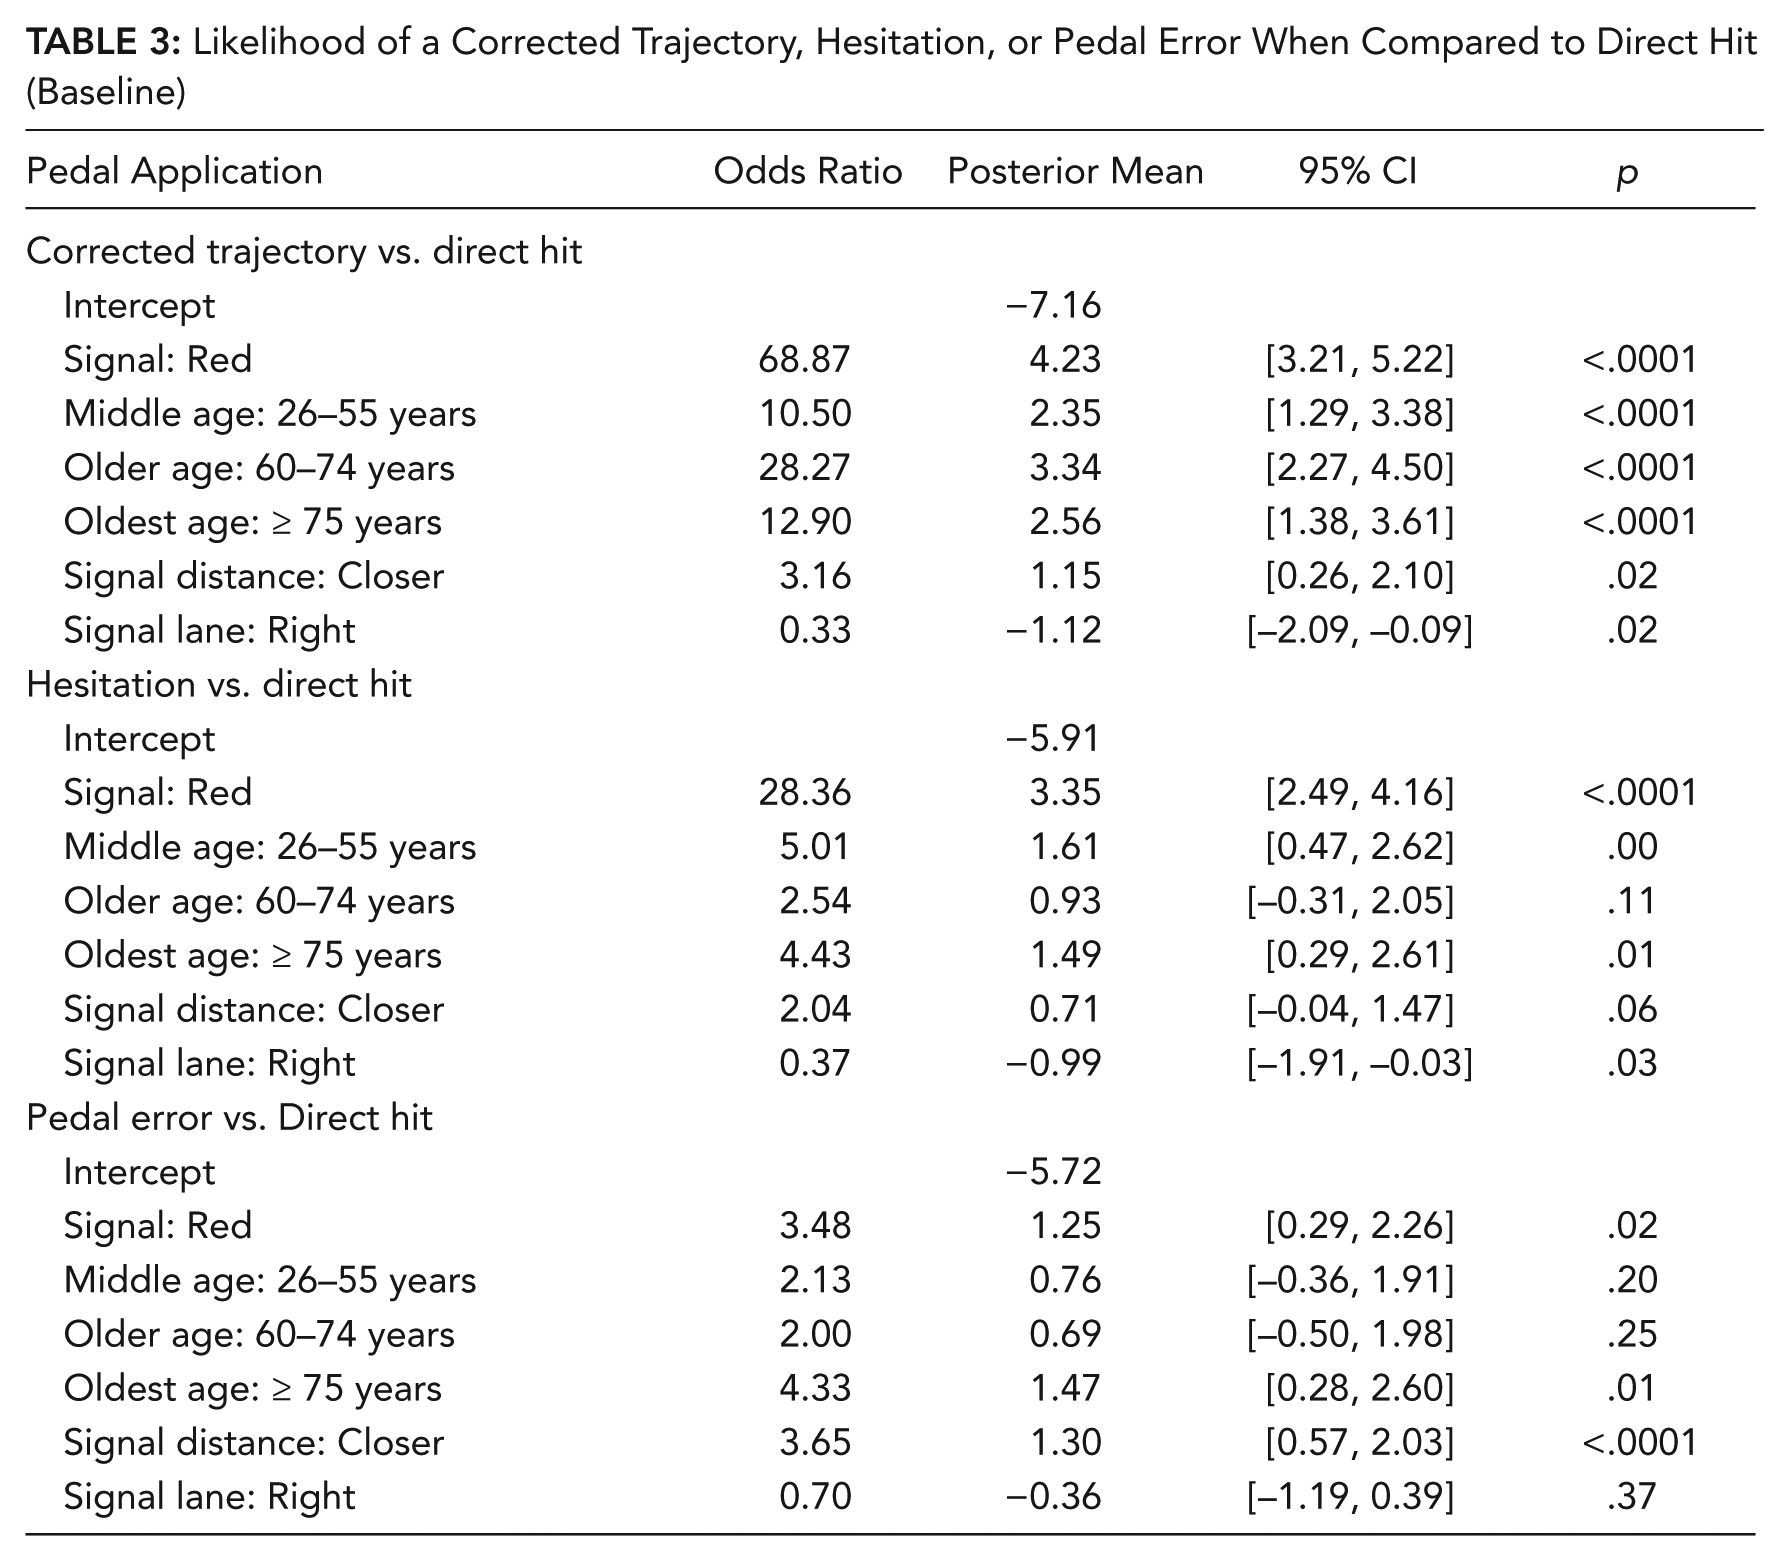
Compared to the youngest group, all other age groups (i.e., middle-age, older, and oldest drivers) were more likely to respond with a corrected trajectory than a direct hit for both green and red signals. Under the same situation, the middle-age and oldest groups were more likely to be hesitant, and the oldest drivers had a higher likelihood of responding with an incorrect pedal movement than a direct hit. Further examination of the older age group showed that those between 60 and 74 years old (n = 9) had the largest number of corrected trajectories (total number = 87 out of 224), and those drivers older than 75 years old (n = 10) had the most incorrect pedal movements (total number = 50 out of 123).
Subjects were 3.16 times more likely to change their foot trajectory rather than directly hit the pedal when the signal appeared closer. In the same situation, participants were 3.65 times more likely to have an incorrect pedal movement than a direct hit. When the stimuli were above the right lane to the drivers, they were more likely to have a direct hit rather than a corrected trajectory. Gender was omitted from the final model because it was not significant.
Pedal Duration and Response Time
The mean and median reaction time was 0.47 s and 0.46 s, respectively, with values ranging from 0.05 s to 1.26 s. The mean and median pedal duration was 0.33 s and 0.30 s, respectively, with individual values ranging from 0.07 s to 3.3 s. Both the mean pedal duration and mean response time for direct hit and pedal error were shorter than those for corrected trajectory and hesitation (Figure 4).
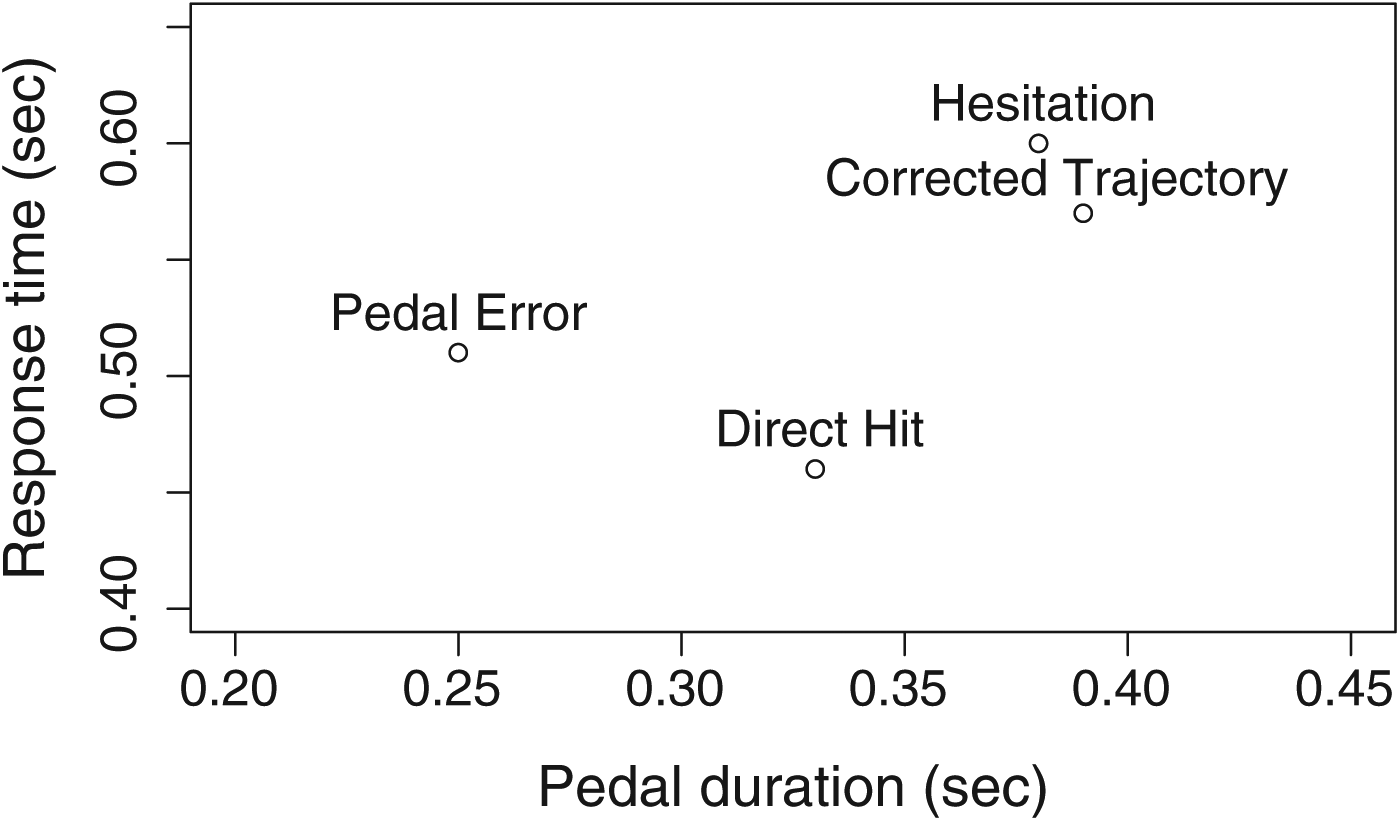
Comparison of mean pedal duration (in seconds) with mean response time (in seconds) for each pedal application.
Signals located farther from the participant generated significant longer response time than signals closer to the participant, F(1, 82) = 7.33, p < .05. Signal color also had an impact, with longer response time for red signals when compared to green signals, F(1, 290) = 5.63, p < .05. The interaction effect between signal color and pedal application, F(3, 3566) = 4.8, p < .05, was significant, with longer response time observed for corrected trajectory and hesitation when the signals were red. Pedal application was significant, F(3, 3570) = 72.16, p < .0001. Response time for direct hits was shorter than for the other three pedal applications.
The findings showed that signals located farther from the participant generated marginally longer pedal durations than signals closer to the participant, F(1, 84) = 3.58, p = .06. Signal color had an impact, with longer pedal duration for red signals when compared to green signals, F(1, 405) = 248.93, p < .0001. There was also a significant interaction effect between signal color and pedal applications, F(3, 3622) = 9.19, p < .0001, with the shortest pedal duration observed for pedal errors with red signals. Pedal application was significant, F(3, 3608) = 61.50, p < .0001. Pedal duration time was longer for hesitations and shorter for pedal errors when compared to direct hit.
Discussion
In this study we attempted to identify the foot trajectories that might be associated with pedal misapplications. The types of incorrect pedal applications were similar to those in other studies (Schmidt & Young, 2010; Tran et al., 2011; Young et al., 2011), but our study also included pedal types for correct applications (direct hit, hesitation, and corrected trajectory). The corrected pedal movements associated with hesitation and corrected trajectory should not lead to pedal misapplications but are of interest because delays in responses may present a safety concern in the real world depending on the criticality of a timely response (Doshi et al., 2012). These pedal application types can provide additional insights on the foot-to-pedal movements. The foot movements were further separated into reaction time and pedal duration time for greater insights.
In this study, participants pressed the pedal based on the color depicted on the traffic signal, but they were not exposed to transitional periods (from green to amber, amber to red, etc.) as would be observed on the road. Hence, the scenarios are somewhat artificial. That said, foot-to-pedal changes are not discriminated visually but are done based on blind positioning movements that are based on proprioception and kinesthetic senses. Hence, the differences in movements (corrected trajectories and pedal errors) observed are relevant to driving. When the signal was depicted to be in closer proximity to the driver (i.e., the signal appeared larger on the screen), it tended to generate a sense of greater urgency, and one would anticipate a quicker response, and our findings showed that to be the case. In such scenarios, there were more corrected trajectories as well as more pedal errors. The response time and pedal duration were both significantly longer for red signals than for green signals. For green signals, most drivers would just tap the accelerator pedal, but for red signals, drivers pressed the brake pedal for longer periods of time. But longer response time did not lead to more accurate pedal applications. The model showed that participants were less likely to have a direct hit when the signal was red. But if the participant directly hit the correct pedal for a red signal, the response time was shorter when compared to the other three pedal application types.
The youngest drivers (21 and younger) were more likely to have a direct hit on the correct pedal than other age groups. This group had less pedal errors and hesitated less when executing a foot movement. Alternatively, the older and oldest age groups were more likely to have corrected trajectories compared to the youngest group. The oldest age group had a higher probability of hesitation and pedal errors. Unlike findings from the crash data (Lococo et al., 2012), this current study was designed to elicit responses regarding participants’ ability to respond to traffic lights. It is unclear whether some age groups (e.g., younger drivers) were responding to the stimuli as though it were a video game, and it is unclear whether younger drivers would respond similarly in the real world, which is a limitation of this study. That said, the impact of age-related effects on crash risk are well documented (Kimura & Shinohara, 2012; Lococo et al., 2012; Warshawsky-Livne & Shinar, 2002), and this study may provide some insights on what transpires prior to a crash. Further, because the vehicle’s velocity did not change in this study, this was an open-loop control system in that no feedback was provided to the drivers after they pressed the pedal. This design may have also affected the drivers’ subsequent responses to the color changes.
Pollard and Sussman (1989) showed that pedal misapplications could be minimized if the pedals were set at different heights and distances. Hence, these events are rightfully rare, but they still exist. The variation in the foot trajectory and change in end point could affect the likelihood of a pedal misapplication (Schmidt, 1989). Movements that exemplify high confidence (i.e., direct hit) would have a higher trajectory of foot movement. Other movements (hesitation, corrected, slip, and miss) had relatively lower trajectories. This study included an examination of foot movement based on one pedal design and configuration. However, Fitt’s law might be pertinent and authors of a future study could examine these same movements for different pedal configurations as well as for different road situations. Further, a more holistic understanding of the corrected and incorrect trajectories could be examined using motion detection techniques, which can then be used for a prediction algorithm within an advanced driver assistance system (Tran, Doshi, & Trivedi, 2012). That is, if the foot moves into the pedal area and the foot toe was detected to be under a certain threshold (e.g., under 250 pixels as shown in our study), the system could provide a warning alert to the driver or even take control as needed.
Lococo et al. (2012) pointed out that drivers unfamiliar with the vehicle (either new owners or occasional users) were more likely to have pedal misapplication crashes. In our study, none of the participants had owned or driven the 2012 Toyota Camry, which may have affected the likelihood of pedal misapplications for some groups more so than others. For example, younger drivers may be able to adapt more easily to newer vehicles compared to older drivers.
The emphasis of this study was to understand foot movements toward a pedal. Error rates were likely to be higher if the sequence of events was unanticipated (Philipp & Koch, 2005). This study was designed to overexpose drivers to pedal placements and foot movements while performing a sequence of accelerating and braking actions as observed in stop-and-go traffic.
Prynne and Martin (1995) showed that drivers exhibit a two-phase braking when responding to emergencies, and similar findings were shown in Ising et al. (2012). Kitazawa and Matsuura (2004) also showed differences in foot trajectory and speed in response to normal versus emergency braking. To further explore this hypothesis, naturalistic studies would be useful to identify differences between drivers’ intention to brake versus accelerate to relate this study to unintended-acceleration incidents. We can then study the intentions or the role of cognition and precrash events in drivers’ pedal operations using on-road observations. Cognitive decline might be a contributing factor to pedal misapplication (Freund, Colgrove, Petrakos, & McLeod, 2008), and it would be of great interest to consider this factor in future on-road studies. However, pedal errors are quite rare and on-road studies may not provide a sufficient sample size. This current study provides a method to partition the various foot trajectories such that the explanatory factors can be validated on road, with the goal that future sensors can successfully detect the likelihood of a pedal misapplication.
Key Points
The foot movements of drivers as they pressed the pedals in a car were quantified and categorized.
Foot movements associated with pedal errors (misses, slips) tended to have lower foot trajectories.
Drivers had more pedal errors when the signal appeared to be closer or during a red signal.
Differences in corrected foot trajectory or hesitation were related to location of signal.
Footnotes
Acknowledgements
This study was made possible by funding from the Toyota Collaborative Safety Research Center. We also acknowledge the members of the University of Washington’s Human Factors and Statistical Modeling Laboratory for their critique of this manuscript.
Yuqing Wu is a PhD candidate in industrial engineering at the University of Washington, Seattle. She received an MS degree in industrial engineering (2012) and statistics (2014) from the University of Washington, Seattle.
Linda Ng Boyle is a professor in the College of Engineering at the University of Washington, Seattle. She received her PhD in civil and environmental engineering (1998) and MS in inter-engineering (1994), both from the University of Washington, Seattle.
Daniel McGehee is the director of the Human Factors and Vehicle Safety Research Division, Public Policy Center, University of Iowa, Iowa City. He received his PhD degree (2009) from the University of Leeds, Leeds, England.
Cheryl A. Roe received a BS in psychology (1999) from the University of Iowa. She currently is a research associate in the Human Factors and Vehicle Safety Research Program at the Public Policy Center at the University of Iowa.
Kazutoshi Ebe is an executive engineer at Toyota Collaborative Safety Research Center, Ann Arbor, Michigan. His has a PhD in integrated neuroscience (2012) from Niigata University Graduate School of Medical and Dental Science (in Japan).
James Foley is a senior principal engineer at Toyota Collaborative Safety Research Center, Ann Arbor, Michigan. He has a PhD in human factors from Purdue University (1990).