
Abstract
Objective
A computer vision method was developed for estimating the trunk flexion angle, angular speed, and angular acceleration by extracting simple features from the moving image during lifting.
Background
Trunk kinematics is an important risk factor for lower back pain, but is often difficult to measure by practitioners for lifting risk assessments.
Methods
Mannequins representing a wide range of hand locations for different lifting postures were systematically generated using the University of Michigan 3DSSPP software. A bounding box was drawn tightly around each mannequin and regression models estimated trunk angles. The estimates were validated against human posture data for 216 lifts collected using a laboratory-grade motion capture system and synchronized video recordings. Trunk kinematics, based on bounding box dimensions drawn around the subjects in the video recordings of the lifts, were modeled for consecutive video frames.
Results
The mean absolute difference between predicted and motion capture measured trunk angles was 14.7°, and there was a significant linear relationship between predicted and measured trunk angles (R2 = .80, p < .001). The training error for the kinematics model was 2.3°.
Conclusion
Using simple computer vision-extracted features, the bounding box method indirectly estimated trunk angle and associated kinematics, albeit with limited precision.
Application
This computer vision method may be implemented on handheld devices such as smartphones to facilitate automatic lifting risk assessments in the workplace.
Introduction
Low-back disorders (LBDs) are a major occupational health problem. In 2016, LBDs were the most prominent among all work-related musculoskeletal disorder cases, accounting for 38.5% of such disorders (U.S. Bureau of Labor Statistics, 2018). LBDs also have a significant socioeconomic impact, costing over $100 billion per year through direct costs, such as medical expenses, and indirect costs such as lost productivity and wages in the United States (Katz, 2006).
The risk factors of LBDs are multifactorial, consisting of personal, workplace psychosocial, and job physical factors (Bernard & Putz-Anderson, 1997; da Costa & Vieira, 2010). Epidemiological studies have identified heavy physical work (Engkvist et al., 2000; Eriksen et al., 1999; Kerr et al., 2001), awkward static and dynamic working postures (Holmström et al., 1992; Myers et al., 1999; van Poppel et al., 1998), and manual material handling (Bigos et al., 1986; Hoogendoorn et al., 1999; Peek-Asa et al., 2004; Snook, 1989; Spengler et al., 1986) as physical risk factors for LBDs. Particular task-level physical risk factors include work intensity, poor posture, frequent bending and twisting, and repetition (Kuiper et al., 1999; Marras et al., 1995).
The association between trunk kinematics (e.g., trunk flexion, lateral bending, and twisting velocities) and lower back pain in manual materials handling activities has been reported in many studies. Trunk dynamics during a lift have been associated with significantly increased loading of the spine (Freivalds et al., 1984; McGill & Norman, 1986). Specifically, increased trunk velocity has been related to increased spinal compression, shear, and torsional loading (Marras & Sommerich, 1991). Lavender et al. (2003) found that speed was also a significant contributing factor for spine loading at the L5/S1 disc during lifting. Marras et al. (1993) examined the association between trunk dynamics and risk of LBDs and found that trunk kinematics including lateral trunk velocity, twisting trunk velocity, and sagittal flexion angle could be used to identify jobs associated with high risk for LBDs. It is therefore important to consider trunk kinematics to comprehensively evaluate the risk of LBDs.
In a recent study that investigated the popularity of the observational risk assessment methods used by certified professional ergonomists in five English-speaking countries, Lowe et al. (2019) found that the revised National Institute for Occupational Safety and Health (NIOSH) lifting equation (RNLE) was the most popular observational method used for assessing lifting risks in the United States and ranked among top three in the United Kingdom, Canada, New Zealand, and Australia. To use the RNLE, several lifting parameters are needed, including the horizontal and vertical distances of the loaded hands relative to the feet during lifting; trunk asymmetry angle; hand coupling for the load at the origin and destination of each lift; the displacement of load for each lifting task; and the frequency of performing each lifting task (Waters et al., 1993). Trunk kinematics are not explicitly accounted for in the RNLE, but have been recommended as additional parameters for improving the risk predictability of the RNLE for highly dynamic lifting tasks (Arjmand et al., 2015; Lavender et al., 1999; Marras et al., 1999). The lifting frequency parameter may serve a surrogate measure for trunk speed, as lifting tasks with higher frequencies are likely to require faster trunk movements; however, this relationship has not been fully studied. Additionally, the biomechanical criterion used to develop the RNLE was based on static models that may not be valid for dynamic lifting motion (Waters et al., 1994). Another widely used observational method, the Rapid Entire Body Assessment (REBA), includes the trunk flexion angle as part of the postural analysis (Hignett & McAtamney, 2000). To assess ergonomic risk information by the observational methods, intensive labor and lengthy processing time may be required. This is because observational methods require information collection of the whole body postural specification, such as angles and speed of each body segment. Moreover, observational risk assessment methods are often conducted based on short sampling periods to minimize the labor-intensive observation process, and are therefore unable to characterize the all-day risk exposure for constantly changing lifting conditions, which have now become common in distribution centers and jobs involving handling objects of varying shapes and weights (Callaghan et al., 2001; Lavender et al., 2012; Lu et al., 2015).
Direct measurement can provide high-volume and accurate measurements of trunk kinematics (David, 2005). Inertial measurement unit (IMU) sensors are small, inexpensive, and wearable, and possess great potential for assessing postures and measuring kinematics at work (Breen et al., 2009). Recent studies have demonstrated the application of IMU sensors on the measurement of body joint angles (Battini et al., 2014; Dahlqvist et al., 2016) and lifting task factors such as lifting duration and hand horizontal and vertical positions (Barim et al., 2019; Lu et al., 2019). In addition to IMUs, another method used to measure trunk kinematics is the lumbar motion monitor (LMM). The LMM is an exoskeleton of the spine attached to the shoulder and hips using a harness, which has been found to provide reliable measurements of the position, velocity, and acceleration of the trunk (Marras et al., 1992). Many research studies have used LMMs for quantifying trunk kinematics as lifting risk factors (e.g., Ferguson et al., 2011; Lavender et al., 2017; Norasi et al., 2018). Efforts have been made to improve the wearability and usability of the direct measurement device for trunk motion to facilitate their application in the industry. For example, Nakamoto et al. (2018) demonstrated the prototype of an LMM with lightweight, stretchable-strain sensors. Direct measurement, however, has many limitations. Instrumentation such as the LMM may not be readily available for job analysis (Marras et al., 1999).
While application in the field is possible using direct measurement devices, it is often difficult to identify the context of complex signals without relying on external measures such as a synchronized video. Although used for research, practical applications of direct measurement devices may be limited for practitioner use due to training and expertise required, and the interruption imposed on the worker’s regular tasks (Patrizi et al., 2016). According to an international survey of professional ergonomists, electrogoniometers such as the LMM had the lowest percentage of users (Lowe et al., 2019).
With the advantages of low cost, nonintrusiveness, and ease of use, computer vision has become a popular technology for measuring body postural angle and task repetition. Seo et al. (2016) demonstrated extracting silhouette information using computer vision to classify postures for ergonomics applications. Mehrizi et al. (2018) used a computer vision method to assess joint kinematics of lifting tasks. Ding et al. (2019) proposed a computer vision method for real-time upper-body posture assessment using features directly extracted from video frames. However, when applied to the industrial setting, computer vision methods are prone to various sources of noise in the workplace, such as obstructions, clothing, lighting, occlusion, and dynamic backgrounds. Optimal camera placement for computer vision in the industrial setting can be challenging. Some computer vision methods require markers attached to the worker for creating a skeleton figure for further motion analysis. The attachment of the markers, however, can be time-consuming and can interfere with the work.
We developed an efficient computer vision lifting monitor algorithm that segments the subject’s silhouette from the background and applies a rectangular bounding box tightly around the silhouette (Wang et al., 2019). Based on the spatial and temporal characteristics of the segmented foreground and background, the algorithm also detects lifting instances and estimates hand and feet locations. Rather than fitting skeleton models to the worker’s image, our approach uses extracted simple features from videos. This method does not depend on tracking specific body linkages or measuring joint locations. Wang et al. (2019) demonstrated the application of the lifting monitoring algorithm for measuring task factors and computing the recommended RNLE weight limit (RWL). The horizontal and vertical dimensions of a tightly bounded and elastic rectangular bounding box were also used by Greene et al. (2019) for classifying lifting postures. Rather than obtaining precise measurements of posture based on joint angles, this method relaxed the need for high-precision tracking so that it was more tolerable of the variations that could be encountered in the workplace.
The current study describes a computationally efficient method that leverages simple video features, including bounding box dimensions and hand locations, obtained using computer vision to predict the angle, velocity, and acceleration of the trunk in the sagittal plane during two-handed symmetrical lifting. This study explores indirect estimation of both trunk flexion angle (T) and spine flexion angle (S). Trunk flexion is defined as the forward bending of the trunk from the vertical line and the center of motion about the hip. Spine flexion is the forward bending of the spine around the L5/S1 disc, accounting for sacral rotation. Since the L5/S1 disc incurs the greatest moment during lifting, this disc is often used as a landmark to represent lumbar stress (Chaffin et al., 2006). Anderson, Chaffin, Herrin, 1986 reported a function to calculate the spine flexion around L5/S1 using the trunk and knee angles. With the benefits of noninvasiveness, objectiveness, and low cost, the computer vision method may measure trunk kinematics and facilitate more comprehensive lifting assessment by incorporating these risk factors in lifting analyses.
Methods
Trunk Angle at the Lifting Instance (Static Model)
Modeled data
The lifting postures of simulated human images (mannequins) were generated using the 3D Static Strength Prediction Program Version 7.0.0 (3DSSPP) from the University of Michigan Center for Ergonomics (2019). To include a wide range of lifting postures, the American Conference of Governmental Industrial Hygienists (ACGIH) manual lifting threshold limit value (TLV) zones were used to determine the lifting locations of the mannequins (American Conference of Governmental Industrial Hygienists, 2018). The TLV classifies lifting postures into 12 distinct zones including three horizontal and four vertical zones. The horizontal zones were determined by the horizontal distance of the hands using cutoff lines of 30 cm, 60 cm, and 80 cm. The vertical zones are determined by the vertical distance of the hands to the ground using landmarks of mid-shin, knuckle, shoulder, shoulder height –8 cm, and shoulder height +30 cm. These landmarks are calculated based on the subject’s anthropometry. To account for the variation in lifting among different anthropometries, data of the 5th, 50th, and 95th percentile male and female from the 2012 anthropometric survey of U.S. Army personnel was used to calculate the locations of the 20 intersection points of the zone markers in the TLV diagram (Gordon et al., 2014). A representation of the 20 zone intersections is shown in Figure 1.
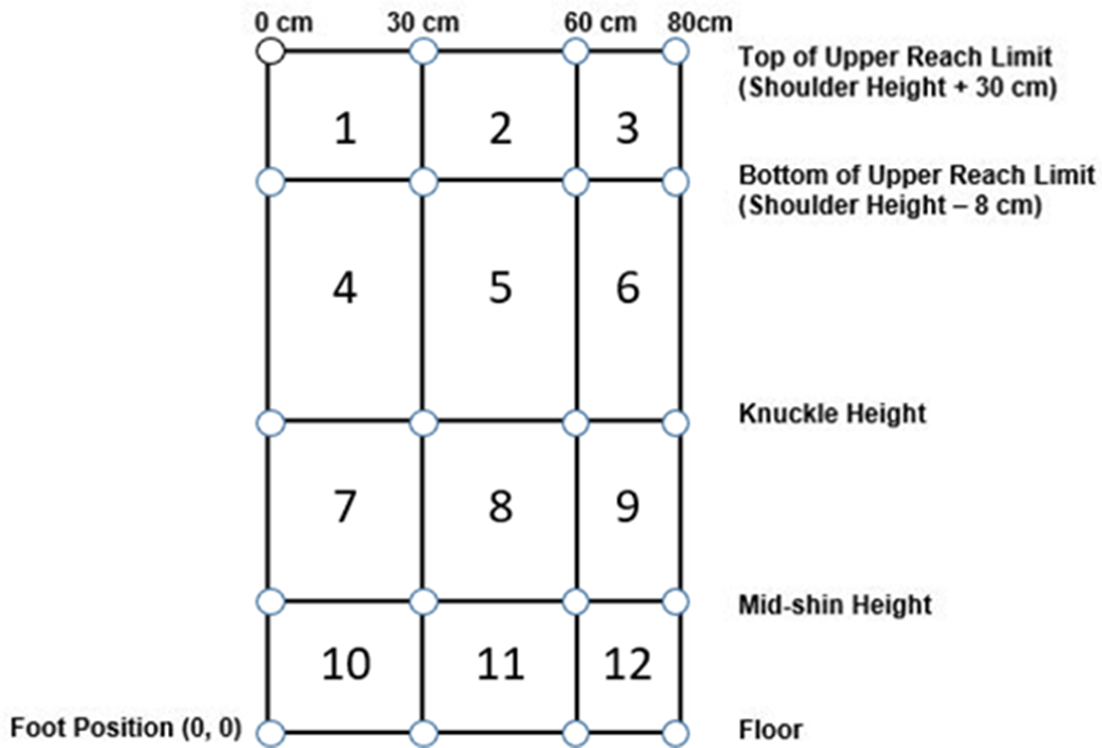
Representation of intercepts of three horizontal and four vertical zones.
The hand locations were subsequently entered into 3DSSPP based on the mannequin’s anthropometry, and the posture prediction feature was applied to generate lifting postures (Chaffin, 2008; Hoffman et al., 2007). After right-facing the mannequins, the bounding box dimensions (height and width) and the horizontal and vertical hand locations relative to the ankles of the mannequins in the images were measured using the University of Wisconsin multimedia video task analysis (MVTA) software (Yen & Radwin, 1995). Since these features were measured in pixels, which was dependent on the variation across different anthropometries and image output from 3DSSPP, they were converted into centimeters based on the ratio of each measurement to the mannequin’s standing height. Each ratio was then multiplied by the mannequin’s standing height in centimeters.
The trunk flexion angle T and spine flexion angle S for each mannequin were recorded from the body segment angles window and the posture report in 3DSSPP. After excluding 15 data points where the hand locations were unreachable by the corresponding anthropometry, data on bounding box dimensions and hand locations of 105 distinct lifting postures across six anthropometries remained in the training dataset.
Algorithm development
To estimate trunk T and S the lifting instance, a regression model was created based on various geometric features of the bounding box. The features in the training dataset included bounding box height (BH), bounding box width (BW), hand horizontal location (H), hand vertical location (V), and the ratio of BH to BW (R). A correlation matrix of all features was first calculated to investigate which features were redundant. If the correlation between the two features was greater than .8, the features were considered highly correlated. The variable with a higher mean absolute correlation with all other variables was removed from the dataset, and H, V, and BW remained in the training data. After inspecting the distribution of the features, log transformation was applied to H and V. A second-degree polynomial regression was then generated for T and S using the aforementioned features. Residual plots of the model were investigated to verify model validity. The trunk flexion model was validated by comparing the bounding box estimates obtained for the 216 lifting instances for videos from the laboratory experiments conducted by NIOSH against the trunk angles measured using 3D motion capture. Due to the absence of appropriate validation data, the spine flexion model was not tested for human lifting tasks.
Trunk Kinematics for Consecutive Video Frames (Dynamic Model)
Modeled data
Since the mannequin-lifting posture simulation in 3DSSPP does not account for the dynamic aspects of lifting, the model developed in the previous section was not sufficient for estimating trunk angles over a series of consecutive video frames and for calculating trunk kinematics such as trunk speed and acceleration. Therefore, video recordings and motion-tracking data from a study conducted at NIOSH were utilized to model the trunk angle based on their temporal features. Videos of symmetrical lifts in which hand locations were defined by centers of the 12 ACGIH TLV lifting zones performed by six participants were recorded. For every lifting zone, each participant performed three repeated trials.
Whole-body motion data were recorded by a motion capture system (Optritrack 12 IR camera system, model Flex 13 with the Motion Monitor data acquisition program, Innovative Sports, Inc., Chicago, USA). Before data collection, a stylus was used to identify joint locations relative to the markers placed on the subject (Innovative Sports, 2019). The trunk was represented by the C7-T1 segment, and the trunk flexion angle T relative to the earth vertical line was calculated by subtracting the trunk angle at the neutral position from the measured trunk angle. Wang et al. (2019) have detailed the laboratory experiment protocol and participant information. An observation window of .67 s (20 frames) after each lifting instance captured the characteristics of each lift without including motions such as twisting, turning, and walking. The mean stature of the study participants was within a .8 cm difference from that of the 2012 U.S. Army anthropometric survey (Gordon et al., 2014) for both males and females, while the standard deviation of stature in the NIOSH study was smaller.
To determine lifting instances and to calculate H, V, BH, BW, and R, the videos were processed using the lifting monitor algorithm described in Wang et al. (2019). This algorithm detects dynamic scenes from the background resulting in a “ghost effect.” The “ghost effect” indicates the very instance when an object is lifted or released, which subsequently identifies hand and feet locations at the origin and destination of a lift. The lifting monitor algorithm creates a rectangular bounding box tightly around the subject and calculates the dimensions of the bounding box while it changes during a lift. A demonstration of the processing output of this computer vision algorithm is presented in Figure 2.
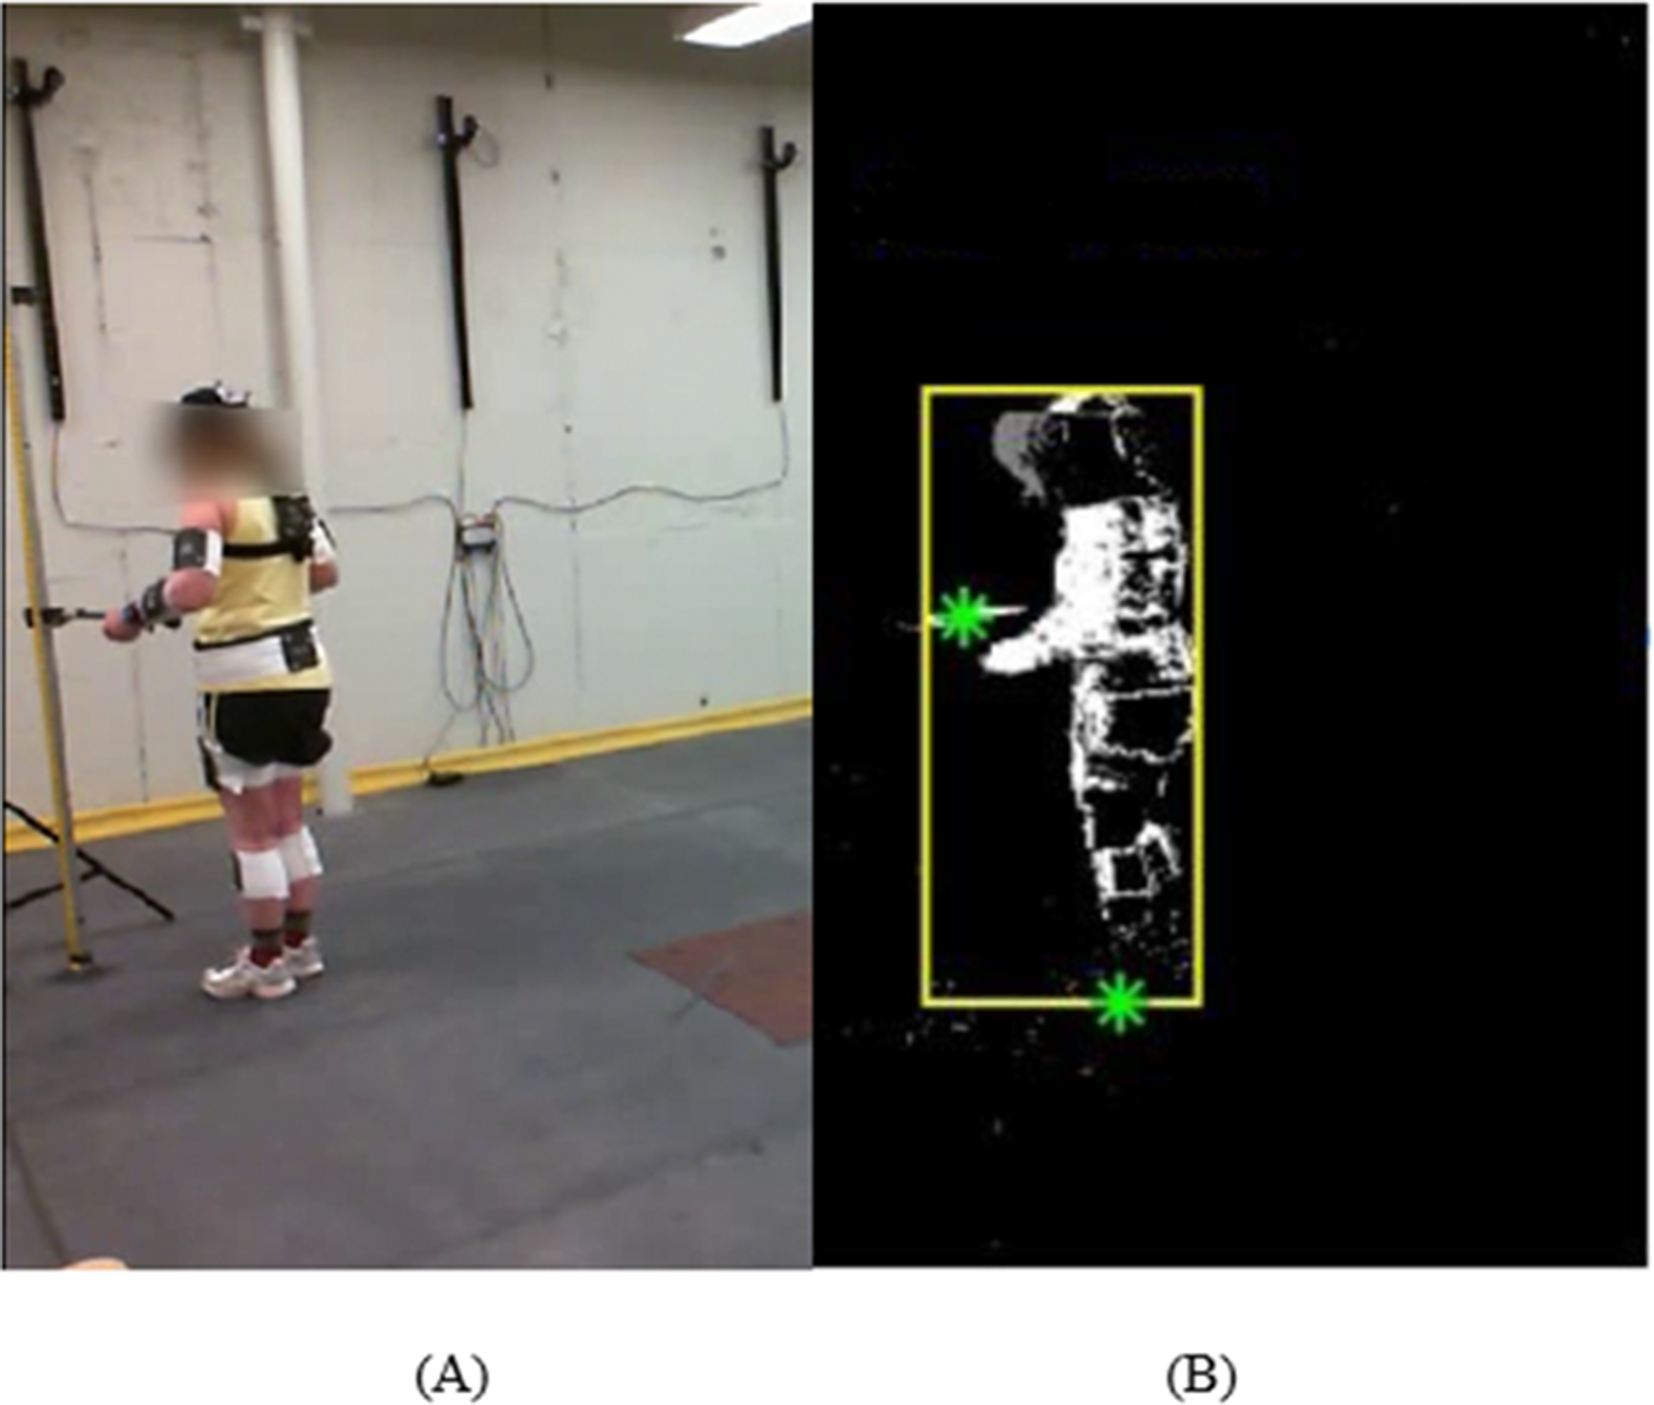
(A) Video image and (B) image processed by the lifting monitor algorithm of a subject lifting a small object from a shelf. A rectangular bounding box encloses the subject. The hands and the ankles are identified and represented by asterisks.
Some of the video recordings were not included due to inconsistent camera auto-focusing for some participants in the study. A total of 216 recordings of six subjects (36 recordings for each subject) without auto-focusing were analyzed using the lifting monitor algorithm to test the models. Trunk angles T were derived from marker locations in the motion capture data.
Algorithm development
The algorithm for estimating trunk angles consecutively consists of three steps: (a) subtracting the trunk flexion angle at frame 0 to mitigate the variability of motion tracking between trials; (b) fitting each series of trunk flexion angle over 20 frames as an exponential function of time in the form:
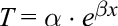
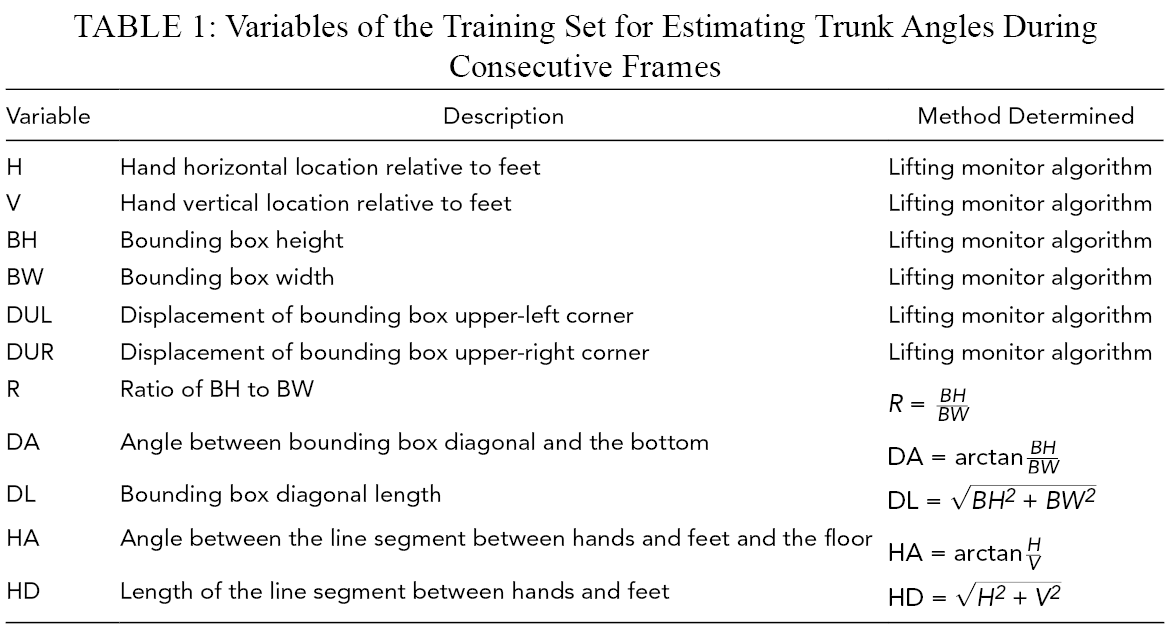
where x is the frame number from the lifting instance; and (c) developing a linear regression model to estimate the coefficients α and β for each series, based on H, V, BH, BW, and R, and features derived from these measurements. The initial trunk angle was estimated using the static trunk angle estimation model and was then added back to the predicted series of trunk angles. The variables in the training set are summarized in Table 1. A visual representation of the features used in the models is presented in Figure 3. The variables for predicting exponential equation parameters are the average, maximum, and standard deviation of the values of these features and their respective speed and acceleration over the 20 frames.
Variables of the Training Set for Estimating Trunk Angles During Consecutive Frames
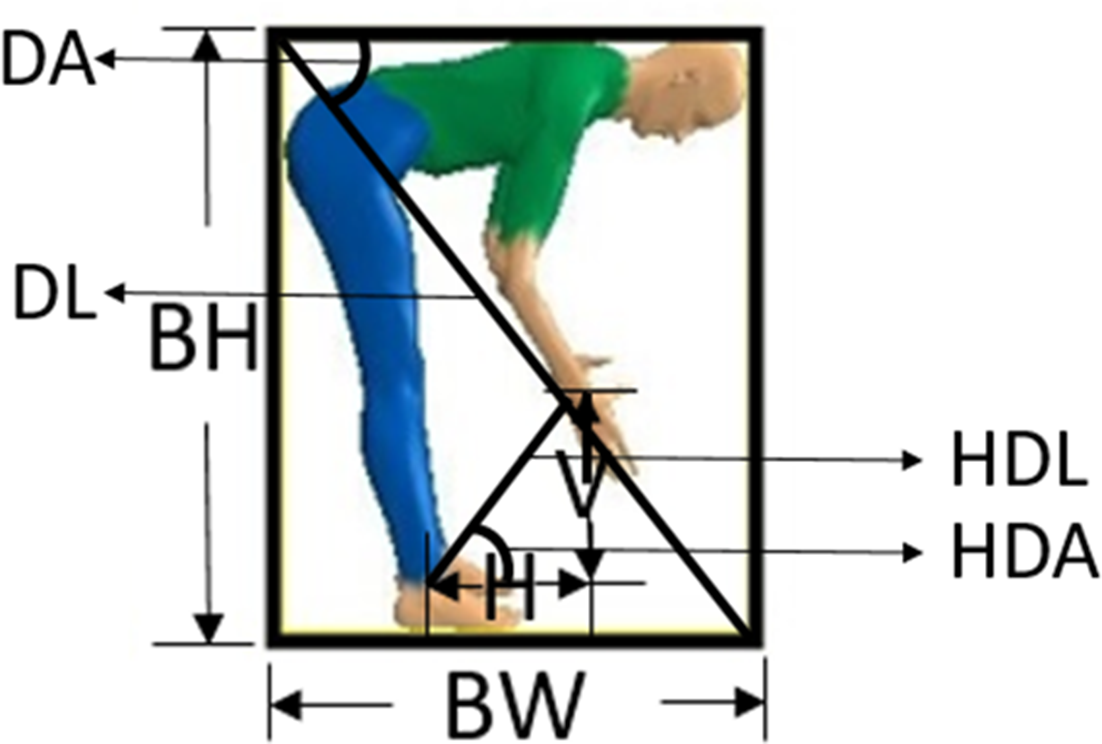
Visual representation of features used in the models estimating trunk angles over consecutive video frames.
To account for the variability between different lifting postures, the dataset was first classified into stoop, squat, or stand postures based on the trunk and knee angles measured by motion tracking at frame 0 using the following rules: a squat was classified when the included knee angle between the thigh and lower leg (K) was K < 130°; a stoop was classified when the trunk angle (T) was T > 40° flexion from the vertical. If neither of these conditions was true, the posture was classified as a stand. If both K < 130° and T > 40°, the posture was classified as a squat (Greene et al., 2019). The definitions of trunk and knee angles are illustrated in Figure 4. For each subset of postures, a linear regression model was created to predict α and β (Equation (1)), using variables listed in Table 1. The optimal set of variables was determined using a stepwise regression. A backward elimination approach was adopted and the Akaike information criterion (AIC) was used as the evaluation criteria (Venables & Ripley, 2002).
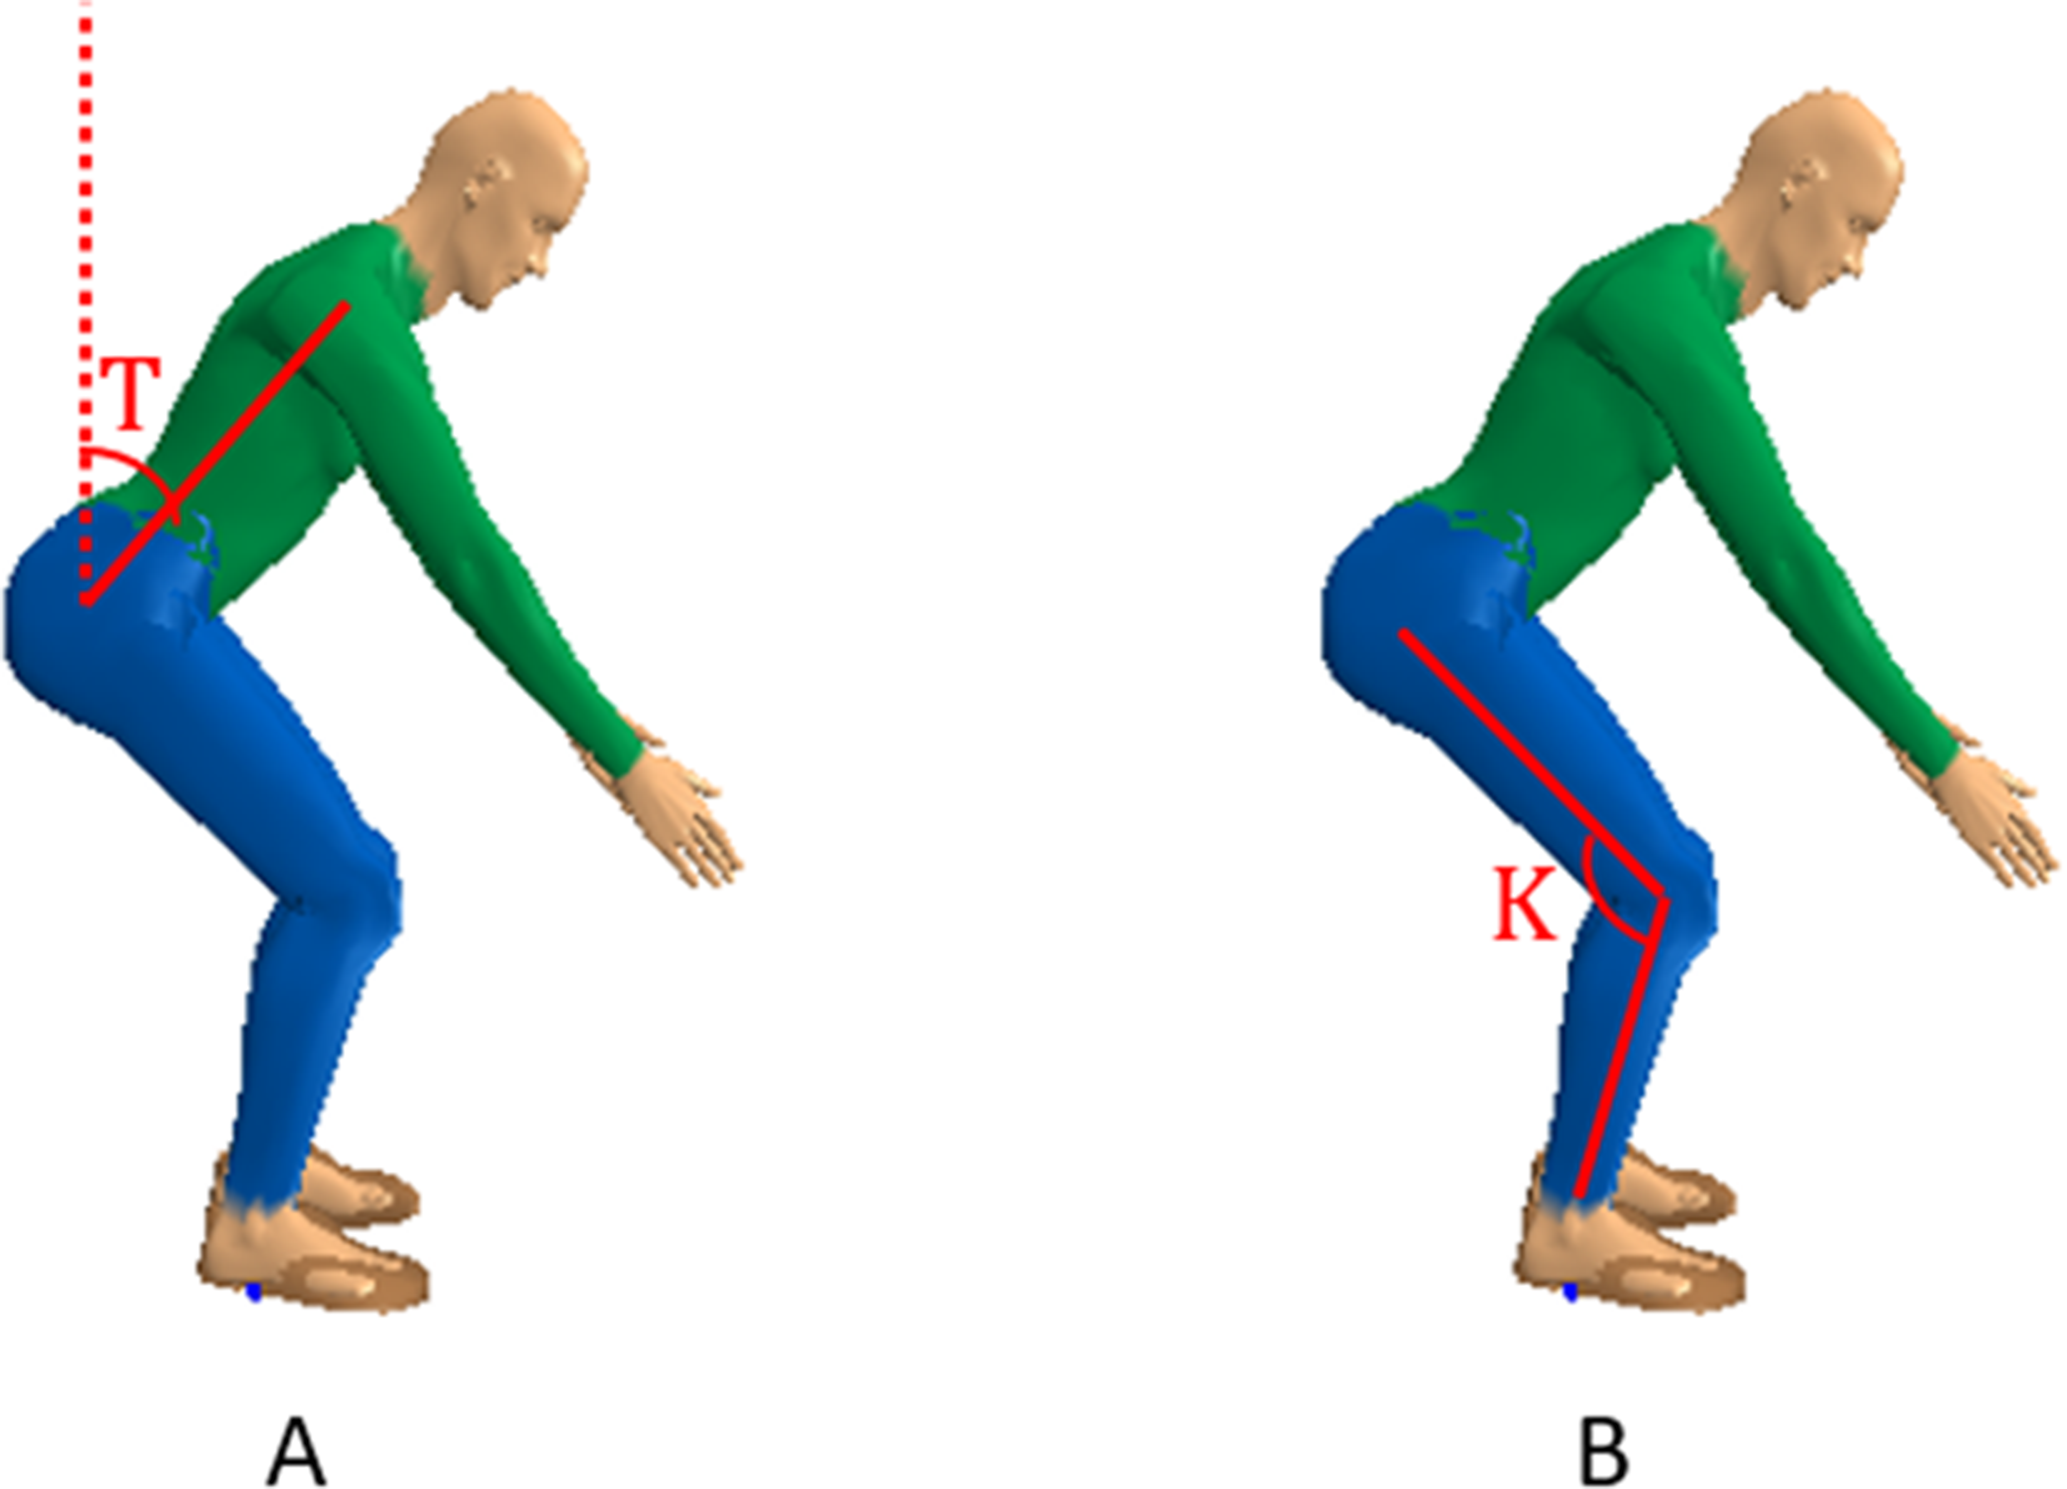
3DSSPP mannequins demonstrating (A) trunk angle (T) and (B) knee angle (K). 3DSSPP = 3D Static Strength Prediction Program Version 7.0.0.
For each of the 216 lifts, the exponential function parameters α and β (Equation (1)) were estimated using the regression model for the posture associated with the lift. Trunk flexion angles over the 20 frames were subsequently calculated based on the predicted exponential function parameters α and β (Equation (1)).
Results
Trunk Angle Estimation at the Lifting Instance (Static Model)
The videos were processed using the lifting monitor algorithm to determine lifting instances and calculate H, V, BH, BW and R at these time instances. A summary of the features of the regression model to estimate trunk flexion is presented in Table 2.
Summary of the Regression Model for Static Trunk Flexion T

Note. *p < .05. ***p < .001.
The regression model for trunk flexion T (adjusted R2 = .88, F(6, 98) = 176.9, p < .001) was:

A summary of the features of the regression model to estimate spine flexion S is presented in Table 3.
Summary of the Regression Model for Static Spine Flexion S

Note. *p < .05. **p < .01. ***p < .001.
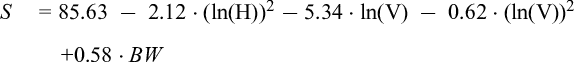
The regression model for spine flexion S (adjusted R2 = .72, F(6, 98) = 43.02, p < .001) was:
A plot of predicted trunk flexion angles versus motion capture measured trunk angles is presented in Figure 5. The overall mean absolute error of prediction on the validation set was 14.65°. The linear relationship between the model prediction and the measured trunk angle is plotted in Figure 5 (R2 = .80, p < .001). The prediction errors summarized for each 10° increment of measured trunk angles are presented in Table 4.
Prediction Error Summarized for 10° Increments of Measured Trunk Angles

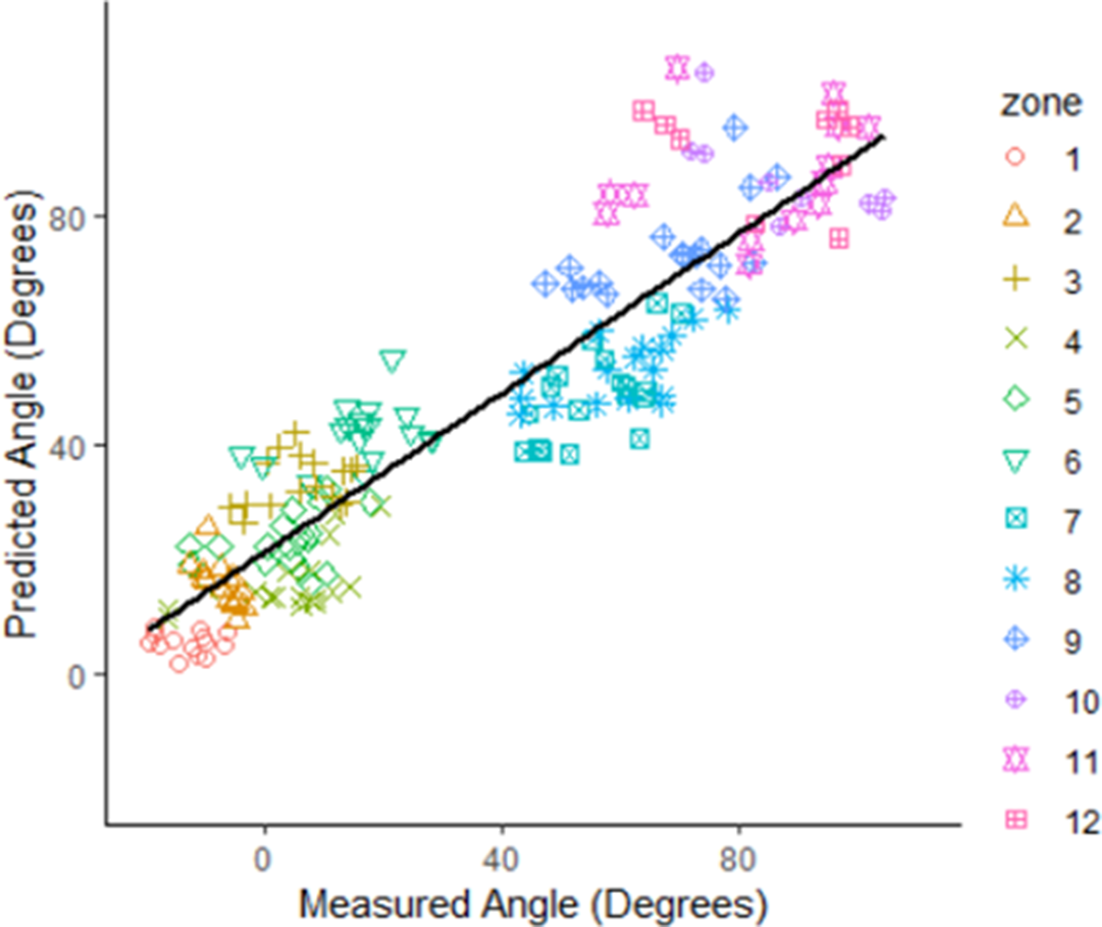
Predicted trunk flexion angles (calculated by the computer vision algorithms) versus ground truth trunk flexion angles (calculated by the motion capture system). ACGIH lifting zones are represented by colors and shapes. ACGIH = American Conference of Governmental Industrial Hygienists.
Trunk Kinematics Estimation for Consecutive Video Frames (Dynamic Model)
The resulting mean absolute error between trunk angles fitted using exponential equations (Equation (1)) and those measured through motion tracking was 1.00° (N = 216, SD = .11). A plot of comparison between fitted and measured trunk flexion angles of one lift in the dataset is presented in Figure 6.
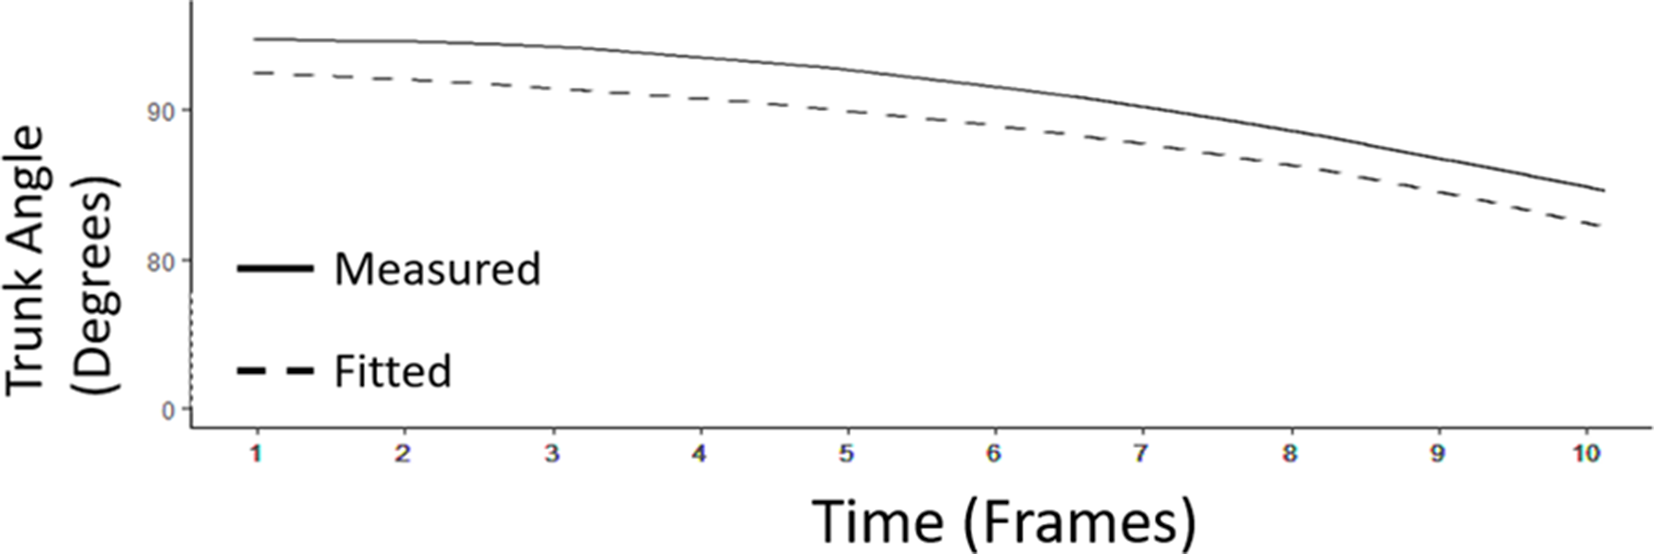
Comparison between fitted trunk flexion angles (calculated using exponential equations, represented by dashed lines) and measured trunk flexion angles (calculated using the motion capture data, represented by solid lines) over 10 consecutive frames.
Regression models were created for predicting α and β (Equation (1)) to approximate the time series of trunk angles for stoops (adjusted R2 = .37, p < .001, for α model; adjusted R2 = .11, p = .05, for β model), squats (adjusted R2 = .40, p =.13, for α model; adjusted R2 = .72, p = .01, for β model), and standing lifts (adjusted R2 = .30, p < .001 for α model). Beta of each fitted exponential curve of standing lifts is a constant (0) since minimum trunk flexion is involved in standing lifts. A total of six models were developed. A summary of the regression models to predict parameters of exponential equations α and β (Equation (1)) to estimate trunk flexion angles over consecutive lifting frames is presented in Table 5.
Summary of Regression Models for Estimating Exponential Parameters to Predict Trunk Angles Over Consecutive Video Frames

Note. DA = angle between bounding box diagonal and the bottom; DL = bounding box diagonal length; DUL = displacement of bounding box upper-left corner; DUR = displacement of bounding box upper-right corner; HA = angle between the line segment between hands and feet and the floor; HD = length of the line segment between hands and feet; SD = standard deviation.*p < .05. **p < .01. ***p < .001.
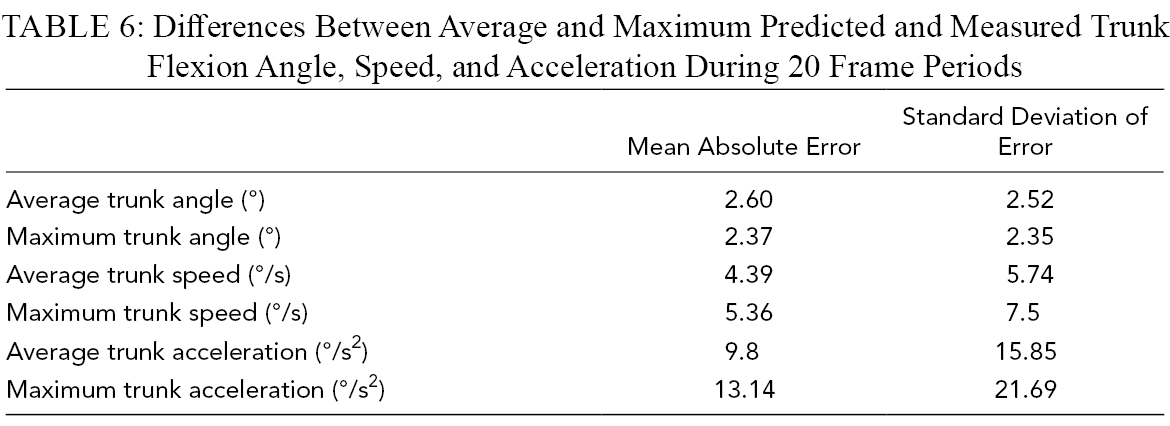
The mean absolute difference between the predicted and fitted trunk angles for each frame was 2.34° (N = 216, SD = 2.52). Based on the predicted trunk flexion angles and video frame rate (30 frames/s), trunk speed and acceleration in each frame were calculated. The comparisons between predicted and fitted trunk flexion angle, speed, and acceleration for a stoop lift are presented in Figure 7. A summary of the differences between predicted and measured trunk kinematics is provided in Table 6. Histograms of the differences between predicted and measured values are presented in Figure 8.
Differences Between Average and Maximum Predicted and Measured Trunk Flexion Angle, Speed, and Acceleration During 20 Frame Periods

Fitted trunk kinematics (calculated using exponential equations, represented by solid lines) and measured trunk kinematics (calculated using the motion capture data, represented by dashed lines) over 20 consecutive frames.

Histograms of differences between predicted and measured average trunk angles (A), maximum trunk angles (B), average trunk speed (C), maximum trunk speed (D), average trunk acceleration (E), and maximum trunk acceleration (F).
Discussion
The objective of the current study was to develop a computer vision method for predicting trunk angles, speed, and acceleration using simple features that can be extracted from videos. Without requiring direct instrumentation on the worker or fitting skeleton models of the image, the method may be tolerant of a range of visual interference while capable of objective lifting measurements with reasonable precision.
The lifting monitor algorithm used in this study can extract features including bounding box dimensions and hand locations in a series of consecutive video frames. The computer vision-based direct reading system can continuously acquire trunk kinematics information for comprehensive lifting risk assessments, which may lead to new risk models based on cumulative risk information that has not been adequately investigated in previous studies.
This study utilized the posture prediction feature of 3DSSPP, which generated simulated postures according to the locations of the TLV zone intersections without extensive time and necessity of recruiting human participants for training data. There are limitations as a result of training the algorithm with simulated postures. The simulated postures may not be representative of the full range of variations in lifting motion. Additionally, the full range of lifting motion may be influenced by factors such as the worker’s training, individual preferences, and environmental constraints (University of Michigan Center for Ergonomics, 2019).
The videos of real-life lifting tasks were recorded in a laboratory setting and the only lifting feature that varies is the hand location. In these videos, the lighting and camera angle were well-controlled, the movement patterns of the subjects were designed before the experiment, and the object lifted was the same across all experiments. Therefore, the tasks in the test dataset may lack sufficient variation for comprehensive validation. Furthermore, to ensure the performance of the motion-tracking system, the object used in the experiments was a hollow rectangular frame that was small and lightweight. The pattern of lifting for such an object may be different from those that are found in manual material handling tasks in the industry. For improved validity, the lifting monitor algorithm needs to be tested on videos in actual industrial settings. Additionally, large between-trial differences (up to 27.35°) were observed in the trunk flexion angles measured using motion capture for the three repeated trials performed by each subject at each lifting location (M = 7.19, SD = 5.85). To mitigate the between-trial differences, we subtracted the initial trunk angle before modeling trunk angles over consecutive frames, and then added the predicted initial angle back in the prediction. Deep learning models may serve as an alternative means of measuring trunk angles by identifying joint locations in video frames (Xiao et al., 2018). Our future work will explore the application of deep learning on measuring trunk angles in video data of the laboratory study and compare the difference of measurements provided by motion capture and deep learning.
The bimodal distribution of the trunk flexion angles in both the 3DSSPP dataset (demonstrated in Figure 5) and laboratory study dataset is another concern. The frequency of observations reaches the local minimum between 30° and 40°. There are no observations for trunk flexion angles in the validation dataset in the range from 30° to 40°. Furthermore, differences in the range are also present between the two datasets. The ranges in centimeters were 0–93.03 in the 3DSSPP dataset and 2–83.93 in the laboratory study dataset for hand horizontal location (H); 0–154.82 in the 3DSSPP dataset and 0–175.25 in the laboratory study dataset for hand vertical location (V); and 36.24–114.34 in the 3DSSPP dataset and 48.76–124.46 in the laboratory study dataset for box width (BW).
A linear relationship between the static model predicted and measured trunk flexion angles T was present, indicating that the model discussed in the current paper can reproduce the results of a motion-tracking system that requires enormous setup, operation, and data processing to some extent. In the current model, a discrepancy (14.65°) exists between the predicted trunk angles and the angles measured through motion capture. After summarizing the prediction error for each 10° increment of measured trunk angle, it was revealed that increased errors occur at very small (<30°) and extreme trunk flexion angles (>100°). The large error at small trunk flexion angles may be attributed to the lack of training data in this range in the static model, and we anticipate that the model accuracy in this range will improve when additional training data are collected. Overestimating small trunk flexion angles may misclassify low-risk tasks as high-risk; however, this model favors the safe side and avoids overlooking high-risk tasks. Trunk postures greater than 90° are not often observed in the industry, as indicated by previous studies on industrial lifting jobs by Lavender et al. (2012) and Marras et al. (1993). Therefore, the overall accuracy of the model is anticipated to improve for assessing most lifting conditions in the workplace. Although high-precision measurement of trunk angle is desirable, defining a range for the trunk angle is usually what is necessary in current ergonomic assessment methods. For example, in the REBA, the trunk angle only needs to be classified into extension, 0°−20°, 20°−60°, and greater than 60°. Another highly used lifting assessment tool, the NIOSH lifting equation, also only requires classifying each factor into a range. Trunk angle is not a factor for the NIOSH lifting equation. However, the asymmetry angle, the only body angle that is incorporated into the NIOSH equation, needs to be classified into a 15° interval ranging from 0° to 135°. Although the current model has not reached the accuracy of various laboratory studies, it possesses the potential to provide data input for ergonomic assessment methods such as the REBA.
The static model for estimating spine flexion angle S revealed a statistically significant relationship (p < .001) between the spine flexion and the computer vision-extracted features. However, the relatively low R2 (adjusted R2 = .72) suggests that this model does not explain some of the variance in the spine flexion data. One possible explanation is that the included knee angle, a factor that contributes to the spine flexion, is not well captured by the current set of variables in the model. Additionally, due to the lack of spine flexion data available to us, this model was not validated using human lifting tasks. Since the disc between L5 and S1 incurs the greatest potential during lifting and is susceptible for force-induced injuries, estimating the biomechanical stress for the L5/S1 disc could provide valuable information for lifting analysis (Waters et al., 1993). If the spine flexion around L5/S1 can be estimated using variables measured by our lifting monitor algorithm, which is fast and does not require instrumentation, the difficulty in quantifying the biomechanical stress at L5/S1 may be significantly reduced. Future work will investigate the relationship between included knee angle and computer vision-measured variables. Additional experiments will be conducted to collect spine flexion data during human lifting tasks to collect data for model validation.
Exponential functions closely approximated the progression of trunk flexion angle for each lift, and exponential equation parameters were estimated using regression models to predicted trunk angle, speed, and acceleration over consecutive video frames with reasonable errors (Table 6). Despite the small differences between predicted and measured trunk kinematics, further improvements of the models are crucial. Although small p values (p < .05) were found for four out of the six dynamic models indicating a high probability of linear relationships between the variables and the exponential equation parameters, the low R2 values suggest that a large amount of variance in these parameters were not explained by the models. One possible explanation for this is the measurement variability of the motion capture system between trials. Furthermore, due to the light weight of the object lifted in the experiments, the lifting movements may not be fully representative of typical lifting tasks performed in the industrial setting, and the range of trunk speed in the dataset is very limited.
The computer vision method used in automating measurements of lifting risk factors in this study may save practitioners substantial time for data collection. This computer vision method is also able to address the inability of many observation-based postural classification methods to quantify trunk kinematics. The consistency and objectivity of the computer vision method are particularly important in today’s work conditions where lifting occurs in numerous locations involving varying body postures throughout the work day. Video image processing is noninvasive and does not necessitate putting instruments or sensors on the worker so it will not interfere with the work. The algorithm developed for this research is designed to be insensitive to occlusion from the objects handled and other variabilities in the workplace, such as obstructions, clothing, lighting, and dynamic backgrounds. These workplace constraints often impede the ability of skeletal models to recognize the whole-body posture and measure joint angles effectively (Mehrizi et al., 2018; Seo et al., 2016).
Compared to deep learning methods, the simple feature computer vision method we used relaxes the need for precise tracking of human joint locations. However, because of analyzing fewer features and estimating trunk kinematics indirectly, this method yields less precision than human posture analysis, which requires identifying joint locations and overlaying a skeleton on the human image (e.g., Mehrizi et al., 2019). While being able to offer relatively high-precision measurements, deep learning involves matching a large number of feature points and is computationally intensive. Compared to methods that require precise tracking of joint locations, our method requires significantly less computation power and can be implemented on devices like smartphones and personal computers. The aim of our method is to provide fast and reliable estimations for surveillance purposes in the industrial setting. For this purpose, the current level of precision may be sufficient. The method ultimately needs to be tested for industrial lifting tasks with associated health outcomes to determine whether the estimated trunk kinematics are sufficient to identify high-risk lifting tasks.
Future work will improve model external validity. Lifting tasks performed by workers in the industry will be utilized to train the model. This will not only be more representative of human lifting in the workplace than lifts in the laboratory study but also incorporate a larger variety of lifting tasks, objects lifted, and lifting postures.
The current research demonstrates the feasibility of predicting trunk flexion angles for various lifting postures using simple computer vision-extracted features from video recordings. Findings from this study expand the application of the bounding box computer vision method in the area of manual lifting analysis. We anticipate implementing the method on portable handheld devices, making it widely accessible to practitioners.
Key Points
Models were developed for estimating trunk kinematics using simple bounding box computer vision features from video recordings.
Trunk kinematics calculated using the models showed agreement with those measured by a research-grade motion capture system.
The computer vision-based method is automated, nonintrusive, computationally efficient, and with the potential to serve as a practical lifting assessment method over extended periods.
Footnotes
Acknowledgments
The authors would like thank Dwight Werren and other NIOSH associates for assisting in data collection. The contents of this effort are solely the responsibility of the authors and do not necessarily represent the official view of the National Institute for Occupational Safety and Health, Centers for Disease Control and Prevention, or other associated entities. This study was funded, in part, by a grant from the National Institute for Occupational Safety and Health (NIOSH/CDC) R01OH011024 (Radwin), NIOSH/CDC contract 5D30118P01249 (Radwin), and a pilot training grant from the NIOSH-funded MCOHS-ERC Pilot Research Training Program OH008434 (Greene).
Author Biographies
Runyu L. Greene is a PhD candidate in industrial and systems engineering at the University of Wisconsin-Madison. She has BS and MS degrees in industrial and systems engineering from the University of Wisconsin-Madison.
Ming-Lun Lu is a certified professional ergonomist and manager for the Musculoskeletal Health Cross-sector Research Program at the National Institute for Occupational Safety and Health. He has a PhD in industrial hygiene with a concentration on ergonomics from the University of Cincinnati, USA.
Menekse Salar Barim has a PhD in industrial and systems engineering with an emphasis in occupational injury prevention in 2017 from Auburn University. She is a research fellow at NIOSH.
Xuan Wang has a PhD in electrical and computer engineering from the University of Wisconsin-Madison. She is a data scientist at 3M, focusing on image and tabular data processing.
Marie Hayden earned her master’s degree in industrial and systems engineering focusing on occupational safety in 2016 from Ohio University. She has been working at NIOSH as a research fellow since 2017.
Yu Hen Hu is a professor in electrical and computer engineering at the University of Wisconsin-Madison. He has a BS from National Taiwan University and PhD from the University of Southern California.
Robert G. Radwin is Duane H. and Dorothy M. Bluemke Professor in the College of Engineering, University of Wisconsin-Madison. He has a BS from New York University and MS and PhD degrees from the University of Michigan.