
Abstract
Objective
This study investigated the effects of nondriving-related task (NDRT) touchscreen location and NDRT difficulty level on the driver task performance, eye gaze behavior, and workload during SAE Level 3 conditionally automated driving. Two driver tasks were considered: a visuomanual NDRT and a take-over task.
Background
Touchscreens are expected to play important roles inside automated vehicles. However, few studies have investigated the driver-touchscreen interaction during automated driving.
Method
A driving simulator experiment was conducted. The experimental task consisted of two successive subtasks: an NDRT followed by a take-over task. NDRT touchscreen location (Upper Left, Upper Right, and Lower Right) and NDRT difficulty level (Easy and Hard) were the independent variables. A set of driver task performance, eye gaze behavior, and perceived workload measures were employed for each subtask as the dependent variables.
Results
NDRT touchscreen location significantly affected both the NDRT and the take-over task performance. Lower Right was superior to Upper Right in the NDRT performance but was inferior in the take-over task performance. NDRT touchscreen location affected the perceived physical workload of the NDRT. NDRT difficulty level affected the perceived workload of the take-over task.
Conclusion
The research findings enhance our understanding of how NDRT touchscreen location and NDRT difficulty level impact the driver task performance during conditionally automated driving, and, further provide useful design implications and knowledge.
Application
The study results would inform the NDRT touchscreen interface design and the NDRT design for conditionally automated vehicles.
Introduction
Driver-vehicle interfaces are increasingly employing touchscreens. Tesla’s interface, for example, offers a single 17-inch touchscreen in the middle of the dashboard through which a driver controls most of the vehicle functions (Levin, 2020). Similarly, Ford Mach-E and Rivian R1T provide a 15.5-inch and a 16-inch center stack touchscreen, respectively (Armstead, 2022; Jancer, 2022).
The increasing use of in-vehicle touchscreens seems attributable to their advantages over traditional in-vehicle displays and controls. A touchscreen saves space by presenting multiple digitally generated displays and controls in a single, relatively small area (Pitts et al., 2012a, 2012; Schölkopf et al., 2021) and is capable of dynamically updating them according to changes in task context (Cockburn et al., 2018). Also, it can deliver unlimited interactive and noninteractive content to the driver through an internet connection (Huang et al., 2010; Ahmad et al., 2015; Chen et al., 2022). Moreover, replacing conventional displays and controls with a single touchscreen reduces manufacturing costs (Cockburn et al., 2018). These advantages render touchscreens suited to the development of in-vehicle information systems, which support the driver with various in-vehicle tasks.
The use of in-vehicle touchscreens is expected to continually increase in the future as the range of driver tasks would likely expand due to the advances in autonomous vehicle technology. An automated vehicle allows drivers to engage in various nondriving-related tasks (NDRTs), including reading, text entry, movie-watching, and gaming—the automation level determines the range of feasible NDRTs and interaction styles (Janssen et al., 2019). An in-vehicle touchscreen would support various NDRTs. For example, in the context of SAE Level 3 (Society of Automotive Engineers [SAE], 2016) conditionally automated driving, a typical scenario may go as follows: a driver downloads and plays a video game through a touchscreen while the vehicle is driving itself. Upon a take-over request (TOR) issued by the vehicle, the driver stops playing the video game and takes over vehicle control to switch to human driving.
Numerous human factors research studies have been conducted to inform the in-vehicle touchscreen interface design. Many of them examined how driver task performance is affected by Graphical User Interface (GUI) design variables, such as touch-key size (Cockburn et al., 2018; Eren et al., 2018; Feng et al., 2018; Kim et al., 2014; Liu et al., 2022; Suh & Ferris, 2019; Tao et al., 2018), touch-key shape (Tao et al., 2018), touch-key spacing (Tao et al., 2018), number of on-screen items (Feng et al., 2018; Kujala & Saariluoma, 2011; Kujala & Salvucci, 2015), menu structure/type (Burnett et al., 2013; Kujala & Salvucci, 2015; Ma et al., 2018; Patel et al., 2022), scrolling method (Hoffman et al., 2005; Kujala & Saariluoma, 2011), number of on-screen text lines (Xian & Jin, 2015), number of steps required for the completion of a secondary task (Grahn & Kujala, 2020; Xian & Jin, 2015), text size (Crundall et al., 2016), and on-screen scroll button location (Kujala & Salvucci, 2015). Many of these GUI design variables represent different ways of operationalizing touchscreen task difficulty. Other studies investigated the effects of physical user interface design variables, such as touchscreen location (Fuller et al., 2008; Hagiwara et al., 2013; Patel et al., 2022), touchscreen orientation (Patel et al., 2022), touchscreen size (Grahn & Kujala, 2020; Ma et al., 2018), touchscreen click position (Liu et al., 2022), touchscreen slide gesture area (Liu et al., 2022), and key feedback modality (Cockburn et al., 2018; Pitts et al., 2012a, 2012; Russomanno et al., 2017; Soomro & Cockburn, 2020; Suh & Ferris, 2019).
Many of the studies mentioned above employed measures of gaze/glance behavior and workload in addition to task performance measures. Studies that employed behavioral measures include: Cockburn et al. (2018); Crundall et al. (2016); Feng et al. (2018); Grahn & Kujala (2020); Hoffman et al. (2005); Kim et al. (2014); Kujala & Saariluoma (2011); Kujala & Salvucci (2015); Ma et al. (2018); Pitts et al. (2012a, 2012). Studies that adopted subjective workload measures include: Hoffman et al. (2005), Kim et al. (2014), Cockburn et al. (2018), Eren et al. (2018), Tao et al. (2018), Suh & Ferris (2019), and Grahn and Kujala (2020).
Despite the extensive research on in-vehicle touchscreen interface design mentioned above, significant research gaps remain. One major gap exists in the realm of automated driving. Previous human factors studies on in-vehicle touchscreen design have predominantly focused on conventional human driving (with no driving automation), where the driver performs the primary driving task along with a secondary touchscreen task. To the best of our knowledge, no study has specifically addressed in-vehicle touchscreens in the context of automated driving. This oversight is significant, especially considering the anticipated rise in the use of in-vehicle touchscreens to support various NDRTs in the era of automated driving. On the basis of the findings from the previous touchscreen studies in human driving contexts, it is possible to extrapolate that in-vehicle touchscreen interface design would affect human information processing behavior, such as visual attention allocation, workload, and performance in tasks specific to automated driving. In automated driving, compared with human driving, in-vehicle touchscreen tasks would be significantly more complex and require more attentional resources from occupants while occupants tend to be disengaged from the act of driving and the outside world. Relevant human factors research grounded in sound theories and principles, for example, models of visual attention (Steelman et al., 2017; Wickens et al., 2003, 2015; Wickens & McCarley, 2019) and task switching (Wickens et al., 2013; Wickens et al., 2016), is warranted to address the issues specific to automated driving.
The long-term goal of our research is to address the above-mentioned research gap through systematic investigations targeting different levels of driving automation. In an effort toward the long-term goal, this study sought to examine the effects of in-vehicle touchscreen location on driver tasks during SAE Level 3 conditionally automated driving (hereafter, simply “conditionally automated driving”). This study considered the scenario in which a driver performs an NDRT using an in-vehicle touchscreen (hereafter, “NDRT touchscreen”) while the vehicle is driving itself, and, upon a TOR, the driver is required to immediately disengage himself/herself from the NDRT and switch to human driving. It was hypothesized that NDRT touchscreen location would affect the driver gaze behavior, task performance and workload during conditionally automated driving, for both the NDRT and the take-over phase. This hypothesis was based on the reasoning that during the NDRT phase, NDRT touchscreen location would affect the amount of visual information from the outside world (the road scenes through the windshield and mirrors) available within the driver’s visual field, and, thus, would impact the driver’s visual attention allocation between the NDRT touchscreen and the outside world through bottom-up processing (Wickens, 2015; Wickens & McCarley, 2019). NDRT touchscreen location was viewed as a critical design element for in-vehicle touchscreen interface during conditionally automated driving since it was anticipated to influence both the NDRT and the takeover task—both central to the performance, safety and user experience. Relatedly, it is worth noting that in-vehicle touchscreen location has been considered in some previous touchscreen studies in human driving contexts (Fuller et al., 2008; Hagiwara et al., 2013; Patel et al., 2022). Fuller et al. (2008) demonstrated that touchscreens located further away visually from the road ahead or physically from the driver resulted in longer in-vehicle task completion times. However, they found that the location of the touchscreen did not affect driving performance. Hagiwara et al. (2013) and Patel et al. (2022) observed that the location of the touchscreen had no impact on either driving performance or the performance of touchscreen tasks.
Additionally, this study assessed the effects of NDRT difficulty level by introducing two distinct levels: Easy and Hard. The intent was to examine if the effects of NDRT touchscreen location, should they exist, remain consistent across different difficulty levels. Relatedly, many prior touchscreen studies in human driving contexts have also factored in the difficulty level of secondary touchscreen tasks (Cockburn et al., 2018; Crundall et al., 2016; Eren et al., 2018; Feng et al., 2018; Grahn & Kujala, 2020; Kim et al., 2014; Kujala & Saariluoma, 2011; Kujala & Salvucci, 2015; Liu et al., 2022; Suh & Ferris, 2019; Tao et al., 2018; Xian & Jin, 2015). These studies operationalized touchscreen task difficulty in various ways and consistently reported that increased touchscreen task difficulty led to greater touchscreen task visual demands and decreased driving performance. Also, it was hypothesized that NDRT difficulty level might affect gaze behavior, workload, and task performance during the take-over phase on the basis of the previous finding on task switching that a more difficult on-going task is more difficult to leave (Wickens et al., 2013, 2016).
Two research questions, RQ1 and RQ2, entertained in this study were as follows:
How do NDRT touchscreen location and NDRT difficulty level affect a driver’s task performance, eye gaze behavior, and workload during the NDRT phase of conditionally automated driving?
How do NDRT touchscreen location and NDRT difficulty level affect a driver’s task performance, eye gaze behavior, and workload during the take-over phase of conditionally automated driving?
Method
Experimental Design
This experimental study utilized a 3 × 2 within-subjects factorial design. The two independent variables were NDRT touchscreen location (Upper Left, Upper Right, and Lower Right) and NDRT difficulty level (Easy and Hard). Participants underwent an experimental task that comprised both an NDRT phase and a take-over phase across four scenarios in each treatment condition.
Participants
14 males and 6 females participated in this study. Their mean age and driving experience were 27.55 years (SD = 3.44, min = 23, max = 35), and, 4.47 years (SD = 4.63, min = 1, max = 17), respectively. All participants were right-handed, had normal or corrected-to-normal vision acuity, and had held a valid driver’s license for at least 1 year. All participants were paid with USD 20 for their participation. The study received ethical approval from the Institutional Review Board of Seoul National University.
Apparatus
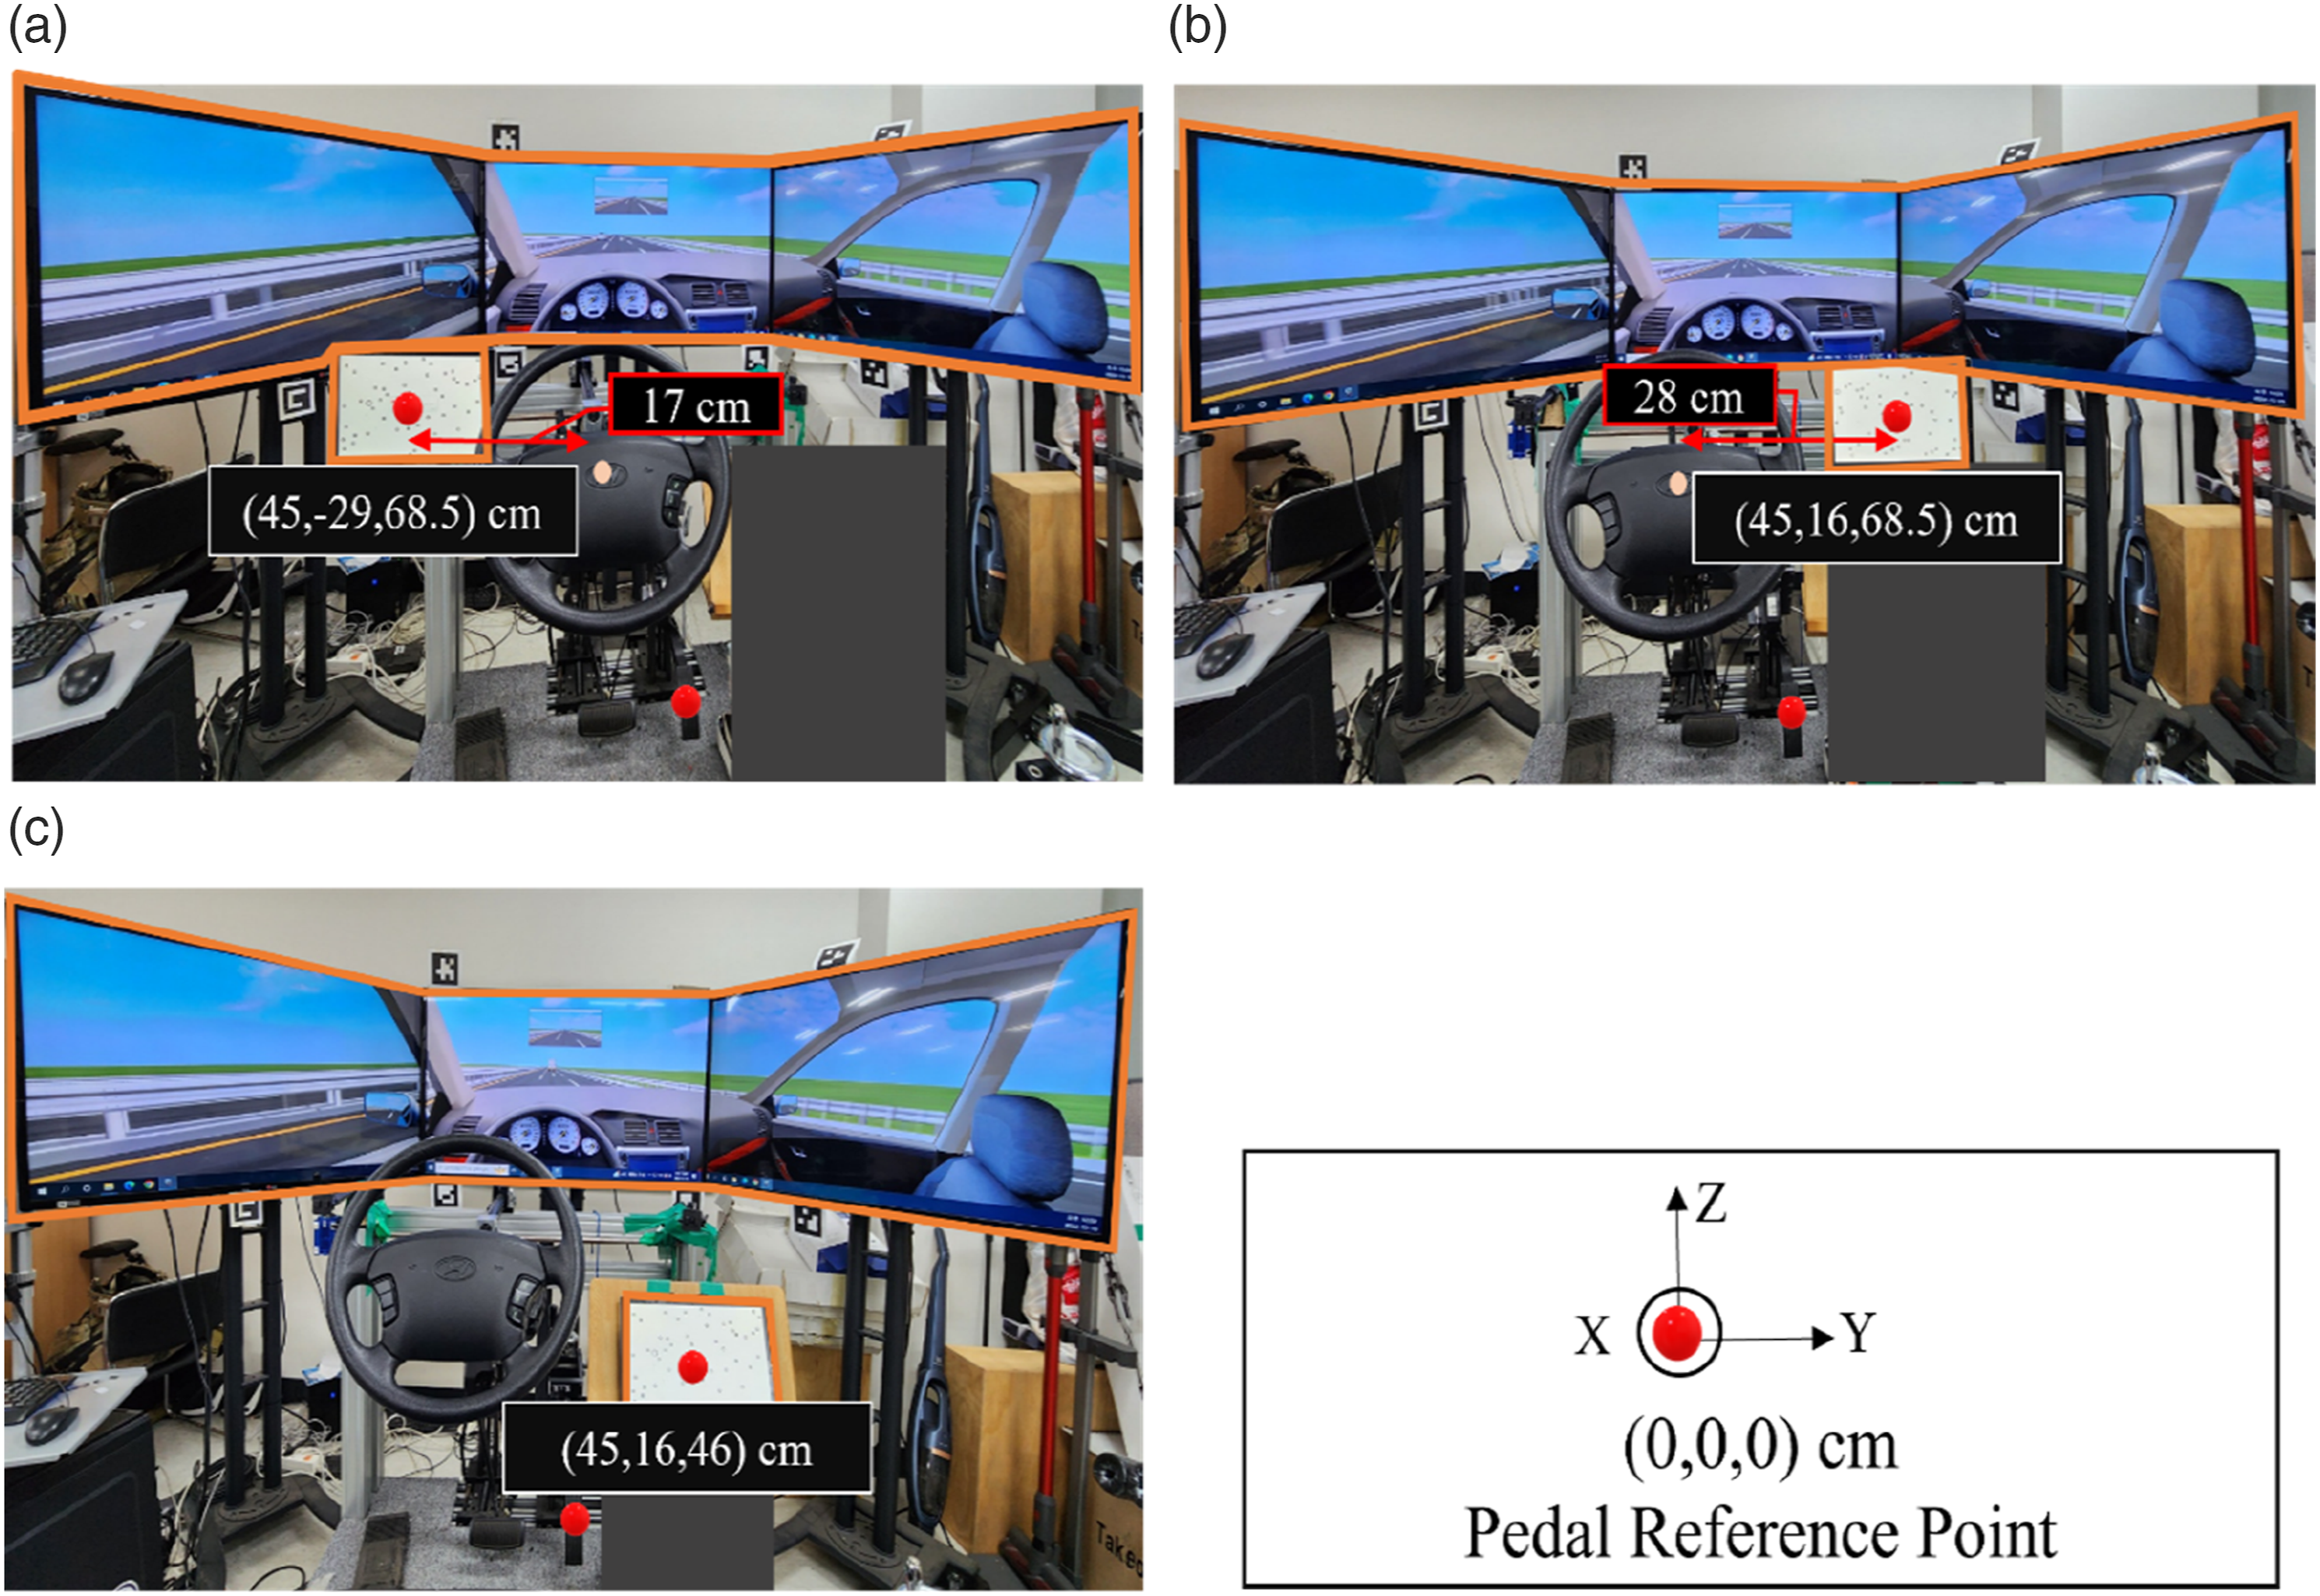
A driving simulator, consisting of an adjustable vehicle interior mock-up, three 42-inch LED monitors, and a PC, was employed in this study (Figure 1). The adjustable vehicle interior mock-up was comprised of a driver’s seat, a steering wheel, a gearshift, a gas pedal, and a brake pedal. The three monitors were placed around the front of the vehicle interior mock-up and provided a forward FOV angle of 183.6°. The UC-win/Road driving simulator software program (Forum8) was utilized to create virtual driving scenarios, run simulated driving experimental trials, and collect driving performance data. A 12-inch tablet computer (Microsoft Surface 3) was employed to simulate an NDRT touchscreen (Figure 2). Three touchscreen locations were considered in this study: Upper Left, Upper Right, and Lower Right, as shown in Figure 2. They corresponded to the typical locations of the left air conditioning vent, the dashboard center, and the bottom of the middle console of a conventional passenger vehicle. The three locations were chosen as they all provide space for a sizeable touchscreen and are within the reach limits of most drivers. Some concept cars exhibited at Consumer Electronics Show 2020 and 2021, such as Sony’s Vision-S and Lucid motor’s Lucid Air, had a touchscreen at the left air conditioning vent and the bottom of the middle console. Each participant’s eye movements were recorded using a Tobii Pro Glasses 3 eye-tracker. The eye-tracker had a horizontal FOV of 95°, a vertical FOV of 63°, and four eye-tracking sensors, with a sampling rate of 50 Hz. The eye-tracker was connected to a small computer called the recording unit. Eye-tracking data was coded and analyzed using the Tobii Pro Lab® Software version 1.171. Experimental setup. Three touchscreen locations: (a) Upper Left, (b) Upper Right, and (c) Lower Right. Each touchscreen location is specified with respect to the pedal reference point. The touchscreen was oriented vertically at Upper Left and at Upper Right, and at an angle of 78° relative to the floor at Lower Right. The grey polygons mark the two AOIs: the NDRT touchscreen and the road (outside world).
Experiment
Prior to the experimental trials, the participants were given an introduction and a training session. In the introduction, the experimenters explained the concepts of SAE Level 3 conditionally automated driving and take-over. Furthermore, the experimental task, which includes both an NDRT and a take-over subtask, was detailed for the participants. The training session was designed to familiarize them with the driving simulator and the experimental task. Each participant underwent several practice trials using the driving simulator.
The experimental task consisted of two successive subtasks: an NDRT followed by a take-over task in the context of conditionally automated driving. The NDRT was a visual-manual task known as the Surrogate Reference Task (SuRT, ISO TS14198), and, it was performed using the tablet computer (Microsoft Surface 3) simulating an NDRT touchscreen. Again, three touchscreen locations were considered in this study: Upper Left, Upper Right, and Lower Right (Figure 2). The three locations give rise to different driver postures (head position and orientation) during the NDRT, and, thus, were expected to differ in the amount of visual information from the outside world available within the driver’s visual field during the NDRT.
The NDRT (SuRT) required each participant to examine a circle set consisting of a single target and 49 distractors randomly presented on the NDRT touchscreen. Both the target and the distractors were open circles in black displayed on a white background. The distractors were of the same size and the target had a different size. The participant was instructed to visually search for and finger-tap the target as quickly as possible. Then, the next circle set was presented and the process repeated. The NDRT was self-paced as the next circle set was not given until the completion of the participant response for the current set. No error message was shown when the participant made an incorrect response. No monetary incentives were used to enhance the performance of the NDRT subtask. The spatial configuration of the target and the distractors was randomized for each successive circle set. Two NDRT difficulty levels (Easy and Hard) were considered (Figure 3). For the level Easy, the diameter of the target was 2.5 cm and that for the distractors was 1.2 cm. For the level Hard, the diameter of the target and that for the distractors were 1.5 cm and 1.2 cm, respectively. Two NDRT difficulty level: (a) Easy and (b) Hard. Each arrow indicates the location of a target circle to click.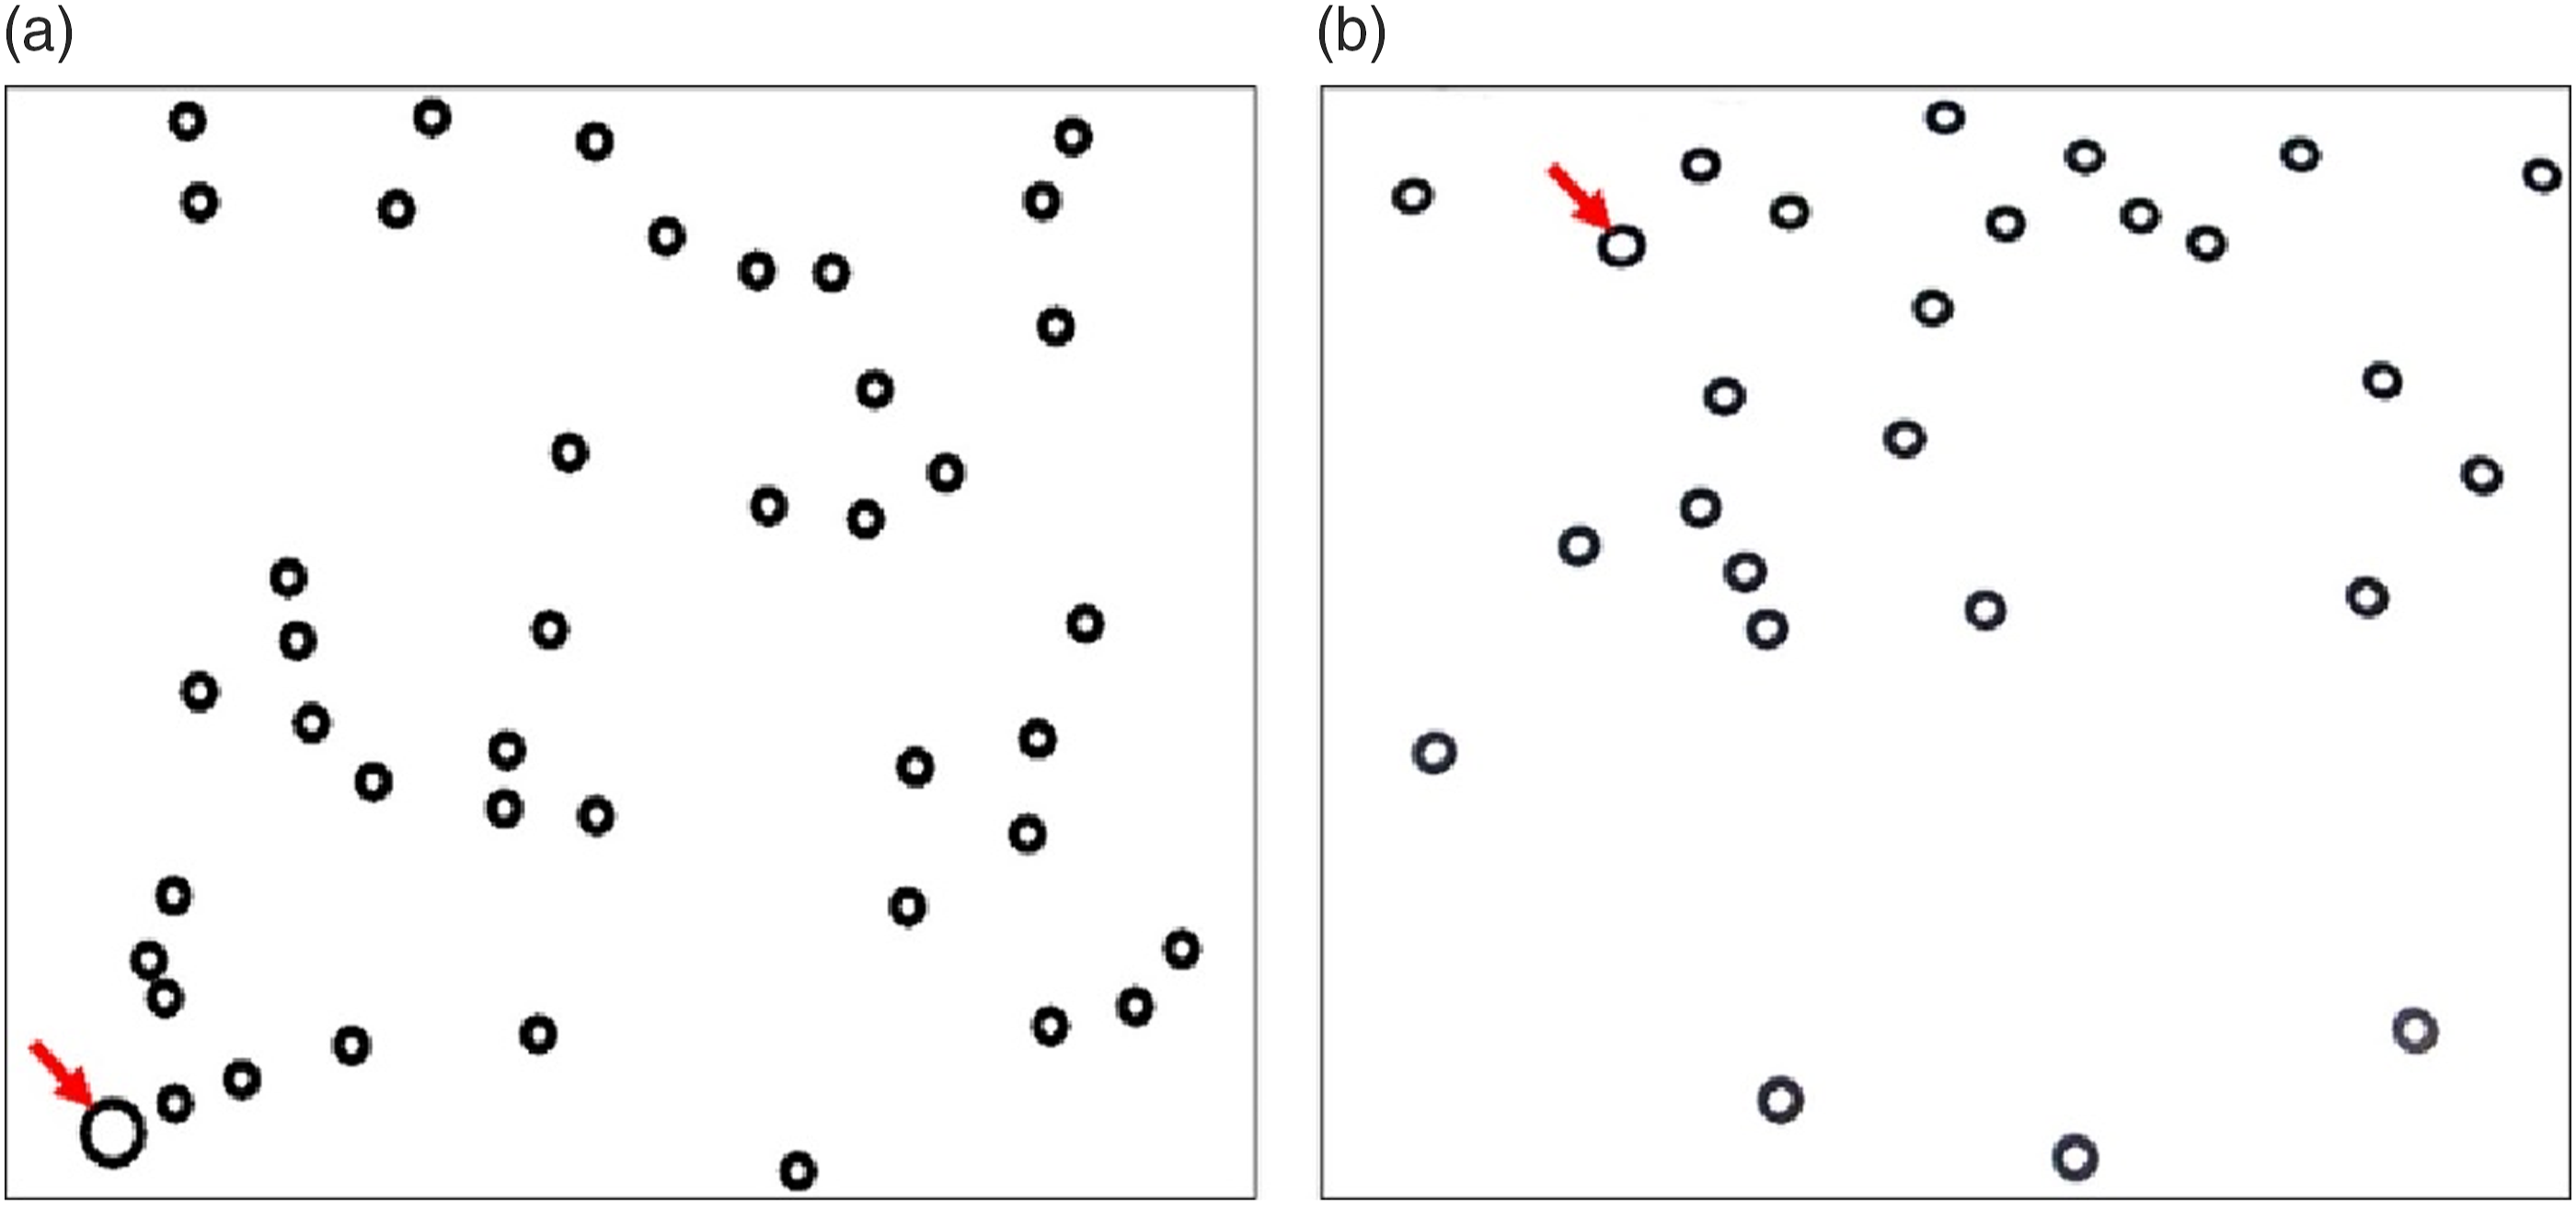
At the beginning of each experimental trial, the simulated ego vehicle (an SAE Level 3 automated vehicle) was self-driving on the second lane of a three-way highway, and, the participant started performing the NDRT. The ego vehicle’s speed was fixed at 100 km/h throughout each experimental trial, including both the NDRT and the take-over phase. The participants were informed of this and were also told that during the take-over phase, they were restricted from using the pedals, relying solely on the steering wheel to execute necessary driving maneuvers. The participant was instructed to take the hands off the steering wheel to perform the NDRT but be always ready to take control of the vehicle upon a TOR (NHTSA, 2013). The NDRT phase duration was 3 minutes—the participants were not informed of the duration.
At the end of the NDRT phase, the take-over phase began with an obstacle appearing on the second lane, 194 m ahead of the ego vehicle. Simultaneously, a TOR (a beeping sound) was presented, alerting the participant. The participant was instructed that, immediately upon receiving the TOR, they should place their hands back on the steering wheel, check the road ahead, the side-view mirrors, and the rearview mirror, and then make decisions and perform the necessary driving maneuvers. Once again, the participant used only the steering wheel, as the ego vehicle’s speed was fixed at 100 km/h and they were not permitted to use the pedals. The time budget for taking over control and making the lane change was set to be 7 seconds (Gold et al., 2013; Samuel et al., 2016).
As in the real-world lane changing task, the take-over subtask required checking surrounding vehicles on the first and the third lane for making a safe lane change. Prior to the appearance of the obstacle, previously generated background vehicles moved away from the ego vehicle to disappear, and, three new vehicles came into the vicinity of the ego vehicle and surrounded it. This reconfiguration was completed 10 seconds prior to the TOR, and, at the time of completion, the three surrounding vehicles were placed according to one of the four predesigned configurations (scenarios) (Figure 4). Each of the surrounding vehicles was moving at a constant speed without making any lane changes; the speed of each surrounding vehicle was determined between 85 km/h and 120 km/h. In each of the four scenarios, the ego vehicle’s constant speed combined with the positions and constant speeds of the three surrounding vehicles rendered only one of the two lane change options (either to the first or the third lane) safe, as illustrated in Figure 4. This combination also served as a generic representation of safety-critical and high-pressure take-over situations for a conditionally automated vehicle. A successful decision making for lane change required the participant to check all three visual channels for driving (the roadway ahead, the side-view mirrors, and the room mirror) and properly integrate the gathered information. Bird’s-eye views of the four take-over driving scenarios at the moment of the take-over request issuance (a beeping sound). The ego vehicle is marked in a red box and each surrounding vehicle, in a white box. The obstacle is shown as a yellow filled-in square.
At the completion of each experimental task trial, the participant completed the NASA Task Load Index (TLX) questionnaire (Hart & Staveland, 1988) to assess the workload (s)he experienced during each of the two task phases (the NDRT and take-over task phases). Then, the driving simulation was reinitialized, and the participant’s vehicle was re-generated on the second lane for the next trial.
Each participant performed a total of 24 experimental trials: 24 = 3 NDRT touchscreen locations × 2 NDRT difficulty levels × 4 take-over scenarios. All the 24 trials were performed in one day, and, after completing 12 experimental trials, a 15-min rest break was given to the participant. The order of the 24 experimental trials was fully randomized for each participant.
Experimental Variables
The independent variables of the study were NDRT touchscreen location (Upper Left, Upper Right, and Lower Right) and NDRT difficulty level (Easy and Hard) (Table 1). As for the dependent variables, a set of task performance, eye gaze behavior, and workload measures were employed for each of the two task phases (Table 1). The dependent variables used for the NDRT phase were as follows: • Five NDRT performance measures were employed: total number of clicks, number of incorrect clicks, number of correct clicks, percent of incorrect clicks, and percent of correct clicks. • Eye gaze behavior was examined using the measures of total glance duration. This was to explore the driver’s level of visual engagement and strategies for visual attention allocation. Total glance duration is defined as the sum of the lengths of the individual glances to an area of interest (AOI). The length of a single glance is the time from the start of the saccade leading into the AOI to the end of the last fixation on the AOI (ISO 15007, 2002; Highway Traffic Safety Administration Visual-Manual Guidelines, 2013; Tullis & Albert, 2013). Two AOIs were considered: NDRT touchscreen and road (outside world) (Figure 2). • The workload measures employed were the NASA TLX scores (Hart & Staveland, 1988). The NASA-TLX consists of six workload scores corresponding to different workload dimensions (Mental, Physical, Temporal, Performance, Effort, and Frustration) and an overall workload score. Experimental Variables.
The dependent variables used for the take-over task phase were as follows: • Two take-over task performance measures were employed: response time and lane change completion time. Response time was determined as the time duration between the TOR issuance and the onset of the driver’s lane changing maneuver (the time when the participant started turning the steering wheel). Lane change completion time was determined as the time duration between the TOR issuance and the completion of the vehicle’s lateral movement into the target lane. The two measures were determined using the log data from the driving simulation software program. • The eye gaze behavior measures were identical to those used for the NDRT phase. • The workload measures were identical to those used for the NDRT phase.
Statistical Analyses
A series of two-way repeated measures ANOVAs were conducted to test the effects of the independent variables and their interaction on each dependent measure. For each ANOVA, sphericity of data was tested using Mauchly’s test. In cases where sphericity was violated, the degrees of freedom were corrected (Field & Miles, 2009). The Greenhouse–Geisser correction was used when the Greenhouse–Geisser estimate of sphericity (ε) was less than .75; the Huynh–Feldt correction was used otherwise. In cases where the main effect of NDRT touchscreen location was found to be statistically significant, post-hoc multiple pairwise comparisons with Bonferroni correction were conducted. All statistical tests were conducted at an alpha level of .05 using SPSS 26 (IBM Corp, Armonk, USA).
Results
NDRT Phase
Factor Main Effects on Task Performance and Eye Gaze Behavior Measures (NDRT Phase).

aBonferroni post-hoc test results. Within each row, means sharing a superscript letter are not significantly different from one another (α = .05).
bBonferroni post-hoc test results. Within each row, means sharing a superscript letter are not significantly different from one another (α = .05).
cBonferroni post-hoc test results. Within each row, means sharing a superscript letter are not significantly different from one another (α = .05).
The ANOVAs on the two eye gaze behavior measures for the NDRT phase found significant NDRT touchscreen location main effects: total glance duration to NDRT touchscreen, F (2, 38) = 13.33, p < 0.001, and, total glance duration to road, F (1.43, 54.57) = 4.72, p < 0.05 (Table 2). The post-hoc multiple pairwise comparisons revealed that: Upper Right and Upper Left resulted in a significantly shorter total glance duration to NDRT touchscreen than Lower Right, and, Lower Right had a significantly shorter total glance duration to road than Upper Right. The ANOVAs found no NDRT difficulty level main effect and no two-way interaction effects.
The ANOVAs on the NDRT phase NASA TLX scores found some significant main and interaction effects. NDRT touchscreen location affected only the “physical demand” score, F (2, 36) = 8.89, p < 0.01 (Figure 5(a)). The post-hoc multiple pairwise comparisons indicated that Lower Right resulted in a lower mean physical demand score than Upper Right and Upper Left. NDRT difficulty level significantly affected the scores of mental demand, F (1, 19) = 41.15, temporal demand, F (1, 19) = 22.52, performance, F (1, 19) = 23.09, effort, F (1, 19) = 35.31, and, overall demand, F (1, 19) = 21.41, all with p < 0.001 (Figure 5(b)). Hard showed a higher mean score than Easy for the mental demand, temporal demand, effort, and overall demand scores. On the other hand, Easy showed a higher mean score than Hard for the “performance” score. A significant two-way interaction was found only for the “temporal demand” score, F (1.44, 27.40) = 4.38, p < 0.05 (Figure 5(c)). The post-hoc multiple pairwise comparisons indicated a significant difference between Easy and Hard, only at Upper Left. Main and interaction effects on NDRT phase NASA TLX scores: (a) NDRT touchscreen location main effect on NASA TLX physical demand score, (b) NDRT difficulty level main effects, (c) NDRT touchscreen location × NDRT difficulty level interaction effect on NASA TLX temporal demand score. Each bar graph presents the mean and standard deviation for each factor level. Asterisks indicate significance in pairwise comparison. Asterisks indicate significance in pairwise comparison. *p < 0.05. **p < 0.01. ***p < 0.001.
Take-Over Task Phase
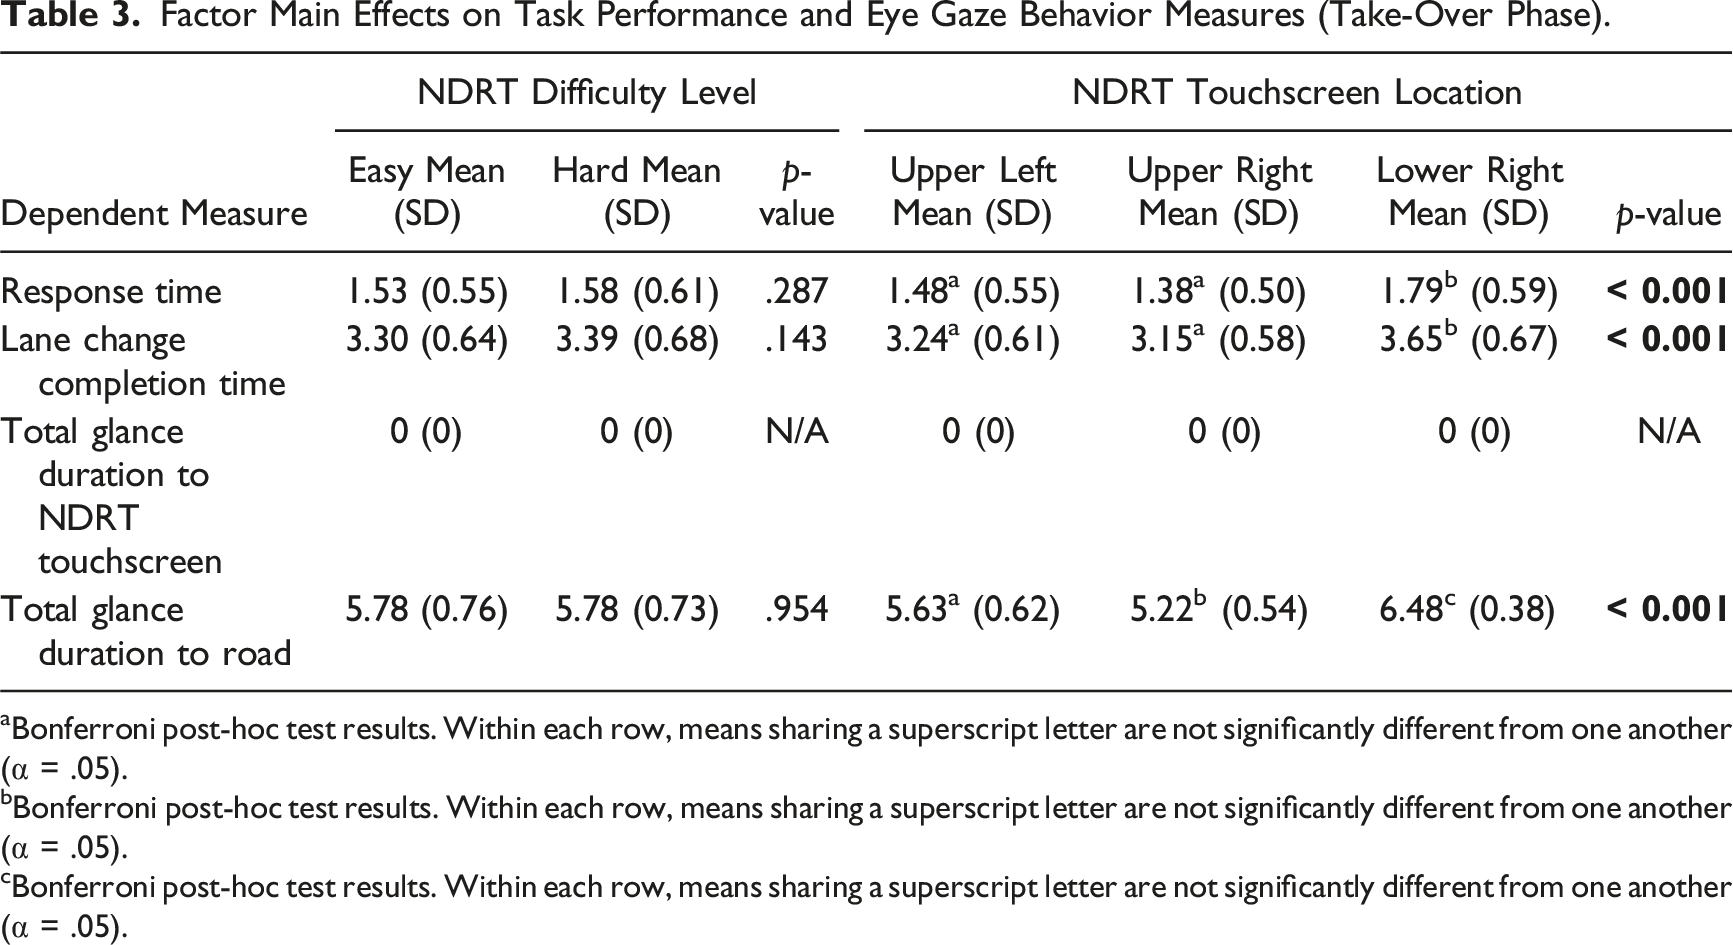
Factor Main Effects on Task Performance and Eye Gaze Behavior Measures (Take-Over Phase).
aBonferroni post-hoc test results. Within each row, means sharing a superscript letter are not significantly different from one another (α = .05).
bBonferroni post-hoc test results. Within each row, means sharing a superscript letter are not significantly different from one another (α = .05).
cBonferroni post-hoc test results. Within each row, means sharing a superscript letter are not significantly different from one another (α = .05).
The ANOVAs on the take-over task phase NASA TLX scores found significant NDRT difficulty level main effects on the scores of mental demand, F (1, 19) = 18.82, p < 0.001, temporal demand, F (1, 19) = 5.75, p < 0.05, effort, F (1, 19) = 5.53, p < 0.05, and overall demand, F (1, 19) = 8.57, p < 0.01 (Figure 6). The ANOVAs, however, found no NDRT touchscreen location main effect and no two-way interaction effects. NDRT difficulty level main effects on take-over phase NASA TLX scores. Each bar graph presents the mean and standard deviation for each factor level. Asterisks indicate significance in pairwise comparison. Asterisks indicate significance in pairwise comparison. *p < 0.05. **p < 0.01. ***p < 0.001.
Discussion
Concerning RQ1 (the NDRT phase), the NDRT touchscreen location effects on NDRT task performance measures (number of incorrect clicks, percentage of incorrect clicks and percentage of correct clicks) (Table 2) are thought to reflect the difference in the amount of visual information from the outside world available within the driver’s visual field. In Lower Right, almost no part of the outside world was within the participants’ field of view due to the constraints on driver head position and orientation imposed by the touchscreen location. In contrast, Upper Right and Upper Left permitted a large part of the outside world within the participants’ peripheral vision. Therefore, in Upper Right and Upper Left, external visual stimuli (e.g., other moving vehicles) likely attracted the participants’ visual attention in a bottom-up fashion (Steelman et al., 2017; Wickens et al., 2003, 2015; Wickens & McCarley, 2019) hindering the NDRT; but, such stimulus-driven processing and distractions were precluded in Lower Right. Relatedly, the SEEV model of visual attention (Wickens & McCarley, 2019) describes how external stimuli, especially, salient ones, such as movements and changes, and easily accessible ones, tend to attract the participants’ visual attention.
The above account on the basis of bottom-up attentional processing is further supported by the NDRT touchscreen location effects on the eye gaze behavior measures (Table 2). They confirm that NDRT touchscreen location affected the participants’ visual attention allocation during the NDRT phase.
In addition to bottom-up attentional processing, body posture and simple biomechanics may also help account for the observed NDRT touchscreen location effect on the NDRT performance (Table 2). Upper Right and Upper Left required raising the hand and arm up to the shoulder level whilst Lower Right did not. In ergonomics, elevated arm position is generally regarded as a stressful posture (Bergmann et al., 2001; Karhu et al., 1977; Ludewig and Cook, 1996) and has been shown to adversely affect hand/finger task performance (Wiker et al., 1989). Also, between Upper Left and Upper Right, the latter was biomechanically more stressful because the NDRT touchscreen was further away laterally from the driver (Figure 2) resulting in larger shoulder joint moments and higher muscular exertion. These considerations are consistent with the results shown in Table 2.
As for the results on the NDRT phase NASA TLX scores, NDRT touchscreen location was found to affect only the “physical demand” score (Figure 5(a)). Again, the observed effect can be explained in terms of the impacts of elevated arm position.
The NDRT difficulty level effects on total number of clicks and number of correct clicks (Table 2) and the NASA TLX mental demand, temporal demand, effort, and overall scores (Figure 5(b)) suggest that the independent variable “NDRT difficulty level” was effectively manipulated. On the other hand, as for the NASA TLX “performance” score, Easy was found to have a higher mean NASA TLX “performance” score than Hard (Figure 5(b)). This indicates that the participants felt that they were less successful in performing the NDRT in Easy than in Hard. It is not clear why. Perhaps, the participants thought that for Easy, they should have done better.
The NDRT touchscreen location × NDRT difficulty level interaction effect found for the NASA TLX temporal demand score (Figure 5(c)) may be related to hand dominance. The participants used the less dexterous, nondominant left hand for Upper Left while using their dominant right hand for the other two NDRT touchscreen locations. It is thought that the participants found an increase in the NDRT difficulty level more challenging when using the less dexterous nondominant hand than the dominant hand.
Concerning RQ2 (the take-over task phase), the NDRT touchscreen location effects on the two take-over task performance measures (response time and lane change completion time) and total glance duration to road during the take-over task phase (Table 3) seem logically related to the NDRT touchscreen location effects on the eye gaze behaviors during the NDRT phase (Table 2) discussed earlier. The shorter glance duration to the road during the NDRT phase observed for Lower Right (Table 2) suggests that less information about the situation in the outside world was available to the participants at the beginning of the take-over task phase for Lower Right. Thus, gaining situation awareness for conducting the take-over task likely required more and longer visual information processing for Lower Right, as shown in Table 3. This also explains the worst take-over task performance observed for Lower Right (Table 3). Again, these findings can be explained on the basis of the bottom-up processes of visual attention control (Steelman et al., 2017; Wickens et al., 2003, 2015). Taken together, the results in Tables 2 and 3 seem to reveal a trade-off between the NDRT and the take-over task performance mediated by NDRT touchscreen location.
The NDRT difficulty level effects on the NASA TLX mental demand, temporal demand, effort and overall scores for the take-over task (Figure 6) are interesting as they demonstrate that the difficulty level of an on-going task (the NDRT in this study) can affect the perceived workload of the interrupting task (the take-over task in this study) during a task-switching situation. While it is not entirely clear what gave rise to the observed NDRT difficulty level effects, some possible explanations are provided in what follows.
During the NDRT phase, the NDRT utilized more mental/attentional resources in Hard than Easy as confirmed by the results shown in Figure 5(b). Thus, it is reasonable to think that Hard resulted in faster development of mental fatigue (reduction in mental/attentional resources) than Easy during the NDRT phase, and, at the beginning of the take-over task phase, the mental/attentional resources available for the take-over task were likely to be less for Hard than Easy—admittedly, the prior NDRT task was three-minute long, and it is not entirely certain if the NDRT task duration was long enough to cause significant mental fatigue in either of the two NDRT difficulty levels. Mental fatigue is in general known to negatively impact information processing (Baker et al., 1994; Kato et al., 2009; Meijman, 1997; Sanders & Sanders, 2013; Van der Linden et al., 2003). With no significant differences in the take-over task performance between Hard and Easy, the conjectured differences in the available mental/attentional resources would account for the observed NDRT difficulty level effects on the NASA TLX workload scores for the take-over task (Figure 6). The notion of workload is related to the difference between the amount of resources available within a person and the amount of resources demanded by the task situation (Sanders & McCormick, 1993).
The NDRT difficulty level effects on the NASA TLX workload scores for the take-over task (Figure 6) may also be interpreted in light of previous findings on task switching. In particular, the findings from Wickens et al. (2016) seem useful. The study empirically demonstrated that during voluntary task switching with more than two tasks, more difficult tasks are less likely to switched away from once they are being performed, in addition to being less likely to switched to. Wickens et al. (2016) presented a “cave” metaphor to describe these effects of task difficulty: “Like a cave with a small entrance, a difficult task may be more difficult to enter initially (increasing switch resistance to it), but once inside the cave, it is more challenging to leave, so it results in longer stays. The more difficult on-going task is stickier.” The driver task of the current study in the context of SAE Level 3 conditionally automated driving is different from the experimental task of Wickens et al. (2016) involving voluntary task switching in that the issuance of the ToR required immediately switching to the take-over task. Nonetheless, the concept of the stickiness of a difficult on-going task may still be relevant accounting for the observed NDRT difficulty level effects (Figure 6).
In summary, this experimental study has examined the effects of NDRT touchscreen location and NDRT difficulty level during both the NDRT and take-over phases of SAE Level 3 conditionally automated driving. The study findings will inform the design of NDRT touchscreen interfaces and NDRTs in automated vehicles and address a gap in existing human factors research, which has primarily focused on traditional driving contexts (Cockburn et al., 2018; Crundall et al., 2016; Eren et al., 2018; Feng et al., 2018; Fuller et al., 2008; Grahn & Kujala, 2020; Hagiwara et al., 2013; Kim et al., 2014; Kujala & Saariluoma, 2011; Kujala & Salvucci, 2015; Liu et al., 2022; Patel et al., 2022; Suh & Ferris, 2019; Tao et al., 2018; Xian & Jin, 2015).
The current study results have some implications on the design of NDRT touchscreen interfaces for conditionally automated vehicles. First, the trade-off between the NDRT and the take-over task performance mediated by NDRT touchscreen location seems to represent a challenging design problem. Take-over task performance must be prioritized for obvious safety reasons. At the same time, NDRT task performance must also be considered as NDRTs bring transformative benefits of automated driving, such as increased productivity, enhanced entertainment, reduced stress, and opportunities for social interaction and learning while on the move. The trade-off observed indicates that improving the performance of the two driver tasks simultaneously, solely by optimizing NDRT touchscreen location, may be difficult. Different interface design solutions must be explored to overcome the trade-off. One possible direction for a solution may be creating some attention guidance features, which inform the driver as to where to focus at different time points according to contextual changes. AR technologies may be utilized to develop such attention guidance features. Second, physical demand seems to be an important dimension of the in-vehicle NDRT touchscreen design. Efforts must be made to improve the driver body postures during the driver-touchscreen interaction. Third, the design of NDRTs for conditionally automated vehicles may need to ensure that NDRT difficulty level be within some adequate range. This study showed that an increase in the difficulty level of a touchscreen NDRT could increase the perceived workload of the subsequent take-over task. Further research is warranted to strengthen the empirical evidence base for the NDRT difficulty level effects and determine the permissible range.
Some limitations of the current study are described here along with possible future research directions: first, this study considered only a single time budget for the take-over task (7 seconds). Future investigations may consider different time budgets to see how time budget might modify the effects of NDRT touchscreen location and NDRT difficulty level during conditionally automated driving. Second, this study examined only NDRT touchscreen location among various physical user interface design variables relevant to the NDRT touchscreen interface design (e.g., size and shape). Possible effects of other design variables need to be studied to establish comprehensive NDRT touchscreen design guidelines. Third, the current study recruited only younger drivers as the study participants. Future studies may consider different age bands including the older driver segment, as aging is associated with changes in human abilities (Bhise, 2011; Sanders & McCormick 1993; Wickens et al., 2004). Also, driving experience might be an important personal variable that may modify the effects of NDRT touchscreen location and NDRT difficulty level. Relatedly, Mourant and Rockwell (1972) reported that novice participants sample the road environment more narrowly than experienced participants.
Conclusion
This study demonstrated that in-vehicle NDRT touchscreen location can affect both the visuomanual NDRT and the take-over task performance during SAE Level 3 conditionally automated driving. It further identified a trade-off relationship between the NDRT and the take-over task performance mediated by NDRT touchscreen location. This trade-off seems to represent a challenging design problem that needs to be addressed through innovative display design. The NDRT touchscreen location effects on the performance of the driver tasks were interpreted on the basis of bottom-up attentional processing and the eye gaze behavior data collected in this study were in agreement with the interpretation. This study also showed that NDRT touchscreen location could affect the perceived physical workload of an NDRT. The physical workload of drivers during driver-touchscreen interaction may need to be considered in the design of NDRT touchscreen interfaces. Additionally, this study demonstrated that the difficulty level of an NDRT could affect the perceived workload of the subsequent take-over task during conditionally automated driving. This suggests the possibility that NDRT difficulty level may need to be controlled to ensure the safety of conditionally automated driving.
Key Points
In-vehicle NDRT touchscreen location can affect both the visuomanual NDRT and the take-over task performance during conditionally automated driving. A trade-off between the NDRT and the take-over task performance mediated by NDRT touchscreen location was identified. NDRT touchscreen location can affect the perceived physical workload of an NDRT during conditionally automated driving. The difficulty level of an NDRT may affect the perceived workload of the subsequent take-over task during conditionally automated driving.
Footnotes
Declaration of Conflicting Interests
The author(s) declared no potential conflicts of interest with respect to the research, authorship, and/or publication of this article.
Funding
The author(s) disclosed receipt of the following financial support for the research, authorship, and/or publication of this article: This work was supported by Institute of Information & communications Technology Planning & Evaluation (IITP) grant funded by the Korea government (MSIT) (No. 2022-0-00984, Development of Artificial Intelligence Technology for Personalized Plug-and-Play Explanation and Verification of Explanation).
Author Biographies
Gayoung Ban is currently a PhD student in the Industrial and Systems Engineering at Virginia Tech, USA. She holds a Bachelor of Science degree in psychology from University of Utah, USA, and a Master of Engineering degree in industrial engineering from Seoul National University, South Korea, in 2023.
Woojin Park is a professor in the Industrial Engineering Department at Seoul National University in Seoul, South Korea. He received his PhD in industrial and operations engineering from the University of Michigan, Ann Arbor, in 2003.