
Abstract
Although much research indicates positive safety climate is associated with reduced safety risk, we argue this association is not universal and may even be reversed in some contexts. Specifically, we argue that positive safety climate can be associated with increased safety risk when there is pressure to prioritize production over safety and where workers have some detachment from the consequences of their actions, such as found in engineering design work. We used two indicators of safety risk: use of heuristics at the individual level and design complexity at the design team level. Using experience sampling data (N = 165, 42 design teams, k = 5752 observations), we found design engineers’ perceptions of team positive safety climate were associated with less use of heuristics when engineers were not working to deadlines, but more use of heuristics when engineers were working to deadlines. Independent ratings were obtained of 31 teams’ designs of offshore oil and gas platforms (N = 121). For teams that worked infrequently to deadlines, positive team safety climate was associated with less design complexity. For teams that worked frequently to deadlines, positive team safety climate was associated with more design complexity.
Introduction
Safety climate is a specific facet of social climate in organizations that relates to perceptions of the priority of safety and policies, procedures, practices, systems, management actions, and norms of behaviour that support safety (Flin et al., 2000; Zohar, 2000; Zohar and Luria, 2005). A positive safety climate reflects perceptions that, within a given social group, safe acts are prioritized and organizational processes support safety. A negative safety climate reflects safety as a low priority and organizational processes that do not support, or even conflict with, safety. Meta-analyses have indicated that positive safety climate is usually associated with safety-related outcomes (e.g. lower accident rates, compliance with safety procedures, Beus et al., 2010; Christian et al., 2009; Clarke, 2006, 2010). Rollenhagen (2010) has questioned whether positive safety climate is always related to safer outcomes. Accordingly, we investigate whether there are conditions in which a positive safety climate is associated with actions that may increase, rather than decrease, risks to safety. Thereby, we justify further scrutiny of the contexts within which safety climate has its effects (see Johns, 2006).
Noting that the intensification of work often makes safety goals subservient to production goals (Collinson, 1999; Nichols, 1997), in the present study we examine whether salient production goals (specifically working to deadlines) weaken or even reverse the relationship between safety climate and safety-related outcomes. Furthermore, we focus on a context within which workers are remote from the consequences of their decisions. Contextual factors may activate alternative theoretical mechanisms to those usually associated with certain phenomena (see Pawson and Manzano-Santaella, 2012) through influencing cognitive, social and system-wide processes (see Edwards, 2005; Greasley and Edwards, 2015; Ram et al., 2015). In the present study, we consider intensification and distance from the consequences of decisions to be two contextual features that may act as boundary conditions on the relationship between positive safety climate and reduced safety risk. Identifying boundary conditions illuminates processes through which safety climate may have an influence on safety (see Gray and Cooper, 2010).
We contribute to the literature in two ways. First, we illustrate how to derive research questions that can lead to theoretical refinement by bringing together: (a) notions of the broader context of work (the omnibus context, Johns, 2006) and (b) aspects of the specific and time-varying context (the discrete context, Johns, 2006). Second and more specifically, we question whether received views of how safety climate has its effects need to be supplemented with other theoretical lenses at the individual and group levels and whether research on safety climate needs to take into account ‘tipping’ points in which any beneficial effects of safety climate are eroded or reversed.
Safety climate and safe working
Safety climate is usually construed in respect of personal or co-workers’ safety (Flin et al., 2000). Safety climate can also reflect prioritization of safety for others (e.g. patient safety, Singer et al., 2007). Safety climate can exist at multiple levels, for example at the level of the organization or work team (Zohar and Luria, 2005). In the present study, we focus on safety climate at the team level. For example, positive team safety climate would reflect team members’ perceptions that the team as a whole valued and prioritized safety (Zohar and Luria, 2005). Therefore, safety climate reflects a referent shift model (Chan, 1998) that is comprised of an aggregation of individual perceptions of the social group. Safety climate is thought to influence safety because the extent to which we believe others value certain actions, especially powerful others such as supervisors and senior managers, exerts a strong influence on intentions and motivations to perform those actions (Azjen, 1991; Neal and Griffin, 2006).
In spite of numerous studies demonstrating associations between safety climate and positive safety outcomes (Beus et al., 2010; Christian et al., 2009; Clarke, 2006, 2010), it cannot be assumed that safety climate will influence safety in all contexts. This is because most evidence for the benefits of positive safety climate is derived from situations in which there are direct personal consequences for unsafe actions (e.g. Flin et al., 2000; Flin et al., 2006) or there is close contact with victims of unsafe acts (e.g. other organizational members [Neal and Griffin, 2006; Zohar, 2000] or patients [Hofmann and Mark, 2006]). However, in some jobs (e.g. policy makers, senior managers in large multinationals), workers make decisions concerning others’ safety yet there is a less direct link to personal outcomes for the decision maker, weaker feelings of culpability and no close contact with potential victims. Design engineering is an example of a job in which workers make safety-related decisions yet the decision makers are relatively detached from the consequences of those decisions. We argue that design engineering is a context within which a positive safety climate may not always exert a strong influence on decisions that reduce safety-related risk.
Design engineering, safety climate, time pressures and increased risk
Teams of design engineers are tasked with the design of installations (e.g. offshore oil and gas platforms), facilities (e.g. factories, offices) and products (e.g. medical devices). Complex design engineering decisions requires sustained commitment of cognitive resources, in the form of allocation of attention, effortful and detailed information search, recall and use of complex and multiple pieces of information. Complex design engineering decisions also involve gathering and elaborating relevant knowledge about the likely future behaviour of both those who construct or manufacture the design (henceforth constructors) and end users that operate the design (Dekker, 2005; Konda et al., 1992). However, engineers may not fully understand how constructors and end users behave (Busby and Hibberd, 2002) and there often is little or no contact between engineers and those that bear the safety risks of engineers’ actions (Dekker, 2005; Toole and Gambatese, 2008). This may lead to design engineers building inaccurate or incomplete models of constructors’ and end users’ behaviour, leading to decisions that may increase risk to others and which then may become embedded in the design (Busby and Hibberd, 2002; Sharit, 1997).
With group norms that encourage and support adherence to safety procedures, a positive safety climate represents one way in which design engineers may obtain social cues from other workers on appropriate decisions and safety performance (McLain, 2014). Thus, it might be expected that, in some circumstances, positive safety climate may be associated with design decisions that reduce risk embedded in designs. In particular, because the intellectual nature and complexity of engineering tasks may require greater use of cognitive resources for detailed, deliberative and effortful information processing (Hofmann and Frese, 2011), we expect that in some circumstances positive team safety climate will be associated with social cues that encourage design engineers to direct cognitive resources to processing information about safety. In such circumstances, engineers may work through design problems in a manner that minimizes risk to constructors and end users.
However, design engineers have to make trade-offs between attaining productivity goals (e.g. project completion deadlines) and safety (Flin et al., 2000; Zohar, 2000; Zohar and Luria, 2005). Working to deadlines, in particular, is likely to lead to prioritization and motivation to attain productivity goals (Nichols, 1997; Wallace and Chen, 2006). We expect working to deadlines to be one situation in which positive team safety climate may be associated with a greater incidence of decisions that increase risk in engineering designs. Because deadlines make production targets salient, design engineers direct their attention and other cognitive resources away from safety concerns and toward attaining production targets (e.g. completion of design), thus impeding safety performance (Yechiam and Hochman, 2013). For example, directing cognitive resources to reaching productivity goals may lead to failures or delays in detecting safety related problems in design engineering (Zapf et al., 1992). Furthermore, working to deadlines increases the costs of devoting time to optimizing safety in designs. Therefore, in order to attain productivity goals, working to deadlines may encourage design engineers to take short-cuts in making safety-related decisions (Hofmann and Stetzer, 1996) or devote less effort to searching for safer alternatives (Barton and Sutcliffe, 2009).
The diversion of cognitive resources from safety goals to productivity goals in response to deadlines implies that engineers may make more decisions with potential to increase risk as engineers devote less attention to working through the safety-related implications of their decisions (Hollnagel, 2011). However, we expect that engineers working to deadlines and who perceive that there is a positive team safety climate will make more decisions with potential to increase risk than engineers working to deadlines but who perceive a negative team safety climate. Because engineers’ perceptions of safety climate are based on what others value and prioritize (Zohar and Luria, 2005), safety climate provides cues on how others are expected to behave: where a design engineer perceives a positive team safety climate, design engineers may expect co-workers to prioritize safety goals, thus allowing the design engineer further latitude to prioritize production goals when working to deadlines. Social compensation (Williams and Karau, 1991) provides an explanation for this expectation.
Williams and Karau (1991) advanced the social compensation hypothesis to explain how expectations of group members may influence an individuals’ effort on group tasks. The social compensation hypothesis predicts that people will devote more effort on collective tasks if they expect their co-workers to perform poorly on a task (Williams and Karau, 1991; see also Karau and Williams, 1993). In relation to safety in design engineering, our expectation is that design engineers with salient production goals will engage less effort in processing information about safety when they perceive co-workers as reliable, willing and able to detect and correct safety-related problems embedded in designs: that is when engineers perceive they are working in teams with positive safety climate. Indeed, there is evidence that workers are less likely to voice safety concerns if they believe co-workers to be competent in dealing with safety-related issues (Barton and Sutcliffe, 2009). Furthermore, people have a tendency to overestimate the future incidence of probable events (reliable, willing and able colleagues will attend to safety-related problems) and underestimate the future incidence of improbable events (design error will cause an accident) (Mezias and Starbuck, 2008).
We expect downwards social compensation through engaging less effort to process safety-related information to become manifest only when engineers are working to deadlines. This is because productivity goals become more salient relative to safety goals when working to deadlines (Hofmann and Stetzer, 1996; Wallace and Chen, 2006).
Design engineering involves complex cognitive processes (Dekker, 2005; Konda et al., 1992). Withdraw of effort from complex decision making can involve the use of heuristic processing that provides short-cuts that enable engineers to pay less attention to safety-related issues, to rapidly fill information gaps and make predictions about the behaviour of constructors and end users, and to substitute for detailed working through of engineering problems (Hollnagel, 2011; Milkmann et al., 2009). Heuristics enable rapid and effortless processing of information but are necessarily less accurate than detailed processing of information, are subject to biases, and can potentially ignore or misrepresent critical information for the safe construction or operation of equipment and installations (see Hoffman and Frese, 2011; Medin and Bazerman, 1999; Milkmann et al., 2009). Heuristic processing may be, therefore, considered detrimental for safe engineering design. For example, heuristics that enable assumptions about missing data may be less safe than more time-consuming attempts to obtain accurate and verifiable data. Heuristics are not inherently risky and do not inevitably lead constructors and end users to be exposed to hazards. Rather, heuristic processing can potentially increase risk.
Because deadlines make productivity goals salient, we expect design engineers to divert cognitive resources away from safety-related information (e.g. pay less attention to safety-related information). Directing cognitive resources away from safety-related information, in turn, may lead to heuristic processing that becomes manifest as design decisions that may potentially embed into designs risks to the safety of constructors and end users:
Hypothesis 1: There is an interaction between working to deadlines and design engineers’ perception of safety climate, such that: (a) design engineers use heuristics least frequently when they are not working to deadlines and design engineers perceive positive team safety climate; (b) design engineers use heuristics most frequently when they are working to deadlines and they perceive positive team safety climate.
Our first hypothesis is at the individual level of analysis. It may be possible for similar relationships between safety climate, working to deadlines and risk to hold also at the team level. If homologous relationships are found to operate at individual and team levels of analysis, the breadth of the explanation is enhanced and there is support for a multilevel model that accounts for phenomena at individual and team levels (Klein et al., 1994).
Group polarization may explain how team-level safety climate and working to deadlines interact at a team level to predict risk (Isenberg, 1986). Group polarization occurs when collective decisions and actions become more extreme than individuals’ initial positions following discussions among team members that hold similar views. For example, a group of workers that may be willing to bear moderate risk individually may collectively be prepared to bear high levels of risk following discussion of risk. Group polarization may occur because individuals wish to be seen in a favourable light by the rest of the group, and thus shift their views in the direction perceived to be valued by the group and/or because group discussion exposes individuals to a wider range of arguments in favour of a specific position (Isenberg, 1986).
Exposure to arguments in favour of a position may exert the strongest effects of group polarization (Isenberg, 1986). Zhu (2013) notes that during group discussion, individuals tend to emphasize information and arguments consistent with their own position and that individuals may become more confident in their views if position-consistent arguments prevail. When teams with a positive safety climate have team members that are infrequently working to few deadlines, we would expect that group polarization effects may serve to make collective action by teams with a positive safety climate more cautious. This is because workers will use fewer design heuristics (Hypothesis 1) and engage in more effortful and detailed information processing. Consequently, team members will be frequently exposed to many co-workers’ safety-related justifications for not using design heuristics and instead engaging in careful and deliberative design decision making. In turn, this will shift team members’ intentions toward deliberative decision making and concern for safety. Therefore, collective actions will be consistent with a cautious approach.
However, when teams with a positive safety climate have team members frequently working to deadlines, we would expect collective action to become risky. This is because many designers are frequently using design heuristics (Hypothesis 1) and will make arguments to justify use of heuristics and why it is safe to do so. In turn, other team members may be influenced by the prevalence of such arguments, begin to favour using design heuristics instead of detailed information processing, and therefore collectively leading to group polarization in an apparently risky direction.
We took design complexity as an indicator of safety-related risk at the group-level. Design complexity is an output of collective design team action and designs that are optimized for safety must avoid unnecessary complexity in the processes of construction and operation (Pahl et al., 2007; Rollenhagen, 2010): Complex designs contain risk to constructors and end users because there are more opportunities for unpredicted events and failures to occur (Health and Safety Executive, 2003; Perrow, 1984; Sammarco, 2005; Sharit, 2000). Furthermore, complex operating processes draw attention away from safety concerns (Rollenhagen, 2010). Achieving simplicity in design may be time consuming for at least three reasons. First, the design team has to coordinate individual members to follow detailed procedures to optimize jointly safety as well as other processes to ensure that the equipment and systems can be constructed economically and are able to cope with the operating environment (Pahl et al., 2007). Second, clients may desire the overall design to incorporate innovative technologies with additional functionalities. The incorporation of new technologies without creating complexity may be difficult in practice (Sha, 2001). Third, achieving simplicity in design requires engineers to have in-depth understanding of the design problem and the ability to organize detailed design concepts into coherent super-ordinate categories (Maeda, 2006). In practice, engineers rely on time-consuming and detailed approaches to gain this understanding and develop meaningful categories (Stolterman, 2008). As with heuristic-based design decisions, design complexity does not inevitably lead constructors and end users to be exposed to risk; rather design complexity increases the potential for increased risk:
Hypothesis 2: There is an interaction between team working to deadlines and design team safety climate, such that: (a) design complexity is lowest for teams who work to deadlines infrequently and have positive safety climates, and (b) design complexity is higher for teams who frequently work to deadlines and have positive safety climates.
In relation to John’s (2006) differentiation of omnibus and discrete context, the critical features of the omnibus context are the distance between design engineers and constructors and end users, unclear safety performance standards, and little direct feedback on safety performance. The critical and time-varying feature of the discrete context is the incidence of working to deadlines. For Hypothesis 1, we expect safety climate to influence use of design heuristics through a process of social compensation. For Hypothesis 2, the process is group polarization and the outcome is design complexity.
Method
We used a sample of design engineers working in teams on major construction projects for offshore oil and gas extraction or onshore industrial facilities (e.g. pharmaceuticals factories). We evaluated levels of team safety climate by questionnaire. Subsequently, we assessed working to deadlines and decisions with potential to increase risk using an experience sampling methodology (ESM). We used experience sampling because of the dynamic and experiential nature of the phenomena under study and because design engineers may easily forget when they have made decisions that could have implications for the safety of constructors and end users (Bolger et al., 2003). Design complexity was assessed at the end of design projects by ratings given by two independent engineers with expertise in safety.
Sample and procedure
Participants were design engineers from three separate companies working on designing offshore oil and gas extraction installations (two companies, designing primarily for North Sea installations, one based in the UK and one in the Netherlands) or onshore industrial facilities (one company, based in the UK). These organizations experience strong regulatory, advisory and industry influences on developing positive safety climates. For example, designs require external approval by regulators, and many organizations employ consultants to pre-check designs before seeking regulatory approval. Managers with overall responsibility for health, safety and environment often occupy senior positions and typically are independent of the human resource management function. In the North Sea sector and UK construction, the relevant regulatory and professional bodies publish guidance on establishing positive safety climates. Many of the design engineers have no direct experience working on construction sites or offshore and the design engineers have very little, if any, contact with those that build or operate the installations and facilities. 1
To recruit participants, we first asked senior managers in participating companies for access to design teams working on projects that would be ongoing for some months after data collection had started. We then recruited design engineers by making presentations on the research to design teams. Participants from the offshore sector worked in Aberdeen, London and Dordrecht. Other participants worked in the English Midlands. The sample consisted of 165 design engineers (average age = 42.71 years, standard deviation [SD] = 13.43, 94% male) in 42 teams.
Data were collected using personal digital assistants (PDAs). The PDAs administered questionnaires four times daily over the working week (Monday to Friday). The PDAs’ alarm signalled when the questionnaire was to be completed (10.00 a.m., 12.00 p.m., 2.00 p.m., 4.00 p.m.). Participants were asked to complete the questionnaires over two, three or four separate weeks, depending on the length of the design project the participants’ teams were working on. Participants were asked to complete questionnaires four to seven weeks apart. Some participants were re-assigned to other projects after the first, second or third phases of the study, therefore their data were only available for earlier phases. Participants provided data on 5780 occasions. After accounting for known absences (scheduled leave, etc.), the average compliance rate was 63% (range: 25% to 75%).
In the week preceding the first round of data collection with PDAs, participants completed a questionnaire. The questionnaire assessed team safety climate and demographics. All questionnaires were returned before the start of data collection with PDAs.
Participants’ data were included in the analyses only if two or more responses were available from each team, resulting in the exclusion of 22 participants’ data. Twenty participants provided data on less than 25% of available occasions during the ESM stage of the study. Participants with compliance rates of less than 25% were excluded from the analyses (as recommended by Stone et al., 2003). Comparisons between those included in the final sample and those excluded revealed that: the non-compliant group had less positive safety climate scores than those included and those excluded because of group sizes (p < .01). There were no other differences on questionnaire or ESM variables between those included in the analyses and those excluded (p > .05).
After completion of design projects, we were allowed access to design documentation for 31 out of the 42 design teams (all offshore projects). On the basis of this documentation, we were able to estimate design complexity.
ESM measures
Design heuristics
We assessed the frequency with which participants used heuristics with four items assessing the use of risky protocols in design work (Daniels et al., 2008). Designers were asked to state whether they had used any of these protocols during the previous hour (1 = yes, 0 = no). The items indicate assumptions about how the design will operate. The items were: ‘In the past hour, have you made assumptions about missing pieces of data?’ (potential risk to constructor and end-user safety comes from incorrect or unstated assumptions); ‘In the past hour, have you reused a previous design that has not been updated?’ (potential risk to constructor and end-user safety comes from not adapting design to current build and operating contexts); ‘In the past hour, have you applied solutions that have worked well in the past?’ (potential risk to constructor and end-user safety comes from not adapting solution to current build and operating contexts); and ‘In the past hour, have you added a design feature fit for purpose, but others need to decide if it’s correct?’ (potential risk to constructor and end-user safety comes from others being unaware that the design feature needs to be checked).
It is the potential non-alignment of assumptions with actual build or operating processes that increases the risk of accidents during construction or operation (Busby and Hibberd, 2002; Sharit, 1997). Items were summed to form an index (i.e. formative indicator) of design heuristics.
Working to deadlines
We assessed whether participants were working to deadlines by asking ‘Are you currently working to a strict deadline?’. Participants were given the options of ‘No’, ‘Yes but not imminent’ and ‘Yes – imminent’. Responses were coded into two dummy variables, representing non-imminent and imminent deadlines (0 = no, 1 = yes but not imminent, yes – imminent) and imminent deadlines only (0 = no, 0 = yes but not imminent, 1 = yes – imminent). To calculate a team-level variable for working to deadlines, each dummy variable was averaged over each individual’s observations and then individual averages were averaged for each team. This represents conceptualizing team level working to deadlines as an additive composition model: in additive models, the extent of within-group variability is ‘of no theoretical or operational concern for composing the lower level construct to the higher level construct’ (Chan, 1998: 236).
Questionnaire measure: Team safety climate for design
Team safety climate for design was assessed with five items rated on five-point scales (1 = strongly disagree, 5 = strongly agree). The items were developed to be appropriate to safety climate in design engineering, reflect an orientation to safety in design rather than personal safety and reflect behaviours rather than espoused values (Zohar, 2010). The items were developed to be applicable to the design engineering context from items in other, validated safety climate scales (Cox and Cheyne, 2000; Zohar and Luria, 2005). Participants were asked to rate their design team. The items related to team support for safety (one item: ‘We often give tips to each other to maximize the safety of our designs’), leader support for safety (one item: ‘Our team leader suggests new ways of making our designs safer’), communication (one item: ‘We are strongly encouraged to report unsafe design features) and leader priority for safety (two items: ‘Our team leader shows determination to ensure our designs are safe’ and ‘Our team leader behaves in a way that displays commitment to safe designs’).
Multilevel confirmatory factor analysis indicated a single factor could explain the relationships between the items (Comparative Fit Index = 1.00, Root Mean Square Error of Approximation [RMSEA] = 0.01). All free factor loadings were significant and in the hypothesized direction (within-level loadings, range 0.98 – 1.43, p < .001, between-level loadings range 0.89 – 1.07, p < .06).
Items were summed and divided by five to give a score for individual perceptions of climate. Team averages provided an estimate of team safety climate. At the individual level, the scale had acceptable reliability (α = .81). There was sufficient within-team agreement to justify using an aggregate score to represent team safety climate (Intraclass Correlation Coefficient [ICC]1 = .19; ICC2 = .48; median rwg = .92, .86 and .83 under null distributions with random, slight positive and moderate positive skew, see LeBreton and Senter, 2008).
Design team measures: Design complexity
After completion of the projects, we were allowed access to design documentation for 31 teams working on offshore engineering projects. To evaluate risk embedded in design, an experienced engineer (the second author) specializing in safety in offshore platforms examined the design documentation and rated the complexity of each design. Five items assessed design complexity – the extent to which the design: was novel; required a complex installation method or conversion; was simple (reversed coded); had low inclusion of new equipment onto an existing installation (reversed coded); and included self-contained modules on decks (reversed coded, self-containment limits interactions between different parts of the system).
Items were rated on a seven-point scale (1 = not at all, 7 = very much so). Ratings were made blind to data on safety climate and working to deadlines. The internal consistency was acceptable for the engineer’s ratings (α = .86). A principal components analysis indicated the items could be explained by a single component accounting for 65% of the variance (eigenvalue = 3.25, eigenvalue for second factor = 1.26). A second experienced safety engineer examined the designs from 19 of the 31 teams to establish inter-rater agreement (intra-class correlation = .90). This second engineer was independent of the research team and also blind to data on safety climate and working to deadlines.
Analyses
To examine Hypothesis 1, we used multilevel regression implemented with the HLM-7 program (Raudenbush et al., 2011). We fitted a three-level model to the data, in which hourly responses from participants (level 1) were nested within individuals (level 2), nested within teams (level 3). Because we assessed the frequency with which design engineers used design heuristics, we used multilevel Poisson regression, which is appropriate for such data (Raudenbush et al., 2011). We centred individual perceptions of safety climate at each design team mean for two reasons. By centring at the group mean, we ensured that the analyses do not confound individual level effects as stipulated in Hypothesis 1 with group level effects (Raudenbush and Bryk, 2002). The dummy variables representing working to deadlines were centred at person means to ensure that hourly effects were not confounded by between-person differences in working to deadlines. The interaction stated in Hypothesis 1 was examined by regressing individual perceptions of safety climate on the regression slopes of the working to deadline dummies (Raudenbush and Bryk, 2002). In estimating the model, we allowed the relationships between working to deadlines and design heuristics to vary between teams and individuals and the relationship between perceived safety climate and design heuristics to vary between teams. Doing so meant the analyses were able to account for potential variability between individuals and groups in the relationships between variables. Because we allowed variability in regression coefficients, the regression coefficients reported represent the average across individuals and teams as appropriate. We reported estimates of the variance accounted for in the use of design heuristics and estimates of the variance accounted by perceived safety climate in the regression coefficients of working to deadlines on design heuristics (see Aguinis et al., 2013).
Hypothesis 2 was examined using single-level moderated regression with team level data. Prior to calculating the cross-products of team safety climate and the team average for each working to deadline dummy, variables were standardized (Aiken and West, 1991). We entered variables in three steps. In the first step, we entered the main effects. In the second step, we entered the interaction between the mean of all deadlines for the design team and team-level safety climate. In the third step, we entered the interaction between the mean of imminent deadlines and team-level safety climate. Because design complexity had a bimodal distribution, we used bias-corrected bootstrapping to account for non-normality in estimating the standard errors.
Results
Table 1 shows the means, standard deviations, internal consistencies and correlations. Table 2 shows the results of the multilevel regression analyses that examined Hypothesis 1. The model accounted for an estimated 41% of variance in the use of design heuristics. There was no significant main effect of perceived safety climate on design heuristics (B = 0.12, not significant [NS]). There was a significant main effect of all deadlines on design heuristics in (B = 0.42, p < .01). The relationship between all deadlines and design heuristics was moderated by perceived safety climate (B = 0.33, p < .05). Perceived safety climate explained 30% of the variation in the relationship between all deadlines and design heuristics. An analysis of simple slopes (Preacher et al., 2006) indicated that the slope of deadlines and design heuristics became significant at 0.55 standard deviations below the mean for perceived safety climate (B = 0.22, p = .05). The relationship between deadlines and design heuristics become more positive at more positive values of perceived safety climate. Figure 1 illustrates the form of the interaction.
Means, standard deviations, internal consistencies and correlations.
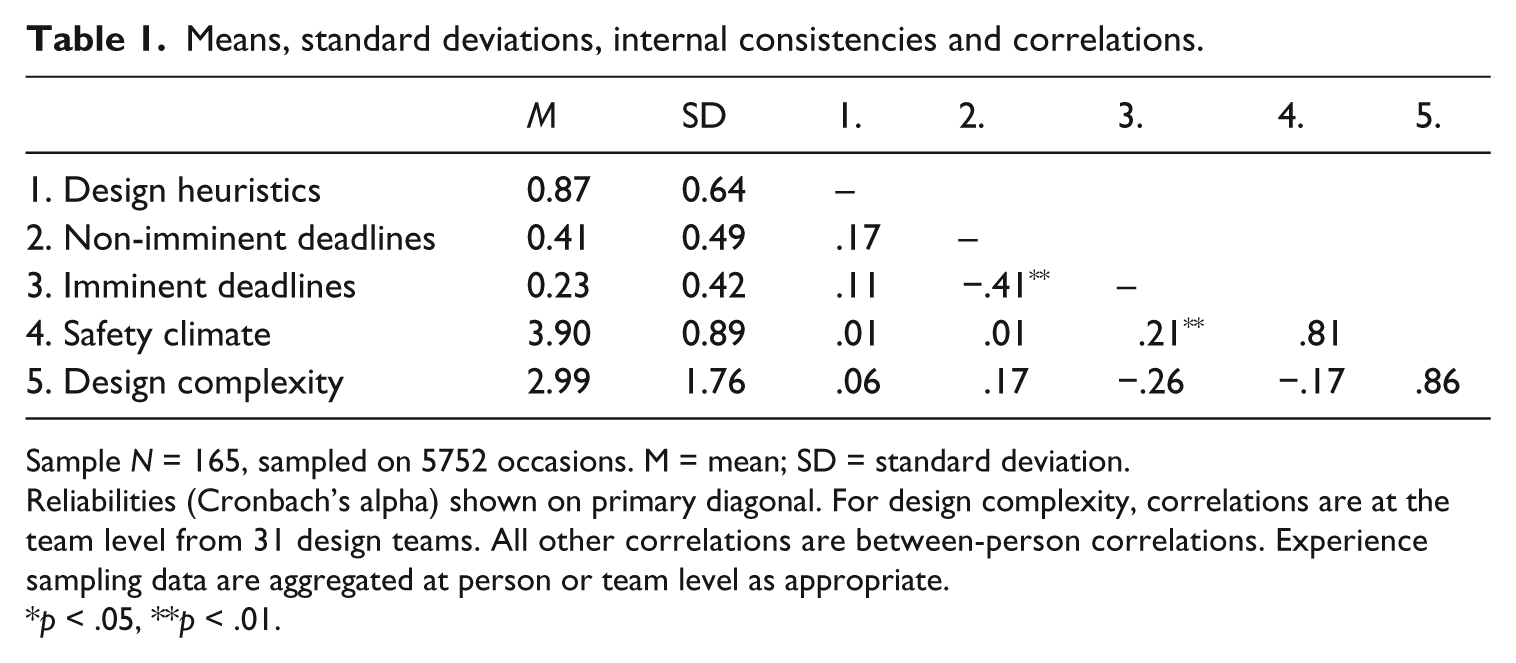
Sample N = 165, sampled on 5752 occasions. M = mean; SD = standard deviation.
Reliabilities (Cronbach’s alpha) shown on primary diagonal. For design complexity, correlations are at the team level from 31 design teams. All other correlations are between-person correlations. Experience sampling data are aggregated at person or team level as appropriate.
p < .05, **p < .01.
Multilevel regression on design heuristics.
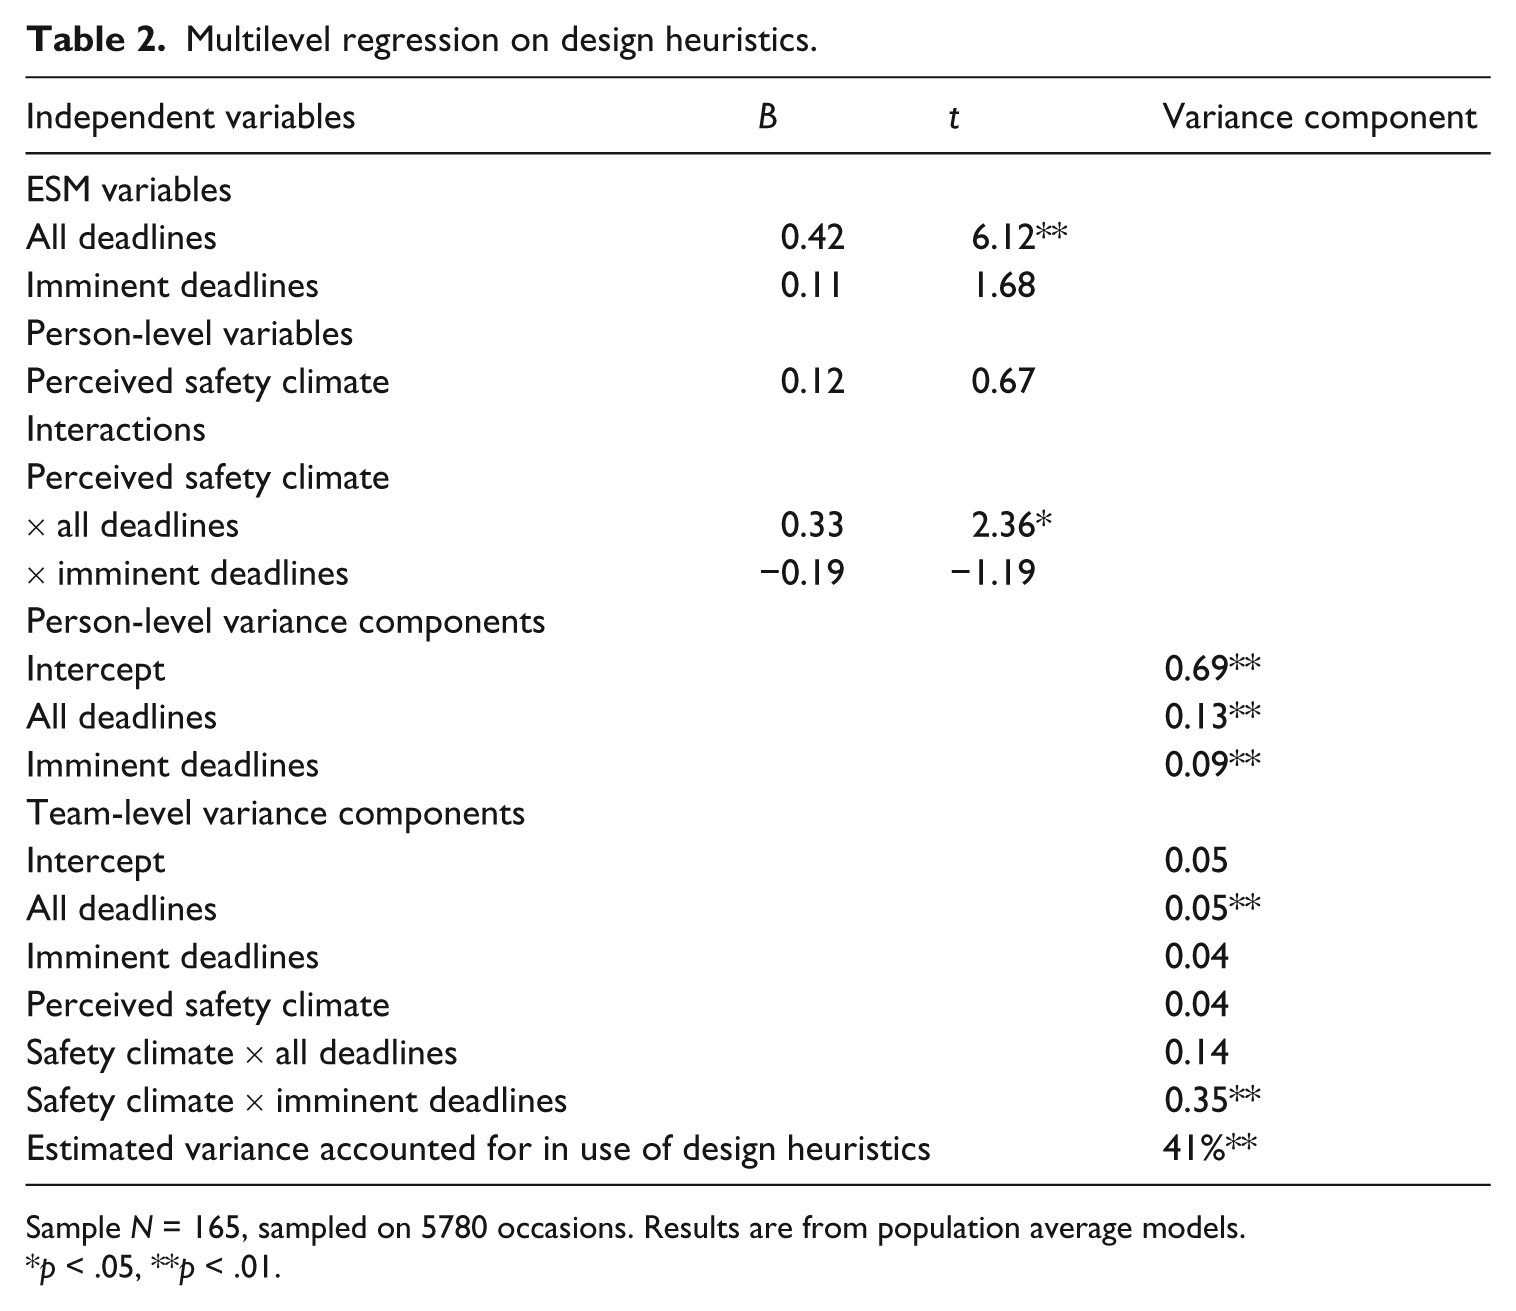
Sample N = 165, sampled on 5780 occasions. Results are from population average models.
p < .05, **p < .01.
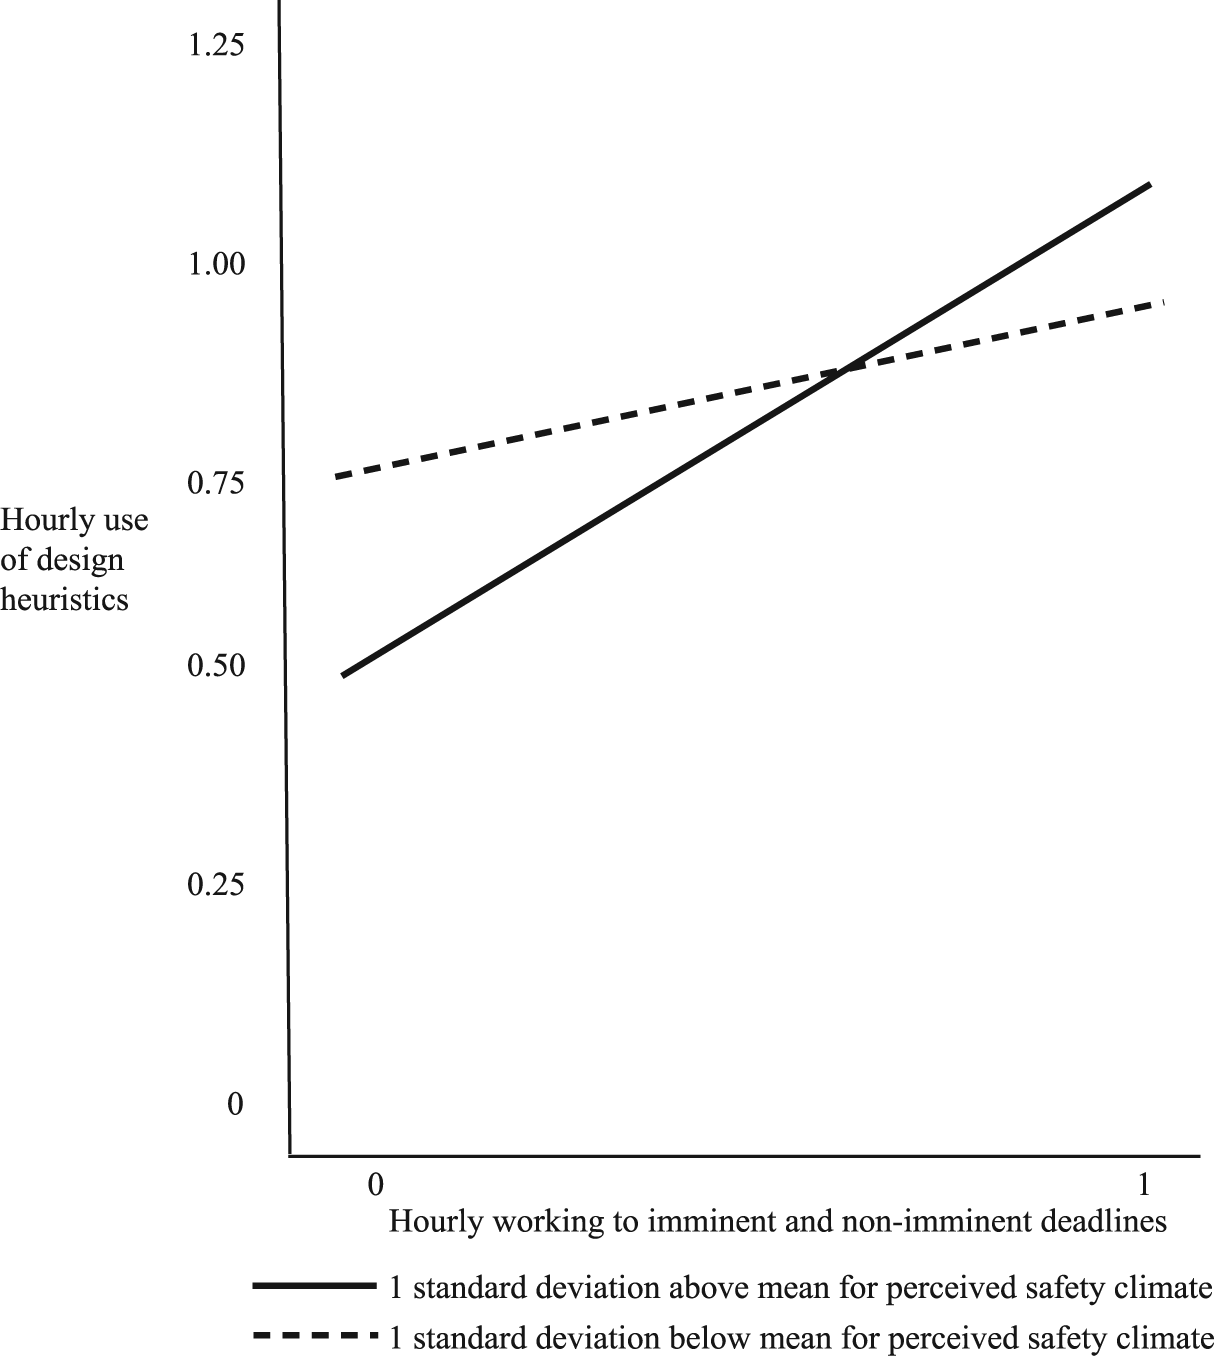
Interaction of between perceived safety climate and hourly deadlines on probability of risky design decisions.
The results are consistent with Hypothesis 1. In any given hour when a design engineer has no deadlines to work to, Figure 1 shows that the design engineer will tend to use fewer design heuristics if the engineer perceives his/her team to have a positive safety climate compared with those engineers who perceive their team to have negative safety climates. Figure 1 also shows that the association between working to deadlines and design heuristics is stronger at higher levels of perceived positive safety climate, with positive perceived safety climate being associated with the greatest use of design heuristics when designers work to deadlines.
There was no relationship between imminent deadlines and design heuristics (B = 0.11, NS). Neither did perceived safety climate moderate this relationship (B = −0.19, NS).
Table 3 shows the moderated regression that examined Hypothesis 2. At Step 2 in the analysis, there was a significant interaction between team safety climate and the mean level of all hourly deadlines in each team (B = 0.60, p < .05). At Step 3, the interactions between team safety climate and mean levels of all deadlines and imminent deadlines were not significant (B = 0.46, B = 0.21, NS). The non-significant results at Step 3 are most likely owing to shared variance between the two interaction terms (r = 0.82, p < .01). Therefore, we calculated simple slopes for the significant interaction at Step 2 (Preacher et al., 2006). Average level of working to all deadlines was positively associated with design complexity at 0.89 standard deviations above the mean for safety climate (B = 0.87, p = .05). There was no association between working to all deadlines and design complexity for any lower values of safety climate. Figure 2 illustrates the form of the interaction. Overall, the form of the interaction indicates that teams with positive safety climates produce less complex designs when teams work to deadlines infrequently, but more complex designs when teams work to deadlines frequently. These results support Hypothesis 2. For teams with negative safety climate, there is no relationship between design complexity and working to deadlines. 2
Regressions on design complexity.
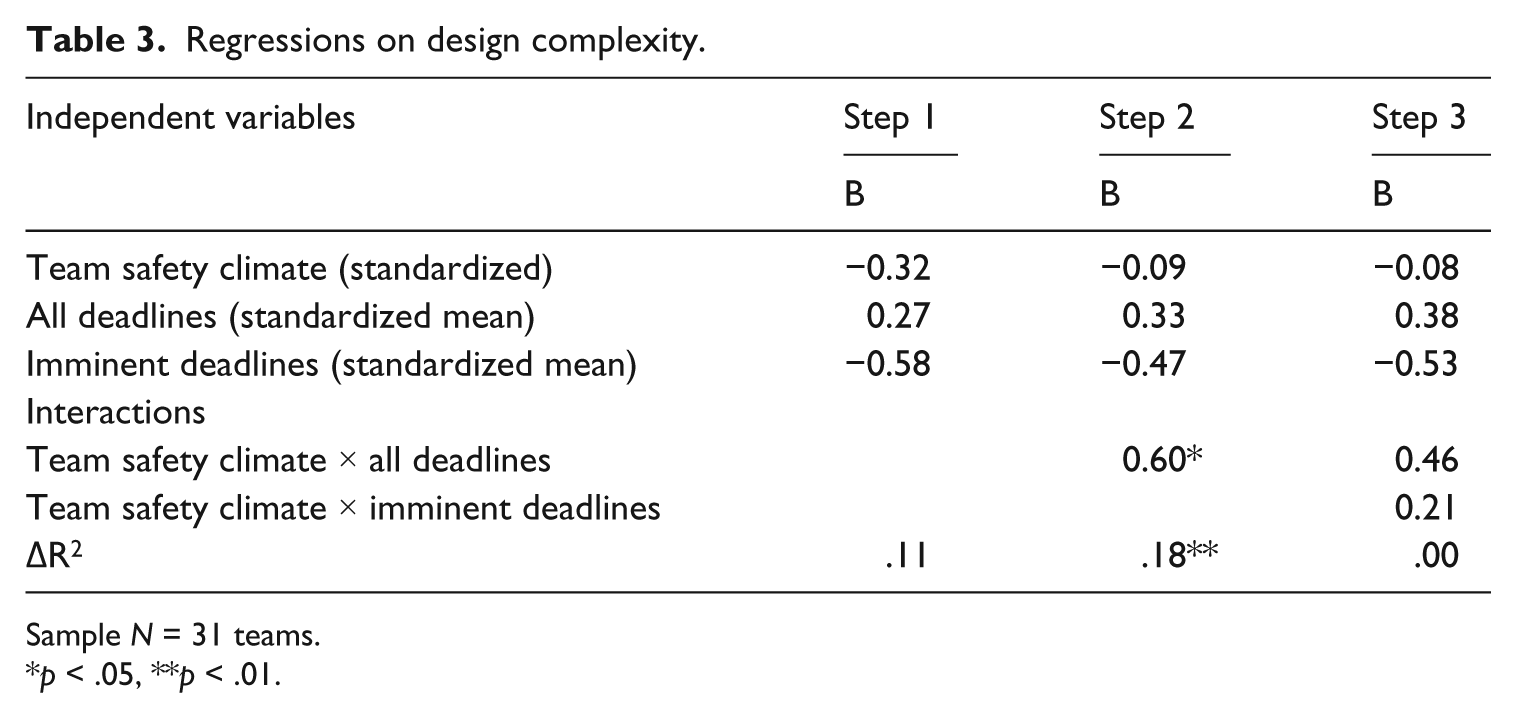
Sample N = 31 teams.
p < .05, **p < .01.
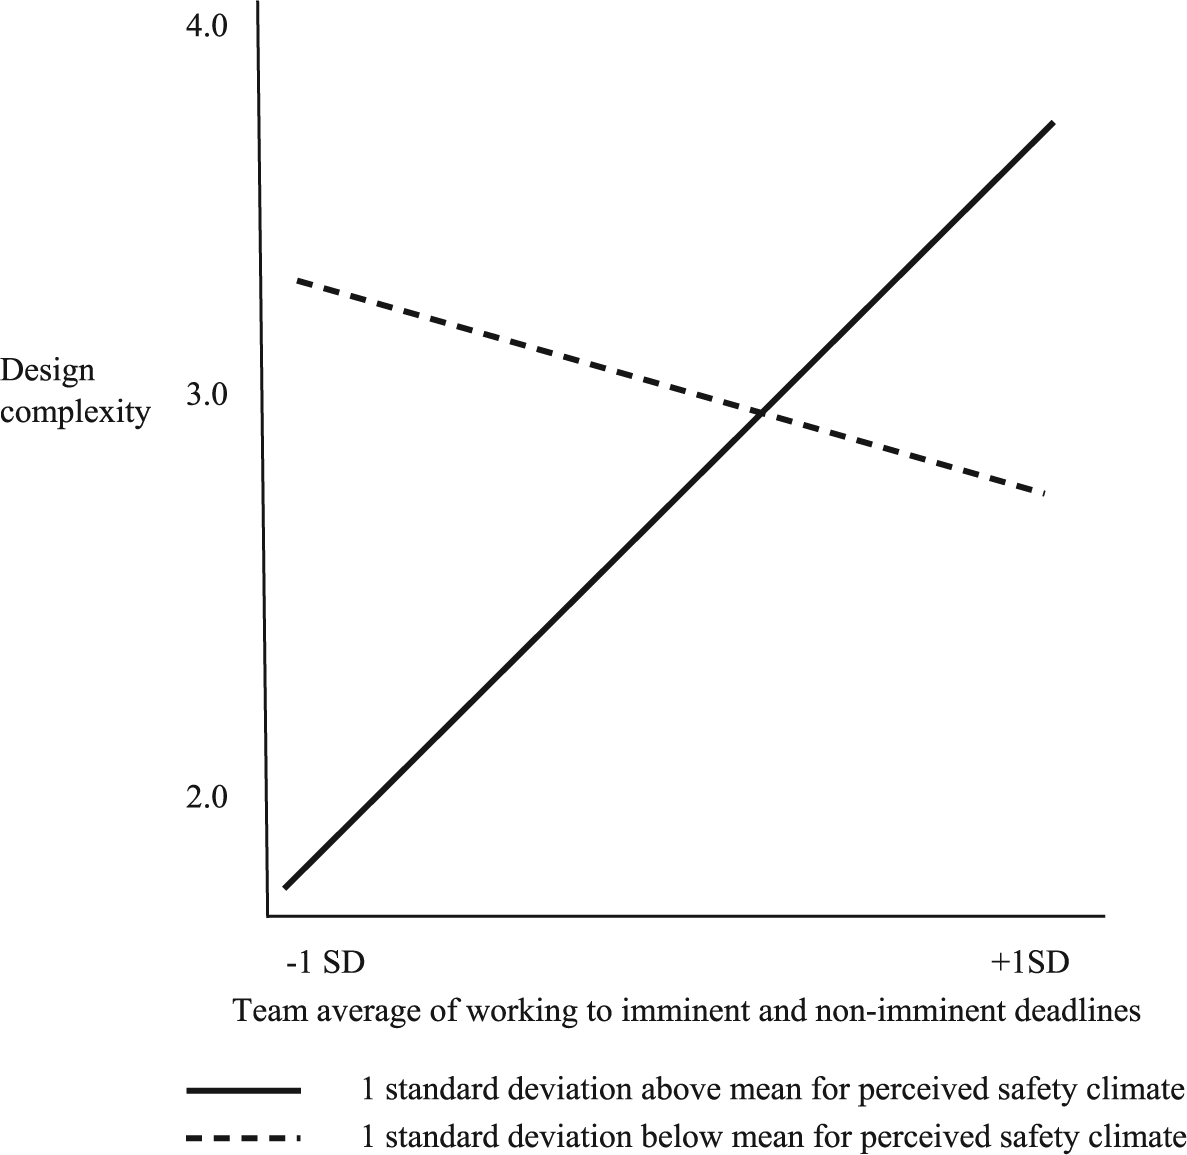
Form of interaction of between team safety climate and hourly deadlines on design complexity.
Discussion
In the present study, we examined design engineers who have responsibility for others’ safety through their decisions, yet do not directly bear the safety-related consequences of their decisions. Investigating this context allowed us to examine circumstances within which potentially safety adverse social and cognitive processes may surface and thus provide a more contextually grounded analysis of positive safety climate, incorporating alternative and contextually specific theoretical mechanisms and outcomes (Edwards, 2005; Pawson and Manzano-Santaella, 2012). In the omnibus context of design engineering (Johns, 2006), we found that working to deadlines could be a discrete and dynamic contextual factor that may activate social compensation processes at the individual level and group polarization processes at the group level leading to elevated risk to constructors and end users through more frequent use of decision heuristics by individual designers (Hypothesis 1) and greater complexity in team designs (Hypothesis 2). As such, in the omnibus context of design work, working to deadlines may be a discrete contextual factor that operates as a tipping point, reversing the relationship between positive safety climate and reduced safety risk to one in which positive safety climate is associated with increased safety risk.
Implications for research
In general terms, the present study suggests that research on safety climate may benefit from paying close attention to a range of theoretical processes that may become activated in different contexts. In the present study, we focused on social psychological processes. The scope of enquiry may be extended to also include cognitive, social or institutional processes.
Evidence indicates that relationships between positive safety climate and safe behaviour to others can be non-linear (Hofmann and Mark, 2006; Katz-Navon et al., 2005; Leroy et al., 2012; Naveh et al., 2005). In some instances, different aspects of positive safety climate and leaders’ positive safety behaviour can be mutually reinforcing to achieve synergistic effects on safety outcomes (Leroy et al., 2012; Naveh et al., 2005). In other circumstances, positive safety climate appears to buffer potentially adverse effects on safety outcomes of complex work (Hoffman and Mark, 2006) and too much or too little detail in safety procedures (Katz-Navon et al., 2005). In the present study, we found that positive safety climate accentuated the relationship between salient production goals and factors that may increase risk to constructors and end users. There may be other factors that add further nuances to our findings.
At the individual level, there are several factors that may serve to alter social compensation effects and may also alter the combined effects of safety climate and production goals on risk. Downwards social compensation may be less likely where there are incentives to perform well (Shepperd, 1993), for tasks that are perceived to be attractive (Zaccaro, 1984), and for individual tasks that are unique and visible (Harkins and Petty, 1982; Karau and Williams, 1993). Therefore, it could be suggested that the following may moderate the interaction between safety climate and production goals on risk: the presence of performance criteria that are clear and unique for each individual and for each team; the visibility of safety performance to others; clear contingencies between safety performance and individual and collective rewards; compatibility of safety contingent rewards with other rewards (see also Mattson et al., 2014); and attractive and intrinsically motivating tasks.
The distance between design engineers on the one hand, and constructors and end users on the other, reduces the perceived impact design engineers have on those that bear the safety-related risk of designers’ decisions (Latané, 1981) and accountability to those that bear the safety-related risk (Sosik et al., 1997). However, workers who identify with those that bear the safety-related consequences of their actions may be less likely to prioritize production goals over safety goals because they have more empathy for those that bear the consequences (Hogg and Terry, 2000): In such a circumstance, we might expect positive safety climate and identification with others jointly to reduce risk (Ford and Tetrick, 2008).
Leadership is a central element of safety climate (Flin et al., 2000) and may often reinforce other elements of safety climate (Leroy et al., 2012; Naveh et al., 2005). However, where team members are dependent on their team leader for safety performance (see Eisenbeiss and Boerner, 2013), then positive safety climate and salient production goals may have a stronger relationship with risk compared with situations in which teams are not dependent on the team leader for safety performance.
Given that time pressures may also prompt the unintentional and unconscious use of decision heuristics (Dutton, 1993), the pattern of responses observed at the individual level in the present study may reflect habitual responses to production goals. Designers in teams with positive safety climate may learn that other team members address safety concerns, therefore taking decisions that have the potential to increase risk may become a habitual response to production goals. Such habits take time to learn (Schneider and Chein, 2003). Therefore, factors such as familiarity with other team members and length of time working with the same team members on different projects may further accentuate the combined effects of safety climate and production goals on risk.
Group polarization can occur where individuals are exposed to novel information consistent with the individuals’ position and where individuals wish to maintain favour with the rest of the group (Isenberg, 1986). Therefore, the group-level relationship between the combination of salient production goals and positive safety climate on risk may be weakened by factors that act against position-consistent information and strong group identities, as may be the case in multidisciplinary teams or where team members are actively encouraged to seek advice from outside of their own team or professional discipline (Tamuz and Lewis, 2008).
One important and discrete factor is the individuals’ moral or ethical beliefs concerning safety. As Rollenhagen (2010) notes, safety climate measures usually do not assess such moral or ethical beliefs. Consequently, any beneficial or adverse effects of safety climate may be secondary to the personal beliefs of workers concerning safety and workers’ latitude to enact those beliefs.
Strengths and limitations
The strengths of the current study are: the relatively large sample size and extended time frame for an ESM study in work settings (Ohly et al., 2010); the use of multiple methods, including independent raters; and examination of multiple levels of analysis.
It may be argued that we did not assess safety outcomes directly, and therefore our results have no bearing on whether positive design team safety climate can have beneficial or adverse effects for constructors and end users. However, it would be virtually impossible and require considerable effort to attribute any incidents or accidents to a single designer’s decision making. Furthermore, incidents or accidents are also reliant on a confluence of adverse conditions to become realized (Reason, 1990) and may become corrected during verification by external regulators or during construction. Even so, we used measures that reflect risk (i.e. increases in the probability of harm rather than harm per se).
Design complexity was our group-level measure of safety-related risk and the complexity of a design may be influenced by requirements of the client, articulated before or during the life of a design project. We believe client requirements are unlikely to confound our results for two reasons. First, for client requirements to confound our results, client requirements to create a complex design would need to influence working to deadlines and safety climate in two separate ways: (a) client requirements would need to simultaneously increase working to deadlines and positive safety climate; (b) client requirements would need to increase negative safety climate. It is unlikely that client requirements would increase two variables in tandem, and at the same time also increase one of those variables in the opposite direction. Second, client requirements to produce complex designs could increase job demands, including working to deadlines. However, the results supporting Hypothesis 2 were replicated in ancillary analyses that controlled for different measures of job demands 2 and Table 1 shows there are no significant zero order relations between working to deadlines and design complexity.
There are potential concerns over the use of single item measures of working to deadlines. In ESM, repeated sampling mitigates against problems of use of single-item measures (Fisher and Lo, 2012). Furthermore, clear item wording and short-time frame for assessment (one hour) is also likely to enhance recall and hence accuracy (Bolger et al., 2003). In addition to neutral wording, two factors are likely to neutralize social desirability biases on the four design decision items: self-administration of the items through PDAs and ethical requirements that the research team informed the participants that their data would be confidential (Tourangeau and Yan, 2007).
Two major questions concern the extent to which our results generalize beyond different operationalizations of safety climate and from design engineering in the construction sector to other sectors where workers have responsibility for the safety of others. Our hypotheses were based on reasoning that safety climate provides cues on how others are expected to behave and so is based on ratings of the extent to which workers believe others in the team value safety (referent shift model). Climate can be operationalized as direct consensus (Chan, 1998), in which team members’ reports of their own values are aggregated. Given referent shift and direct consensus reflect different constructs and have differential relations with outcomes (Wallace et al., in press), it is probable that our results would not generalize to studies that use a direct consensus approach to safety climate. This is because a direct consensus approach may be grounded in the aggregation of personal ethical and moral values concerning the safety of others. However, we do expect that our results would generalize to situations in which safety climate is operationalized as a referent shift and with similar contextual characteristics to the present study; that is, situations characterized by ambiguity concerning individual contributions, unclear safety performance standards and low priority of safety compared with other goals.
Conclusion
One implication of our findings, therefore, is that where decision makers are disconnected from those that bear the safety-related consequences of decisions and are subject to work intensification, improvements in safety climate alone may not be sufficient to minimize risk. Rather the processes that produce work intensification may also need to be addressed. Although the circumstances we investigated may be characterized by remote risks, major disasters have been attributed to design decisions (Kinnersley and Roelen, 2007). Furthermore, we have demonstrated that positive safety climate may have adverse effects on safety-related outcomes at multiple levels of analysis (individual and team). This indicates that potential adverse consequences of positive safety climate may need to be addressed at multiple levels of analysis. Our analyses also indicate that it can be fruitful to consider the wider context of work, the specific context of work and alternative theoretical processes that may operate in different contexts.
Footnotes
Acknowledgements
We would like to acknowledge the support of the UK Engineering and Physical Sciences Research Council (grant number D04863X). We would like to thank Pat Naylor, Stan Schofield, Ed Terry, Paul van den Heuvel, David Williams and Martin Worthington for their participation in various industrial stakeholder steering groups related to this research. For their comments on this paper, we would like to thank Ana Sanz Vergel and Olga Tregaskis.
Funding
This research was supported by funding from the Engineering and Physical Sciences Research Council (grant number D04863X).