



Abstract
The authors study the effect of the minimum wage on the employment outcomes and Social Security claiming of older US workers from 1983 to 2016. The probability of work at or near the minimum wage increases substantially near retirement, and previous researchers and policies suggest that older workers may be particularly vulnerable to any disemployment effects of the minimum wage. Results show no evidence that the minimum wage causes earlier retirements. Instead, estimates suggest that higher minimum wages increase earnings and may have small positive effects on the labor supply of workers in the key ages of 62 to 70. Consistent with increased earnings and delayed retirement, higher minimum wages decrease the number of Social Security beneficiaries and amount of benefits disbursed. The minimum wage appears to increase financial resources for workers near retirement.
In an era of rising inequality and aging populations, the effect of the minimum wage on the labor market for older workers is increasingly important. The minimum wage reduces lower-tail wage inequality, but may do so at the cost of lost employment and earnings to other workers. Rising rates of minimum wage work for workers above age 50, depicted in Figure 1, imply that older workers may be especially vulnerable to any negative effects. Consistent with the possibility of negative effects on older workers, state-level exemptions to the minimum wage for workers over age 65 appeared in the United States until the late 1980s. 1
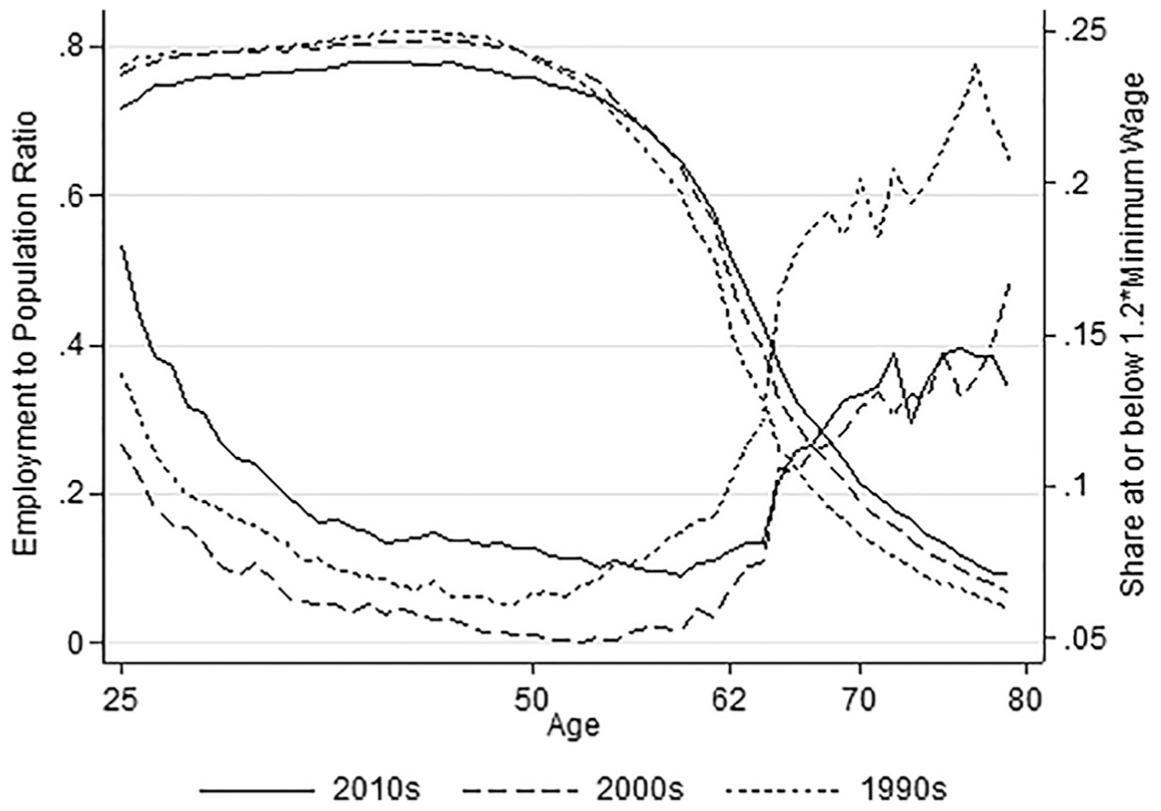
Age Profiles of Employment-to-Population Ratio and Share of Workers Earning at or below 120% of Minimum Wage
In this article, we examine the effect of the minimum wage on retirement in the United States. Our analysis focuses on two common markers of transition to retirement: employment by workers between the ages of 62 to 70, observed in the Current Population Survey (CPS); and receipt of Social Security retirement income, taken from the Social Security Administration’s (SSA) Master Beneficiary File. We apply two methodologies commonly used in the recent minimum wage literature: the canonical state-panel model, and a county border-pairs design when the data permit. Standard specification checks motivate our choice of controls for time-varying heterogeneity, and we investigate the possibility of dynamic responses that appear over longer time spans. To explore the explanations for these effects, we also document the response of earnings, hours, wages, job flows (hires and separations), and sources of retirement income other than Social Security.
In our analysis of employment outcomes for people between the ages of 62 and 70, we find evidence of increased earnings and no disemployment effects. Contrary to the hypothesis that higher minimum wages force earlier retirements, the point estimates suggest that, if anything, higher minimum wages may increase employment rates although these estimates are not statistically significant. For the 1983 to 2016 period, we can rule out negative employment elasticities larger than −0.05 in our preferred specification. Positive effects on employment are more pronounced among wage-and-salary workers, with no detectable response on self-employment. The employment response is larger for men and workers in their mid-60s; estimates for other low-wage groups, such as less educated workers and single women, are of similar magnitude but are less precise. We also find evidence of an increased probability of full-time work, hours worked in the previous week, and weekly earnings. For workers in their late 50s, we find suggestive evidence that the minimum wage depresses hours with no effect on employment or earnings, suggesting a shift to part-time work at a higher minimum wage.
To explore the implications of these findings for public programs and resources in retirement, we next analyze how minimum wages affect Social Security retirement benefit claiming, a novel outcome in the minimum wage literature. Although modern SSA benefit formulas contain few work disincentives, claiming of benefits continues to represent an important marker of withdrawal from the labor force in the United States. In addition, changes in the timing of benefit claiming in response to changes in current income implicitly reflect a need for financial resources, since individuals should otherwise optimize the timing of claiming with respect to life expectancy. This analysis uses 1983 to 2016 SSA data and focuses on retirement benefits drawn through the Old-Age and Survivors Insurance (OASI) program. We find that higher minimum wages are associated with fewer Social Security beneficiaries and corresponding reductions in total benefits paid. Quantitatively, a 10% increase in the minimum wage is associated with a 0.11 to 0.33% reduction in the number of Social Security recipients, with a slightly larger response in benefit payments. For reference, the flow of new recipients of Social Security is approximately 6% of the stock, so this change is equivalent to 1.8 to 5.5% of new beneficiaries shifting the timing of claiming by one year. Similar results are found in both the state-panel model with controls for time-varying heterogeneity and the county border-pairs design. We also find reductions in retirement income from other sources in the 1983 to 2016 CPS. Our findings are consistent with increased labor market income and delayed retirement allowing workers to defer claiming or drawing down retirement income accounts.
In sum, our empirical findings provide little to no support for the hypothesis that the minimum wage pushes workers into early retirement. These findings are consistent with Fang and Gunderson (2009), which found the employment rate of workers over age 50 rose following provincial minimum wage increases between 1993 and 1999 in Canada.
Many previous studies of the minimum wage in the general population found small negative or zero employment elasticities. 2 At least three explanations can rationalize our results with this previous literature. First, many studies of the minimum wage assume a fixed market-level labor supply curve and interpret changes in employment as reductions in labor demand. It is possible, however, that the minimum wage can also affect labor supply behavior (Burdett and Mortensen 1998; Flinn 2006). Workers at or near retirement may have higher labor supply elasticities along both the extensive and intensive margins, particularly when changes in incentives are salient, as with changes in wages (Gelber, Isen, and Song 2016; Gelber, Jones, Sacks, and Song 2017). Substitution effects engaged by a higher minimum wage would push workers toward longer careers, whereas income effects suggest a shift to lower intensive margin labor supply, with an increase or no change in total earnings. These predictions broadly describe our findings. Second, it is well known that the minimum wage can improve the functioning of monopsonistic labor markets characterized by high firm-level labor supply elasticities (Stigler 1946; Brown, Merkl, and Snower 2014). As pointed out by Fang and Gunderson (2009), older workers’ restricted mobility and preferences to work for a local employer are consistent with monopsony power in this labor market. We find no evidence for the dynamic monopsony models in our examination of worker flows but cannot rule out small, statistically undetectable responses. Third, it is possible that the increased employment of older workers substitutes for the employment of other, similar workers. We find suggestive evidence of labor-labor substitution, in that the minimum wage appears to reduce total working hours among workers in their late 50s, the closest substitutes for workers between the ages of 62 and 70. The estimated effects of the minimum wage on employment we report are likely a combination of these three mechanisms.
Patterns in Minimum Wage Work Near Retirement
The effect of the minimum wage on employment in the United States remains a controversial subject, even as minimum wages bind for only a small share of workers—2.7% in 2016 (Bureau of Labor Statistics 2017). One reason for the continued interest in the subject is that the minimum wage is thought to raise pay for low-wage workers earning near-minimum wages, compressing the lower tail of the wage distribution (Grossman 1983; Lee 1999; Autor, Manning, and Smith 2016). For example, spillovers to other workers can occur through relative pay differentials within firms, which may particularly affect tenured (i.e., older) workers. The minimum wage might also affect the employment of older workers above the minimum, if employers expect these workers to experience declining productivity. In most of our summary statistics and discussion, we consider workers earning up to 120% of the minimum wage to be affected to capture these “ripple” effects on other workers in the low wage labor market, and to allow for measurement error. We report the full range of statistics for the share of population, share of employed, and share of total hours at or below the minimum for the 62 to 70 age group in the Online Appendix. The share at or below the minimum is approximately half of the share at or below 120% of the minimum for all three measures throughout the sample period.
Older workers are significantly more likely than the middle aged to work for a wage at or near the minimum, though rates have declined significantly over the past two decades. Figure 1 depicts the 1990, 2000, and 2010 age profiles of the share of workers employed at or near the minimum wage, measured by an hourly wage within 120% of the minimum. We include the age profile of employment for the three decades as well. A U-shaped pattern in minimum wage work appears in all three decades. In the 1990s, rates of minimum wage work among older workers rose markedly after age 50, with a rate close to 20% for workers in their late 60s working for near-minimum wages. In the subsequent two decades, the share of older workers near the minimum shifted to lower levels and later ages. Minimum wages rose again in the 2010s, leading to a small reversal of the trend toward reduced exposure; however, rising retirement ages during this era muted these effects on the share of older workers exposed to the minimum wage. 3 In the time series, the declining share of older workers earning near-minimum wages is associated with rising retirement ages.
Some of the economic reasons older workers may be more likely to work in jobs that pay at or near the minimum wage also imply that their employment may be particularly vulnerable to increases in the minimum. Many economic theories of retirement explain both falling wages and withdrawal from the labor force as responses to decreasing productivity, health limitations, or other types of human capital depreciation. Life-cycle models of human capital investment often feature a period of declining productivity at older ages (Ben-Porath 1967; Rogerson and Wallenius 2009), and theories of decreasing productivity and retirement play a central role in the literature on mandatory retirement (Lazear 1979). An earlier literature in labor economics hypothesized negative effects among older workers in an efficiency wage model because of their inability to increase their productivity in response to increases in the minimum wage (Mincer 1976; United States Minimum Wage Study Commission 1983). 4 If productivity losses lead to lower wages, then classical economic theory predicts a wage floor will cause some older workers to reach the minimum wage and be forced out of the labor force sooner than they would have otherwise chosen. Minimum wages may also increase retirement hazards as a result of changing worker preferences, if a higher minimum wage reduces the availability of flexible low wage jobs. For example, Maestas et al. (2017) and Ameriks et al. (2017) documented older workers’ willingness to trade off wages for other job amenities, such as flexible hours.
The trends toward lower and later-in-life exposure to the minimum wage reflect both changes in the real value of the minimum wage as well as later retirements of workers in the middle of the income distribution. Figure 2 plots the time series of the average real minimum wage (population-weighted across states) and its ratio to the median wage for workers aged 62 to 70 from 1983 to 2016. The real minimum wage exhibits a sawtooth pattern, with periodic increases to nominal minimum wages eroded by inflation. The real value of the minimum wage gradually declined during the decade preceding the Great Recession, before federal legislation raised minimum wages to levels last seen in the early 1980s. By contrast, the minimum-to-median wage ratio shows a pattern of steady deterioration, which was slowed, but not reversed, by recent increases. Between 1990 and 2000, the minimum wage was approximately half of the median wage. That figure has fallen to below 40% in recent years and remains at this low level. Recent reforms have proposed raising the minimum wage to real levels above those of the 1980s. For example, a $15 minimum wage would expose 35% of workers over age 65 to near minimum wages.
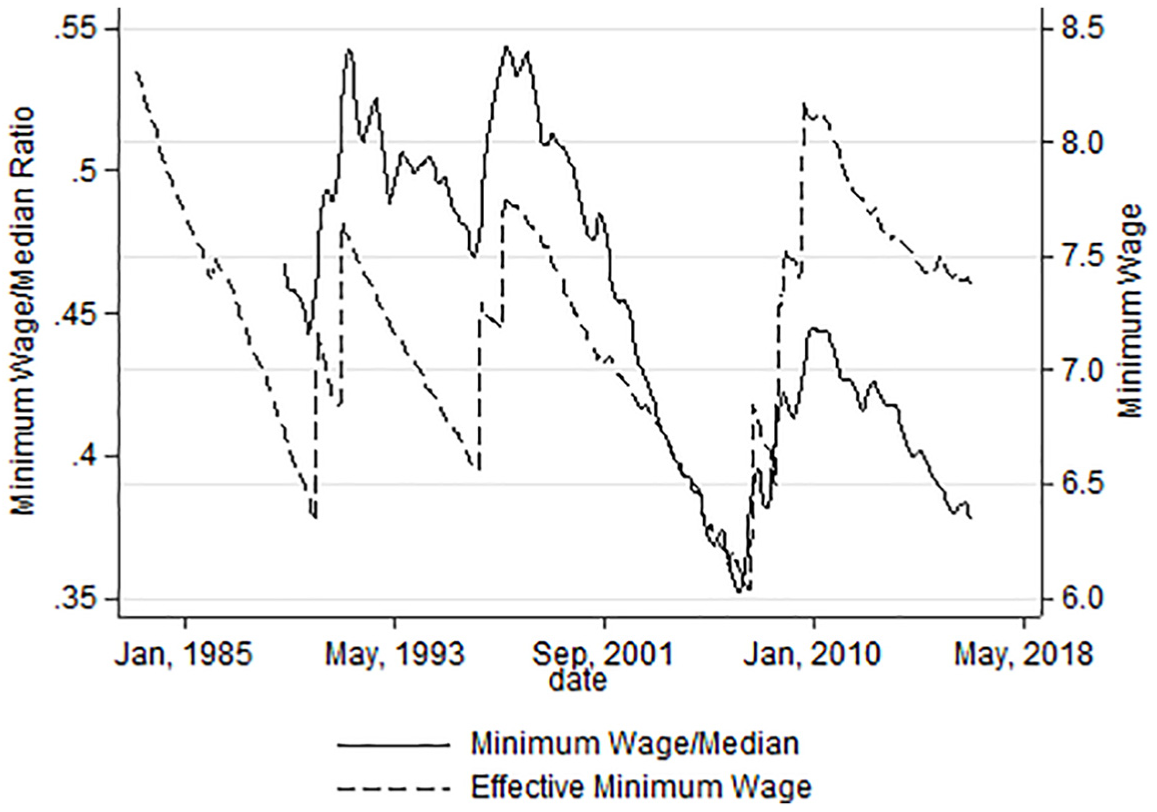
Trend of Real Minimum Wage and Minimum-to-Median Ratio
Data and Descriptive Statistics
Our primary analysis focuses on the impact of the minimum wage on employment outcomes, with outcome variables obtained from the basic monthly data of the CPS (1983–2016) of the Integrated Public Use Microdata Series (IPUMS) (Flood, King, Ruggles, and Warren 2015). The individual-level CPS data provide the most flexibility, allowing estimation of the full model at the monthly or quarterly level, with outcomes disaggregated by age, education, race, and other characteristics. Data on state-level minimum wages are taken from the Bureau of Labor Statistics’ Historical Minimum Wages webpage. 5
Because the key explanatory variable, the level of the minimum wage, varies only by state and time, we group the individual CPS data into cells by state, quarters, and age for our main analysis. The CPS sampling weights are utilized when collapsing the data. We limit the samples to individuals aged 25 through 70, focusing primarily on the workers between the usual retirement ages of 62 through 70 and the near-retirement ages of 50 through 61. We use 62 as the lower bound of our retirement-age group, since Social Security early retirement benefits are first available at age 62, and retirements measured by exit from the labor force increase sharply at this age. Incentives for later claiming turn off at age 70, and only 10 to 15% of workers remain in the labor force past this age.
Wage and income variables are constructed from the wage-and-salary employed only (CPS does not report earnings of the self-employed), for which we multiply top-coded values by 1.5 (as in Autor et al. 2016). Hourly wages for workers who are not paid by the hour are calculated by dividing weekly earnings by the hours worked during the past week.
We obtain the retirement data from the SSA’s annual publications of Old-Age, Survivors, and Disability Insurance (OASDI) Beneficiaries Statistics. The data are derived from the Master Beneficiary Record, which is the principal administrative file of Social Security beneficiaries. We specifically focus on the county-level number of claimants of retirement (OASI) benefits and the total benefits paid out to them. In the Online Appendix, we additionally utilize the Annual Social and Economic Supplement (ASEC) of the CPS to obtain individual-level information on Social Security income and other retirement income.
Descriptive statistics of the CPS data from 1983 to 2016 are presented in Table 1. The retirement age group (62 to 70) has a significantly lower employment-to-population ratio compared to the near-retirement age group (50 to 61) and the younger group (25 to 49). A high proportion of employed workers near the retirement age is self-employed; approximately 30% are identified as self-employed in our CPS sample. Furthermore, the retirement age group has lower hourly wages and weekly earnings than the near-retirement age group, but higher hourly wages than the younger group. Perhaps not surprisingly, the retirement age group has the largest amount of Social Security income and other retirement income. 6 Minimum wage work at older ages is more common for women, the less educated, and blacks and Hispanics compared to white non-Hispanics.
Summary Statistics
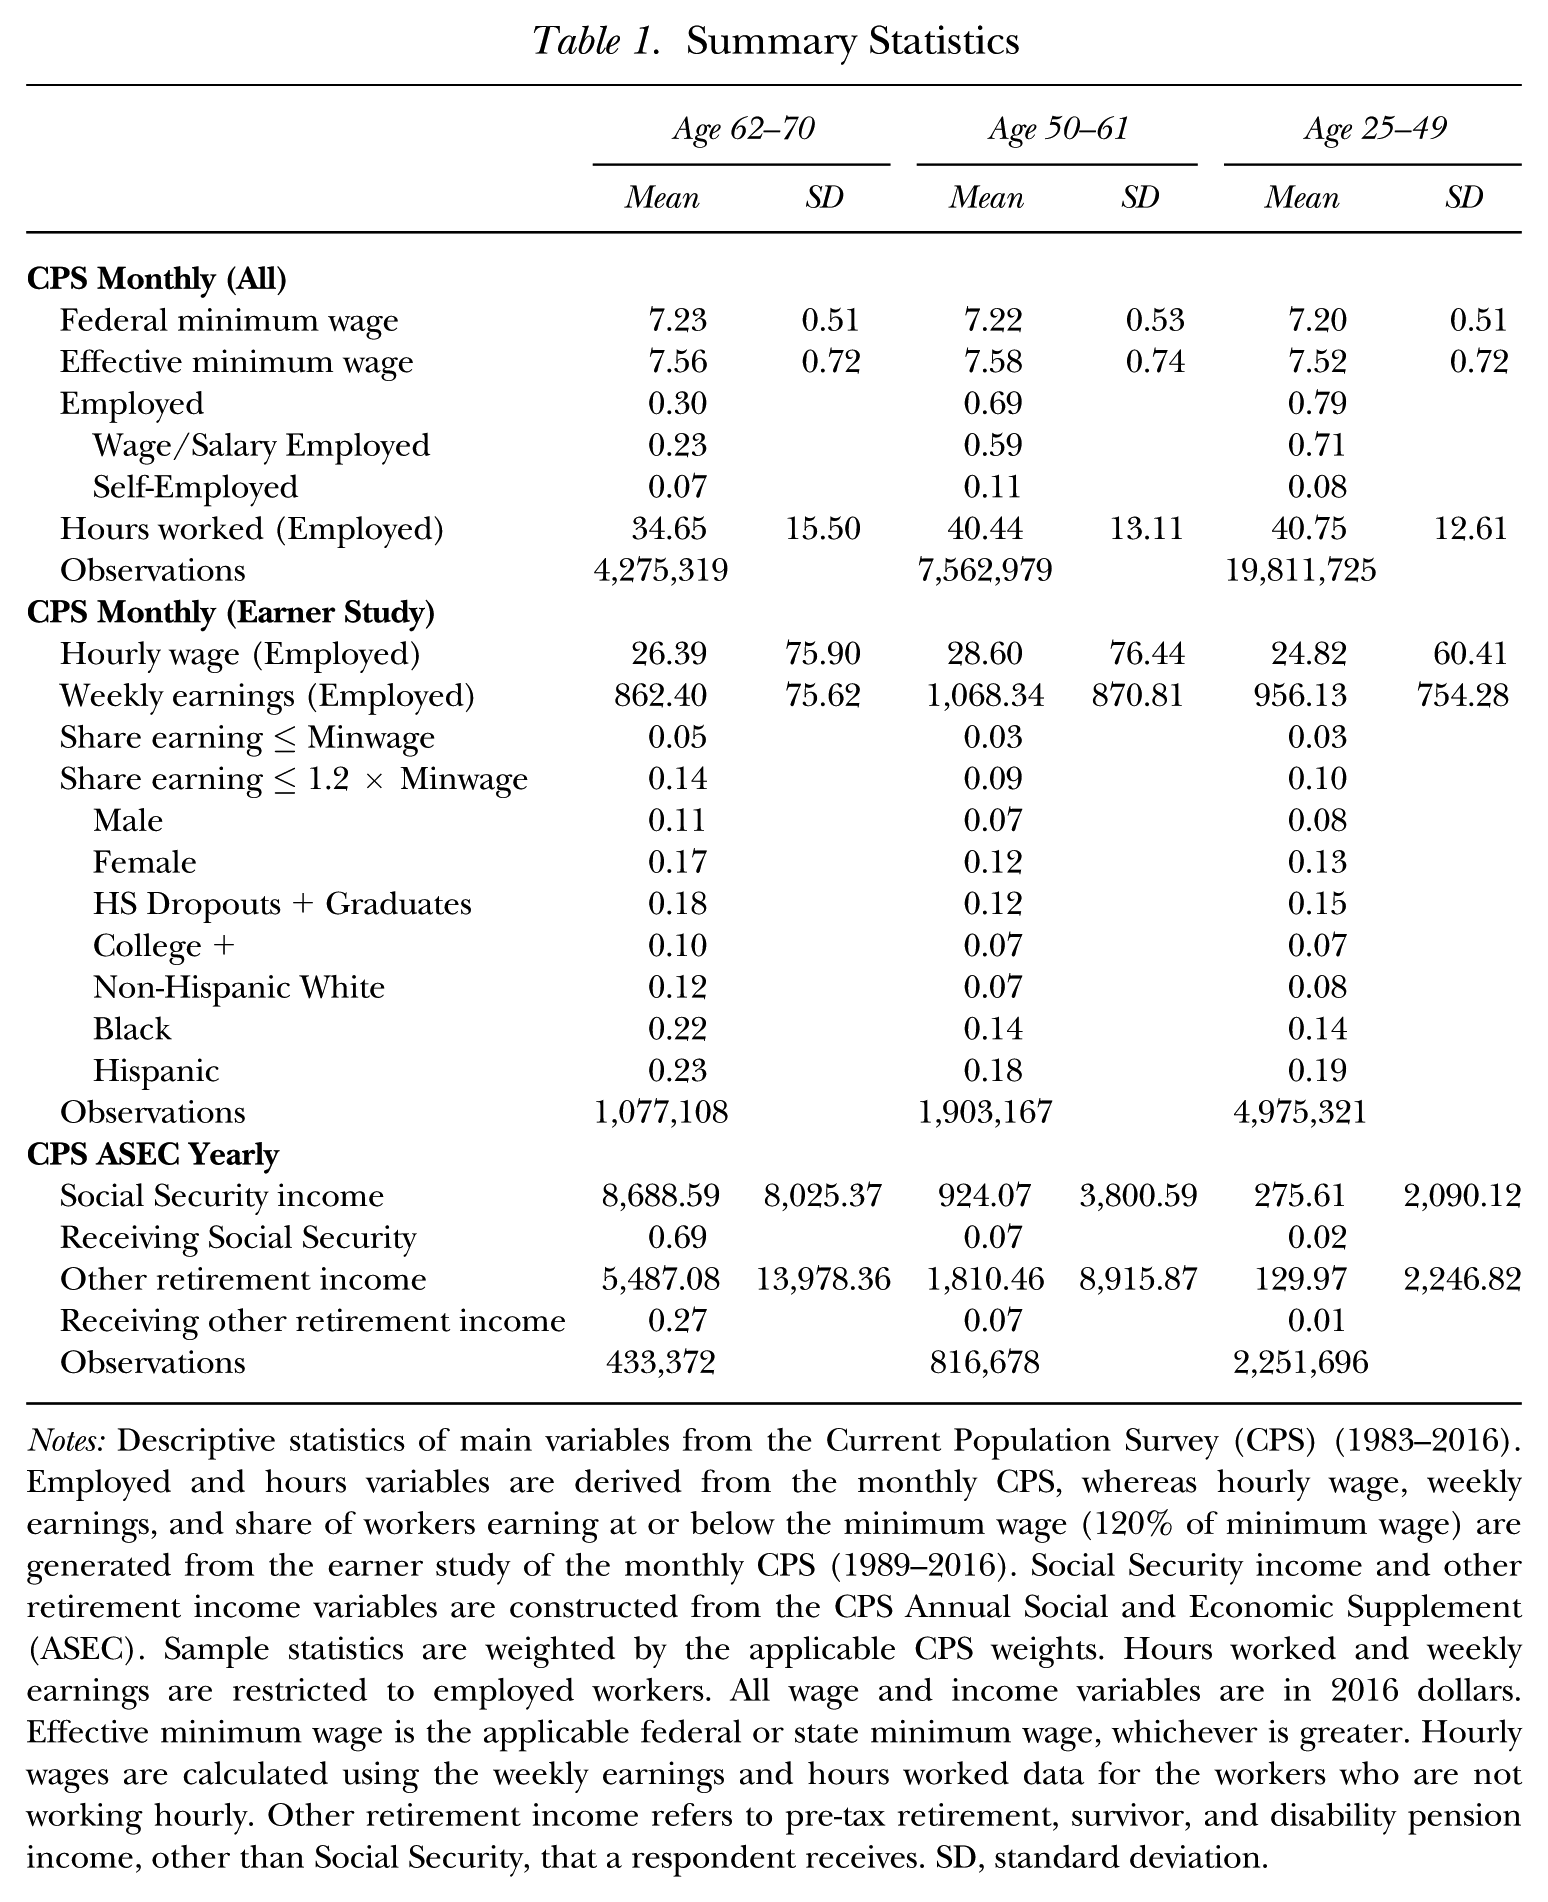
Notes: Descriptive statistics of main variables from the Current Population Survey (CPS) (1983–2016). Employed and hours variables are derived from the monthly CPS, whereas hourly wage, weekly earnings, and share of workers earning at or below the minimum wage (120% of minimum wage) are generated from the earner study of the monthly CPS (1989–2016). Social Security income and other retirement income variables are constructed from the CPS Annual Social and Economic Supplement (ASEC). Sample statistics are weighted by the applicable CPS weights. Hours worked and weekly earnings are restricted to employed workers. All wage and income variables are in 2016 dollars. Effective minimum wage is the applicable federal or state minimum wage, whichever is greater. Hourly wages are calculated using the weekly earnings and hours worked data for the workers who are not working hourly. Other retirement income refers to pre-tax retirement, survivor, and disability pension income, other than Social Security, that a respondent receives. SD, standard deviation.
Empirical Strategy
We conduct closely related analyses in the CPS and SSA data. Following Card and Krueger (1995), Neumark et al. (2014), and Allegretto, Dube, Reich, and Zipperer (2017), we estimate variations of the following panel data model:

where a indexes age, s indexes geographic unit (state), and t indexes time (year-quarter).
7
The unit of observation for the CPS data is age/state/time cells, and each cell is weighted by the number of observations. The variable of interest is the log of effective minimum wages in state s at time t,
Identification in this model depends on the conditional independence of state minimum wage laws and the employment outcomes of older workers. As mentioned above, previous work has questioned this assumption for other groups and has suggested that researchers should include controls for either or both trends in state employment and interactions of the time period with sub-national geographic aggregations, such as US Census region or division. Thus, we include both division × age × time and state linear trends in our preferred specifications:

where d indexes census divisions, and
We next allow the coefficients of the minimum wage, β, to vary across age groups. We do this because we are interested in which particular age groups are affected the most by the changes in the minimum wage. Based on Equation (2), the estimating equation is

where we fully interact age group dummies,
For the Social Security analysis, we make use of aggregated county-level data, though the SSA data are available only at an annual frequency and do not contain information on age. We focus on the number of retirement beneficiaries and the total amount of benefits since they are closely related to retirement decision of older workers. We run both state-panel models consistent with the CPS analysis (Equation (2)) and the county border-pairs specifications (Dube et al. 2010; Aaronson, French, Sorkin, and To 2018). To implement the county border-pair, we drop all non-border counties and add fixed effects for border pairs by time. Following Kroft, Lalibertie, Leal-Vizcaino, and Notowidigdo (2017), we weight counties by population and the inverse of appearances in the sample, since the same county can pair with multiple other counties. Standard errors are two-way clustered at the state and pair level (Dube et al. 2010; Cameron, Gelbach, and Miller 2011). The county border-pair design has the advantage of controlling for local economic conditions at the county level, greatly reducing the concern that minimum wage reforms are confounded with broader changes in economic conditions. We can also compare the estimates from the state-panel model to estimates with the county border-pairs design to assess potential biases in the CPS analysis.
Choosing the Right Specification
To inform the selection of our empirical model, we conduct tests of pre-existing trends in a basic state-year panel specification and the heterogeneous time effects model. The presence of pre-existing trends indicates that the estimated coefficients are likely to be biased. Formally, we estimate the following equation as in Dube et al. (2010):

where
We report results for Equation (4) in Table 2. We find some evidence of pre-trends in the canonical common time effects model for retirement-related outcomes, particularly when the dependent variables are hours and weekly earnings (columns (7) and (9)). Statistically significant estimates of
Pre-Existing Trends in Employment and Earnings
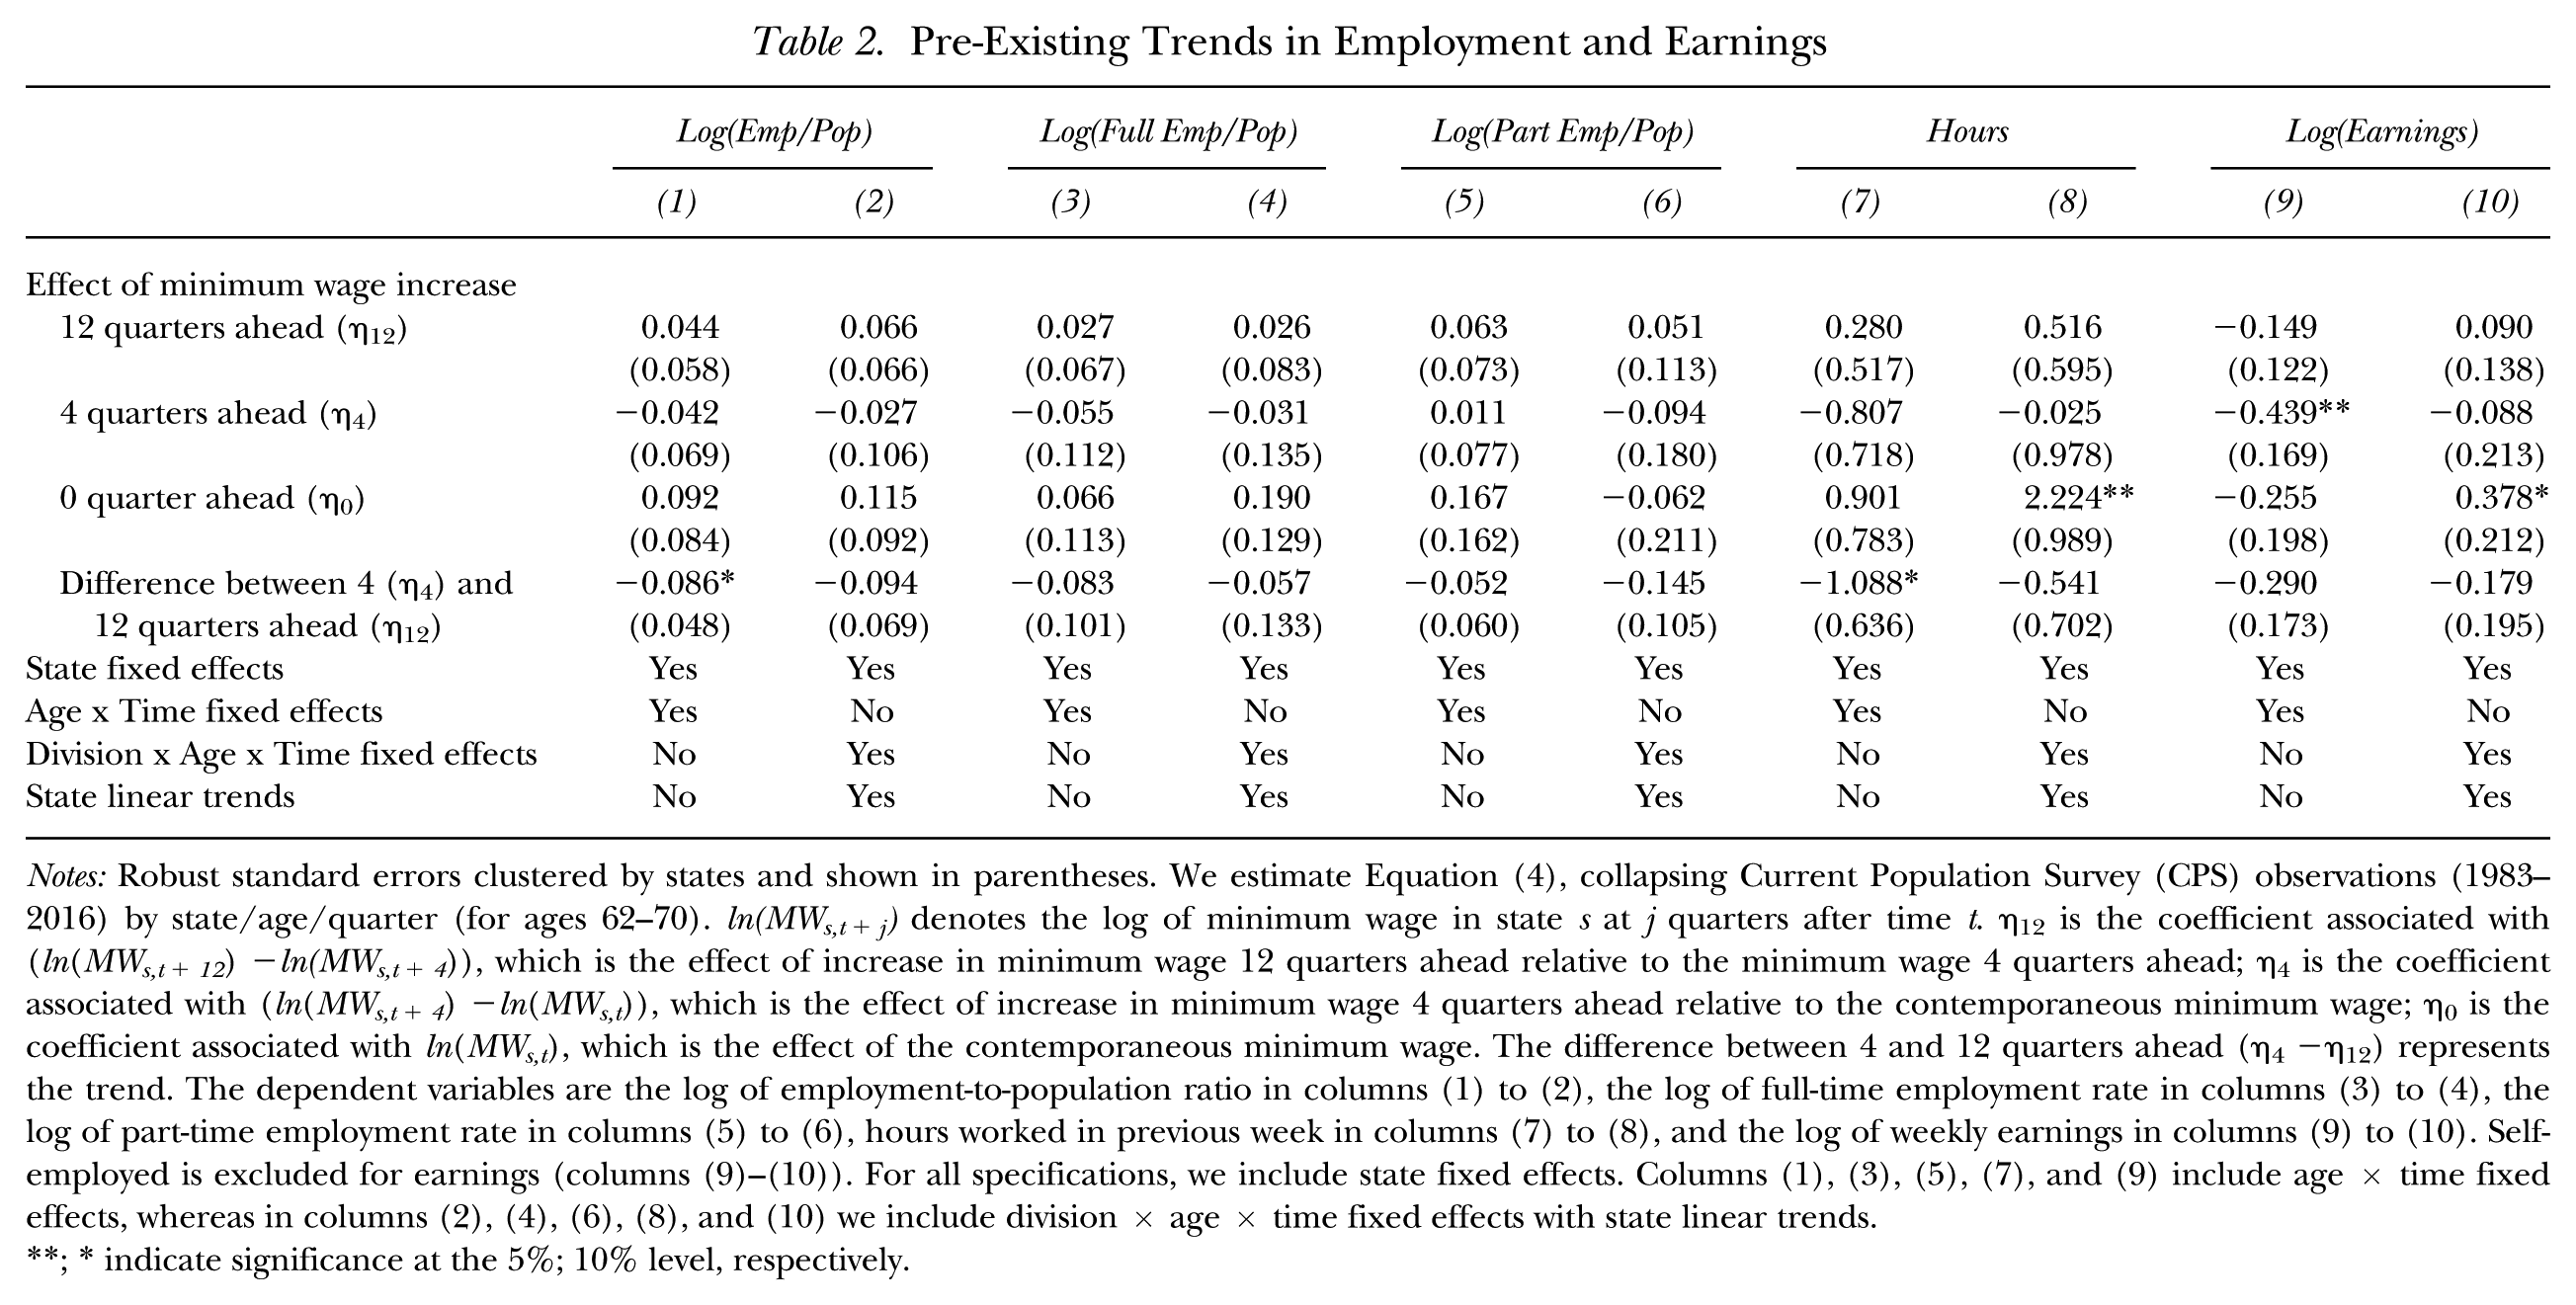
Notes: Robust standard errors clustered by states and shown in parentheses. We estimate Equation (4), collapsing Current Population Survey (CPS) observations (1983–2016) by state/age/quarter (for ages 62–70). ln(MWs,t+j) denotes the log of minimum wage in state s at j quarters after time t. η12 is the coefficient associated with (ln(MWs,t+12) −ln(MWs,t+4)), which is the effect of increase in minimum wage 12 quarters ahead relative to the minimum wage 4 quarters ahead; η4 is the coefficient associated with (ln(MWs,t+4) −ln(MWs,t)), which is the effect of increase in minimum wage 4 quarters ahead relative to the contemporaneous minimum wage; η0 is the coefficient associated with ln(MWs,t), which is the effect of the contemporaneous minimum wage. The difference between 4 and 12 quarters ahead (η4−η12) represents the trend. The dependent variables are the log of employment-to-population ratio in columns (1) to (2), the log of full-time employment rate in columns (3) to (4), the log of part-time employment rate in columns (5) to (6), hours worked in previous week in columns (7) to (8), and the log of weekly earnings in columns (9) to (10). Self-employed is excluded for earnings (columns (9)–(10)). For all specifications, we include state fixed effects. Columns (1), (3), (5), (7), and (9) include age × time fixed effects, whereas in columns (2), (4), (6), (8), and (10) we include division × age × time fixed effects with state linear trends.
indicate significance at the 5%; 10% level, respectively.
Although the pre-trend analysis suggests we require more than just state and year effects as controls, previous researchers have cautioned that the inclusion of overly flexible time-varying controls may absorb the variation necessary to estimate the effects of interest. State linear trends may be particularly problematic if effects of the minimum wage appear slowly over time. To address these concerns, we report results for models which sequentially add controls, allowing direct assessment of alternative specifications. We also replicate the main empirical analysis of Meer and West (2016), which allows for effects that appear over longer time spans than in a standard panel setup. To preview the results, we find that estimates in our setting are not very sensitive to these methodological issues.
Effects of the Minimum Wage on Older Workers
Employment, Hours, and Earnings
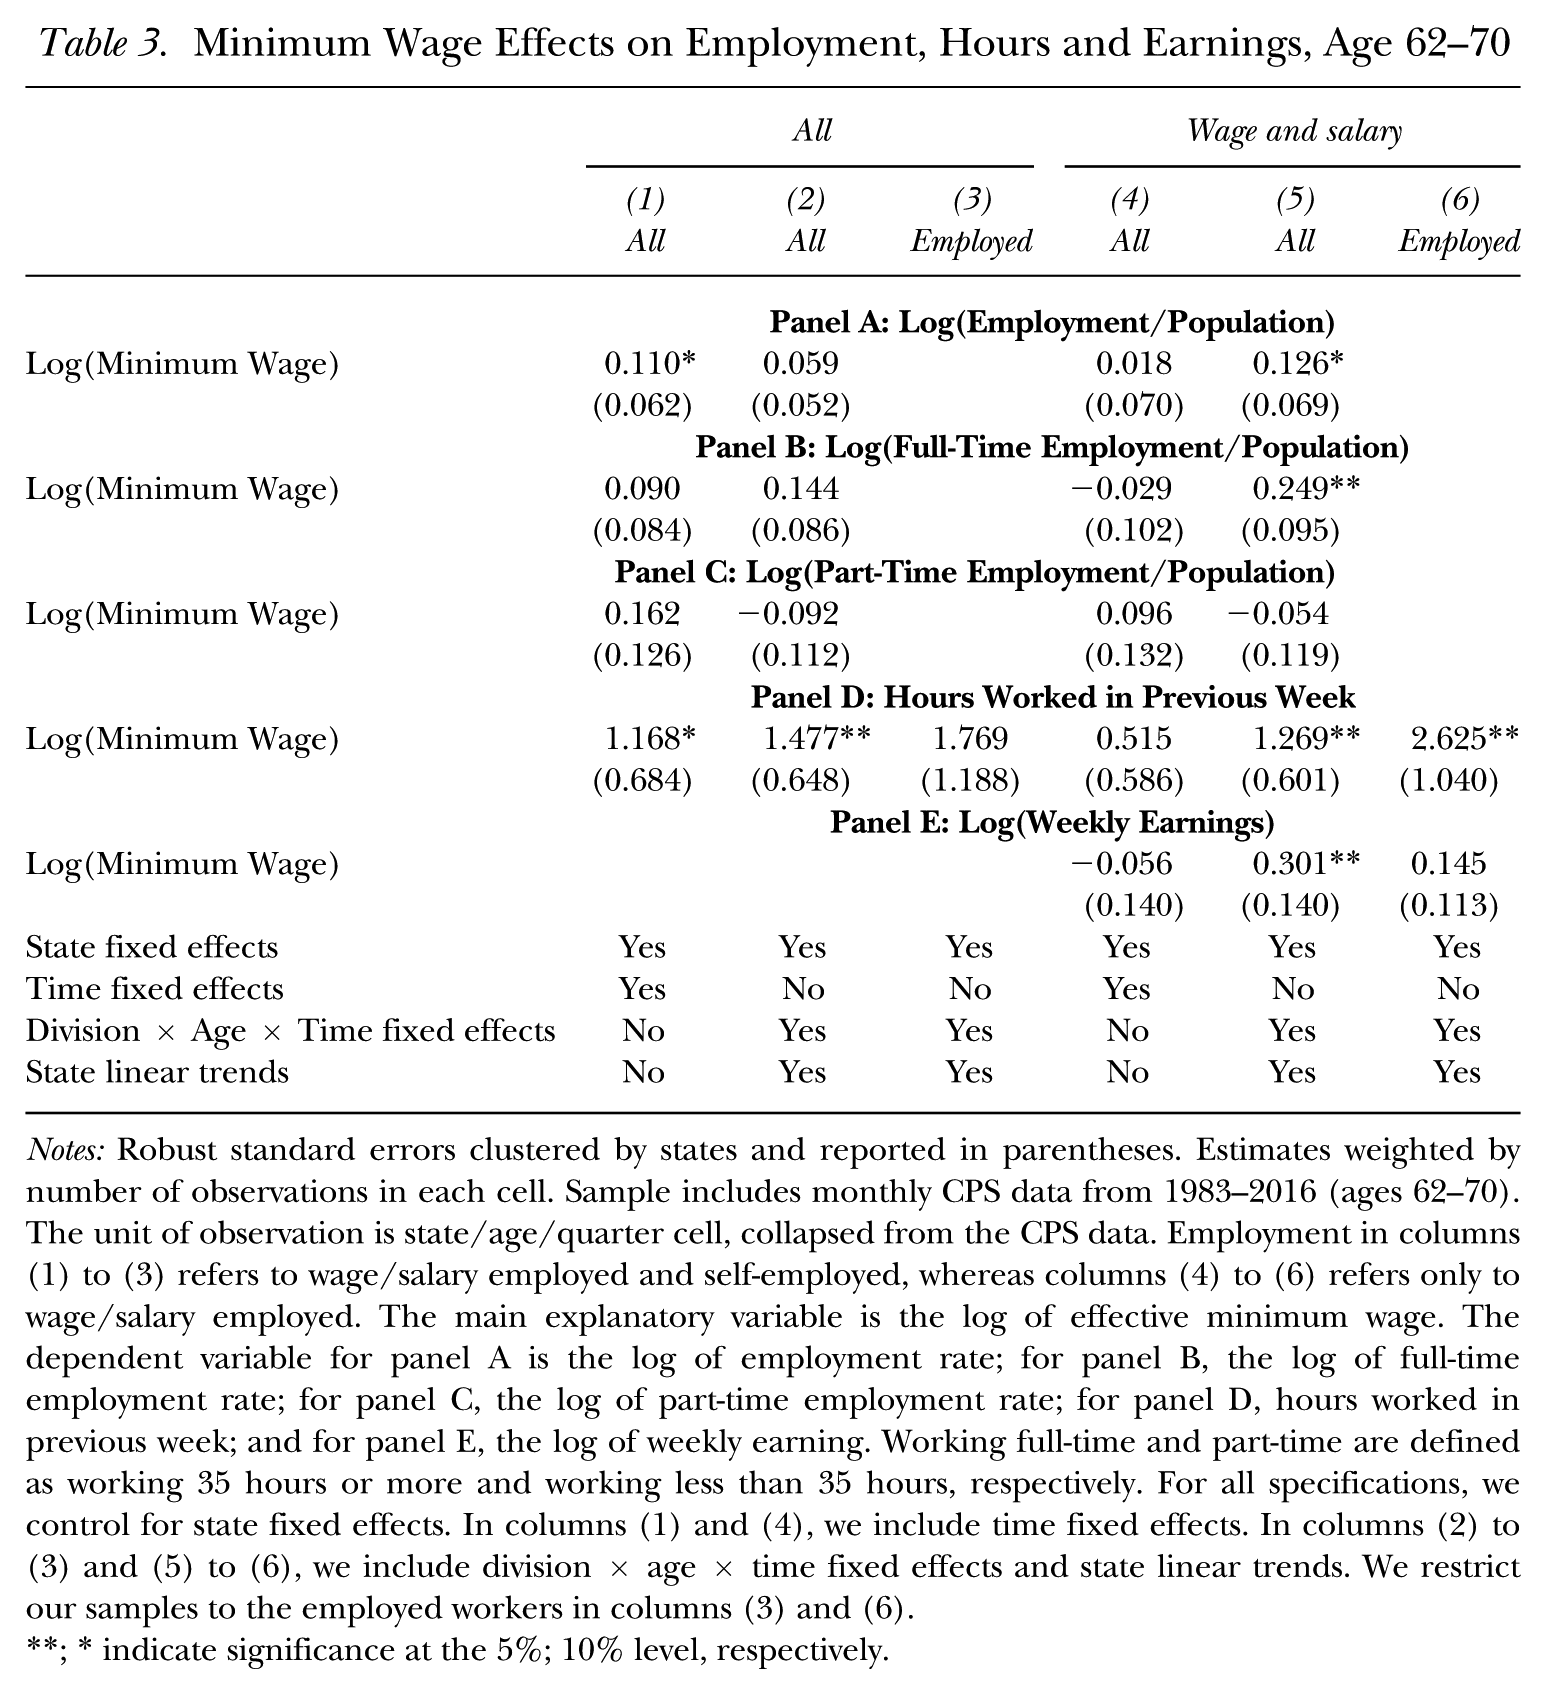
Table 3 reports the effects of the minimum wage on labor market outcomes of older workers, aged 62 to 70, for which we estimate Equations (1) and (2) using the CPS. The labor market outcomes are the log of employment-to-population ratio (panel A), the probability of full-time (using a 35-hour cutoff, panel B) and part-time (panel C) work, the hours worked in the previous week (panel D), and the log of weekly earnings (panel E).
Minimum Wage Effects on Employment, Hours and Earnings, Age 62–70
Notes: Robust standard errors clustered by states and reported in parentheses. Estimates weighted by number of observations in each cell. Sample includes monthly CPS data from 1983–2016 (ages 62–70). The unit of observation is state/age/quarter cell, collapsed from the CPS data. Employment in columns (1) to (3) refers to wage/salary employed and self-employed, whereas columns (4) to (6) refers only to wage/salary employed. The main explanatory variable is the log of effective minimum wage. The dependent variable for panel A is the log of employment rate; for panel B, the log of full-time employment rate; for panel C, the log of part-time employment rate; for panel D, hours worked in previous week; and for panel E, the log of weekly earning. Working full-time and part-time are defined as working 35 hours or more and working less than 35 hours, respectively. For all specifications, we control for state fixed effects. In columns (1) and (4), we include time fixed effects. In columns (2) to (3) and (5) to (6), we include division × age × time fixed effects and state linear trends. We restrict our samples to the employed workers in columns (3) and (6).
indicate significance at the 5%; 10% level, respectively.
Column (1) of Table 3 implements the state-panel model with the canonical model of state and time fixed effects (Equation (1)), and finds minimum wages are associated with positive employment outcomes for the older group. We have shown in the pre-trend analysis, however, that this specification exhibits a bias due to time-varying heterogeneity, so in column (2), we account for time-varying heterogeneity in the form of division × age × time effects and state linear trends; this is our preferred specification (Equation (2)). Regardless of the choice of controls, the employment coefficients from columns (1) and (2) are non-negative, contrary to the hypothesis of adverse employment effects on older workers. Reading column (2), a 10% minimum wage increase predicts a 0.6% increase in employment, which can be translated into a 0.2 percentage point increase across the retirement group. (Recall from Table 1 that the mean employment rate of the 62–70 age group is 0.3.) From the results, we can rule out negative employment elasticities larger than −0.05.
Next, we restrict our focus to the wage-and-salary employed by excluding the self-employed in columns (4) to (6). As we have shown in Table 1, workers in the retirement age group have a higher probability of being self-employed (30%) compared to other age groups. It is possible that minimum wages may push older workers who are unable to find flexible low-wage jobs from the wage-and-salary employed into the self-employed. However, we find a positive and marginally significant coefficient of 0.13 for the wage-and-salary employment of the retirement age group (column (5) in panel A). We also test for a direct effect on self-employment and find no evidence that higher minimum wages shift older workers to self-employment (Table A.5). Thus, positive employment effects of minimum wages on older workers are likely to be driven by the wage-and-salary employed.
The impact of the minimum wages on full-time and part-time status are reported in panels B and C, with estimates on hours and earnings in panels D and E. Using the controls for time-varying heterogeneity in columns (2) and (5), we find that the employment response for the 62 to 70 age group is associated with an increase in full-time work, with no effect on part-time status. These effects are larger for the wage-and-salary employed; a 10% increase in minimum wages is associated with a 2.5% increase in full-time employment. The increase in full-time employment is reflected in the increase in hours worked in the previous week, in panel D, and the increase in weekly earnings, in panel E. The estimates for weekly earnings are large, with a 10% increase in the minimum wage leading to a 3% increase in weekly earnings. These effects suggest both intensive and extensive margin responses, as they appear larger than the intensive margin estimates.
We restrict the sample to employed individuals in columns (3) and (6) and study the effect on earnings and hours. We find smaller effects on earnings among the employed, which may be explained by a combination of intensive and extensive margin effects. These results should be interpreted with caution, as the restriction to employed individuals introduces the possibility of selection into the sample. Specifically, the increase in the employment rate of older workers in response to higher minimum wages (row 1) suggests compositional changes may partially explain the smaller earnings effects among the employed compared to the whole population.
We run the same analysis on the age 50 to 61 group in the Online Appendix. We find no negative effect of minimum wages on overall employment in this group; however, the age 50 to 61 group shows modest evidence of a shift to part-time work. Minimum wages seem to increase their part-time employment, which is contrary to the age 62 to 70 group for which the positive effects are concentrated on the full-time. This finding is also reflected in the modest decrease in hours for employed individuals in their 50s (Table A.4). Results for the 25 to 49 age group are shown in Table A.7 and largely follow previous findings in the literature.
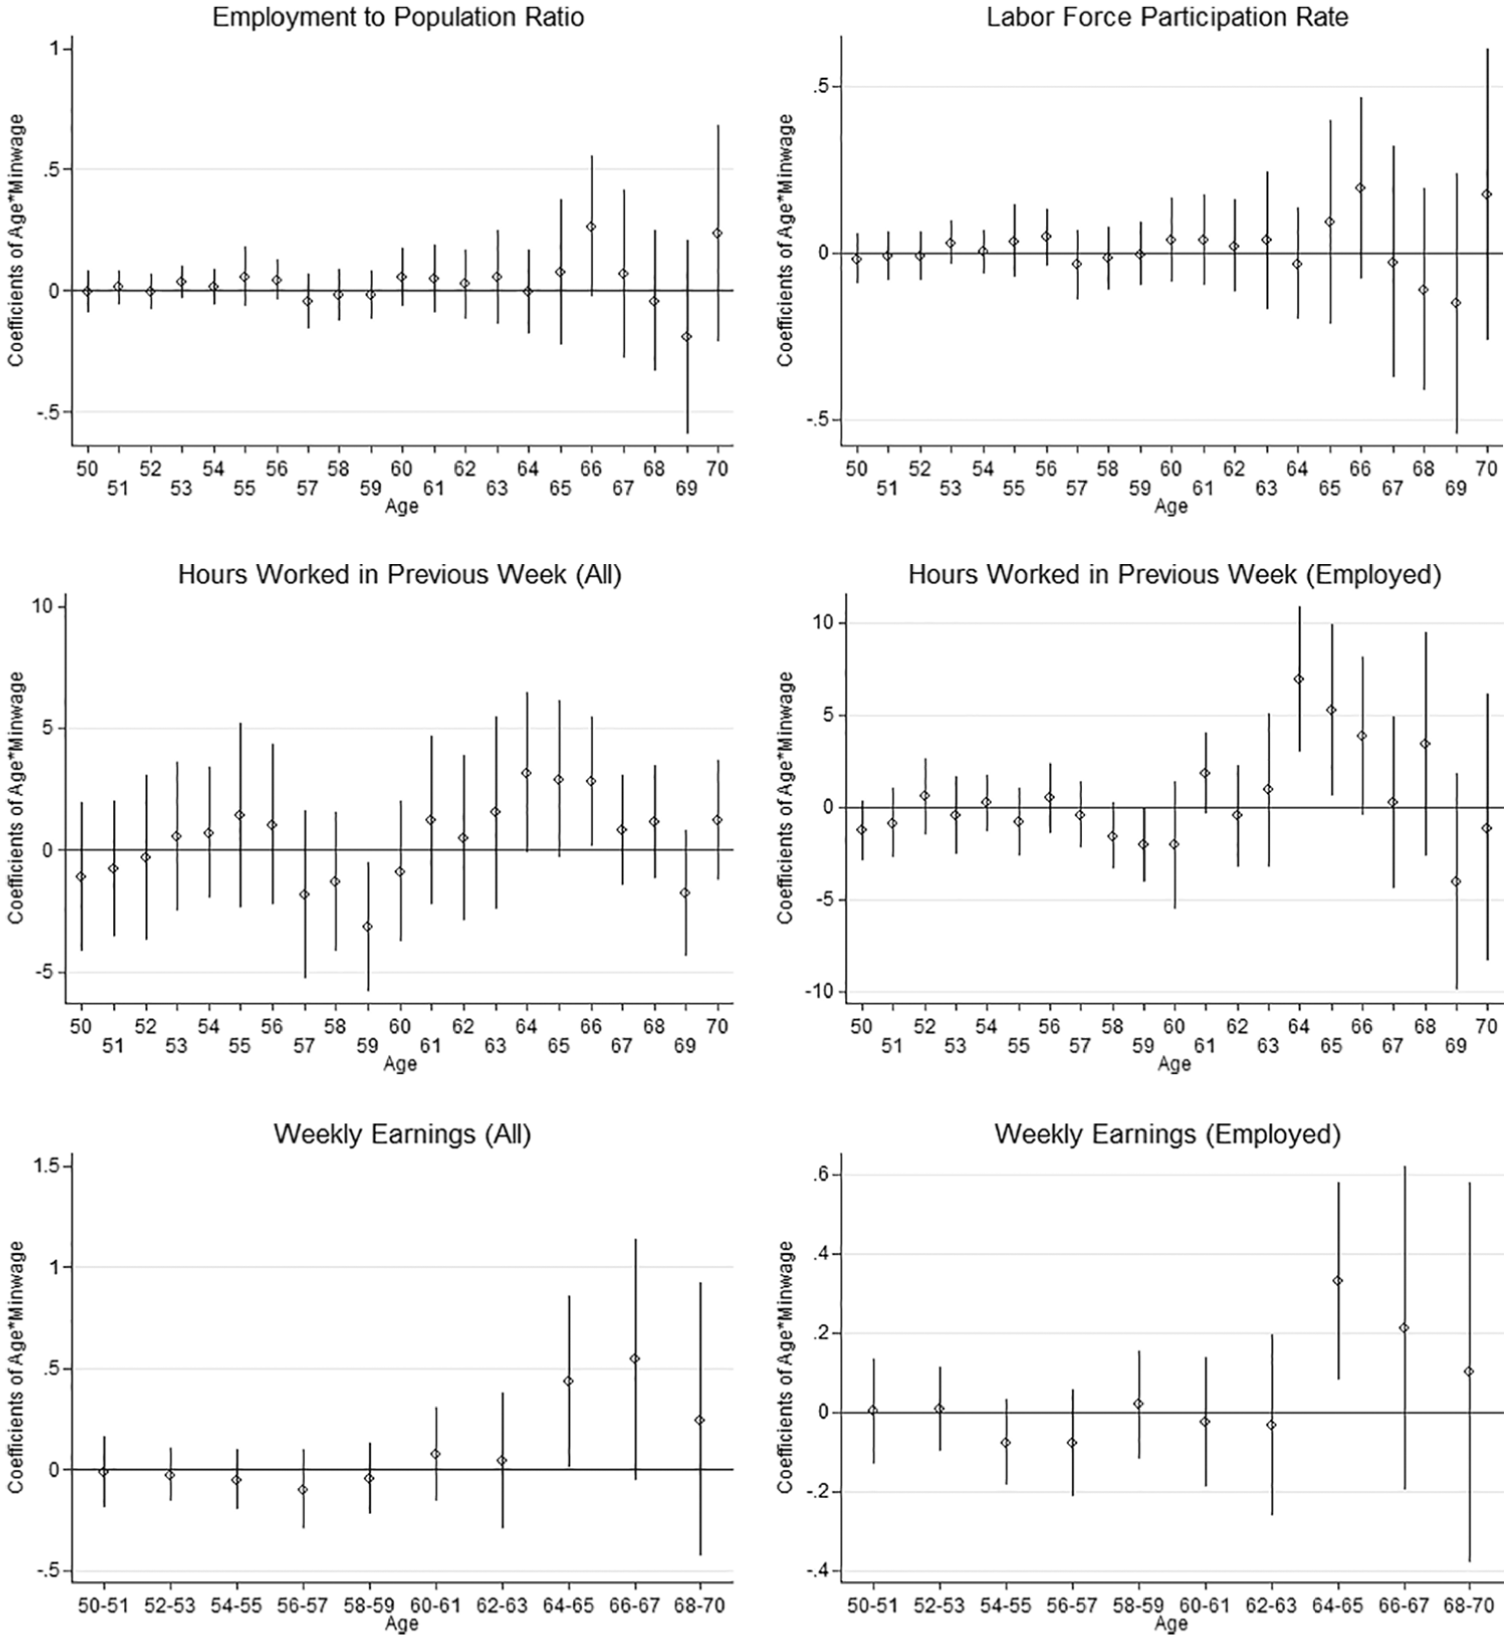
Next, we decompose the effects of minimum wages by fully interacting age dummies (age 50–70) with the log of minimum wages to estimate
Age Profile of the Minimum Wage Effects
In the second row of graphs in Figure 3, we report the effect on hours worked the previous week for the whole population and for employed workers. Hours responses, again, are concentrated in the mid-60s age group, peaking at an increase of nearly 2 hours of work per week for those between ages 64 and 66. Workers in their late 50s also reduce their hours slightly. This finding is consistent with our results shown in Table A.4, where we report modest decreases in work hours. Again, this may suggest a shift to part-time work in response to increases in minimum wages, consistent with combined income and substitution effects of changes in the minimum wage. In the final row of Figure 3, we report earnings elasticities. As with the previous analysis, we find modest evidence of a shift to part-time work and reduced earnings for workers in their late 50s, followed by larger increases in earnings in the mid-60s.
In the Online Appendix, we report the results of an analysis of employment and worker flows in the Quarterly Workforce Indicators (QWI) data. The QWI allows us to estimate a county border-pairs design, at the cost of a shorter panel and more aggregated age groups. Specifically, we run Equation (2) for county-quarters from 2000 to 2015 and the aggregated ages 55 to 64, and 65 and older. We find that the minimum wage has no effect on employment of workers age 65 and older once time-varying heterogeneity is accounted for, through either the inclusion of controls or the use of the county border-pairs design (Table A.8). The effect is a precisely estimated zero, though confidence intervals cannot generally exclude the estimates found in the CPS analysis. Figure 1 and Figure 2 also show that minimum wages are less binding for older workers during 2000 to 2015, which may diminish the positive employment coefficients that possibly appeared in the 1980s and 1990s. 8 Unlike the results for teenagers and food service workers in Dube, Lester, and Reich (2016), we also find no evidence that the minimum wage has altered flows among older workers. 9 The absence of changes in worker flows argues against a dynamic monopsony story and suggests that any increase in employment results from labor supply effects. These results lead us to strengthen our conclusion that the minimum wage has no disemployment effects on older workers.
Heterogeneity and Robustness
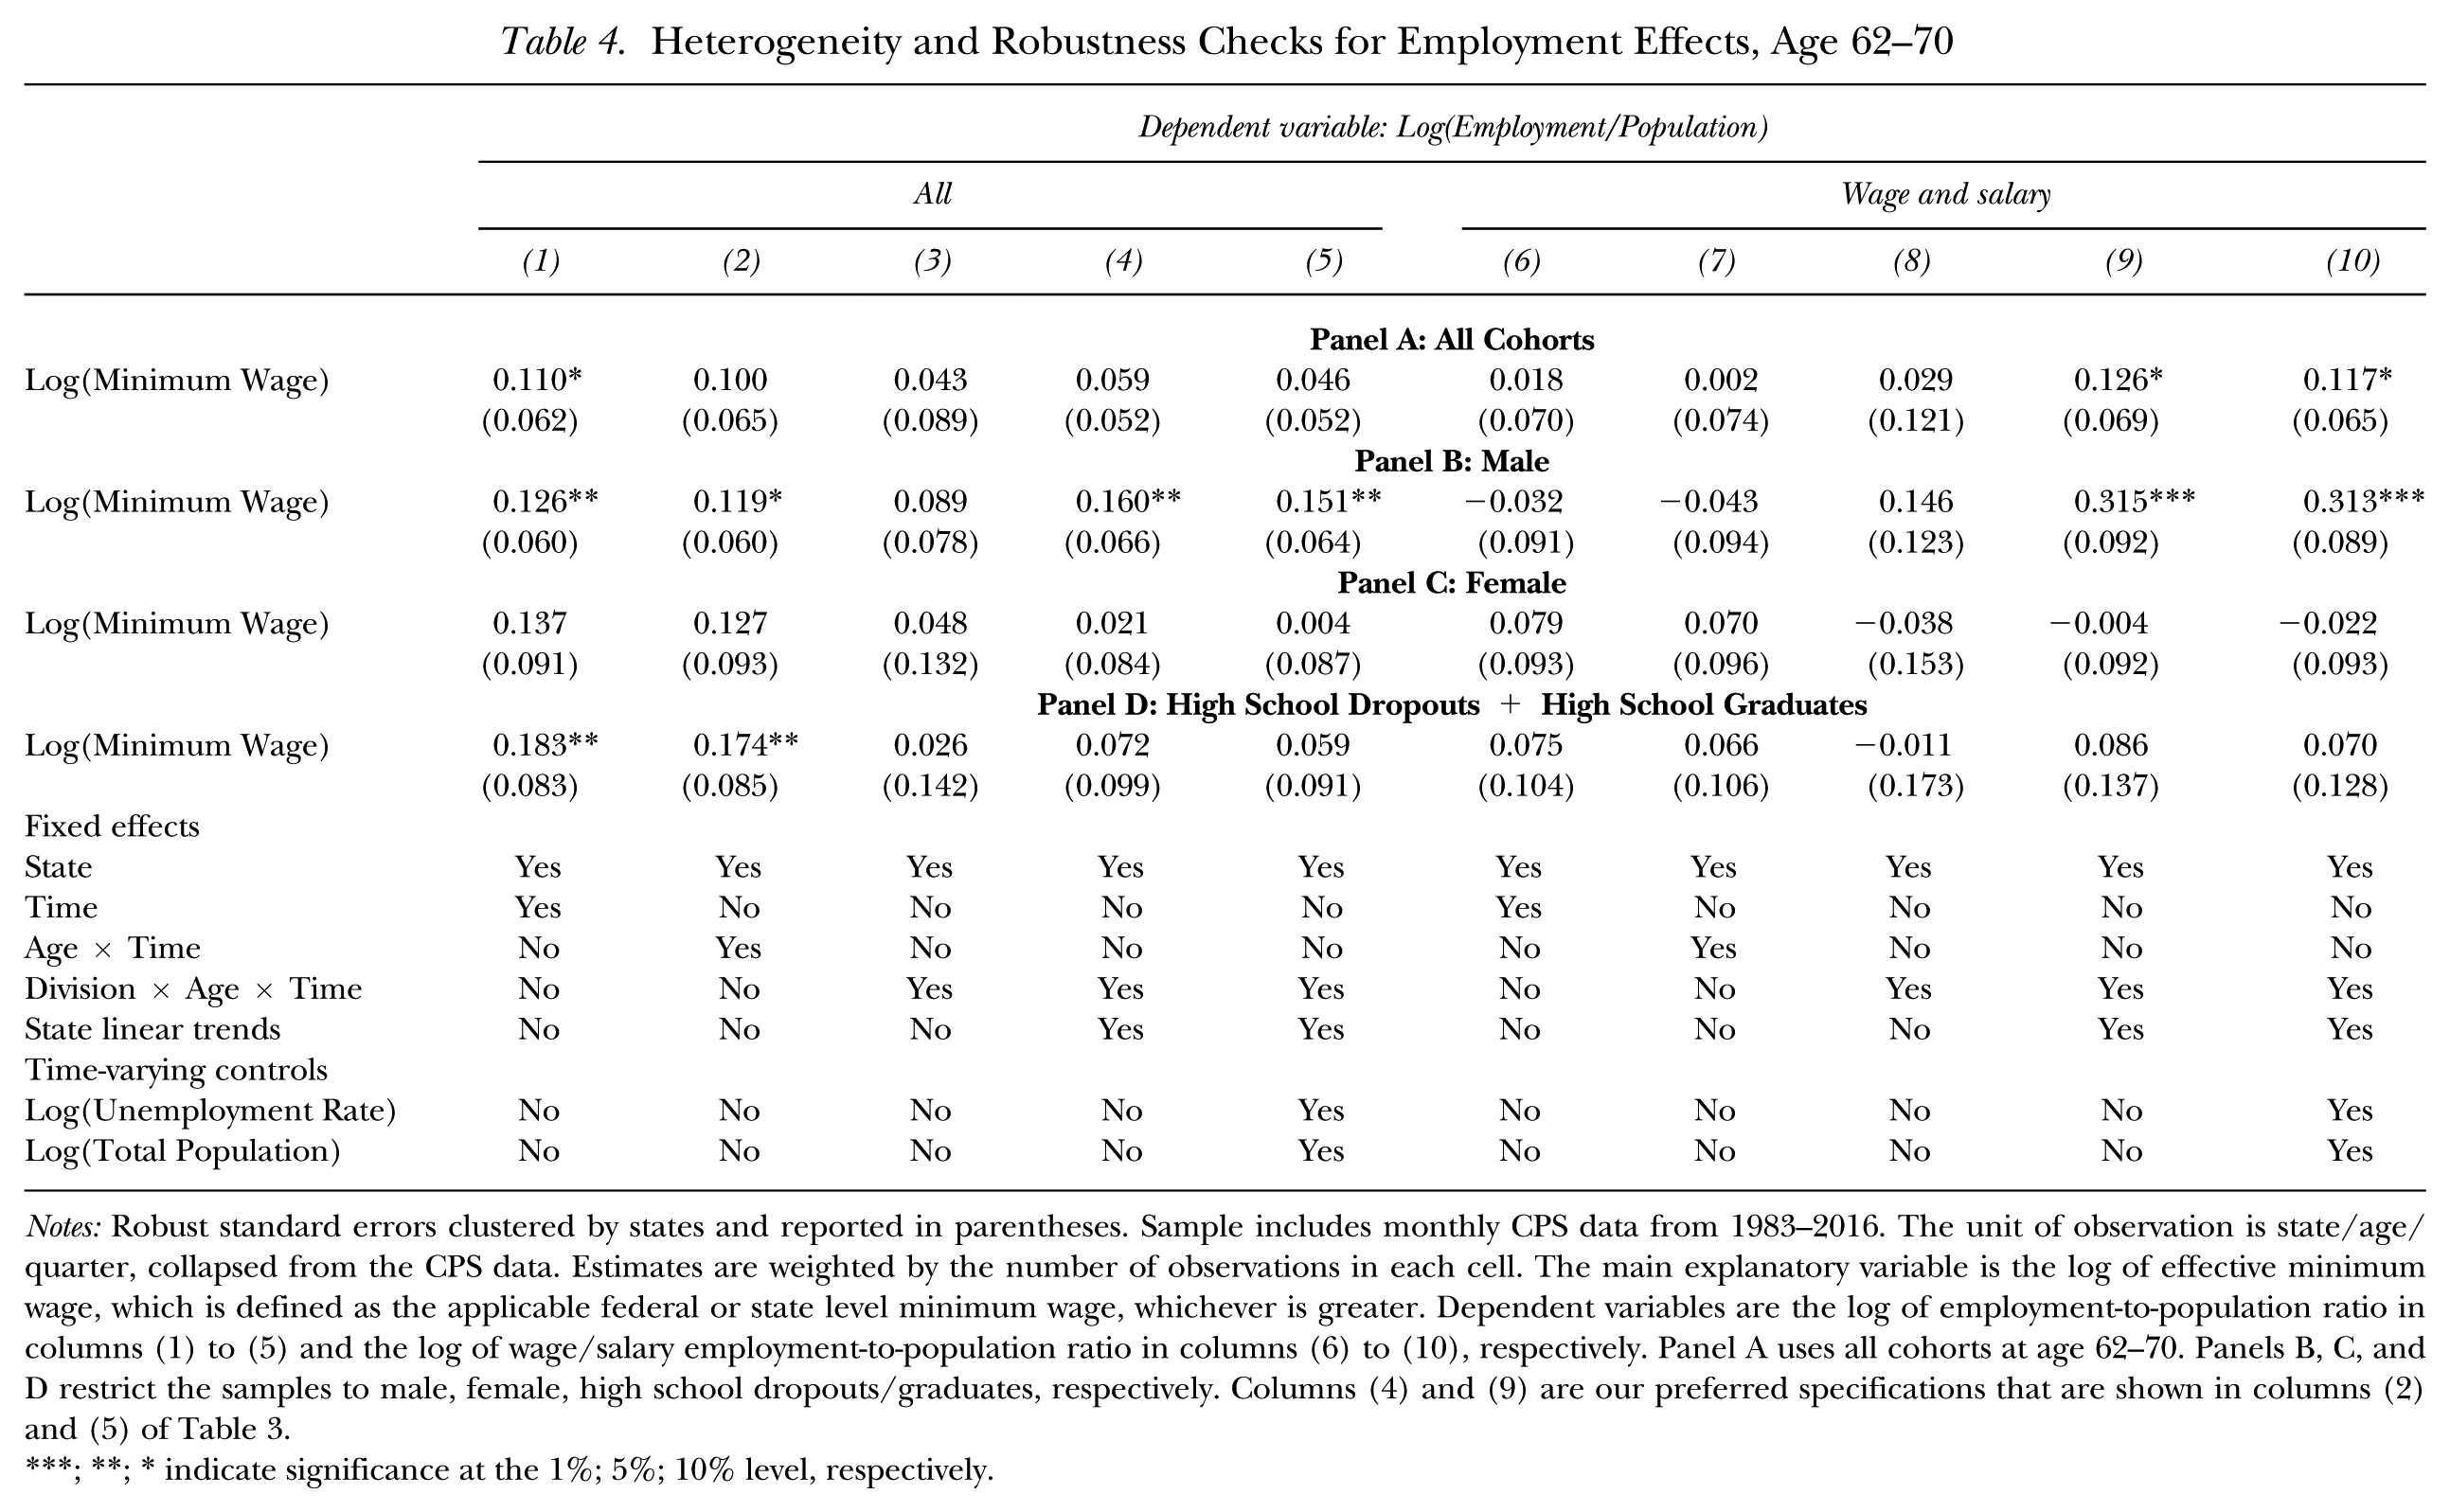
In Table 4 we explore the heterogeneity and robustness of the employment estimates. Whereas the literature considers a range of outcomes, we focus on employment elasticities, as these are the most commonly proposed channel by which the minimum wage may have perverse consequences.
Heterogeneity and Robustness Checks for Employment Effects, Age 62–70
Notes: Robust standard errors clustered by states and reported in parentheses. Sample includes monthly CPS data from 1983–2016. The unit of observation is state/age/quarter, collapsed from the CPS data. Estimates are weighted by the number of observations in each cell. The main explanatory variable is the log of effective minimum wage, which is defined as the applicable federal or state level minimum wage, whichever is greater. Dependent variables are the log of employment-to-population ratio in columns (1) to (5) and the log of wage/salary employment-to-population ratio in columns (6) to (10), respectively. Panel A uses all cohorts at age 62–70. Panels B, C, and D restrict the samples to male, female, high school dropouts/graduates, respectively. Columns (4) and (9) are our preferred specifications that are shown in columns (2) and (5) of Table 3.
**; * indicate significance at the 1%; 5%; 10% level, respectively.
We first discuss heterogeneous effects of minimum wages on the retirement age group (62 to 70) by sex and for the less educated. We focus primarily on our preferred specification of columns (4) and (9), which fully control for time-varying heterogeneity. We include the self-employed in our regressions in column (4), but not in column (9). In panels B and C, we document heterogeneous minimum wage effects on men and women. Accounting for time-varying heterogeneity in column (4), we show that men overall respond more strongly to minimum wage reforms with a large positive and significant employment coefficient; a 10% increase in minimum wages leads to a 1.6% increase (3.2% for the wage-and-salary employed) in the employment rate of men. We further stratify the samples by marital status in the Online Appendix, in which we again find that men and women show distinct patterns in terms of employment elasticities. For men, the positive effects become larger and more significant for married men, particularly if we restrict our attention to the wage-and-salary employed. For women, however, those without a spouse generally have larger positive employment coefficients (Table A.6).
We also explore heterogeneity by education and industry. In panel D of Table 4, we report results for those with high school education or below, for which 18% of employed workers earn near-minimum wages. Again, we do not find any evidence of disemployment effects, though we lose precision with the focus on a subgroup. The effects on the high-educated counterpart (some college or more) are also non-negative and statistically indistinguishable from the low-educated group (results not reported). We further explore heterogeneous effects of minimum wages on older workers by industries in the Online Appendix. For industry-level analysis, it is necessary to utilize the state-level QWI data (2000–2015) because of the limited sample size of the CPS. In accordance with the employment results for the QWI (Table A.8), we do not find evidence of disemployment in the heterogeneous effects across the North American Industry Classification System (NAICS) private sectors. One exception appears—we do observe statistically significant and negative employment effects of minimum wages on public sectors (Figure A.2). This result may reflect inflexible public-sector budgets for wages and salaries, making it worthy of attention for future research.
In the other columns in Table 4, we conduct robustness checks to our employment estimates, considering various specifications with different sets of controls. Neumark et al. (2014) argued that the use of local controls in our preferred specification may lead to faulty conclusions, since it incorrectly captures unobserved heterogeneity and throws out valid controls. To address this critique, we include coarser geographic controls in columns (1) to (3) and (6) to (8) of Table 4. We start from the traditional common time effects model without any control for heterogeneity (columns (1) and (6)). In columns (2) to (3) and (7) to (8), we include more controls, by adding age × time and division × age × time fixed effects, respectively. Columns (4) and (9) are our preferred specification with state linear trends. Finally, we add time-varying covariates (the log of unemployment rate and the log of the total population) in columns (5) and (10). Reading across the top row of estimates (panel A), we find no evidence of disemployment effects; none of the coefficients are less than zero regardless of the specifications. This absence of adverse employment effect is also found in other sub-groups across the specifications.
The validity of location-specific trends variable used in our preferred specification has been debated in the minimum wage literature. Dube et al. (2010) and Allegretto et al. (2017) argued that it is necessary to account for spatial heterogeneity of pre-trends in employment growth by including state-specific time trends. Conversely, several studies have criticized this specification, pointing out that it may fail to capture important identifying variation of minimum wages (e.g., Sabia 2009). Meer and West (2016) also argued that minimum wages have dynamic treatment effects on employment growth that the specifications with state-linear trends cannot fully capture.
Nevertheless, we find that the specifications promoted as alternatives to those with state linear trends do not alter the findings. First, unlike the previous studies, the inclusion of state-specific linear trends in the regression do not significantly change our employment elasticities (columns (3) and (4) of Table 4). To formally show that state-specific trends do not bias our employment coefficients for older workers, we replicate the long difference specifications by Meer and West (2016). We regress the long difference in the log of employment rate on the long difference in the log of minimum wages, with and without state linear trends, respectively (Table A.9). If state linear trends are biasing our estimates because we are not fully accounting for dynamic minimum wage effects, the employment elasticities are expected to change as the time span is increased. We find, however, that the employment elasticities are consistent across different duration of time spans (from 1 year to 8 years) and specifications (with and without linear trends).
For an additional check on robustness, we utilize the interactive fixed-effects model to account for unobserved heterogeneity (Bai 2009; Totty 2017). We have assumed that unobserved heterogeneity can be controlled for in the standard ordinary least squares (OLS) framework by including division × age × time fixed effects and state linear trends in our regression equation. Instead of making this specific assumption about the form of heterogeneity, the interactive fixed-effects model jointly estimates unobserved common factors and factor loadings that capture unit-specific responses to the common shocks. In the Online Appendix, we compare the coefficients of the previous OLS results (common time effects and heterogeneous time effects) and the new interactive fixed-effects results with various numbers of unobserved common factors (up to 10). Overall, we observe that the interactive fixed-effects model exhibits positive coefficients of labor market outcomes that follow the patterns estimated by the heterogeneous time effects OLS model (Table A.10).
From the evidence in the analysis, we conclude that minimum wages have not reduced the employment rate of workers around retirement, but rather, may have modestly increased the employment rate.
Effects on Social Security and Retirement Income
In our final section of analysis, we use the county-level data of SSA’s annual publications of OASDI Beneficiaries Statistics to examine the effects of the minimum wage on Social Security income of older workers. Since the OASDI Beneficiaries Statistics are reported annually, we use the mean value of the minimum wages for each year as our explanatory variable. 10
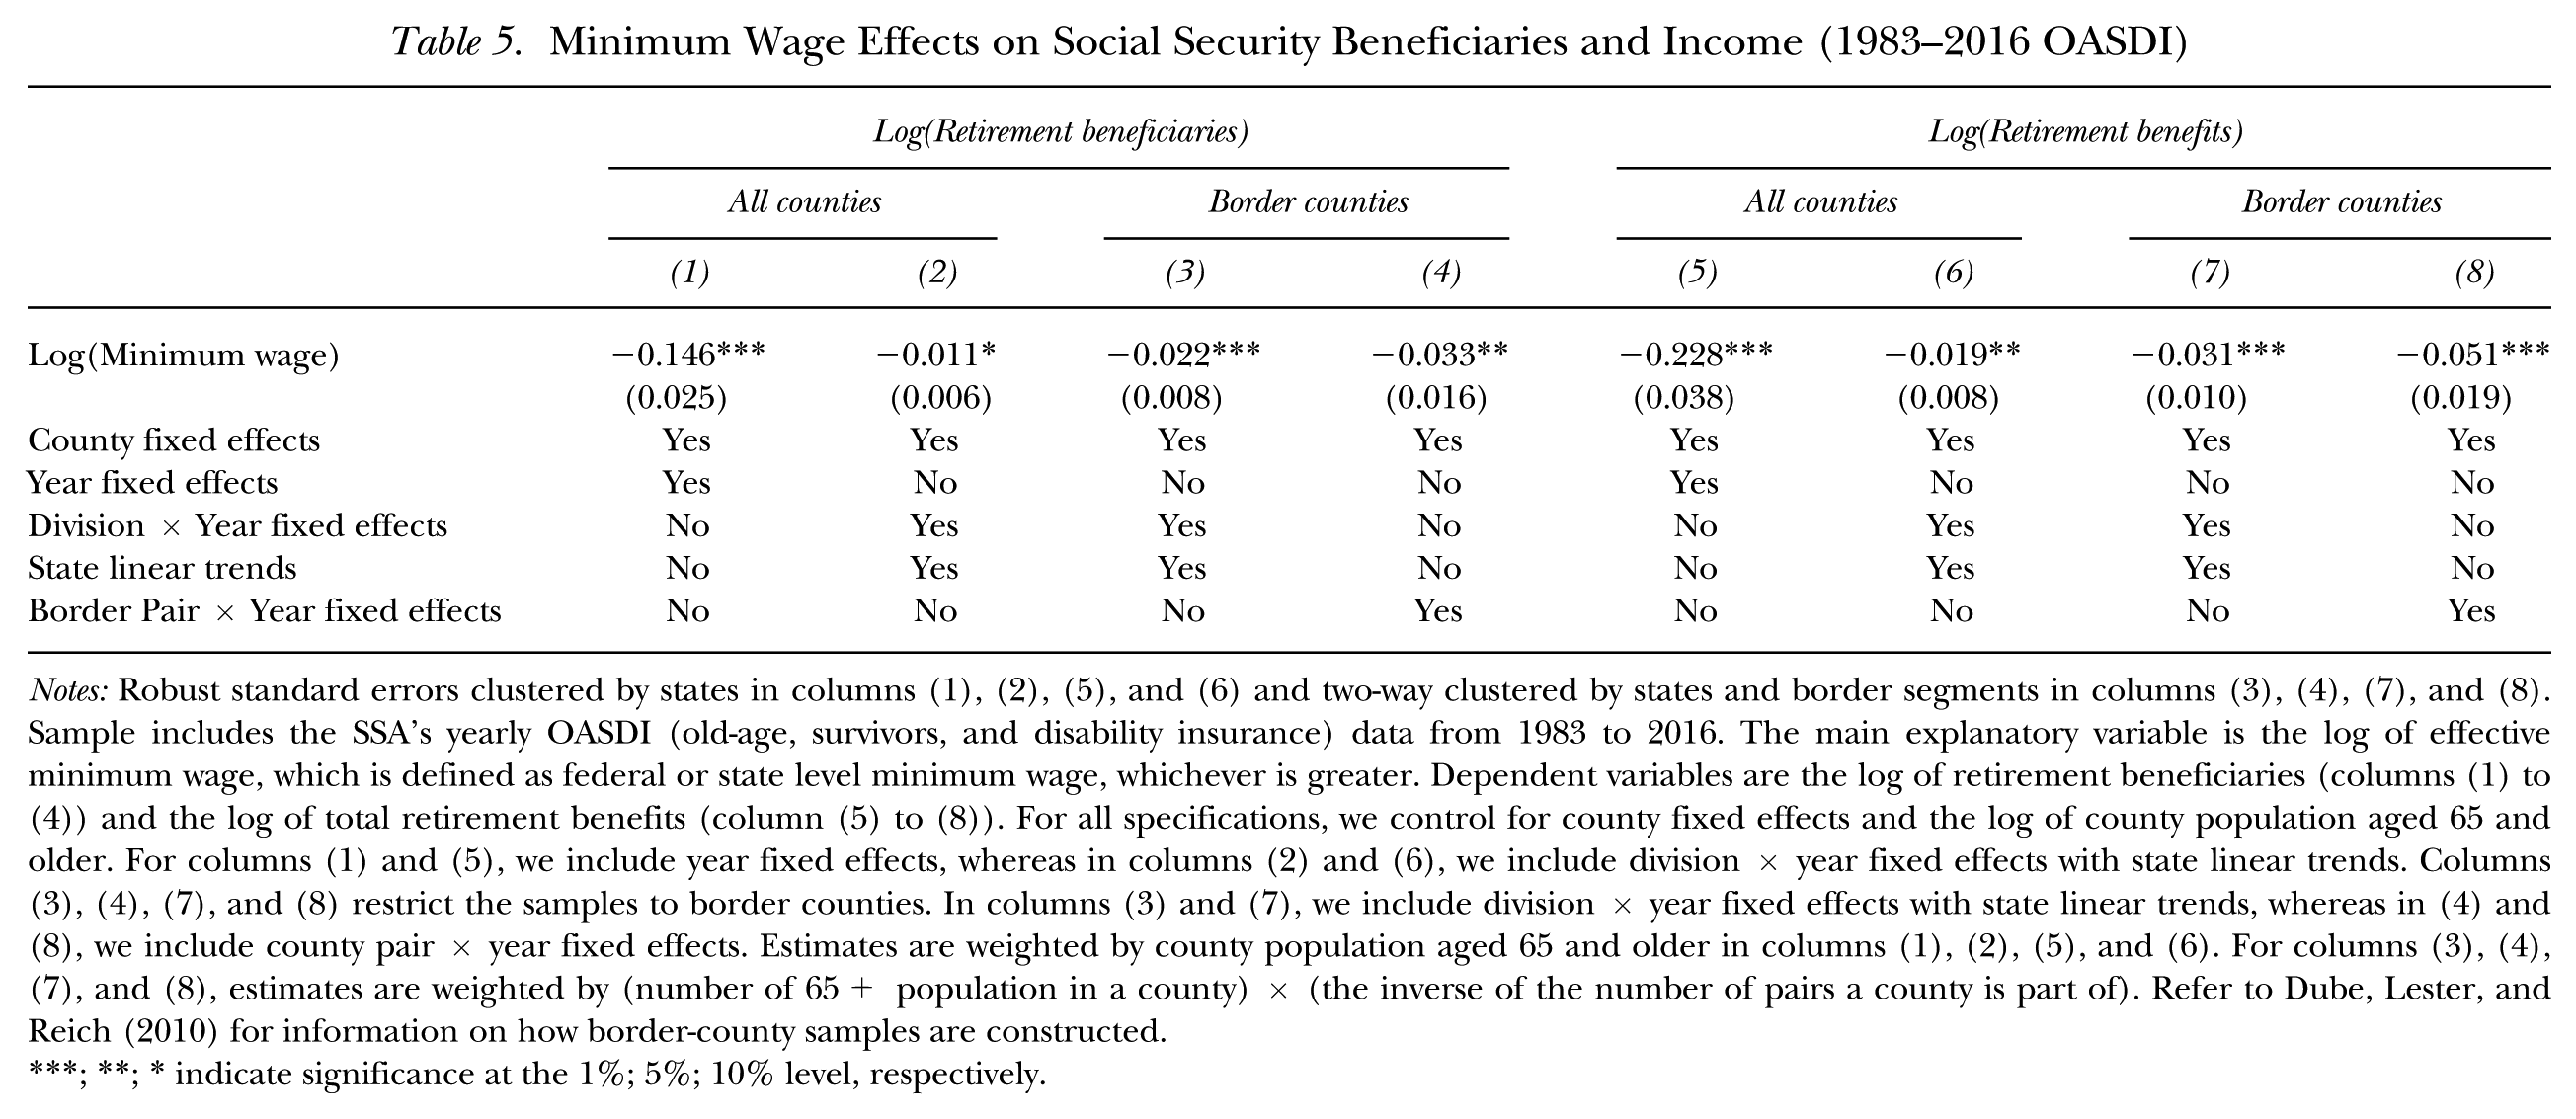
Table 5 shows the results for the OASDI county-level data on the log of retirement beneficiaries (columns (1) to (4)) and the log of payments (columns (5) to (8)) by the Social Security system. In columns (1) to (2) and (5) to (6), we utilize all counties in the regression analysis, in which we control for common time effects using Equation (1) (columns (1) and (5)), and heterogeneous time effects using Equation (2) (columns (2) and (6)), respectively. The regression models in this analysis closely resemble the previous CPS specifications. Here, the bias from time-varying heterogeneity pushes toward larger decreases in beneficiaries and payments. Once we account for time-varying heterogeneity, we still find statistically significant negative effects of minimum wages on retirement beneficiaries and benefits—a 10% increase in minimum wages leads to a 0.11% decrease in beneficiaries. Effects on benefits are slightly larger, with a 10% higher minimum wage associated with a 0.2% decrease.
Minimum Wage Effects on Social Security Beneficiaries and Income (1983–2016 OASDI)
Notes: Robust standard errors clustered by states in columns (1), (2), (5), and (6) and two-way clustered by states and border segments in columns (3), (4), (7), and (8). Sample includes the SSA’s yearly OASDI (old-age, survivors, and disability insurance) data from 1983 to 2016. The main explanatory variable is the log of effective minimum wage, which is defined as federal or state level minimum wage, whichever is greater. Dependent variables are the log of retirement beneficiaries (columns (1) to (4)) and the log of total retirement benefits (column (5) to (8)). For all specifications, we control for county fixed effects and the log of county population aged 65 and older. For columns (1) and (5), we include year fixed effects, whereas in columns (2) and (6), we include division × year fixed effects with state linear trends. Columns (3), (4), (7), and (8) restrict the samples to border counties. In columns (3) and (7), we include division × year fixed effects with state linear trends, whereas in (4) and (8), we include county pair × year fixed effects. Estimates are weighted by county population aged 65 and older in columns (1), (2), (5), and (6). For columns (3), (4), (7), and (8), estimates are weighted by (number of 65+ population in a county) × (the inverse of the number of pairs a county is part of). Refer to Dube, Lester, and Reich (2010) for information on how border-county samples are constructed.
**; * indicate significance at the 1%; 5%; 10% level, respectively.
In columns (3) to (4) and (7) to (8), we restrict our samples to counties that are located along state borders. For columns (3) and (7), we control for division × year fixed effects and state linear trends, as in the all-counties samples. In columns (4) and (8), we instead control for border pair × year fixed effects. This is our preferred specification, with the largest set of controls for time-varying heterogeneity. In this specification the estimates are based on only the variation within county border pairs, in which each bordering county is used as the control for their counterpart. We find that a 10% increase in the minimum wage leads to approximately a 0.3% decrease and a 0.5% decrease in beneficiaries and payments, respectively. The estimated coefficients for border counties are similar across columns and consistent with the estimates from the model that parallels the CPS analysis.
Comparing these results with the employment analysis, we find that the magnitudes of the previous CPS analysis on employment coincide with those of the Social Security analysis. We showed previously that the employment elasticity for the age group 62 to 70 using our preferred specification is 0.06 (column (2) of Table 3); with an employment rate of approximately 0.3 (Table 1), this implies a 0.2 percentage point increase in employment from a 10% increase in the minimum wage. In addition, we find that 80% of our samples in the ASEC whose age is over 62 report that they receive some form of the Social Security benefits. Using the Social Security elasticity of −0.03 (column (4) of Table 5), this translates into a decrease of similar absolute magnitude in the probability of claiming the Social Security benefits from a 10% increase in the minimum wage. Since the minimum wage may have effects beyond increasing employment (for example, increasing the earnings for the already-employed and other members of the household), we have no reason to expect that these coefficients would be exactly equal. It is reassuring, however, that they are similar in magnitude.
In the Online Appendix, we report the analysis of Social Security outcomes and other retirement income in the CPS-ASEC data. The CPS is largely uninformative about the effects of the minimum wage on Social Security, as the standard errors would not allow us to detect the magnitude of effects we find in the OASDI data. However, we find that minimum wages induce significant decreases in other retirement income (defined by the CPS). Most of these other sources resemble Social Security in that they reward individuals for delayed withdrawals (Table A.11).
Thus, we conclude that higher minimum wages delay Social Security claiming, consistent with an increase in financial resources for workers approaching retirement.
Conclusion
Population aging will pose an unprecedented challenge to fiscal budgets over the coming decades. In response, encouraging longer working lives is a near-universal policy prescription among economists. Working longer increases both the resources of individual workers and tax receipts, while also reducing the burden on Social Security programs. Therefore, the potential disemployment effects of recent proposals to increase the minimum wage warrant particular scrutiny. When policymakers and researchers have considered the differential effects of the minimum wage on older workers, the presumption has been that the minimum wage may be particularly harmful to this group. The strongest evidence of this belief is minimum wage exemptions for older workers, which were phased out with the end of formal age discrimination in the 1980s.
We find no evidence of disemployment effects of the minimum wage on older workers, despite high rates of exposure to the minimum wage. Instead of disemployment effects, higher minimum wages have been associated with increased labor supply among those workers in their mid-60s. Although effects on employment are not significant, the combined evidence on employment, hours, and wages supports the finding of increased labor force attachment. Our most robust finding is a decrease in Social Security recipients and benefits.
A pattern of positive effects on older workers’ employment and earnings mirrors the findings of increased employment among older workers in Canada, documented in Fang and Gunderson (2009). As is usual in studies of minimum wages, we must frame the results by noting that the minimum wage may have nonlinear effects. The results in this article apply to the range of minimum wages observed in the sample period and may not be entirely applicable for proposals to raise the minimum wage above previous levels. For example, we calculate that a $15 minimum wage would bind above the 30th percentile of wages for workers over age 62. Allaying this concern, we find our positive employment effects are largely explained by responses in the 1980s and 1990s, when minimum wages were binding at a higher percentile of the wage distribution and consequently affected a larger share of older workers. We conclude that the minimum wage appears to be an effective tool to increase the incomes of older workers.
Supplemental Material
ILRR_845861_Supplemental_Online_Appendix – Supplemental material for Minimum Wages and Retirement
Supplemental material, ILRR_845861_Supplemental_Online_Appendix for Minimum Wages and Retirement by Heepyung Cho and Mark Borgschulte in ILR Review
Footnotes
For information regarding the data and/or computer programs used for this study, please address correspondence to
1
Explicit minimum wage exemptions for workers over age 65 were phased out around the time of the end of mandatory retirement and other formal age discrimination: in Michigan in 1978, Oregon in 1981, Oklahoma in 1983, and Kansas in 1988 (Nelson 1979, 1982, 1984,  ).
).
2
For extensive reviews of the literature, see Brown, Gilroy, and Kohen (1982), Card and Krueger (1995), and Neumark and Wascher (2007). Neumark (2017) discussed recent papers that found negative effects of the minimum wage; published examples included Thompson (2009) and .
3
If we include teenagers and workers in their early 20s, we would see substantially higher rates of minimum wage work in these ages. Many minimum wage studies examined the effects of the minimum wage on youth; for recent studies in the United States, see Dube, Lester, and Reich (2010), Giuliano (2013), Neumark, Salas, and Wascher (2014), and .
4
Note that empirical evidence on how aging affects productivity is mixed. For recent evidence on falling wages at older ages, see van Ours (2009), van Ours and Stoeldraijer (2011), and .
5
Downloaded from https://www.dol.gov/whd/state/stateMinWageHis.htm (June 2016). Our data are nearly identical to those of .
6
Other retirement income is a composite category that includes income from (description taken from IPUMS): company or union pension, including profit sharing; annuities; U.S. military retirement; federal government employee pensions; state or local government employee pensions; U.S. Railroad Retirement; regular payments from annuities or paid-up insurance policies; and other sources such as IRA or Keogh accounts.
7
Because of the limited number of observations of the CPS, we pool age groups 62–63, 64–65, 66–67, and 68–70 whenever we further stratify our samples by full-/part-time status, class of work, sex, or education.
8
9
Notice that given the aggregation of QWI data to broad age ranges, we cannot isolate the ages in which we examined employment effects in the CPS.
10
One concern for our analysis is the possibility of a migration response, since retirees may be more sensitive to the cost of living than other people are. We test for this using county population data from the Surveillance, Epidemiology and End Results Program by the National Cancer Institute and the US Census Bureau (), finding that minimum wages are not associated with size of the age 65+ county population.
References
Supplementary Material
Please find the following supplemental material available below.
For Open Access articles published under a Creative Commons License, all supplemental material carries the same license as the article it is associated with.
For non-Open Access articles published, all supplemental material carries a non-exclusive license, and permission requests for re-use of supplemental material or any part of supplemental material shall be sent directly to the copyright owner as specified in the copyright notice associated with the article.
