




Abstract
The authors investigate whether a cut in unemployment benefit payout periods enacted in Germany in 2006 affected older workers’ labor market transitions. The authors use rich administrative data and exploit a difference-in-differences approach. During 2004–2007, using monthly observations, they compare a reference group of 40–44 year olds with constant benefit payout periods to older treatment groups with reduced payout durations. Compared to the reference group, those groups with reduced payout periods had lower job exit rates, higher rates of finding a job, higher propensity to remain employed, and lower propensity to remain unemployed. These patterns suggest that the reform may have contributed to the recent rise in old-age employment in Germany.
Keywords
Between 2000 and 2014, the population share of employed older workers (age 55–64) in Germany increased by 53% for men and by 110% for women. 1 This development dwarfs the increase in labor force attachment observed among older workers in the United States (Banerjee and Blau 2016) and other countries (Hoffmann and Lemieux 2015). For countries in the grip of demographic aging, it is important to understand the driving forces behind such a jump in older workers’ labor force participation and employment.
This article addresses the relevance of labor market institutions and their incentive effects for older workers’ labor market outcomes. In particular, we use detailed administrative data to investigate the effects of an unemployment insurance (UI) reform on employment transitions of older workers. The impact of institutional changes on labor force participation choices of older workers is of general interest, and the interplay between unemployment benefit provision and employment incentives is an internationally observed phenomenon. Numerous countries attempt to deal with the challenge of aging societies by adjusting the regulation of work, unemployment, and retirement. Therefore, our study of causal reform effects generates important policy-relevant insights.
This study connects to two prior contributions: Hoffmann and Lemieux (2015) analyzed unemployment in the United States after the Great Recession and compared it to trends in other countries. They investigated the drop in nonemployment among older workers in Germany and argued that labor market reforms were unlikely to “explain a sizable part of the trends in nonemployment” (p. 132). Dlugosz, Stephan, and Wilke (2014) studied the impact of German labor market reforms on older workers’ subsequent entries to unemployment. In contrast to Hoffmann and Lemieux (2015), they found substantial reform effects of, for example, up to 30% reductions in unemployment entries. Thus, the relevance of institutional reforms for employment trends of older workers is disputed, and we contribute to that debate.
In this article, we offer a broad and encompassing analysis. We differ from Hoffmann and Lemieux (2015) first by focusing on the effect of one specific reform and second by concentrating specifically on older workers’ labor market flows. We extend the analysis of Dlugosz et al. (2014) in several respects. Whereas those authors studied entries to unemployment exclusively, we consider three potential labor market states and investigate four independent transitions between employment and unemployment states, leaving a remaining “other” labor force state, for which we have only limited information, as a reference category. Also, we control more explicitly for institutional features such as changes in retirement regulations and account for seasonality and seam effects in monthly transition patterns.
Based on a difference-in-differences analysis with large samples taken from precise administrative data, we find that the reduction of unemployment benefit payments affected the transition rates of older workers as expected. We compare the reference group of 40 to 44 year olds with constant benefit payout periods to older treatment groups with reduced payout durations. For the latter, job exit rates declined, job finding rates increased, the propensity to remain employed increased, and the propensity to remain unemployed declined after the reform. We observe the largest behavioral adjustments among those affected most strongly by the reform. This outcome suggests that the reform of unemployment benefits may be one of the reasons behind the dramatic rise in old-age employment in Germany.
Literature
Our work contributes to several lines of literature: We add to the study of older workers’ labor force participation, contribute to the analysis of institutional reform effects, and offer a new perspective on recent labor market developments in Germany. We briefly review the literature in each of the following fields.
First, older workers’ labor force participation (LFP) receives substantial attention because of its immediate fiscal implications (Coile, Milligan, and Wise 2014). The trends and determinants of older workers’ LFP shifted over recent decades. Peracchi and Welch (1994) referred to developments such as wage dispersion or changes in the industry and occupation mix to explain the decreasing LFP of older workers in the United States since the 1960s. Schirle (2008) looked at cross-country data and found that, generally, increases in older men’s LFP could be explained by increases in the labor market participation of their wives. Blau and Goodstein (2010) concluded that changes in retirement incentives explained between one-quarter and one-half of the increase in US older male workers’ LFP by 2005. Recently, Banerjee and Blau (2016) inspected employment trends in the United States through 2010. They found only limited explanatory power in demographics, education, and institutional incentives. We add to this literature by offering evidence on the relevance of institutional reforms in attaining a substantial increase in old-age LFP.
Second, a large literature studies workers’ responses to institutional incentives based on reforms of unemployment and retirement regulations. In an influential early contribution, Hunt (1995) applied survey data to study reforms of German UI in the 1980s. She concluded that “the large increase in potential duration of ALG [unemployment benefits] provoked a large response” (p. 118). Similarly, Lalive, van Ours, and Zweimüller (2006) found that an extension of the potential benefit duration resulted in longer unemployment spells among older workers; they exploited a 1989 reform of the Austrian UI system. In another study on Austria, Inderbitzin, Staubli, and Zweimüller (2016) looked at the relationship between UI and retirement incentives. Using an extension of unemployment benefits for older workers, they found strong effects on early retirement. The authors suggested that policies aimed at postponing retirement need to consider the full mix of available transfer programs. Hairault, Langot, and Sopraseuth (2010) adopted a different perspective and addressed the distance to retirement as a determinant of older workers’ labor market behavior. They argued that the returns to job finding vary with a job’s potential duration. They also confirmed that employment rates of older workers in France increased when incentives to postpone retirement were strengthened. We add to this literature by evaluating the effects of a reform on labor market transitions while accounting for other relevant institutional features.
Third, the positive development of the German labor market attracted international attention (e.g., Burda and Hunt 2011; Hoffmann and Lemieux 2015). Note that the dominant explanations of this development do not assign a central role to labor market reforms: Burda and Hunt (2011) and Dustmann, Fitzenberger, Schönberg, and Spitz-Oener (2014) argued that the labor market reforms implemented between 2003 and 2006 were not of central importance. Instead, they stressed other explanations, such as the pessimistic hiring behavior of employers prior to the recession, wage moderation, working-time accounts, and the governance structure of German labor market institutions with decentralized wage setting institutions, as the main reasons for the strong performance of the German labor market. By contrast, we study the relevance of the institutional framework and its reform for the labor force behavior of older workers. To the extent that transitions between labor market states (e.g., employment, unemployment, or out-of-the labor force) respond to reforms, prior studies may have underestimated the contribution of these institutions to the overall development.
Institutions and Hypotheses
We study the role of a single institutional reform, namely reforms to unemployment benefit payout durations, in the recent increase in older workers’ employment and focus, specifically, on changes in employment entry and exit. In explaining labor market transitions, it is important “to carefully consider the entire set of welfare programs” (Inderbitzin et al. 2016: 286). Thus, we discuss the reform of unemployment benefits as well as other relevant institutions.
Unemployment Insurance 2006 Reform
We center our attention on the reform of unemployment benefits brought about by a law that passed Germany’s parliament on December 24, 2003 (Hartz IV law). The reform affected workers who became unemployed on or after February 1, 2006. It shortened the duration of unemployment benefit payout for workers aged 45 and above by up to 14 months. Table 1 summarizes the changes in transfer durations. The changes vary by the age at which workers enter unemployment: Column (2) describes the maximum pre-reform payout duration, column (3) presents the post-reform situation, and column (4) shows the level of change from pre- to post-reform.
Maximum Duration of Unemployment Benefit Receipt (in Months) by Age and Period

Sources: BGBL.I, 1997, p. 627; BGBL.I, 2003, p. 3004; BGBL.I, 2008, p. 681.
Notes: The cut in durations as of February 2006 affected those unemployed since February 1, 2006. The prolongation of unemployment benefit durations as of January 2008 affected those entering unemployment on or after January 1, 2008, and aged 50 or 58 at that time, or those still receiving unemployment benefits from a prior entry to unemployment on January 1, 2008, and aged at least 50 or 58 at that time.
The UI 2006 reform intended to strengthen older workers’ labor market orientation. Job search theory and the empirical literature (see, e.g., Mortensen 1970; Card, Chetty, and Weber 2007) suggest that unemployment duration falls with shortened benefit entitlement periods as search intensity increases. We consider a situation of three mutually exclusive labor force states—employment (E), unemployment (U), other (O)—and expect that individuals chose their labor force transition based on a comparison of the expected utility in the potential destination states. The relative advantage of choosing any given destination state over both alternatives changes if the characteristics of either state change. If, for example, an individual would prefer destination state U pre-reform but not post-reform, the propensity to transit into states E or O may be affected by the reform. More specifically, we expect that individuals aged 45 and above who became unemployed on or after February 1, 2006, ceteris paribus, return to employment faster than their peers who had lost their job earlier (H1: U-E) because the duration of benefit payout had been shortened. We expect this effect on exits from unemployment to employment to be strongest among those with the largest reductions in payout periods, that is, age groups 52 to 54 and 57 and older (see Table 1). As the reform renders unemployment less attractive, it may reduce workers’ reservation wages and propensity to enter unemployment from employment after the reform (H2: E-U). Ceteris paribus, and with constant incentives to enter the other labor force state, we expect workers to be more likely to continue employment (H3: E-E), and to be less likely to remain unemployed (H4: U-U) after the reform.
In addition to these four hypothesized responses to the reduction in benefit durations, Dlugosz et al. (2014) showed substantial evidence of anticipation behavior prior to the reform date. Those older workers who were to lose their jobs on or after February 1, 2006, had an incentive to start an unemployment spell earlier: They benefited from up to 14 additional months of transfer if their unemployment spell started prior to the reform cutoff, February 1, 2006. Thus, unbiased estimation requires us to account for an anticipatory increase in unemployment entries among older workers prior to February 2006.
Unemployment Insurance 2008 Reform
In response to strong public opposition to the 2006 reform, the original reductions in payout durations were softened in a second reform. For an analysis of the 2008 reform on unemployed workers’ search effort, see Lichter (2016). This 2008 reform law passed parliament in January 2008 and retroactively affected all those unemployed on January 1, 2008, and after. Payout durations increased from 12 to 15 months and from 18 to 24 months for selected age groups (see columns (5) and (6) in Table 1). Although this reform may have weakened some of the prior adjustments in transition behaviors for the concerned age groups, the net effect continued to be a substantial shortening of payout periods (see column (7) in Table 1). It is unlikely that the 2008 reform generated anticipation effects. 2 Given the expeditious adjustment of the 2006 reform, it is not possible to evaluate its long-run effects.
58 Regulation
As an additional change, the “58 regulation” expired for those workers entering unemployment after the end of 2007. The regulation had exempted individuals aged 58 and older from the requirement to search for work, which generally is a condition for receiving unemployment benefits. Workers who used the exemption had to retire as soon as they reached full retirement age. The change may have rendered unemployment less attractive for those affected. Workers may have anticipated the termination of the 58 regulation, as it was announced in 2006. As a result, those aged 58 and above had an incentive to bring forward an expected entry to unemployment and to enter unemployment prior to January 1, 2008. 3
Retirement Insurance
The German retirement system offers various pathways to retirement, which differ in their requirements (e.g., the number of contribution years, retirement age, gender, health, or prior unemployment). Appendix Table A.1 describes five pathways (A through E) with respect to the minimum age of retirement entry. Generally, each pathway allows entry at a full (i.e., normal) and an early retirement age, the latter involving benefit reductions (for a description, see Engels, Geyer, and Haan 2016). Because of reforms, the rules differ by birth cohort. To determine the causal effect of unemployment benefit reforms, we must control for changes in the retirement system that might affect treatment or control groups.
As a first pathway, Table A.1 (column (A)) shows retirement due to unemployment, which allows individuals to retire if they were unemployed for at least 52 weeks after reaching age 58.5. 4 The minimum age for full retirement due to unemployment increased from 60 to 65 for the birth cohorts 1937 to 1941 and later. Since 2006, this pathway to retirement can be used prior to age 65 through early retirement only. Furthermore, the minimum age for early retirement increased from 60 to 63. Thus, in addition to cutbacks in unemployment benefits after 2006, retirement entry for the unemployed became more restrictive. This change may have delayed exits from unemployment into retirement (and indirectly from employment to unemployment) after 2005 for the birth cohorts 1946 and later.
Column (B) in Table A.1 describes a pathway to retirement that exists only for females: historically, women could enter full retirement at age 60. This entry age was raised, and starting with the birth cohort 1952 this pathway to normal full retirement was abolished altogether. Until the birth cohort of 1951, women could still retire at age 60 through early retirement. Generally, the rising full retirement age for females in the early 2000s should contribute to prolonged employment. In comparison to men, the abolition of early retirement at age 60 and the enforcement of age 65 as minimum age for full retirement was implemented much later for women. Therefore, women may respond less strongly to changes in unemployment benefits than do men.
Column (C) in Table A.1 shows retirement after long-term employment, which requires an insurance period of at least 35 years, and column (D) shows regular old-age retirement. These pathways remained unchanged during our period of interest (2004–2008). They allow full retirement at age 65 and early retirement for the long-term employed at age 63. 5
Reorganization of Unemployment Agencies
The UI 2006 reform was part of a larger labor market reform mandating the reorganization of the unemployment agencies. The related laws passed parliament in December 2002 (Hartz I) and December 2003 (Hartz II and III). Given that these reforms are directed at both younger and older workers and took place prior to our observation period, they should not affect our estimates.
Partial Retirement Subsidies
German UI subsidized partial retirement schemes in which employees work part time over the last (up to) six years of their employment contract. The subsidy was abolished for those who started their partial retirement after December 31, 2009. This change should not affect behavior in our focus period, however. 6
In sum, in testing our hypotheses, we account for anticipation of the 2006 reform, anticipation of the abolition of the 58 regulation, and for changes in retirement entry regulations. In addition, we investigate gender-specific effect heterogeneity.
Data and Method
Data, Sample, and Outcome Measures
We use administrative data collected by the UI. The Sample of Integrated Labour Market Biographies (SIAB) 7510 provides a random sample of 2% of all records covering all individuals who were in touch with the UI at least once between 1975 and 2010 (see vom Berge, König, and Seth 2013). 7 These data cover approximately 80% of the adult population excluding civil servants and the self-employed. The SIAB data provide employment biographies for more than one million individuals with either a period of employment subject to social security, unemployment benefit receipt, or job search. The data offer various advantages: Survey problems such as non-response do not exist, labor force transitions are observed based on daily reporting, and the sample describes the entire workforce subject to the regulations described above.
To test our hypotheses, our data cover March 2004 through December 2007; this provides periods of identical duration before and after the 2006 reform. We consider residents of East and West Germany, ages 40 to 64 (i.e., birth cohorts 1939 to 1967), and exclude workers in the construction and mining sectors because they face special regulations.
To be eligible for the maximum duration of unemployment benefits as described in Table 1, the unemployed must have contributed to the UI for a minimum number of months (“insurance months”) (for details see Table A.2). We follow Dlugosz et al. (2014) and concentrate on workers who are eligible for the maximum duration of unemployment benefits as they are fully affected by the reform (for details see Appendix B). Alternatively, we could use the full sample without regard to actual benefit claims. In this sample, however, not all individuals are affected by the reform. We also could use a sample of those workers who suffered at least some reduction in their claims as a consequence of the reform, even if they were not eligible for the full transfer duration. We offer robustness tests based on this latter sample in a later section.
We consider individuals’ labor force status at the beginning of a month. An individual who is in employment subject to mandatory social security contributions is coded as employed (state E). We code an individual as unemployed (state U) if the person receives unemployment benefits (Arbeitslosengeld I), which is our outcome of interest. Individuals who are in other labor force states (e.g., employed without mandatory social security payments, retired, out of the labor market) are coded as other (state O). 8 Our analysis sample describes 8.02 and 0.43 million person-month observations in employment and unemployment, respectively, during the 45-month period between March 2004 and December 2007. Our sample comprises 226,683 distinct individuals starting at least one spell of employment and 37,358 distinct individuals starting at least one spell of unemployment.
Our administrative data are provided by the unemployment insurance (UI). They are based on precise records on spells of unemployment (UI pays transfers) and spells of employment subject to social insurance contributions (UI collects contributions). UI does not offer information on employment that is not subject to social insurance contributions, such as self-employment and civil service employment. Also, UI does not offer precise information on out-of-the-labor-force spells. Moreover, our data are not informative about whether an individual searches for work without receiving unemployment benefits, dies, or leaves the country. We do not generally know whether individuals started to receive retirement benefits or private pensions. For these reasons, we do not explicitly analyze transitions into and out of the “other” category as part of our main analysis.
We focus, instead, on four types of labor market transitions: continued employment (E-E), job separations (E-U), job findings (U-E), and continued unemployment (U-U). We code a transition from state A to state B in month t if an individual was in state A on day one of month t and in state B on day one of month t+1. In total, 99.3 and 92.0% of all monthly transitions stay in the original states of employment and unemployment, respectively. Starting in employment, 0.26% of all monthly transitions are to unemployment (20,855 observations), and 0.41% (32,886 observations) to “other.” In addition, 2.89% of all monthly transitions from unemployment are into employment (12,436 observations) and 5.11% (21,988 observations) transit into “other.” Appendix Table A.3 shows the age group and gender-specific transition rates and sample sizes.
Method
We are interested in identifying the causal effect of the UI 2006 reform on labor market transitions of older workers. We consider a discrete time duration approach to model transitions between labor market states. Our empirical strategy applies a difference-in-differences estimator by which we compare the pre-reform (T=0) and post-reform (T=1) monthly labor force transitions for age groups affected (treatment group, G=1) and not affected (control group, G=0) by the reform. Our control group consists of individuals ages 40 to 44, as older workers are treated by the 2006 reform (see Table 1). 9 This approach identifies a causal treatment effect if the transitions of treatment and control groups would have continued to move in tandem without the reform. We address the validity of this parallel path assumption below.
We believe that the difference-in-differences research design is most appropriate for our investigation as it compares transitions before and after the implementation of the reform of interest. The setting of the reform in combination with the character of our data render a regression discontinuity design inappropriate for two reasons. First, the reform law generated substantial anticipation behavior (e.g., earlier entry into unemployment). This reform affected transition rates before and after the reform date. We cannot plausibly use time as a running variable to locally identify the causal effect because it is not randomly assigned: Individuals (and firms) selected the timing of labor market transitions. Second, our data do not provide the exact date of birth (only birth year). We use approximations of the actual age. This approach is appropriate in a difference-in-differences framework but excludes age as a running variable in an age-based discontinuity design. Our main estimation equation is:

where T and G are time and group indicators, X contains varying sets of control variables, Λ is the cumulative distribution function of the binary outcome (Y), and α, β, γ, and θ are parameters to be estimated.
Because our dependent variables indicate rare events—with average transition probabilities of below 1%—our estimation results are sensitive to the estimation approach. In such a situation, the predicted outcomes of linear probability models, which impose linearity in marginal effects, can differ substantially from those based on discrete choice models (Greene 2012: 729). We apply logit estimations to calculate reliable marginal effects. 10
To facilitate the quantitative and qualitative interpretation of the estimation results, we present coefficient estimates with standard errors clustered at the individual level and calculate marginal causal effects. We follow Puhani (2012) and determine the treatment effect of interest (τ) as the difference between two cross-differences, where Y0 and Y1 are potential outcomes without and with treatment:

Our dependent variable describes whether a given transition between two labor market states is observed for person i between months m and m+1; we consider indicators of age to represent treatment and control groups (G), and a post-reform indicator (post) as a period indicator (T).
The vector of control variables X contains two sets of measures (see Table A.4). One set (X1) contains general and sociodemographic characteristics: gender, education, federal state of residence, and state-level linear and quadratic time trends. We add controls for calendar month to capture seasonality and controls for calendar year to capture time trends and the business cycle. A second set of controls (X2) accounts for relevant institutions, intervening mechanisms, and regulatory changes, which we code based on the individuals’ year of birth, the period of observation, and the specific regulation. 11 We estimate the following model:

In a linear model, the coefficient estimate of the interaction of the post-reform indicator with the vector of age measures (γ) would yield the causal treatment effect. Since we estimate a nonlinear model, we calculate the treatment effect based on Equation (2). This approach allows us to test hypotheses H1–H4 regarding the effects of the 2006 reform on labor force transitions accounting for additional relevant institutional features. To help quantify the marginal effects, we additionally present relative marginal effects (RME), which relate the marginal effects to the age-group specific pre-reform mean transition rate for the considered outcome.
An additional aspect is relevant for the interpretation of our estimates. Under hypothesis H2, entry into unemployment changes as an effect of the reform. If the unobservable characteristics of individuals entering unemployment vary over time (e.g., only those with lower ability enter after benefit payout periods are reduced) and if these unobservables are correlated with subsequent transitions from unemployment, this selection into the state of unemployment may bias our estimates. We address this issue with a specific set of robustness tests.
Parallel Path Assumption
Our estimations identify causal treatment effects only if the parallel trends assumption holds. Without the reform, the development in labor market transitions for treatment and control groups should have followed parallel trends. Here, we offer two approaches to evaluate the validity of this assumption; later, we discuss placebo tests in the section on robustness tests.
First, we inspect graphic pre-reform trends in outcomes for treatment and control groups. Figure 1 presents the development of seasonally adjusted transition rates for the control group (ages 40–44) and the pooled treatment group (ages 45–64). The lines in the top left panel represent the propensity to remain employed (E-E transitions). The upward trends for control and treatment groups appear to run in tandem in the pre-reform period except for brief deviations at the end of 2004 for the control group. At the end of 2005, we observe a strong decline of the employment stays of the treatment group, which confirms that we have to account for anticipation behavior. The two groups’ monthly U-U transition rates (see top right panel) differ in levels. The rates for the control group are more volatile, yet, neither group experiences clear shifts in transition rates over time. The bottom left panel presents monthly unemployment entry rates (E-U transitions). The trends develop in parallel for treatment and control groups until the end of 2005. Here, again, we observe clear anticipation behavior of the treatment group as the transition rate of the treatment group sharply increases shortly before the reform. The lines in the bottom right panel represent U-E transitions, which—in levels and volatility—differ substantially for the two groups. Again, both groups appear to follow roughly parallel pre-reform trends. In sum, overall and particularly immediately prior to the anticipation and reform periods, the graphs suggest mostly parallel paths for the control and treatment groups.
Second, we offer significance tests of time trend differences. Based on data for the pre-reform (and, for transitions from E, the pre-anticipation) period, we estimate the following specification using a logit estimator:

We interact age indicators for the treatment group with measures of the time trend (t) controlling for the X1 and X2 vectors of covariates. The coefficient vector γ2 estimates the time trend for the control group; γ3 indicates whether the time trend differs significantly for the treated age groups. We consider the four relevant transitions and apply linear, quadratic, and cubic specifications of the monthly time trend. If the estimates of γ3 are jointly statistically significant, the identifying assumption does not hold and we cannot claim to establish causal effects.
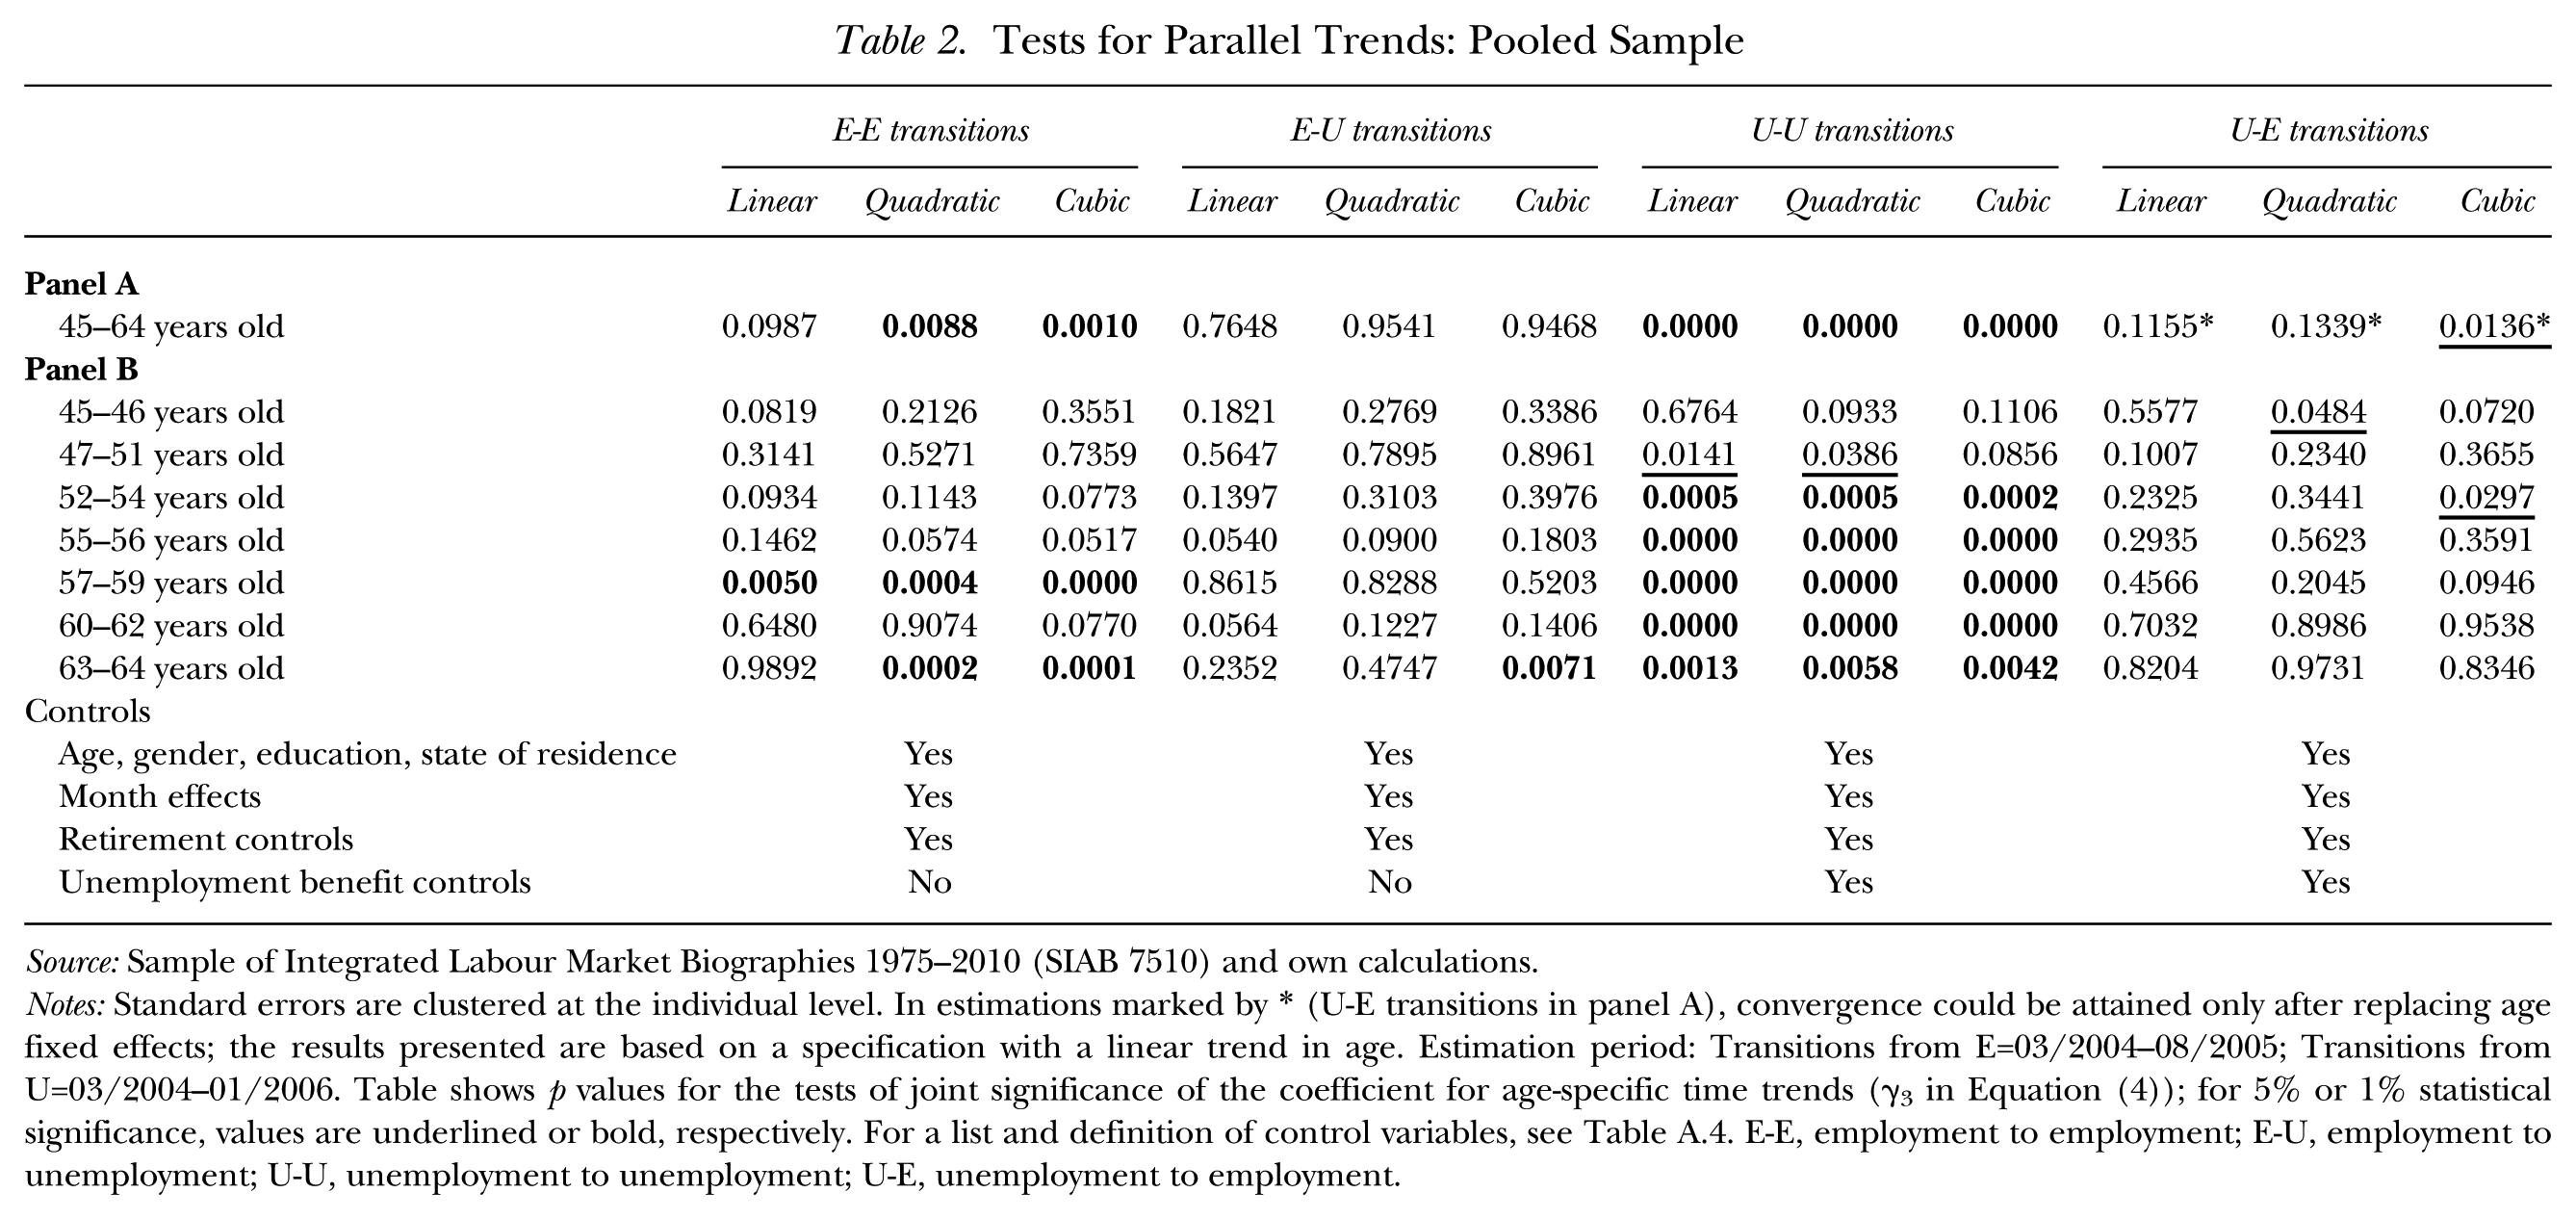
Table 2 presents the results of the hypothesis tests for the full sample: In panel A we consider the entire treatment group jointly, and in panel B we separately consider age groups that were dissimilarly affected by the reform (see Table 1). We show the p values of joint significance tests of γ3 for the functional forms of the time trend for our four transition outcomes. If the test yields statistical significance at the 5% or 1% level, the p value is underlined or marked in bold, respectively. 12 Across the four outcomes, we find distinct patterns. For the U-U transitions, the hypothesis of parallel paths is significantly rejected for the pooled sample and for most of the age-specific treatment groups, yet only a few age groups appear to follow significantly different time trends compared to the control group of 40 to 44 year olds for the other outcomes. For E-E transitions, we observe significantly different paths in the pooled treatment group and in two of the seven age groups (57–59 and 63–64). For E-U transitions, evidence reveals non-parallel paths for age group 63–64 when cubic terms are used. With respect to the U-E transitions, two interaction terms (out of 21) yield significant coefficient estimates. The results differ depending on the specification of the time trend functional form. Overall, these results suggest that our difference-in-differences estimates of U-U transitions may reflect dissimilar pre-reform trends and therefore do not present causal effects. This outcome may be attributable to a number of possible mechanisms including changes in the composition of the young unemployed, shifts in job finding rates and labor demand, or random fluctuations. In the other cases, no general indication of heterogeneous pre-reform trends is evident, confirming the patterns suggested by Figure 1. We consider this in our interpretation of findings and offer robustness tests controlling for group-wise time trends.
Tests for Parallel Trends: Pooled Sample
Source: Sample of Integrated Labour Market Biographies 1975–2010 (SIAB 7510) and own calculations.
Notes: Standard errors are clustered at the individual level. In estimations marked by * (U-E transitions in panel A), convergence could be attained only after replacing age fixed effects; the results presented are based on a specification with a linear trend in age. Estimation period: Transitions from E=03/2004–08/2005; Transitions from U=03/2004–01/2006. Table shows p values for the tests of joint significance of the coefficient for age-specific time trends (γ3 in Equation (4)); for 5% or 1% statistical significance, values are underlined or bold, respectively. For a list and definition of control variables, see Table A.4. E-E, employment to employment; E-U, employment to unemployment; U-U, unemployment to unemployment; U-E, unemployment to employment.

Transition Rates of Control and Treatment Groups from 01/2004 to 12/2007
Results and Robustness
Baseline Results
To determine the causal reform effects on older workers’ labor force transitions and to test our hypotheses, we estimate difference-in-differences models on samples of employed and unemployed workers and consider four transition outcomes (E-E, E-U, U-U, and U-E), each coded as a binary indicator.
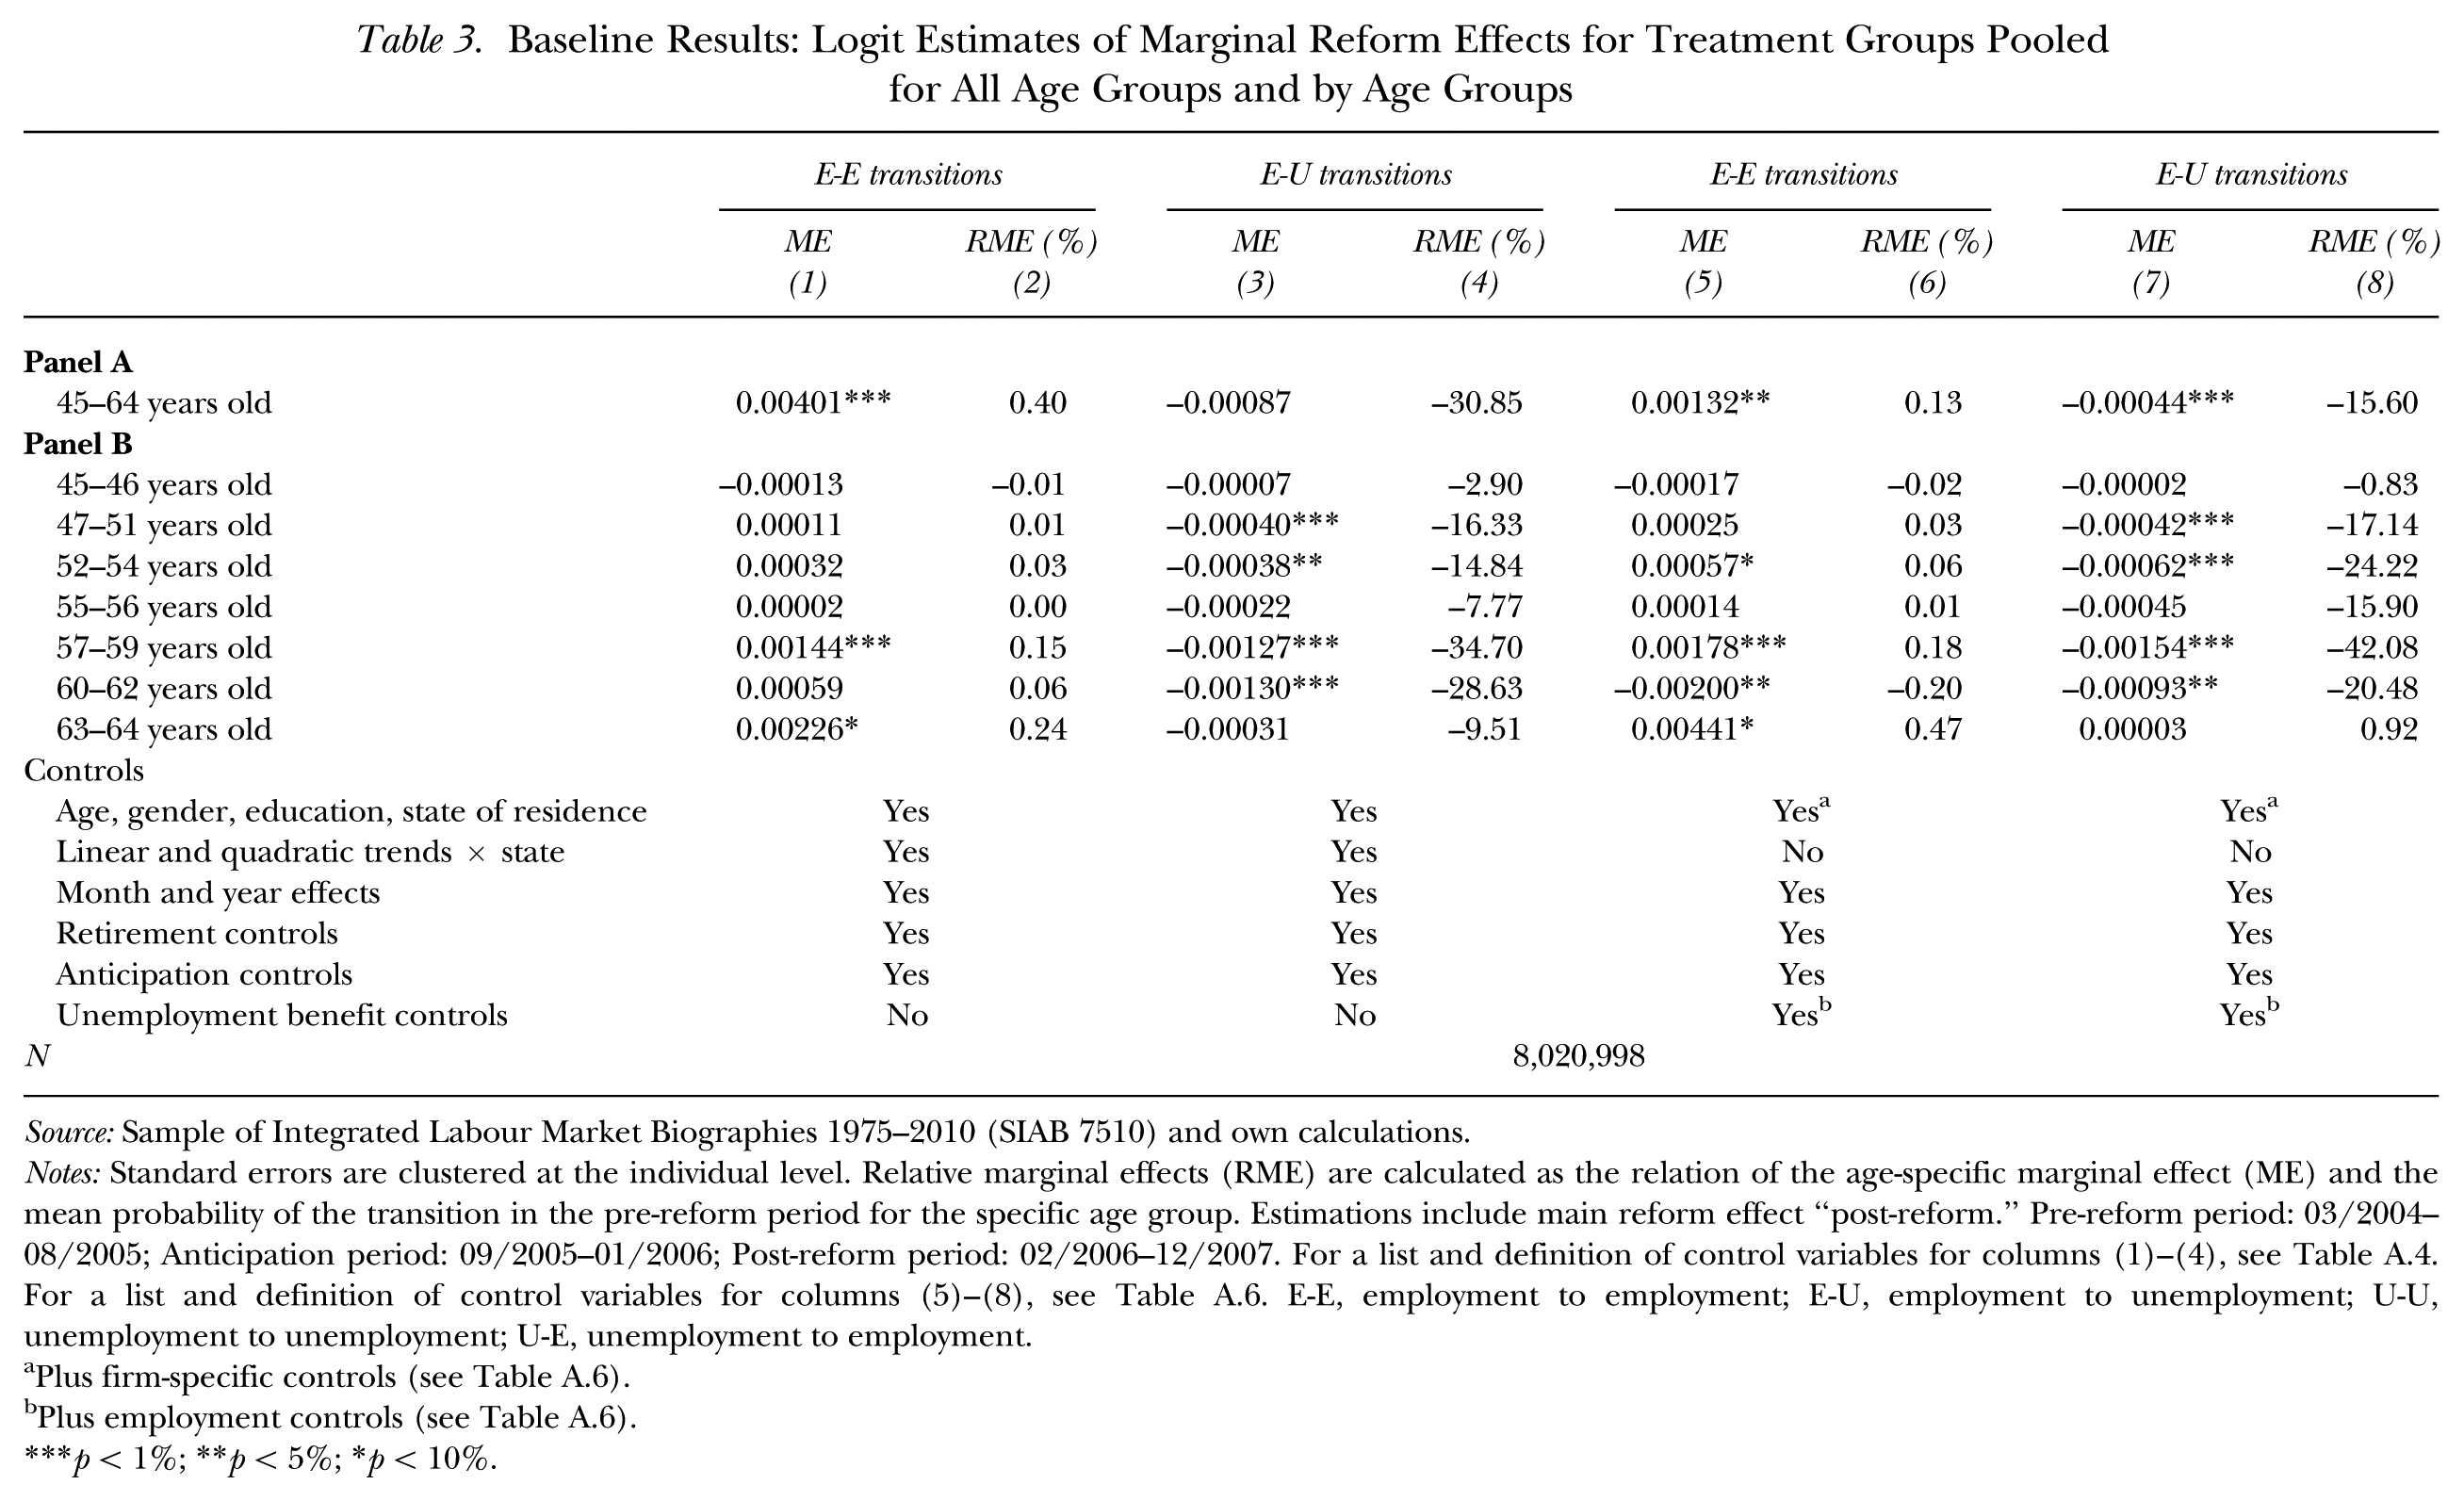
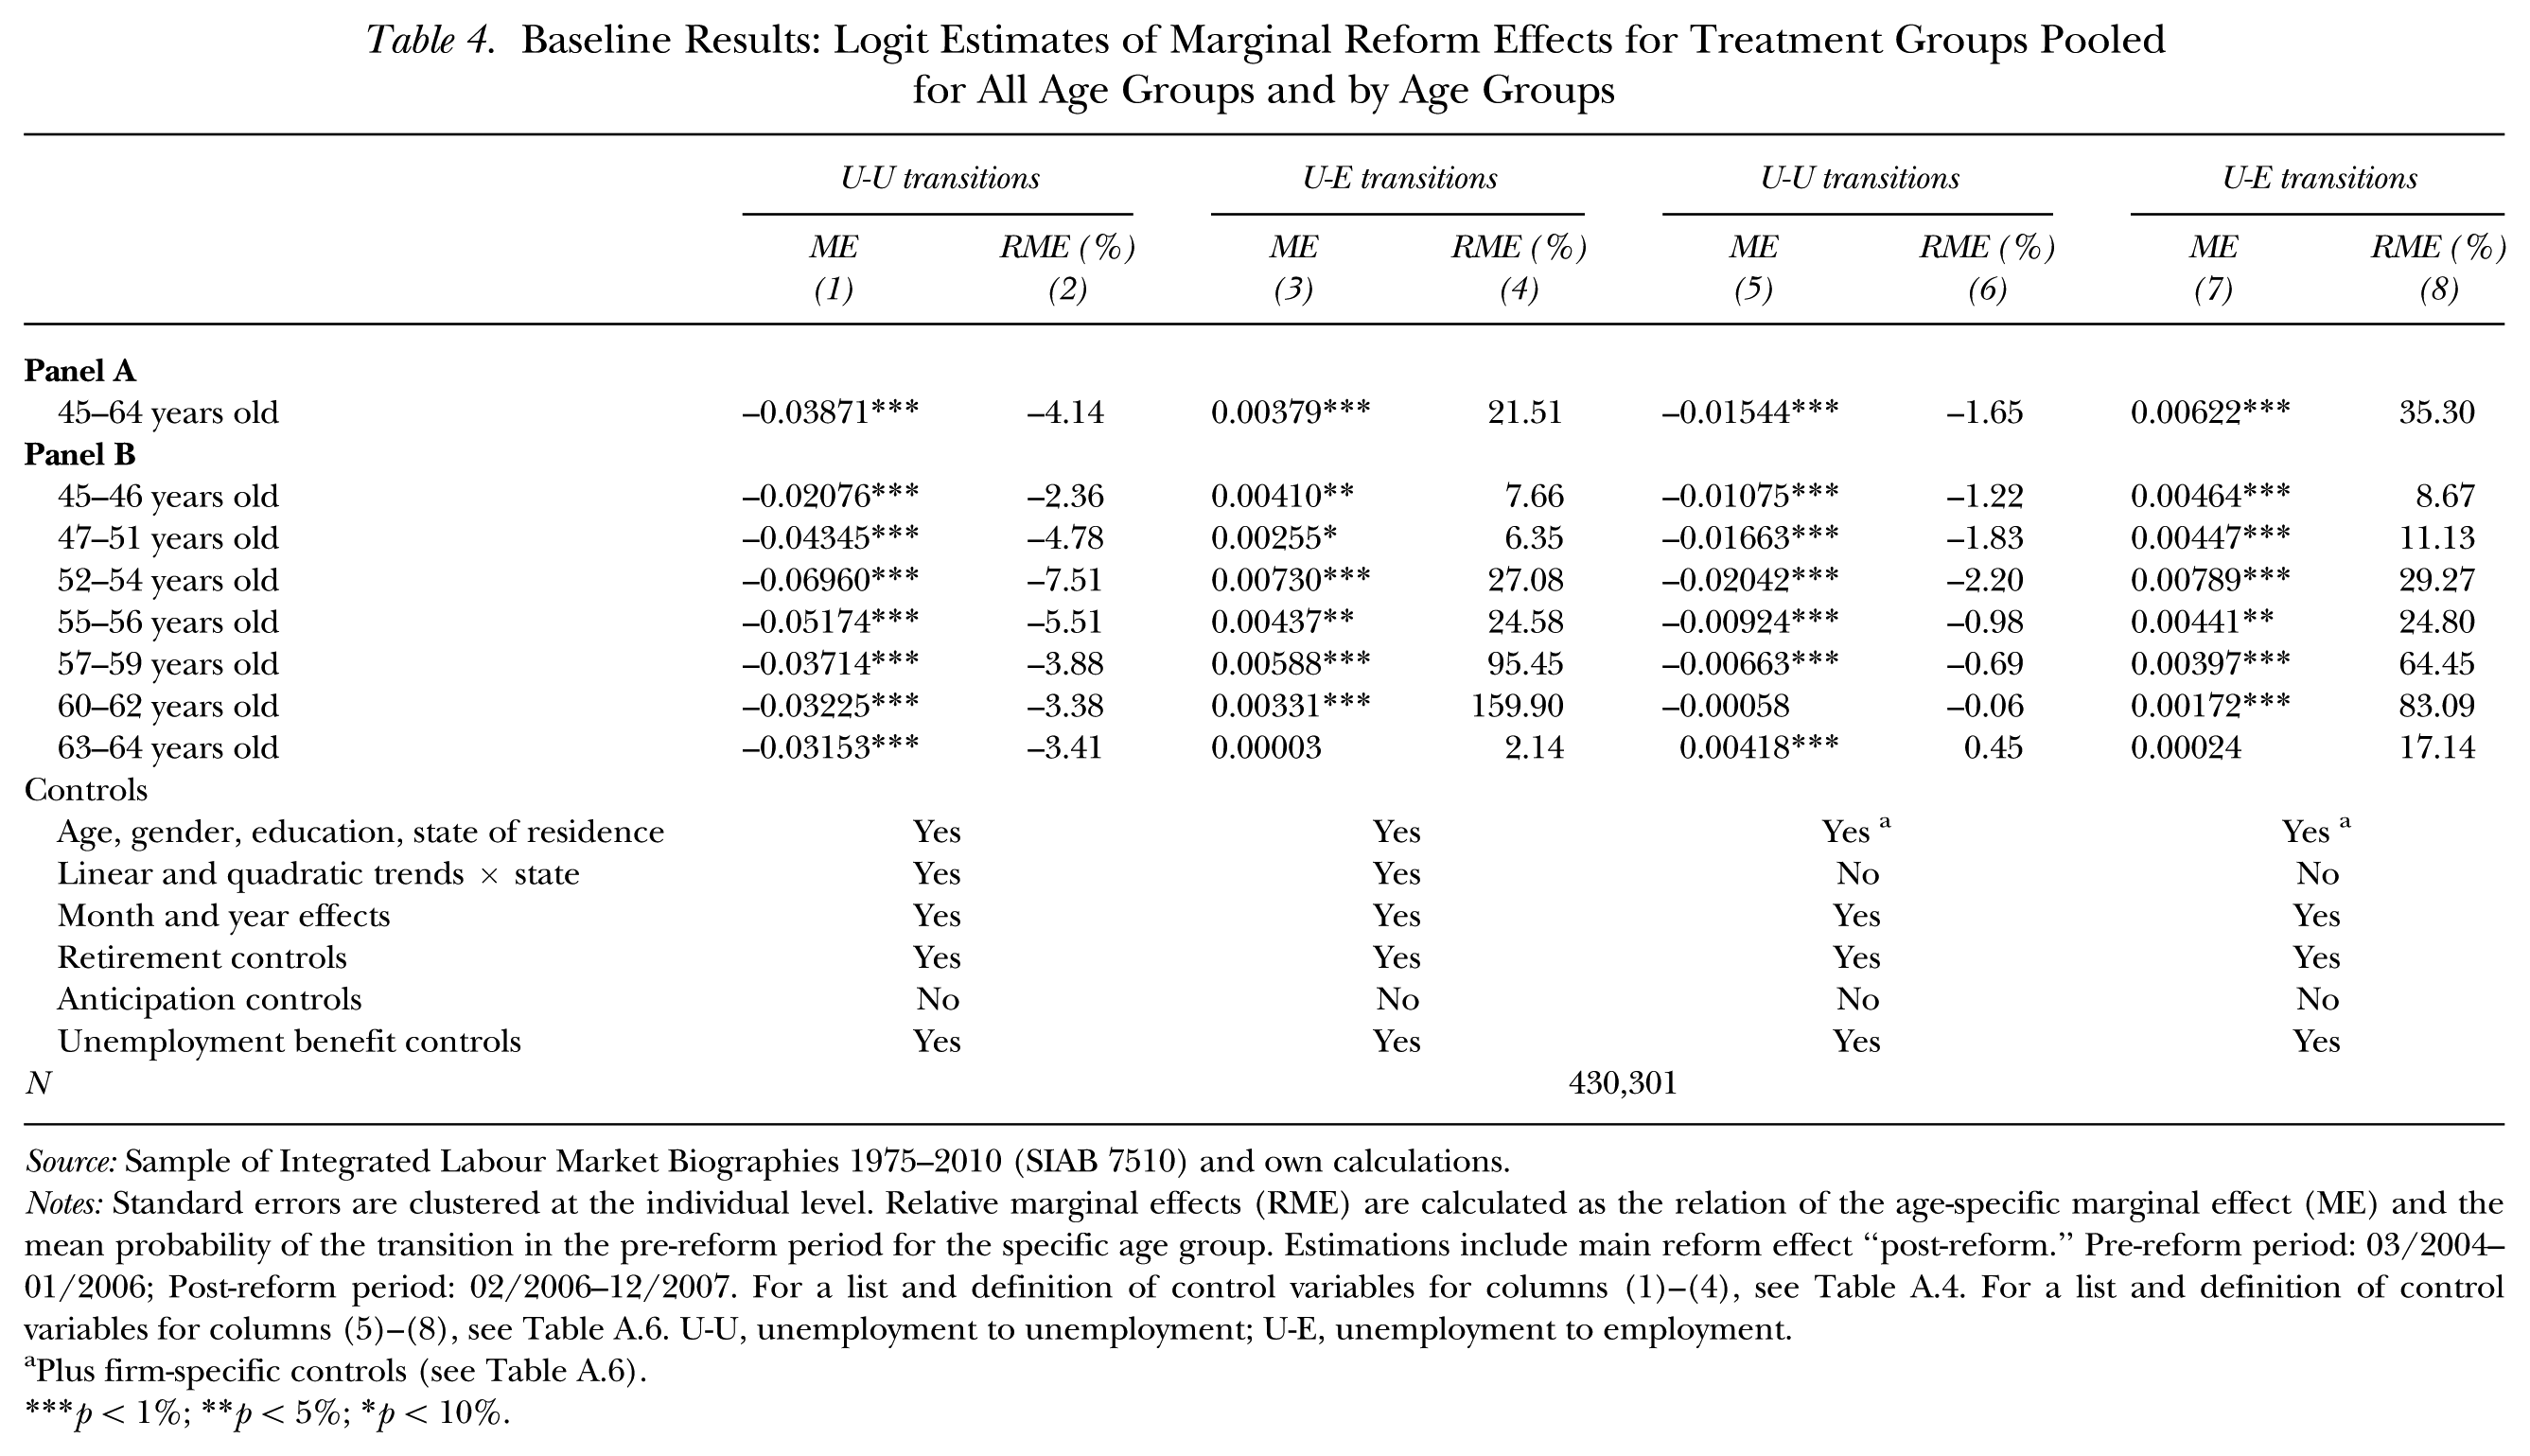
We estimated logit models of Equation (3): The individual coefficients mostly yield the expected sign and small standard errors (the Online Appendix presents coefficient estimates with standard errors clustered at the individual level). To interpret the estimated effects, we calculated marginal effects and their standard errors based on the delta method (see columns (1)–(4) of Tables 3 and 4).
Baseline Results: Logit Estimates of Marginal Reform Effects for Treatment Groups Pooled for All Age Groups and by Age Groups
Source: Sample of Integrated Labour Market Biographies 1975–2010 (SIAB 7510) and own calculations.
Notes: Standard errors are clustered at the individual level. Relative marginal effects (RME) are calculated as the relation of the age-specific marginal effect (ME) and the mean probability of the transition in the pre-reform period for the specific age group. Estimations include main reform effect “post-reform.” Pre-reform period: 03/2004–08/2005; Anticipation period: 09/2005–01/2006; Post-reform period: 02/2006–12/2007. For a list and definition of control variables for columns (1)–(4), see Table A.4. For a list and definition of control variables for columns (5)–(8), see Table A.6. E-E, employment to employment; E-U, employment to unemployment; U-U, unemployment to unemployment; U-E, unemployment to employment.
Plus firm-specific controls (see Table A.6).
Plus employment controls (see Table A.6).
p < 1%; **p < 5%; *p < 10%.
Baseline Results: Logit Estimates of Marginal Reform Effects for Treatment Groups Pooled for All Age Groups and by Age Groups
Source: Sample of Integrated Labour Market Biographies 1975–2010 (SIAB 7510) and own calculations.
Notes: Standard errors are clustered at the individual level. Relative marginal effects (RME) are calculated as the relation of the age-specific marginal effect (ME) and the mean probability of the transition in the pre-reform period for the specific age group. Estimations include main reform effect “post-reform.” Pre-reform period: 03/2004–01/2006; Post-reform period: 02/2006–12/2007. For a list and definition of control variables for columns (1)–(4), see Table A.4. For a list and definition of control variables for columns (5)–(8), see Table A.6. U-U, unemployment to unemployment; U-E, unemployment to employment.
Plus firm-specific controls (see Table A.6).
p < 1%; **p < 5%; *p < 10%.
In panel A of both Table 3 and Table 4 (columns (1)–(4)). we present our estimates of marginal reform effects for the pooled treatment group. The estimates yield the expected direction of reform effects: After the reform the propensity to stay employed (E-E) increased, the propensity to enter unemployment (E-U) decreased insignificantly, 13 the propensity to remain unemployed (U-U) fell, and the propensity to re-enter employment (U-E) increased on average for the treatment group. We calculated relative marginal effects (RME) by dividing the marginal effects by the mean of pre-reform transition rates in the considered age group. The propensity to remain employed increased by only 0.4% per month, which is attributable to the very high mean persistence in employment (see Table A.3). By contrast, the RME is largest—though statistically insignificant—for entry to unemployment (E-U). The two RMEs describing transitions out of unemployment are large, as well, with a significant decline in the propensity to stay unemployed (U-U) of 4% per month and a significant increase in the monthly job finding rate (U-E) of approximately 22%.
These results show that the reform had independent effects on the four transitions we consider. Indeed, that we see differences in the reform effects for H1 and H4, and for H2 and H3, suggests that the reform also affected transition into the “other” labor force state. Given our controls for other institutional changes (e.g., regarding retirement), this reflects effects of the unemployment benefit reform.
The marginal effects in panel B in both Table 3 and Table 4 show treatment effects by age group. With only one exception (age group 45–46 in column (1) of Table 3), all age-group-specific results show the same direction as the pooled results in panel A. Generally, the estimates for age groups that suffered the largest decline in benefit duration (see Table 1) show the largest and most statistically significant reform effects. For example, columns (1) and (2) of Table 4 suggest that for all age groups the reform reduced the propensity to enter unemployment with significant effects. Although the 55–56 year olds lost 8 months in unemployment benefit duration, those in the younger (52–54) and older (57–64) age groups lost 14 months and show stronger responses. Perhaps surprisingly, we do not obtain statistically significant estimates for E-U transitions in the oldest age group (63–64). Columns (1)–(4) of Table 4 describe reform effects on transitions from unemployment. The propensity to stay unemployed (columns (1)–(2)) declined and the job finding rate (columns (3)–(4)) increased for all age groups, in part substantially.
In columns (5)–(8) of Table 3 and Table 4, we show the results we obtain when using the set of controls used in Dlugosz et al. (2014). 14 With these estimates, we test how our controls for institutional features and especially our additional retirement controls affect the results. Compared to our preferred results, the estimates in panel A differ—in part substantially—in magnitude and significance. The estimates in panel B also partially differ in magnitudes, but mostly show similar signs and significance. Of particular interest is the change of direction and statistical significance of the marginal effect estimates of the older age groups. It is for these age groups that we expect our controls, and especially the retirement controls, to matter most. The results confirm this. Without our set of controls, we find a significant decline of E-E transitions for the 60–62 year olds (see column (5) of Table 3) as well as a significant positive reform effect on U-U transitions of the 63–64 year olds.
To illustrate the estimated effect sizes, we first calculate the mean duration in a given state prior to the reform (not shown). If, for example, we consider the 60–62 age group and invert the transition rates, the average period in employment prior to any transition is approximately 43 months (E-E), the time until a transition to unemployment is almost 15 years (E-U), the duration of unemployment is about 22 months (U-U), and the time until finding a job after unemployment is on average approximately 40 years (U-E). The latter reflects a very unusual outcome in this age group. Our RME estimates in columns (2) and (4) of Table 3 suggest that uninterrupted stays in E for this age group are extended by about one month, employment prior to job loss is approximately 4.5 years longer, time in uninterrupted unemployment spells decreases by about 9 months, and the time until finding a job declines from 40 years to 15 years on average. The uninterrupted periods in employment and unemployment change little, and the rates of job loss and job finding adjust more strongly after the reform.
In addition, we calculated the marginal and relative effects per month of benefit reduction for each age group. We obtain the largest effects again for U-E transitions for which the reduction of unemployment benefit duration by one month increases monthly transition rates between 1.9 and 11.4% (see Online Appendix).
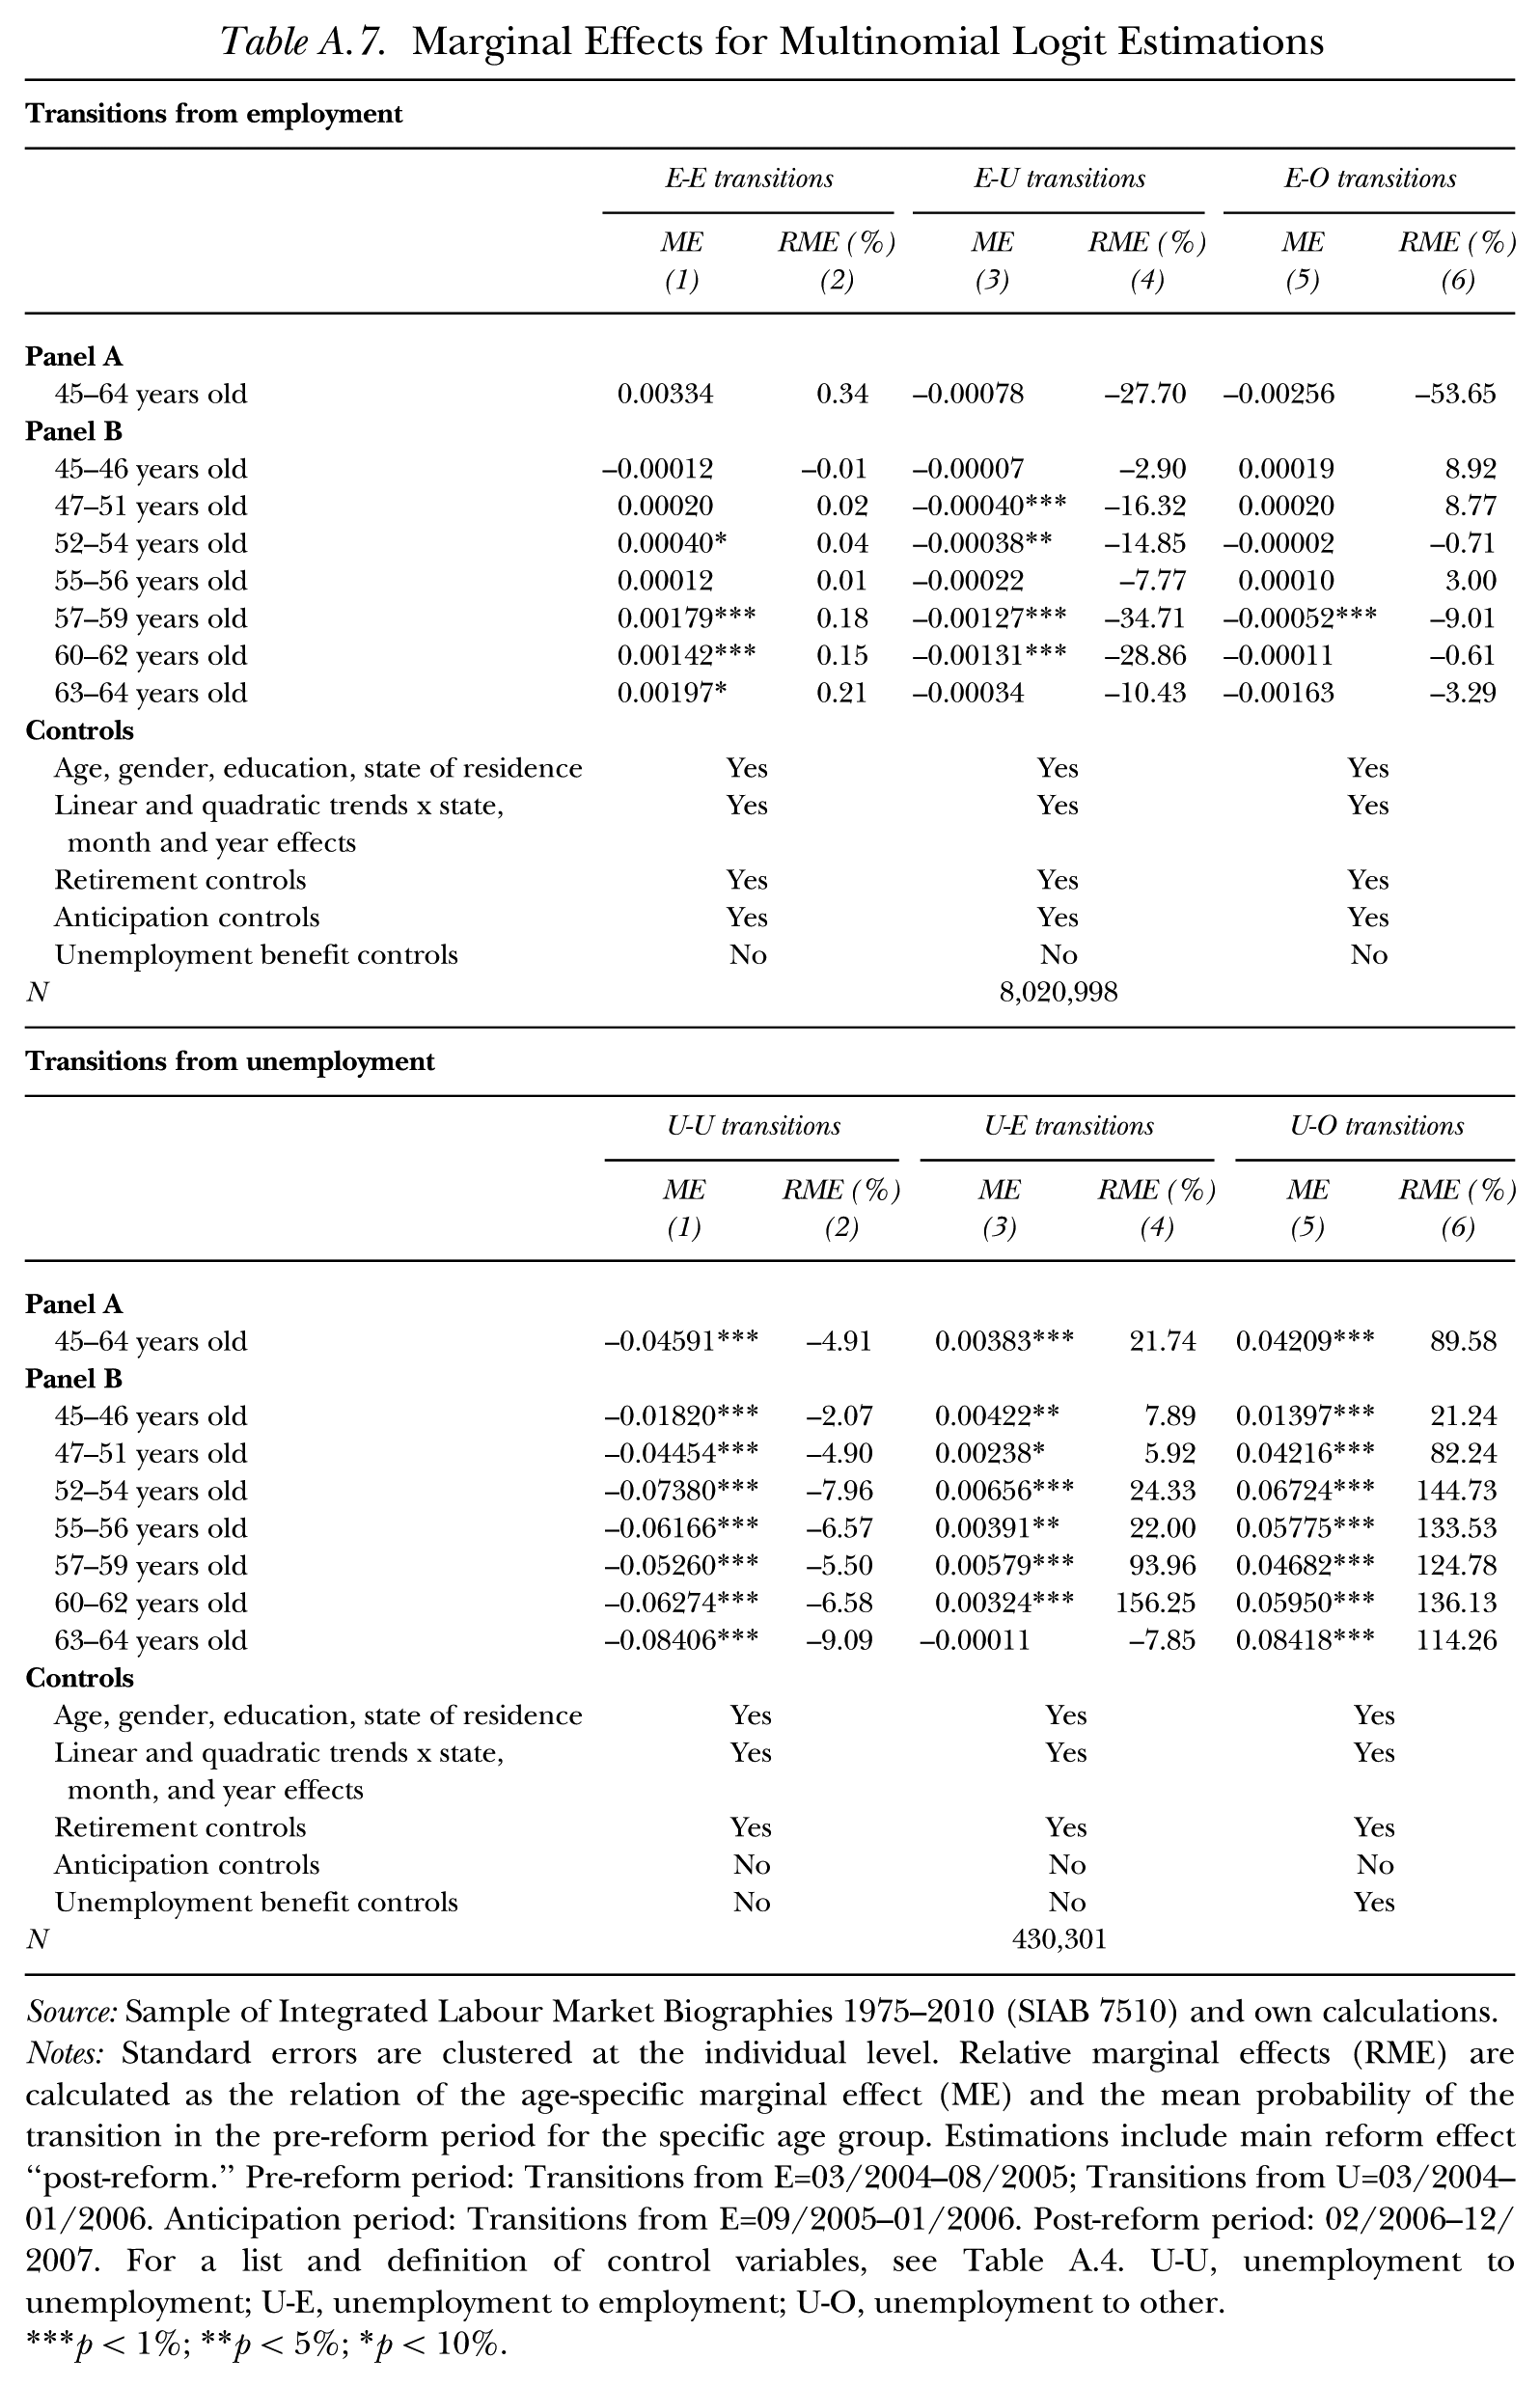
Overall, these results show that the reforms indeed had effects consistent with our hypotheses: For employed workers, the reforms reduced entry into unemployment and encouraged workers to remain employed. For unemployed workers, the reforms increased the probability of finding a job and reduced the probability of remaining unemployed. It is also possible that the reforms affected transitions into the “other” category. Although transitions into and out of the “other” category is not our main focus, Table A.7 in the Appendix presents multinomial logit results by age group including this “other” category. For panel A, we find that transitions into and out of employment and unemployment are very similar in magnitude and significance compared to the results in Tables 3 and 4 with the only exception of E-E transitions; also, for panel B we obtain results very similar to those observed before. Columns (5) and (6) of Table A.7 show (relative) marginal effects for transitions to O. Generally, we do not find significant reform effects on transitions from E to O, suggesting that reduced unemployment entry is not reflected in labor force exits. By contrast, we find a significant increase in transitions from unemployment to O in panels A and B. Given that relevant pension reforms are accounted for, we conclude that the shortening of unemployment benefit duration did not only incentivize older workers to move from unemployment to employment but might also have encouraged labor force exit or employment in “other” environments, such as self-employment.
Heterogeneity by Gender and Education
We discussed earlier that retirement insurance regulations may allow women—in contrast to men—to access early retirement at age 60 even without prior unemployment spells. Also, women may enter normal retirement prior to age 65, see Table A.1. 15 Females might thus respond less to the unemployment benefit reform of 2006. To investigate gender-based heterogeneities, we re-estimated our models of Tables 3 and 4 (columns (1)–(4)) separately for male and female subsamples. We show coefficient estimates and age-group-specific results (similar to panel B in Tables 3 and 4) in the Online Appendix. The first two rows of Table 5 present the (relative) marginal effects of the pooled treatment group separated by gender, which are mostly statistically significant. Although we expected larger reform effects for males than for females, we find the opposite pattern. Thus, either the share of females using the female retirement option is too small to affect the overall female response, or female labor force participation choices respond more strongly to financial incentives than do those of men. 16
Heterogeneity of Reform Effects by Gender and Education for Treatment Groups Pooled for All Age Groups

Source: Sample of Integrated Labour Market Biographies 1975–2010 (SIAB 7510) and own calculations.
Notes: Standard errors are clustered at the individual level. Relative marginal effects (RME) are calculated as the relation of the age-specific marginal effect (ME) and the mean probability of the transition in the pre-reform period for the specific age group. Estimations include main reform effect “post-reform.” Pre-reform period: Transitions from E=03/2004–08/2005; Transitions from U=03/2004–01/2006. Anticipation period: Transitions from E=09/2005–01/2006. Post-reform period: 02/2006–12/2007. For a list and definition of control variables, see Table A.4. The estimations in rows 1 and 2 omit controls for gender and the estimations in rows 3, 4, and 5 omit controls for education. E-E, employment to employment; E-U, employment to unemployment; U-U, unemployment to unemployment; U-E, unemployment to employment.
p < 1%; **p < 5%; *p < 10%.
In addition, the effect of reduced unemployment benefit duration may differ depending on workers’ human capital. Workers with little formal education may be under stronger financial pressure, and they may experience greater difficulties in finding and retaining employment than are better-educated individuals. We split samples based on educational groups (see Tables A.4 and A.5) and estimate our models separately for these subsamples. The bottom rows of Table 5 present the (relative) marginal effects. (For coefficient estimates—also by age groups—see the Online Appendix.) Generally, approximately half of the marginal effects estimates are statistically significant. Across education groups, we find indeed the largest reform effects among those with low education. This heterogeneity may be attributable to better job opportunities for the highly educated.
Placebo and Robustness Tests
So far, we found that the 2006 unemployment benefit reform went along with and potentially caused increased persistence in employment, reduced persistence in unemployment, reduced unemployment entries, and increased unemployment exits. We obtained these results for our preferred specification given certain assumptions regarding sample selection, standard error calculations, and the choice of an estimator. In this section, we offer results from placebo tests to evaluate our identification strategy and to investigate whether the results are robust to modifying our procedures.
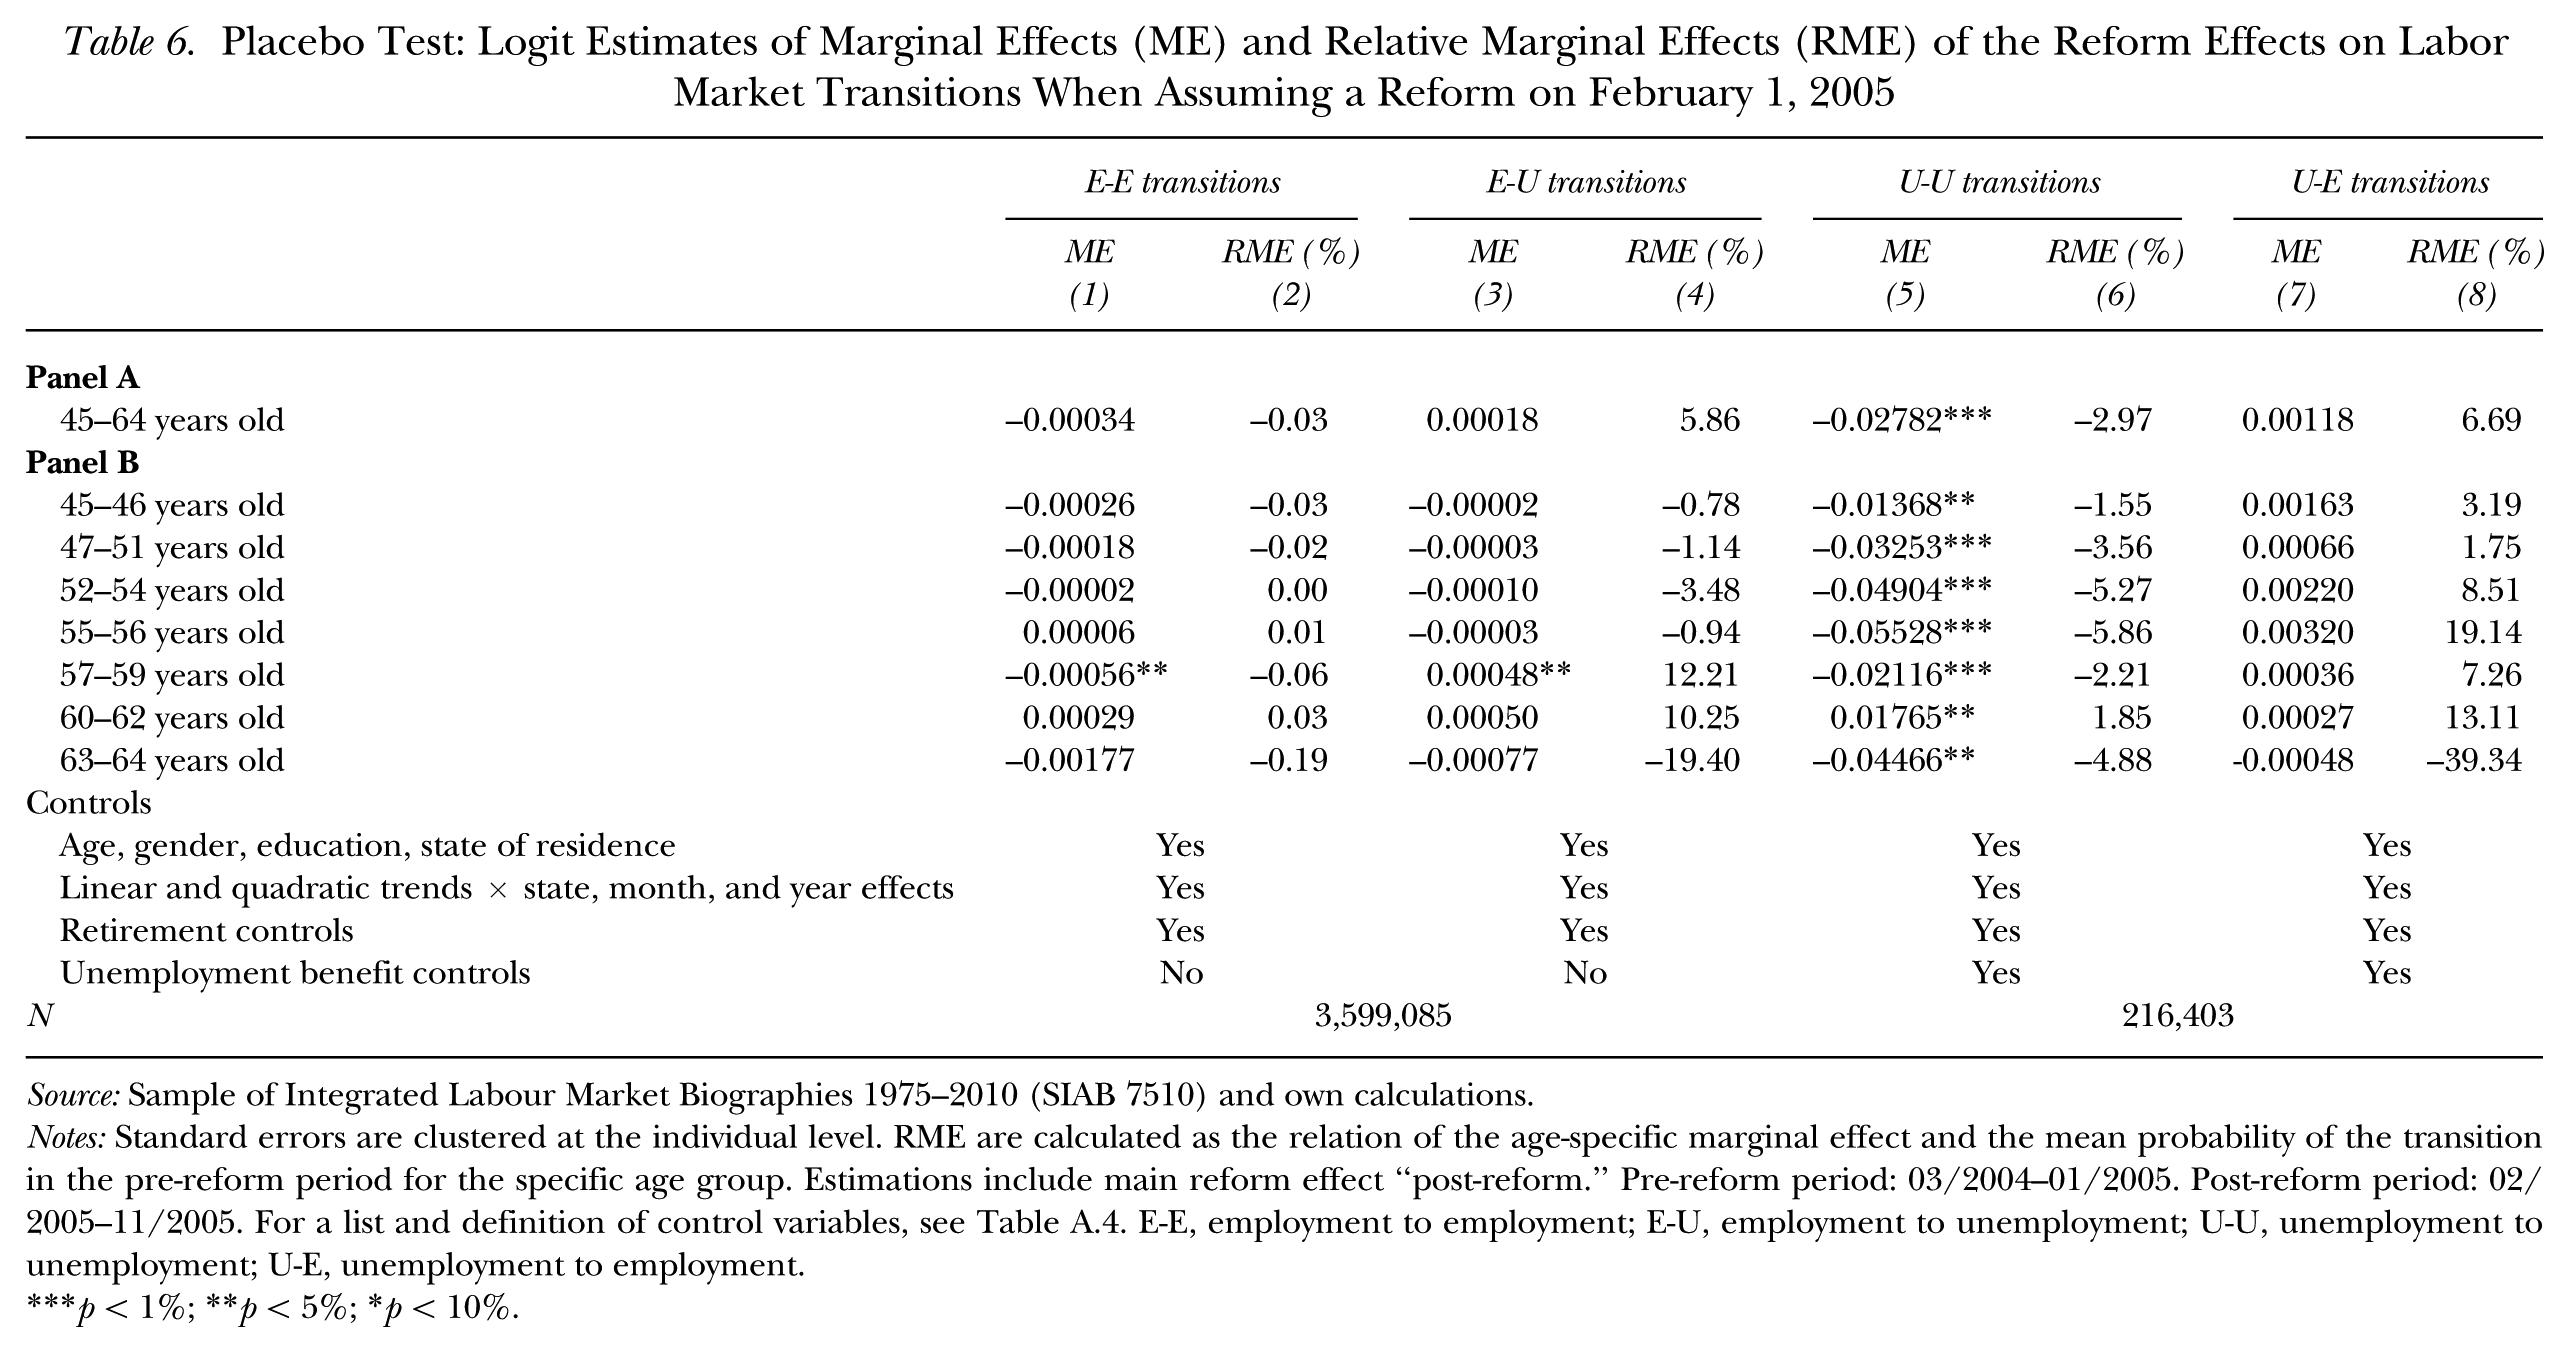
First, we conduct a placebo test of the parallel path assumption. Table 6 presents marginal effects obtained after we set the reform date to February 1, 2005, rather than February 1, 2006, and considered transitions between March 2004 and November 2005. This approach avoids the period of the actual reform and most of its anticipation period. Except for U-U transitions, the marginal effects in panels A and B either show the opposite sign of the baseline results or are statistically insignificant. This outcome confirms the conclusions based on Table 2: Except for the U-U transitions, we have no reason to doubt our identifying assumptions. We obtained very similar results with alternative placebo reform tests, which can be found in the Online Appendix.
Placebo Test: Logit Estimates of Marginal Effects (ME) and Relative Marginal Effects (RME) of the Reform Effects on Labor Market Transitions When Assuming a Reform on February 1, 2005
Source: Sample of Integrated Labour Market Biographies 1975–2010 (SIAB 7510) and own calculations.
Notes: Standard errors are clustered at the individual level. RME are calculated as the relation of the age-specific marginal effect and the mean probability of the transition in the pre-reform period for the specific age group. Estimations include main reform effect “post-reform.” Pre-reform period: 03/2004–01/2005. Post-reform period: 02/2005–11/2005. For a list and definition of control variables, see Table A.4. E-E, employment to employment; E-U, employment to unemployment; U-U, unemployment to unemployment; U-E, unemployment to employment.
p < 1%; **p < 5%; *p < 10%.
In a first set of robustness tests, we address an issue mentioned in our section on methods, that is, the selection into unemployment may have changed over time. 17 To test whether this might affect the estimated effects on transitions from unemployment, we offer additional robustness checks (see Table 7). First, to avoid anticipation-related selection, we drop observations from the sample that had entered unemployment in the three months preceding the reform (November 1, 2005–January 31, 2006). Compared to the baseline results in Tables 3 and 4 (columns (1)–(4)), the marginal effects (see row 2 of Table 7) change very little with this adjustment. In a second test, we drop all observations in the state of unemployment after February 1, 2006, which had entered unemployment prior to February 1, 2006. The results (see row 3 of Table 7) are slightly smaller in magnitude but remain highly statistically significant. Third, to limit the relevance of unobservable characteristics, we compare transitions from unemployment before and after the reform only for those who had been unemployed for less than 3, 6, 9, and 12 months. The reform effects (see rows 4–7) are smaller for unemployment spells of shorter duration but maintain the expected direction and statistical significance. In sum, the potential selection does not appear to affect our results substantively.
Marginal Effects (ME) for Robustness Tests Affecting Transitions from Unemployment Pooled for All Age Groups
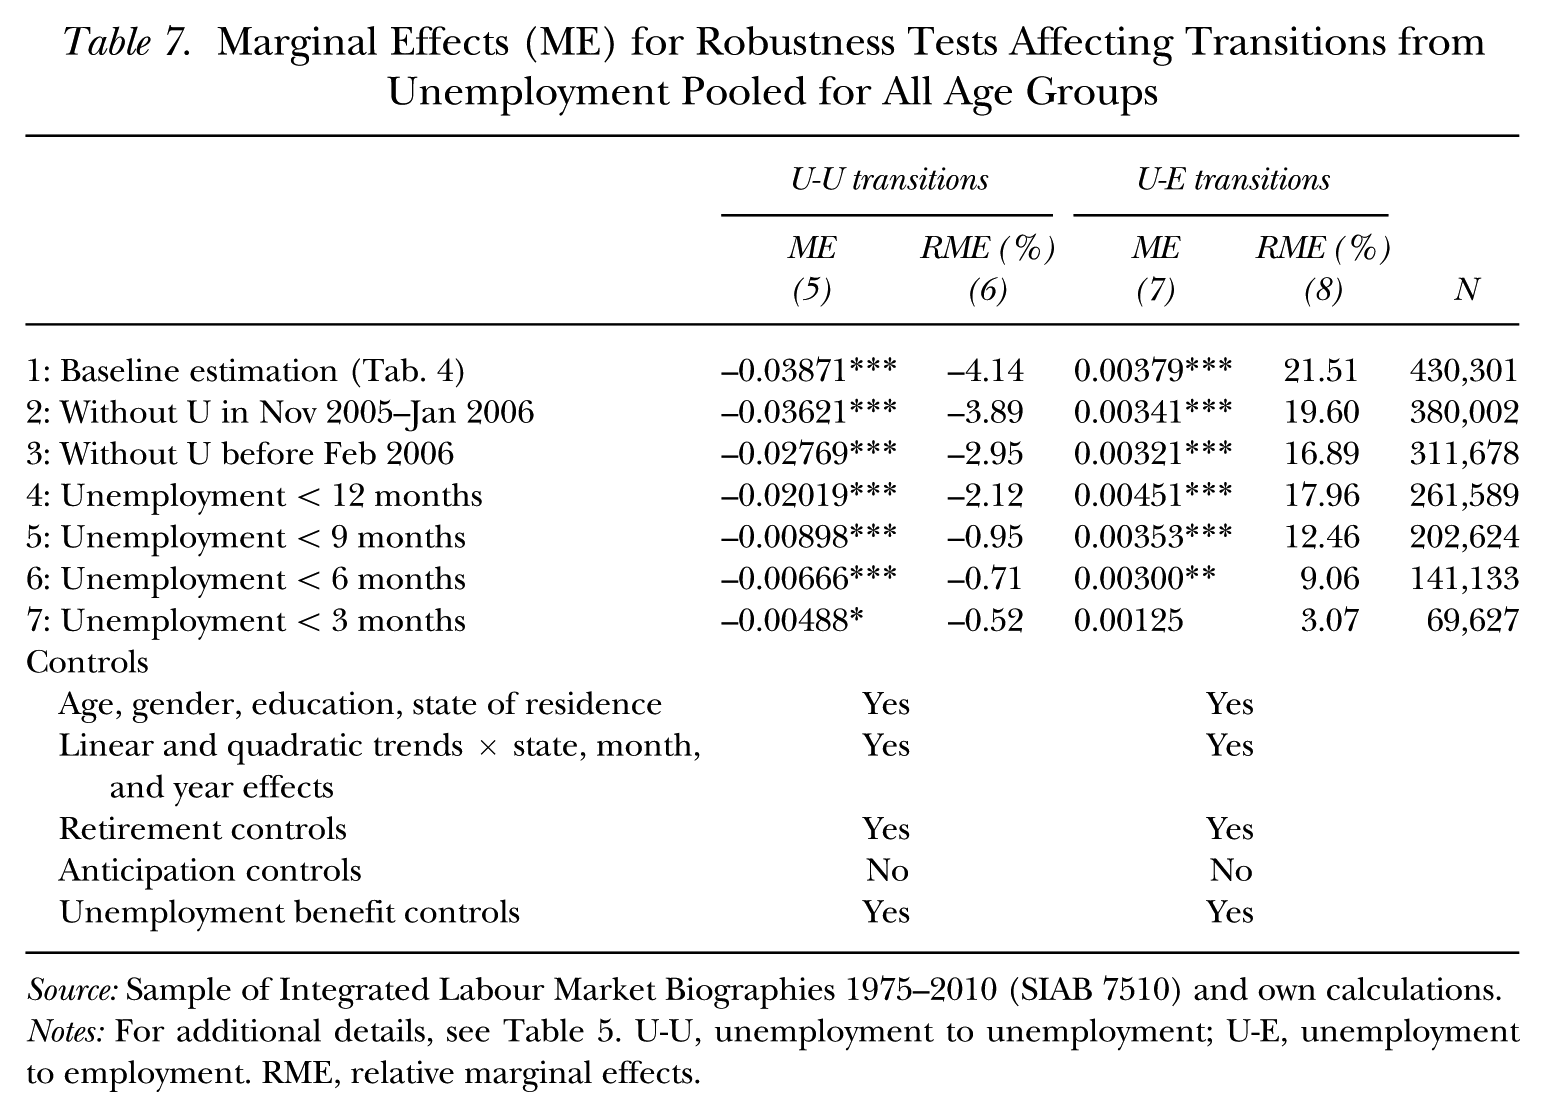
Source: Sample of Integrated Labour Market Biographies 1975–2010 (SIAB 7510) and own calculations.
Notes: For additional details, see Table 5. U-U, unemployment to unemployment; U-E, unemployment to employment. RME, relative marginal effects.
Table 8 presents a set of additional, more general tests. First, we extend our sample of observations. We include not only those workers who can claim the maximum duration of unemployment benefits based on their past labor market career but also those who are at least somewhat affected by the reform. As an example, all 45 year olds who had not yet accumulated 39 insurance months prior to an unemployment spell (but, instead only 32, for example) could not claim 18 months (but only 16) of unemployment benefit pre-reform (see Table A.2). Therefore, they did not experience the full reform-induced decline from 18 months to 12 months of benefit payout. Table 8, row 2 shows the estimated marginal effects with a thus enlarged sample. Compared to the baseline results of Tables 3 and 4 (panel A, columns (1)–(4)) reprinted in row 1 of Table 8, the estimates in row 2 confirm the robustness of our main findings: the patterns of signs, significance, and (relative) marginal effect sizes are very similar. The effect for transitions from employment to unemployment is now estimated more precisely.
Robustness Checks of Reform Effects for Treatment Groups Pooled for All Age Groups
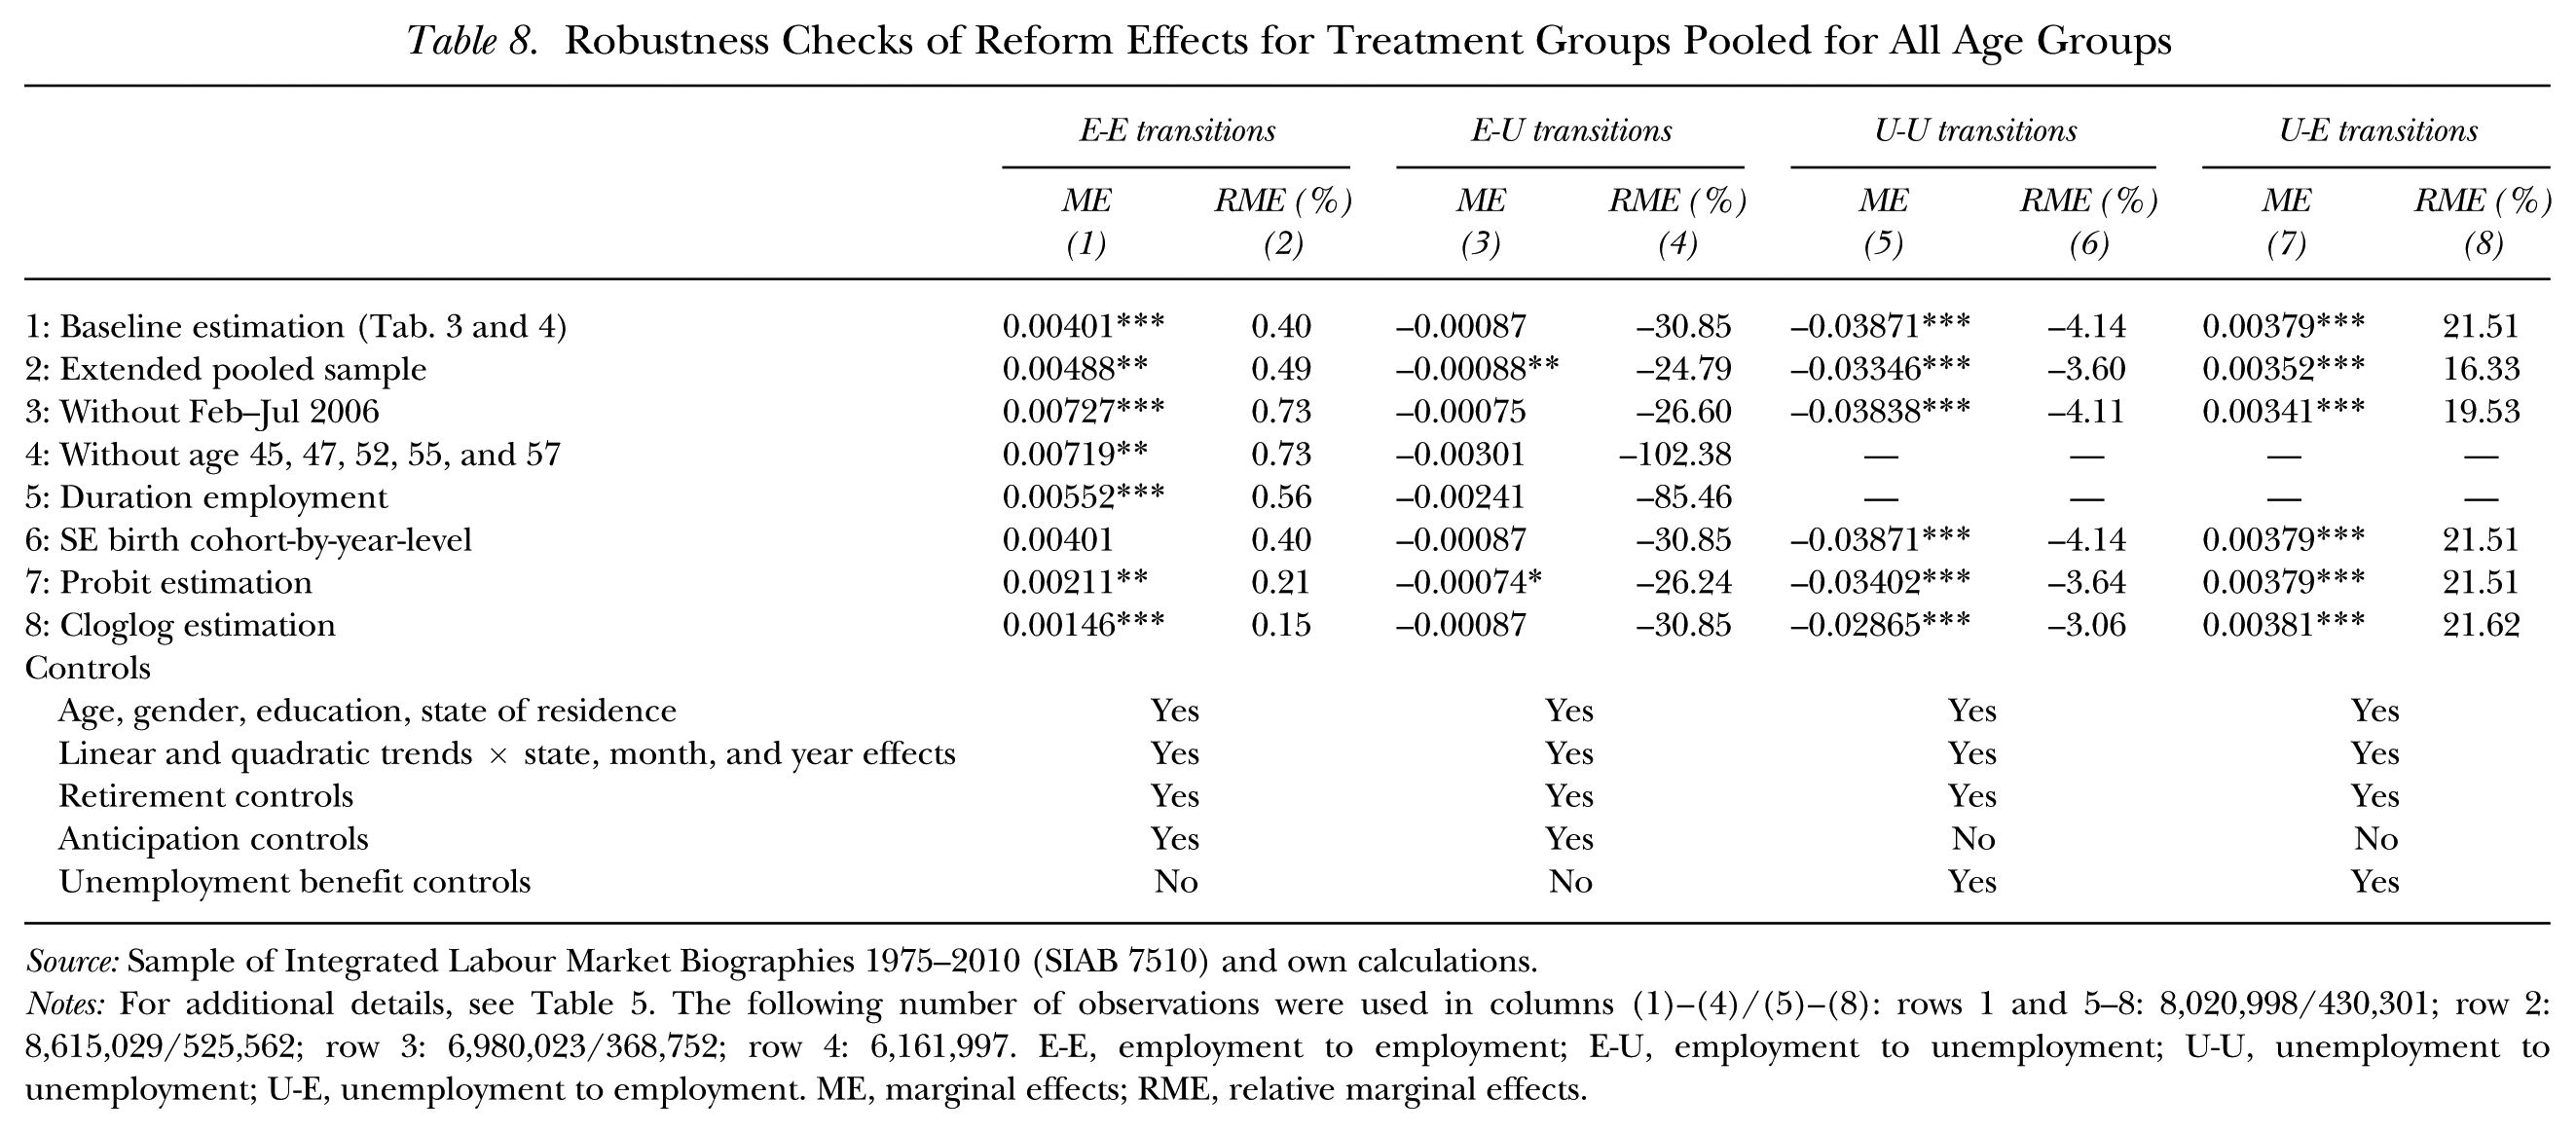
Source: Sample of Integrated Labour Market Biographies 1975–2010 (SIAB 7510) and own calculations.
Notes: For additional details, see Table 5. The following number of observations were used in columns (1)–(4)/(5)–(8): rows 1 and 5–8: 8,020,998/430,301; row 2: 8,615,029/525,562; row 3: 6,980,023/368,752; row 4: 6,161,997. E-E, employment to employment; E-U, employment to unemployment; U-U, unemployment to unemployment; U-E, unemployment to employment. ME, marginal effects; RME, relative marginal effects.
We perform a second test to evaluate a selectivity dimension in our data. While we explicitly control for anticipation behavior prior to the reform, we do not account for the potential mechanical effect of such anticipated transitions on post-reform transition. As an example, the propensity to leave unemployment for employment may be subdued soon after February 2006 if numerous workers simply moved their unemployment entry forward to complete it prior to February 1. As a result, there may be a reduced risk of job loss in the months immediately afterward. To test whether such mechanisms affect our findings, we apply a “donut-estimator” and re-estimate the model after omitting observations from periods right after the reform. In row 3 of Table 8, we show the estimated (relative) marginal effects after omitting the months February to July 2006. 18 Our estimates are robust. Perhaps surprisingly, the marginal effects for E-E transitions increase in magnitude compared to the baseline estimates. The results for the other transitions are confirmed. 19
A third aspect refers to the specific incentives that derive from the discrete jumps in the duration of benefit receipt at certain ages. These jumps generate incentives for “almost unemployed” workers close to the age cutoffs of age 44, 46, 51, and 56 pre-reform and at 54 post-reform to postpone unemployment entry. Since these incentives differ before and after the reform, they may bias our estimates for transitions from E. We repeat our estimations omitting individuals of the relevant ages and show the results for transitions from employment in row 4 of Table 8. We find that the estimates of the reform effect increase in magnitude. This outcome suggests that the age-specific incentives attenuated our estimates, which are confirmed, however, in direction and significance.
In duration models, the omission of controls for duration dependence may cause biased estimation results. In our models for transitions from unemployment, we account for the duration of the ongoing spell. In our fourth test, we add controls for the duration of the ongoing spell in models for transitions from E as well. The marginal effects (see row 5 of Table 8) increase in magnitude and are robust in sign and significance.
In our fifth test, we change the way in which standard errors are computed. Whereas we allowed for clusters at the individual level so far, we now cluster at the cohort and calendar year level because that is the level at which the reform affects workers. We show the estimated marginal effects in row 6 of Table 8. Clustering the standard errors at a more conservative level eliminates the statistical significance of the reform effects on E-E transitions. As the other estimates did not change in important ways, we conclude that our results are not attributable to unaccounted correlation patterns of unobservable error terms.
Next, we evaluate to what extent the results are robust to the choice of an estimator. We first replaced the logit by a probit and then by a complementary log-log model. The estimates of the marginal effects in rows 7 and 8 of Table 8 confirm that the results are highly robust to the choice of an estimator.
Conclusions
When we observe vast changes in labor force participation, it is important to understand the underlying processes. This insight is of particular and international interest if the observed change is one that is relevant and desired for many labor markets. We study a potential determinant of the dramatic rise in older workers’ labor force participation in Germany, where since 2000 the population share of employed older workers (age 55–64) increased by 53% for men and by 110% for women.
Since the literature disagrees on the relevance of the institutional framework, we investigate whether labor market reforms affect older workers’ transitions between labor force states. We focus on a reform of unemployment benefit duration implemented in February 2006 that shortened unemployment benefit payout by between 6 and 14 months for workers above age 44. Based on a difference-in-differences estimator we compare the change in labor force transitions of workers affected and not affected by the reform.
We consider a setting with three labor force states (employment, unemployment, other). Based on a search theory rationale, we expect that shortened unemployment benefit payout reduces the propensity to enter unemployment (E-U) and to leave employment (E-E); also, it should increase the propensity to take up employment (U-E) and to leave unemployment (U-U). We test these hypotheses while considering a number of institutional developments; we account for potential anticipation behavior, which has been found in prior research (Dlugosz et al. 2014). Moreover, we carefully control for changes in retirement regulations that might affect labor market choices. Our precise administrative data offer large sample sizes.
We find that the reduction of unemployment benefit payments affected the transition rates of older workers in the ways we expected. Compared to a reference group of 40 to 44 year olds for whom benefit payout did not change, we find that after the reform job exit rates declined, job finding rates increased, the propensity to stay in employment increased, and the propensity to stay in unemployment declined. We observe the largest behavioral adjustments among those affected most strongly by the reform. We cannot interpret all of our findings as causal effects. This is particularly the case for U-U transitions and for certain older age groups in E-E transitions. Nevertheless, the patterns we find suggest that the reform of unemployment benefits may be one of the reasons behind the recent significant rise in old-age employment in Germany.
We compare the effects for subsamples separated by gender and education. Females appear to respond more strongly than males to the reform, and out of all education groups those with low education show the largest behavioral adjustments. We pay particular attention to possible selection biases in transitions from unemployment and offer a variety of tests. Finally, we test the robustness of our results to various specifications of the estimation model, sample selection mechanisms, and estimators and we conduct placebo tests. In all cases, our results are corroborated.
We confirm the relevance of institutional reforms for labor force participation choices of older workers. Strong evidence suggests that institutions matter and can have substantial effects on the employment behavior of older workers. This finding is important news for many countries with ailing retirement systems.
Supplemental Material
ILRR_Riphahn_Schrader_Supplemental-Online-Appendix – Supplemental material for Institutional Reforms of 2006 and the Dramatic Rise in Old-Age Employment in Germany
Supplemental material, ILRR_Riphahn_Schrader_Supplemental-Online-Appendix for Institutional Reforms of 2006 and the Dramatic Rise in Old-Age Employment in Germany by Regina T. Riphahn and Rebecca Schrader in ILR Review
Footnotes
Appendix A
Marginal Effects for Multinomial Logit Estimations
| Transitions from employment | ||||||
|---|---|---|---|---|---|---|
| E-E transitions | E-U transitions | E-O transitions | ||||
| ME | RME (%) | ME | RME (%) | ME | RME (%) | |
| (1) | (2) | (3) | (4) | (5) | (6) | |
|
|
||||||
| 45–64 years old | 0.00334 | 0.34 | −0.00078 | −27.70 | −0.00256 | −53.65 |
|
|
||||||
| 45–46 years old | −0.00012 | −0.01 | −0.00007 | −2.90 | 0.00019 | 8.92 |
| 47–51 years old | 0.00020 | 0.02 | −0.00040*** | −16.32 | 0.00020 | 8.77 |
| 52–54 years old | 0.00040* | 0.04 | −0.00038** | −14.85 | −0.00002 | −0.71 |
| 55–56 years old | 0.00012 | 0.01 | −0.00022 | −7.77 | 0.00010 | 3.00 |
| 57–59 years old | 0.00179*** | 0.18 | −0.00127*** | −34.71 | −0.00052*** | −9.01 |
| 60–62 years old | 0.00142*** | 0.15 | −0.00131*** | −28.86 | −0.00011 | −0.61 |
| 63–64 years old | 0.00197* | 0.21 | −0.00034 | −10.43 | −0.00163 | −3.29 |
|
|
||||||
| Age, gender, education, state of residence | Yes | Yes | Yes | |||
| Linear and quadratic trends x state, month and year effects | Yes | Yes | Yes | |||
| Retirement controls | Yes | Yes | Yes | |||
| Anticipation controls | Yes | Yes | Yes | |||
| Unemployment benefit controls | No | No | No | |||
| N | 8,020,998 | |||||
| Transitions from unemployment | ||||||
|---|---|---|---|---|---|---|
| U-U transitions | U-E transitions | U-O transitions | ||||
| ME | RME (%) | ME | RME (%) | ME | RME (%) | |
| (1) | (2) | (3) | (4) | (5) | (6) | |
|
|
||||||
| 45–64 years old | −0.04591*** | −4.91 | 0.00383*** | 21.74 | 0.04209*** | 89.58 |
|
|
||||||
| 45–46 years old | −0.01820*** | −2.07 | 0.00422** | 7.89 | 0.01397*** | 21.24 |
| 47–51 years old | −0.04454*** | −4.90 | 0.00238* | 5.92 | 0.04216*** | 82.24 |
| 52–54 years old | −0.07380*** | −7.96 | 0.00656*** | 24.33 | 0.06724*** | 144.73 |
| 55–56 years old | −0.06166*** | −6.57 | 0.00391** | 22.00 | 0.05775*** | 133.53 |
| 57–59 years old | −0.05260*** | −5.50 | 0.00579*** | 93.96 | 0.04682*** | 124.78 |
| 60–62 years old | −0.06274*** | −6.58 | 0.00324*** | 156.25 | 0.05950*** | 136.13 |
| 63–64 years old | −0.08406*** | −9.09 | −0.00011 | −7.85 | 0.08418*** | 114.26 |
|
|
||||||
| Age, gender, education, state of residence | Yes | Yes | Yes | |||
| Linear and quadratic trends x state, month, and year effects | Yes | Yes | Yes | |||
| Retirement controls | Yes | Yes | Yes | |||
| Anticipation controls | No | No | No | |||
| Unemployment benefit controls | No | No | Yes | |||
| N | 430,301 | |||||
Source: Sample of Integrated Labour Market Biographies 1975–2010 (SIAB 7510) and own calculations.
Notes: Standard errors are clustered at the individual level. Relative marginal effects (RME) are calculated as the relation of the age-specific marginal effect (ME) and the mean probability of the transition in the pre-reform period for the specific age group. Estimations include main reform effect “post-reform.” Pre-reform period: Transitions from E=03/2004–08/2005; Transitions from U=03/2004–01/2006. Anticipation period: Transitions from E=09/2005–01/2006. Post-reform period: 02/2006–12/2007. For a list and definition of control variables, see Table A.4. U-U, unemployment to unemployment; U-E, unemployment to employment; U-O, unemployment to other.
p < 1%; **p < 5%; *p < 10%.
Appendix B
Acknowledgements
We thank Peter Kuhn, Hendrik Jürges, Simon Trenkle, Arne Uhlendorff, Kamila Cygan-Rehm, Dominique Lemmermann, and participants of the sixth network workshop of the DFG Priority Program 1764, 2017 Network for Studies on Pensions, Aging and Retirement (Netspar) Workshop, 2017 Institute for Employment Research (IAB) GradAB workshop, seminar at the University of Hamburg, annual meetings of the Population Economics and Econometrics groups of the German Economic Association for helpful comments on earlier versions.
Additional results and copies of the computer programs used to generate the results presented in the article are available from the authors at
1
2
The planned regulations were publicly known by December 11, 2007, and benefited all those who continued to be unemployed beyond the end of 2007. In principle, individuals who received job offers after December 11 may have turned them down in expectation of an extension of their unemployment benefits. This response might have generated a very brief anticipatory dip in unemployment exits.
3
However, if workers or employers had expected another prolongation (the regulation had been prolonged without interruption since 1985), the anticipation behavior may have been limited.
4
5
For completeness, column (E) describes retirement for the severely handicapped, which became more restrictive as well. Since 2012, a new pathway is in place for the very long-term employed, with insurance periods of at least 45 years (not shown in Table A.1); we do not discuss this pathway as it is outside of our investigation period. In addition, disability retirement allows early retirement under certain conditions. Its regulation, however, did not change in our focus period (see Börsch-Supan and Jürges 2012; Burkhauser, Daly, and Ziebarth 2016).
6
In addition to these institutional reforms, the German labor market underwent additional institutional changes prior to the reform we study. Most of these reforms, however, were of a general nature affecting specific features of the unemployment insurance administration, or took place at a much earlier date, or were aimed at welfare recipients, which are not in the focus of our analyses. Therefore, we do not discuss these additional changes (e.g., Eichhorst 2008;  ).
).
7
This study uses the weakly anonymous Sample of Integrated Labour Market Biographies (Years 1975–2010). Data access was provided via on-site use at the Research Data Centre (FDZ) of the German Federal Employment Agency (BA) at the Institute for Employment Research (IAB) and subsequently remote data access (fdz853/857).
9
To keep treatment and control groups as comparable as possible, we do not consider workers below age 40. For example, this strategy allows us to avoid childbearing-related differences.
10
followed the same strategy. Note that our data show rare events but not small samples (typically, we have at least 1,000 observations of the rare outcomes). We are therefore not at risk of small-sample bias. Nevertheless, we apply estimators appropriate for rare events and small sample sizes to test the robustness of our estimates below.
11
When estimating transitions from employment, we account for potential anticipation of the 2006 reform, its interaction with age group indicators, and anticipation of the end of the 58 regulation. When estimating transitions from unemployment, we account for the existence of remaining unemployment benefit entitlements and for the duration of past unemployment benefit receipt in the ongoing unemployment spell. With both outcomes, we consider a vector of retirement indicators, which describe current eligibility for early and full retirement and the number of years until eligibility for early and full retirement (see Table A.4 and Appendix B for definitions and for descriptive statistics).
12
In addition to the p values, we inspected the coefficient estimates themselves. In panel A, their signs do not alleviate concerns regarding non-parallel paths: The significant trend difference is positive for the treatment group in the E-E transitions and negative for the treatment group in the U-U transitions.
13
This marginal effect is statistically significant when linear age controls are considered. The coefficient estimate for the underlying interaction term is statistically significant at the 1% level. In nonlinear models, marginal effect and coefficient estimates can differ in precision.
15
Women must meet specific requirements regarding their past retirement insurance contributions to be able to enter early and normal retirement prior to men.
16
In separate estimations, we tested for varying reform response among unemployed individuals with and without dependent children. We did not observe significant differences by family status, for men or for women.
17
18
We also estimated the model when omitting only February to May 2006. There, we observe even smaller changes in effects.
References
Supplementary Material
Please find the following supplemental material available below.
For Open Access articles published under a Creative Commons License, all supplemental material carries the same license as the article it is associated with.
For non-Open Access articles published, all supplemental material carries a non-exclusive license, and permission requests for re-use of supplemental material or any part of supplemental material shall be sent directly to the copyright owner as specified in the copyright notice associated with the article.
