




Abstract
The authors study how union certification affects the enforcement of workplace-safety laws. To generate credible causal estimates, a regression discontinuity design compares outcomes in establishments in which unions barely won representation elections to outcomes in establishments in which unions barely lost such elections. The study combines two main data sets: the census of National Labor Relations Board (NLRB) representation elections and the Occupational Safety and Health Administration’s (OSHA) enforcement database since 1985. Evidence shows positive effects of union certification on establishment’s rate of OSHA inspection, the share of inspections carried out in the presence of a union representative, violations cited, and penalties assessed.
Keywords
Since 1970, the U.S. Occupational Safety and Health Act has defined federally protected rights to safe and healthy workplaces for American, private-sector workers. The Occupational Safety and Health Administration (OSHA) works to uphold these rights through enforcement and education using its own agency resources directly and by leveraging partnerships with other organizations including state governments, research institutes, employers, and labor unions. Under the Act, workplaces must meet specific standards and employees have rights to initiate OSHA inspections and to participate in inspections, pre- and post-inspection meetings, and administrative proceedings. Union activities may serve as a complement to OSHA’s direct expenditures and enforcement efforts. If unions are effective, declining private-sector unionization may make the Department of Labor’s (DOL) job more difficult.
Labor unions tend to share the DOL’s interests in ensuring safe and healthy workplaces. In collective bargaining and labor–management relations at unionized firms, they often push to increase health and safety along with improvements in other terms and conditions of employment. To some extent, unions educate workers about the nature of their legal rights, facilitate exercise of these rights, and work to ensure such rights are protected by encouraging vigorous enforcement against violations. Unionized workers may also be more likely to understand their rights under OSHA and to report potential health and safety violations, request inspections, and participate in the inspection process, either directly or through a labor representative.
Smith (1986) and Weil (1991) pioneered study of these processes. They provided thoughtful, thorough discussion of ways unions can promote enforcement of workers’ OSHA rights. 1 Morantz (2013) provided a more recent look focused on the coal mining industry and the Mine Safety and Health Administration (MSHA), which has a much more intensive regulatory regime than does OSHA. To develop empirical evidence, Smith (1986) studied data at the industry-year level from 1977 to 1979 and observed a positive association between the unionization rate and the rate of worker-initiated complaint inspections, controlling for a few other industry-year characteristics. Weil (1991) studied OSHA enforcement data combined with business-census data from the manufacturing industry in the year 1985. He compared union to non-union establishments in a broad cross section with respect to their inspection probabilities, probability of having a labor representative participate in inspections, level of violations cited, and level of penalties. In each case, he found large differences between union and non-union establishments. We extend the analysis beyond manufacturing to the whole private economy and beyond a single year of data to 27 years. Morantz controlled for more observable factors than Smith or Weil could and also found evidence of more intensive enforcement in unionized workplaces.
Interpreting those observed differences is a challenge given the prior data’s limited ability to support close comparison across otherwise similar establishments. Perhaps unions do cause stricter enforcement through the mechanisms described above and, thereby, create the differences observed. Or, omitted variables that are correlated with both union status and outcomes could drive the outcome differences while unionization per se has no effect. For example, in establishments that are more dangerous, workers may be more likely to unionize and OSHA may be more likely to inspect, cite, and penalize. Without an ability to compare very similar establishments with respect to their underlying safety levels and propensities to unionize, it is difficult to credibly isolate the causal effect of unions.
To overcome this obstacle, we use a regression discontinuity design (RDD) to compare establishments in which unions barely won National Labor Relations Board (NLRB) union-certification elections to establishments in which unions barely lost such elections (DiNardo and Lee 2004; Frandsen 2013; Sojourner et al. 2015). Rather than comparing union to non-union establishments generally and relying on statistical controls and untestable identifying assumptions vulnerable to selection bias, we restrict attention to establishments in which employees indicated an interest in unionizing such that the NLRB held a union-certification election. At the time of the election, establishments in which the union won narrow elections are very similar to establishments in which the union lost such elections. After the election, unions are certified as collective-bargaining agents in the former set of establishments but not in the latter set. Our focus near the 50% vote-share threshold generates a quasi-random assignment of union certification to establishments and helps overcome the omitted-variables problem. Each establishment that experienced an NLRB election in the past three decades is connected to any relevant OSHA inspection records from the OSHA enforcement database covering 1985 to 2011.
In the years after the election, did the two sets of establishments experience different inspection probabilities, probabilities of having a union representative present on inspections, levels of violations cited, and levels of penalties assessed? These comparisons provide credible estimates of the local average treatment effects of union certification on the margin. This approach is related to, but different from, the effect of unionization per se. Approximately half of the establishments that certify unions sign first contracts. In the other half, unionization does not tend to follow certification. Furthermore, RDD is most informative about the effects of unionization on the margin of certification, rather than the effects of unionization in cases in which unions have overwhelming worker support (DiNardo and Lee 2004; Sojourner et al. 2015). This margin is the most relevant to understanding the effects of policy changes that would make it marginally easier or harder to win union certification, such as card checks or faster elections. Further, we do the best the OSHA enforcement data allow to construct measures of occupational injury in each establishment and to analyze effects on reported injuries, though the data have substantial limitations for this purpose. A recent paper using a regression discontinuity design to focus on union effects on accident case rates uses better accident data and found no effect (Li, Rohlin, and Singleton 2018).
An important advantage of RDD over designs that simply try to adjust for observed differences in control variables is that the assumptions needed for RDD imply falsifiable conditions (DiNardo and Lee 2011). Our data fail one type of falsification test: that the distribution of vote shares should be smooth, rather than displaying sharp jumps or drops, at the 50% threshold. However, it passes a second falsification test. As in an experiment, there should not be any difference in the distribution of observable characteristics between the treatment and control groups prior to treatment. In our context, this means there should be no difference prior to the election between establishments in which unions later barely win and those in which they later barely lose. Analysis of the pre-election versions of the OSHA outcomes and characteristics of the establishments observed from the NLRB elections yields no evidence of differences, supporting the validity of the RDD assumptions. Rather than rely simply on the RDD design, we also harness the longitudinal nature of the data to build in a difference-in-differences (DiD) logic to the analysis. In predicting each establishment’s post-election outcomes, we study if establishments in which unions barely won elections have outcomes that differ from those in which they barely lost, controlling for each establishment’s own lagged outcomes and characteristics. RDD and DiD are both strong on their own, but each makes distinct identifying assumptions. Combining them provides some insurance against violations of the assumptions of either (Frandsen 2013).
Design and Data
We index establishments by i = 1, 2…I and suppose each has only one union-certification election. Our interest centers on the average effect of the union winning an election, indicated by Di. The forcing variable—that which governs selection into union certification—is the election’s pro-union vote share (

Union certification,

This condition assumes that unobserved factors influencing the outcome do not jump in a discontinuous manner at the election-victory threshold. Because the only factor that can shift discontinuously at the threshold is union certification (D), any observed differences in outcomes across the threshold after the election can be interpreted as the causal effect of union certification on the margin.
The study population is all US private-sector establishments on the margin of unionization between 1985 and 2009 as measured by the establishment experiencing at least one NLRB certification election during this period. The study starts with January 1985 because this is the first year any occupational fatalities are recorded in the OSHA enforcement database (U.S. Department of Labor 2014). Over this time, the NLRB election database contains 79,390 elections with a valid election month, election year, industrial classification code, state, establishment name, and counts of employees voting in favor of and against unionization. In some cases, the data contain the establishment street address. We integrate two databases that compile and standardize NLRB election records: one from Holmes (2006) that covers elections from 1977 to 1999 and which includes many establishments’ street addresses and a second provided by Henry Farber covering 1962 to 2009 but lacking street addresses.
Because any establishment can have multiple NLRB elections over time, we use a matching algorithm to construct longitudinal, unique-establishment identifiers within the NLRB elections database. Across the set of elections in establishments in the same state, city, and industry (i.e., strict match after cleaning), the algorithm links elections in establishments with similar names and addresses (i.e., fuzzy match after cleaning). This approach identifies 72,187 unique establishments. Online Appendix A provides additional detail on the records-matching process.
Next, establishments with NLRB elections are linked to records in the OSHA enforcement database. The OSHA database records all administrative enforcement actions carried out by the federal OSHA and federally approved state OSH agencies covering US private-sector establishments from 1985 to 2012, constituting 3,246,794 inspection records. For each inspection, the establishment’s name, address, city, state, and industry are observed. The database also contains records of Fatality and Catastrophe Investigation Summaries (OSHA Form 170), which are developed after an inspection triggered in response to a reported fatality or catastrophe (U.S. Occupational Safety and Health Administration 2016). These summaries are the source of our establishment-level data on reported fatal and nonfatal injuries.
Our focus is on OSHA records from only establishments that experienced NLRB elections. For each OSHA record, we look for a match among all the NLRB election records using strict matching of establishment’s city, state, and industry along with fuzzy-matching on name and address. Using the NLRB-based establishment identifiers, this yields a longitudinal database of unique establishments each linked to any associated NLRB elections and OSHA enforcement data. This procedure links 48,671 OSHA records to 16,166 unique establishments that underwent NLRB certification elections, implying that 22.4% of such establishments are linked to any OSHA record. The other 77.6% of establishments with NLRB elections are measured to have no OSHA enforcement actions during the study period.
Our analysis focuses on the subsample of NLRB elections meeting the following criteria:
At least 20 individuals voted: A vote-total floor minimizes the risk that the exact outcome could be manipulated by the company, the union, or workers, which would somewhat undermine the quasi-randomization across the vote-share threshold (Frandsen 2012).
Election occurs between 1985 and 2009: Before 1985, records of fatal injuries are almost completely absent from the OSHA database (Online Appendix Figure B.1). Even after 1985, the OSHA fatality data are highly incomplete. The OSHA data include only about two-fifths as many fatal occupational injury reports as does the more complete Census of Fatal Occupational Injuries (CFOI) across the years both are available (Online Appendix Figure B.2). Focusing on elections occurring after 1985 ensures a positive probability of observing occupational fatalities prior to the election, however, giving a meaningful pre-election injury measure for use as a control variable and in testing for valid RDD conditions. Our NLRB election data end in 2009.
First such election observed in an establishment: Considering multiple elections for the same establishment raises a number of conceptual questions about whether an establishment should be considered as treated (union wins) or control (union loses). Focusing on only the first election that meets criteria 1 and 2 in each establishment sidesteps these thorny issues. This election is termed the establishment’s focal election (Sojourner et al. 2015). This is a conservative standard that may attenuate estimated effects. If a subsequent election has the same result as the focal election, this does not introduce measurement error. If a subsequent election has the opposite result, we are less likely to find an effect because the establishment then truly has a mix of certified and not-certified units rather than having the pure status measured by the focal-election result. Another issue raised by multiple elections is the possibility that unions or management learn enough through recently past elections to manipulate the outcome of the election in such a way as to introduce systematic differences across the threshold in unobservables and, thereby, invalidate the RDD-identifying assumption. This concern diminishes as the time between elections extends. Therefore, any establishment that experienced an NLRB election, regardless of outcome, in the five years immediately prior to the focal election is excluded.
No evidence of prior unionization: Using the NLRB data back to 1962, any establishment in which any union was certified prior to the focal election is excluded. This choice clarifies the interpretation of the treatment as a contrast between establishments with no unions previously certified as bargaining agents and those with any union so certified (Sojourner et al. 2015). Our rules would fail to exclude establishments certified or unionized prior to the focal election if workers voted prior to 1962 or unionized outside the NLRB process, however, or if our linking process missed a longitudinal match to a prior union election victory.
Valid number of votes: The number of total recorded votes must not exceed the number of eligible voters (bargaining-unit size).
Filtering on criteria 1 and 2 reduces the number of unique establishments and focal elections to 42,430. After implementing criteria 3, 4, and 5, the number of unique establishments in our analytic sample shrinks to 31,052. As displayed at the top of Table 1, the average raw vote share was 49%, a union won a majority in 44% of focal elections, and the average number of eligible voters was 107. In the analytic sample, 26.2% of establishments have at least one linked OSHA record from between January 1985 to December 2011, similar to the link rate in the overall NLRB sample. The other 73.8% have no linked OSHA record.
Summary Statistics
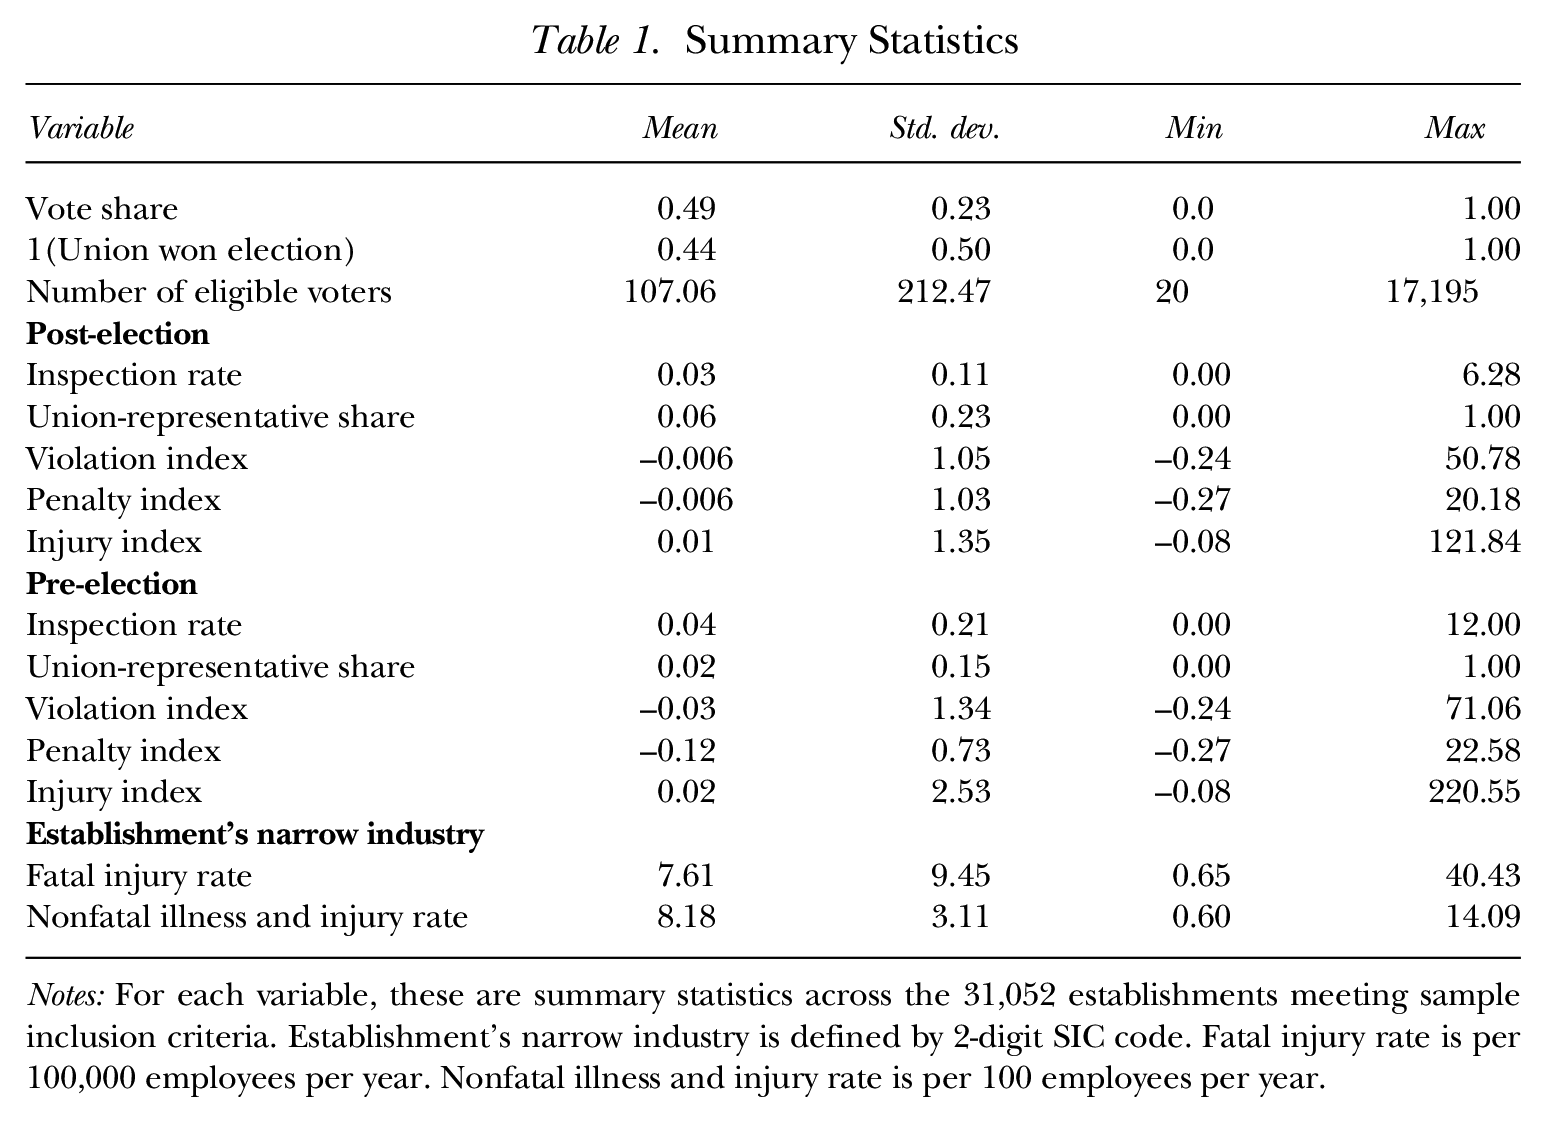
Notes: For each variable, these are summary statistics across the 31,052 establishments meeting sample inclusion criteria. Establishment’s narrow industry is defined by 2-digit SIC code. Fatal injury rate is per 100,000 employees per year. Nonfatal illness and injury rate is per 100 employees per year.
Outcome Measures
We measure five outcome variables for each establishment: inspection rate, union-representative participation in inspections, violations index, penalty index, and occupational injury risk. Relative to each establishment’s unique focal election, a post-election and a pre-election measure of each variable is constructed. Post-election measures serve as outcomes, contrasted across the certification threshold to estimate the union-certification effect. Pre-election measures allow for falsification testing. The assumptions of RDD imply the testable prediction that there should be no discontinuity in the distribution of pre-election observables across the threshold. They also serve as control variables to reduce bias that may arise from violations of the RDD conditions. Finally, they increase our estimates’ precision by helping explain post-election outcomes and, thereby, reducing the role of unobservable influences.
First, we develop three measures of the intensity of OSHA enforcement activity at each establishment in the post-election period and one measure of labor’s active involvement in the inspection process. To measure each establishment’s post-election inspection rate, we proceed as follows. We count the number of post-election inspections, those between the focal-election month and the end of the study period (December 2011), and compute the length of the establishment’s post-election period in years: post-election months/12. The post-election inspection rate is the count of inspections over the length of the period or, equivalently, the average number of inspections per year post-election. We measure pre-election inspection rates analogously using January 1985 as the start. In the pre-election period, the average annual inspection rate is 0.04 with standard deviation 0.21, implying an average of 4 inspections performed annually per 100 establishments in our sample. Post-election, the annual inspection rate is 3 per 100 establishments. For 2014, OSHA reports a total of 83,380 federal or state-plan inspections. The Bureau of Labor Statistics reports 9.1 million private-sector establishments in 2014Q3, implying an annual inspection rate of 0.9 inspections per 100 establishments overall. Establishments in our sample appear more likely to be inspected than do establishments in general. 3
Second, the exercise of walk-around rights (Weil 1991) at each establishment in each period is measured by the share of inspections attended by a union representative. In the pre-election period, an average of 2% of inspections were attended by union representatives. For research purposes, it is heartening that this share is so low because we construct the sample to focus on establishments with no union representation in the pre-election period. For program purposes, it is sobering evidence that workers rarely exercise their rights to participate in OSHA inspections absent a union. Pre-election union-representative share also serves to control for differences in pre-election unionization across establishments that our sample-construction rules miss. Analyzing the effect of certification on post-election exercise of walk-around rights also generates empirical evidence on the extent to which certification drives unionization per se. Evidence that certification lifts the share of inspections attended by union representatives would give validity to interpreting certification effects as informative about unionization effects. Finally, this provides an estimate of certification effects on exercise of federal walk-around rights, the most credible evidence on a union rights-facilitation effect in the literature.
Third, combining multivariate data on each establishment’s OSHA violations yields a single index measuring the establishment’s degree of OSHA violations cited. For each inspection at an establishment, OSHA assigns a number of current violations for each of five types of violations: serious, willful, repeated, other, and unclassified. Figure 1 displays an example of the kind of violation and penalty data available from each inspection. We focus on serious, willful, and repeated violations because other and unclassified violations are extremely rare. For each establishment and each of the three types of violation, we sum the number of violations across all post-election inspections and divide by years at risk and do the same for the pre-election period. This calculation determines the average annual number of violations of each type in each period. The distribution of these are highly skewed with large masses at zero violations. We log-transform using log(1+average number of violations per year) to reduce the influence of outliers.

Example of OSHA Enforcement Data for a Particular Inspection
Motivated by the idea that the three types of violations are all generated by a single, latent establishment propensity to violate, we factor analyze the three pre-election log-violation rates across establishments to find the single latent factor that explains the most variance in violation rates, obtain scoring coefficients, and score each establishment based on its three measured pre-election log-violation rates. The top of Table 2 provides summary statistics for log-violation rates across establishments in the sample. Columns (1) and (2), respectively, present pre-election and post-election establishment averages and standard deviations. Column (3) presents scoring coefficients from the factor analysis. These coefficients imply that each establishment’s violations score in each period is 0.328×log(1+average serious violations per year) + 0.201×log(1+average willful violations per year)+0.319×log(1+average repeated violations per year). We score each establishment in the post-election period using its three measured post-election log-violation rates with the same, pre-election scoring coefficients because the sets of establishments are more homogeneous prior to the election than afterward. To give the score a meaningful scale, we standardize in the post-election control group. We compute the mean and standard deviation (SD) of the score in this subsample and then use these moments to standardize all pre- and post-election observations. Effects will be measured relative to the SD of outcomes in which unions lose the focal election. Little difference exists between average violation indexes pre- versus post-election (see Table 1). The minimum of –0.24 and maximum of 50.78 post-election shows that, even with log-transformations, the standardized index remains highly skewed. It has a large mass at the minimum corresponding to those elections with no inspections or with inspections without violations.
Summary Statistics for OSHA Variables and Factor Construction
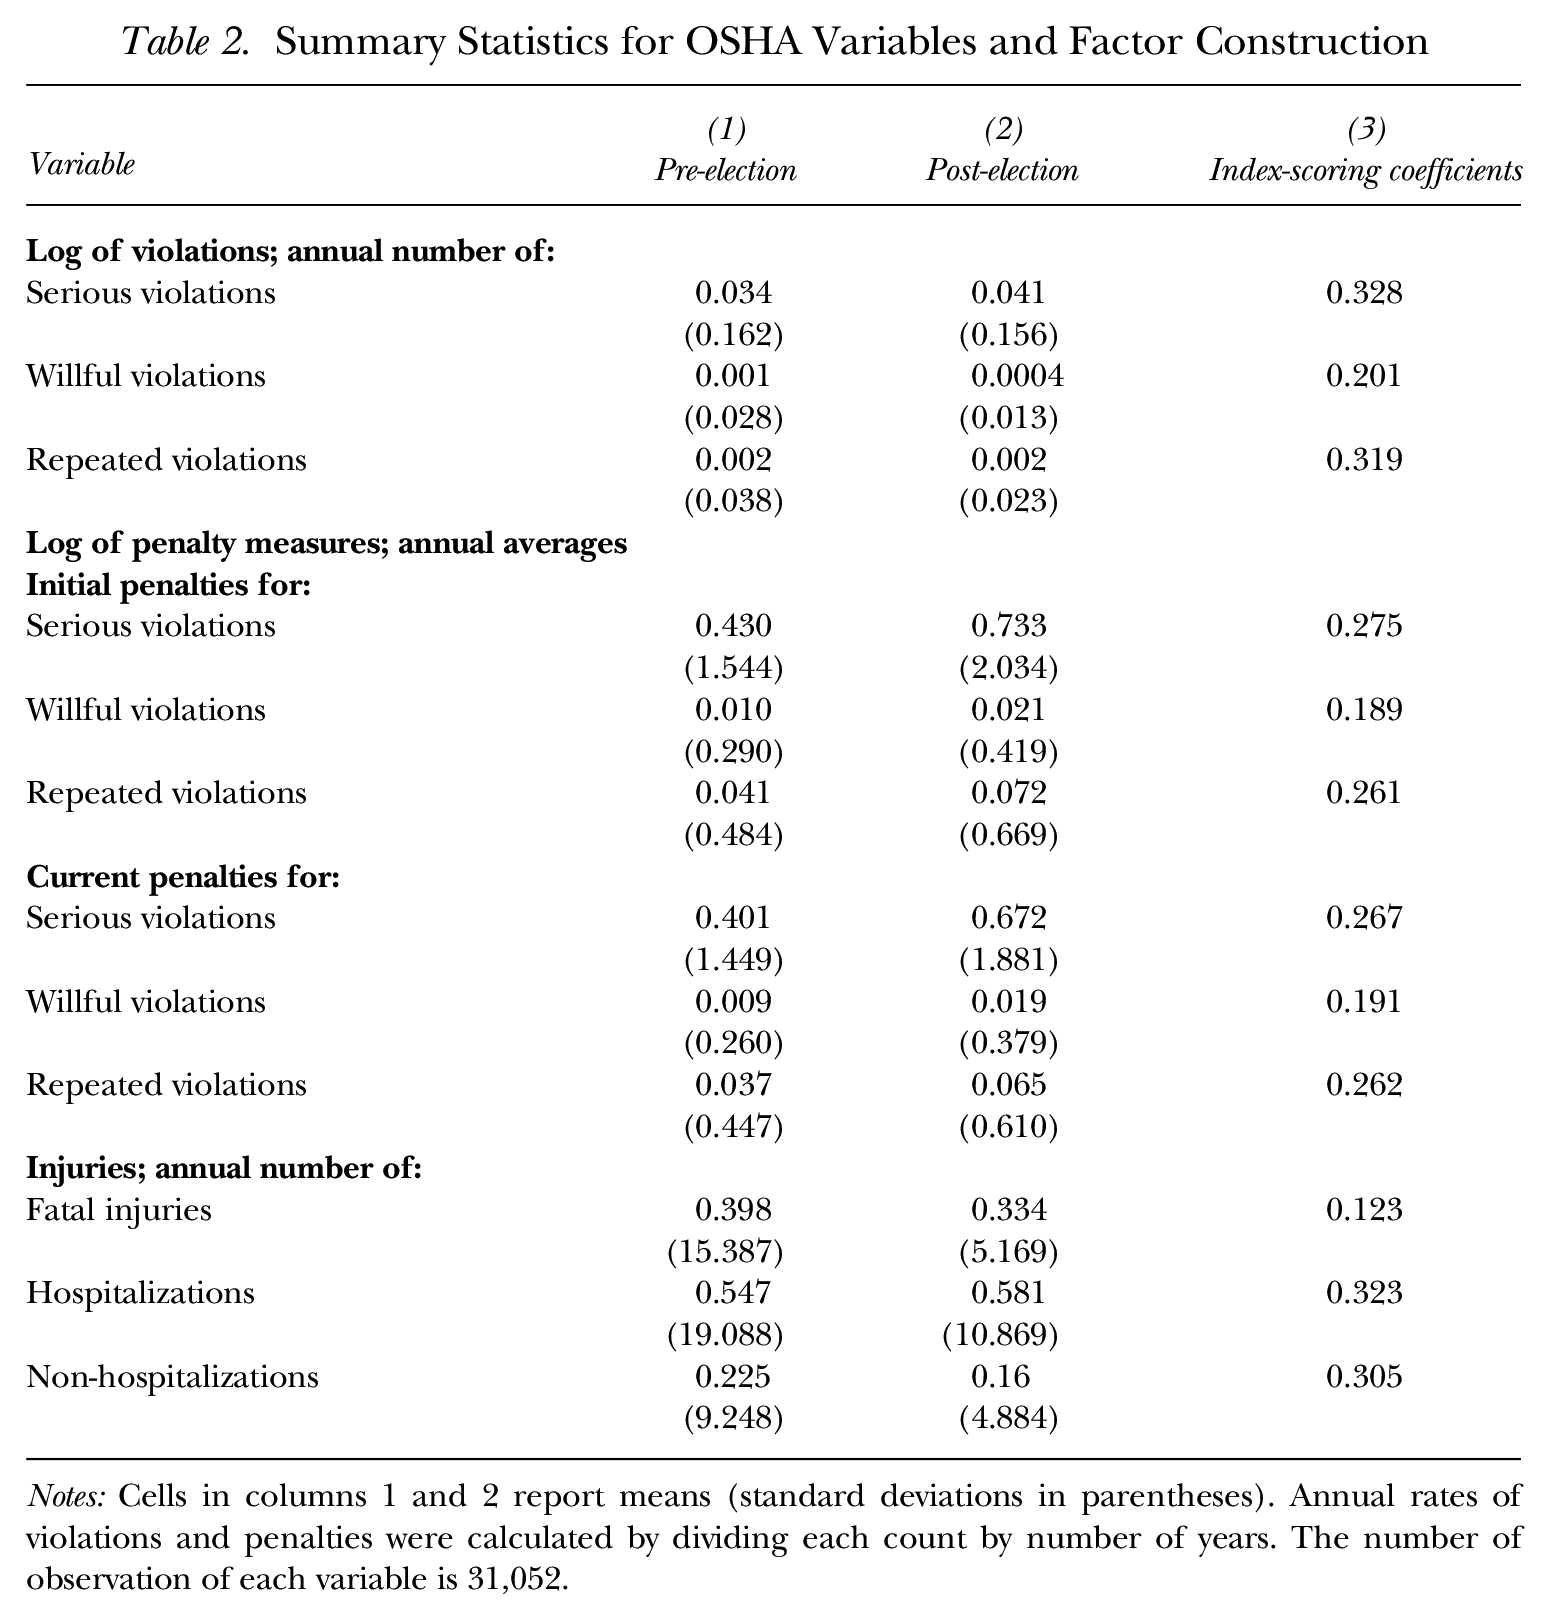
Notes: Cells in columns 1 and 2 report means (standard deviations in parentheses). Annual rates of violations and penalties were calculated by dividing each count by number of years. The number of observation of each variable is 31,052.
This measurement approach has many advantages. It pools information across three highly correlated violation measures to produce a single, low-noise, post-election measure for use as an outcome. It provides a single pre-election control variable, rather than three that would likely suffer from multicollinearity. By reducing both measurement error in the outcome and multicollinearity in the predictors, this approach should boost the precision of estimated certification effects (
A disadvantage is that the units of this violations index are not easily comparable to the conventional, count-of-violations measure. To address this, we divide the set of establishments in the post-election control group into percentiles based on values of the violation index. Each percentile above the minimum value contains approximately 175 to 180 establishments with tightly similar values of the index. Within each percentile, we compute the average total number of post-election violations across the establishments. The percentile containing the mean violation-index value (z = 0) has an average number of violations equal to 1.1. The percentile containing the establishments with violation-indices two SD above the mean (z = 2) has an average number of violations of 10.2. So, moving two SD up from the mean is equivalent to moving up 9.1 total violations over the post-election period. Considering the difference between the z = 0 and z = 1 (z = 1 and z = 2) bins implies a difference of 3.6 (5.5) violations. We average these by considering a two-SD difference. Our sample’s average post-election period is 16.5 years, so one way to understand an SD of the index is as 0.28 violations per post-election year. We present alternative estimates based on more conventional measures in the robustness section.
Fourth, to measure OSHA penalties, we use a similar approach to pool information across multiple penalty types. For each establishment in each period, after inflating penalty amounts to 2014 dollars, we measure the average annual penalties assessed for six types: {Serious, Willful, Repeated} × {Initial, Current}. An analogous log-transformation, factor analysis, scoring, and standardization process gives pre-election and post-election penalty index levels for each establishment. The middle of Table 2 provides summary statistics for log-penalty rates across establishments in the sample and the scoring coefficients obtained from the pre-election period. Using the same approach as with violations to calculate a more conventional measure of penalties in dollar terms, moving up two SD of the penalty index from the percentile containing z = 0 is equivalent to moving up by $62,379 in post-election penalties, implying an SD is $1,890 per year.
Fifth and finally, we construct an index of occupational injury risk that pools available data on the average number of workers at each establishment per year reportedly experiencing three types of occupational injuries: fatal, nonfatal but requiring hospitalization, and nonfatal and not requiring hospitalization. These data derive from OSHA’s Fatality and Catastrophe Investigation Summaries (OSHA Form 170), as archived in the OSHA Enforcement Database (U.S. Occupational Safety and Health Administration 2016) and are generated only after OSHA conducts an investigation in response to a fatality or catastrophe. The underlying data on occupational injuries are far from perfect. Many injuries are missing, and injury presence may be driven by a reporting propensity generated by union certification. Dissatisfaction with OSHA’s accounting for fatal occupational injuries spurred the creation of the well-regarded CFOI in 1992, but the CFOI does not allow establishment-level matching. We do not use the survey-based injury measures that some prior studies have used because the survey is nonrepresentative and because we limit ourselves to the very small share of establishments that experience NLRB elections (fewer than 2,000 per year among 9.5 million establishments implies less than 0.1%) and the intersection of these two samples would be tiny. From 1992 to 2011, the OSHA data contain information on approximately one-quarter to one-third of the occupational fatalities included in the CFOI (Online Appendix Figure B.2). The bad news is that our OSHA data miss a large share of injuries. The good news is that the OSHA trend moves with the CFOI trend, so it may contain some useful, if imperfect, information. The motivation and approach are the same as described for violations and penalties above.
We also use information on bargaining-unit size to convert injury counts of each type into annual injury rates per 100,000 workers. 4 The three injury rates are then factor analyzed, scored, and standardized, as with penalties and violations. We treat the resulting injury index as a proxy for each establishment’s underlying occupational injury propensity. One SD in the injury index can be understood as 0.03 injuries per 100,000 employees per year. This seems very small but, at the establishment-year level, the vast majority of establishments have no reported injuries.
Use of the pre-election version of this variable as a control helps adjust for any differences in establishment-level injury risk that may drive enforcement activity. Use of the post-election injury index as an outcome is problematic. Suppose that unionization leads to more accurate reporting of injuries to OSHA; measurement error in the injury index would then be correlated with the treatment variable. In a regression of post-election injuries on a union-certification indicator, unionization would appear to lead to more injuries, when actually it may lead to higher reporting rates conditional on the same (or lower) injury rates. We include the analysis for completeness but do not vest it with much credibility.
Control Variables
Knowing each establishment’s history of OSHA inspection frequency, violations, penalties, occupational injuries, and union-representation provides a rich characterization of establishment propensity to have future inspections, violations, penalties, and injuries. For each post-election outcome variable, the most important explanatory factor conceptually is each establishment’s own pre-election level on the variable, which we observe. Each establishment’s own pre-election levels for the other four outcome variables also serve as predictors.
Each establishment’s industry can help explain outcomes and enable more-credible, narrower comparisons. We include a set of indicators of the establishment’s major industry division (Online Appendix Table B.1) and construct a measure of minor industry (2-digit) occupational fatal injury risk using the best data available from all establishments in the US economy and completely external to the OSHA data. We measure the occupational fatality rate for each minor industry each year by the ratio of fatal occupational injuries from the CFOI per thousands of employees in the industry from the BLS Current Employment Statistics (U.S. Bureau of Labor Statistics 2013). To reduce measurement error, 11 annual rates, from 1992 to 2002, are averaged within minor industry to construct a cross section of rates across industries. We similarly construct a measure of minor-industry nonfatal injury and illness rate using the BLS Injuries, Illnesses, and Fatalities data, which were available from 1994 to 2002 (U.S. Bureau of Labor Statistics 2016). Across establishments in our sample, the average minor-industry fatal injury risk level is 7.61 fatalities per 100,000 full-time-equivalent employees (FTE) with an SD of 9.45 (see Table 1). The average annual occupational fatality rate in the US economy broadly fell from 5.0 in 1992 to 4.2 in 2002. The average annual nonfatal injury and illness rate in 2014 was 3.4 per 100 employees, compared to 8.2 in our sample. Establishments in our sample, those experiencing certification elections, are in industries that are substantially more risky than average. Including these industry variables as controls allows our analysis to compare outcomes across establishments in the same industry division controlling for differences in minor-industry risks along with establishment-level pre-election measures of inspections, violations, penalties, labor-representation, and injuries.
Analysis
Assessing Validity of Identifying Assumption
Using three falsification tests, we present evidence of the validity of the RD identifying assumption. First, there should be no discontinuity in density of vote shares across the 50% threshold. Figure 2 presents a histogram of binned vote shares across the sample of establishment-focal NLRB elections. Most elections are close, resulting in a large share of the sample close to the threshold. However, we reject the null of no discontinuity in the density of vote shares across the threshold (t = 4.14) (McCrary 2008). This result implies a significant discontinuity in the distribution of vote-share values, raising concern about possible post-election manipulation and some degree of violation of the RD identifying condition. If we had only post-election data, violations of the RD condition would be very troubling. As Frandsen (2013) and Sojourner et al. (2015) pointed out, however, the availability of panel data makes possible a more robust design that combines the logic of difference-in-differences and RD design.
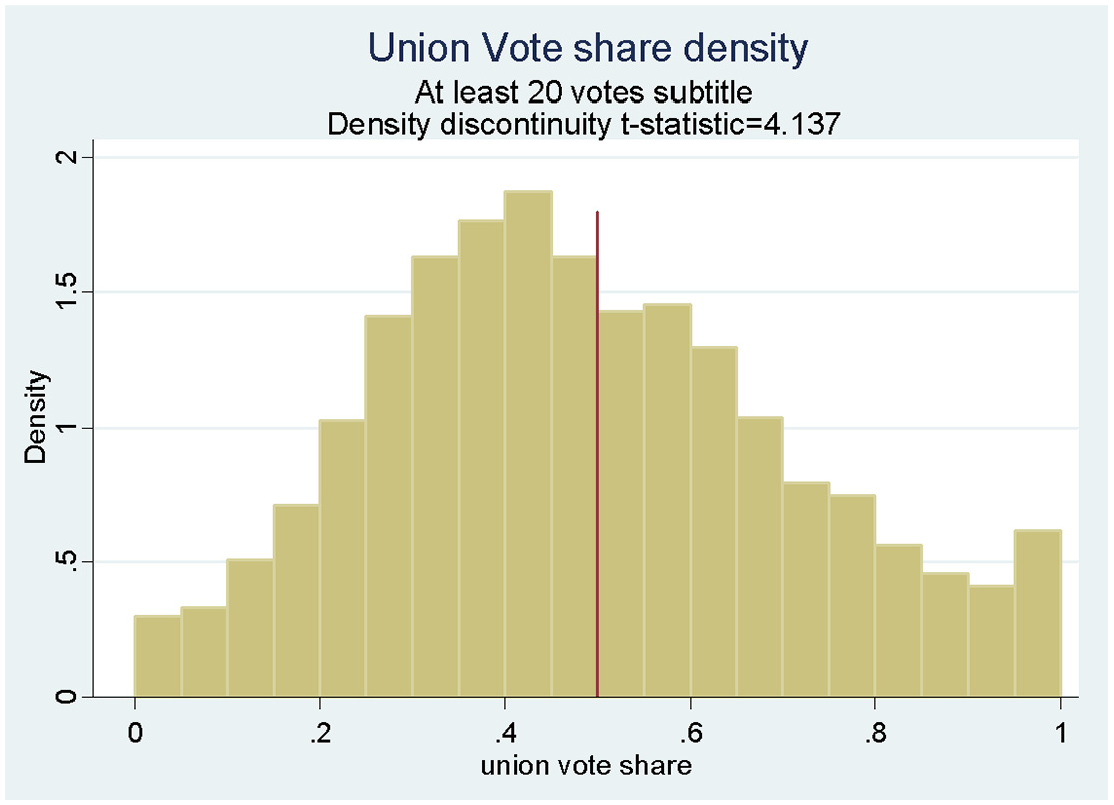
Histogram of Vote Shares across Focal NLRB Elections with at Least 20 Votes Cast
Second, we plot how the pre-election conditional mean of each outcome variable varies as a function of vote-share bin. Consider the left side of each of the five panels of Figure 3. Panel (a) displays estimates from a regression of pre-election inspection rates on a set of indicators for each vote-share bin computed with robust standard errors. The left-most estimate is the mean pre-election inspection rate for establishments that went on to have a pro-union vote share between 0 and 5%. The 95% confidence interval for each conditional mean estimate is also displayed. The other 19 estimates correspond to conditional means in the other vote-share bins. No discontinuity is apparent in the conditional mean at the certification threshold, demarked by the vertical line. If the RDD assumption holds, there should not be. Consider the other four pre-election, left-side panels. In each, there is no evidence of a significant difference across the threshold. This outcome is consistent with the validity of the RDD identifying conditions.

Average Annual Establishment Measures
Third, we formally test for discontinuity across the threshold in the distribution of pre-election observables. Close to the threshold, there should be none. A union certification effect prior to the election would be evidence of systematic differences leading up to the election between establishments in which unions will go on to win versus those in which unions will go on to lose, a violation of the identifying assumption (Lee and Lemieux 2010; Sojourner et al. 2015). The possibility that such differences might exist far from the threshold is the motivation for an RDD. We implement the test with a seemingly unrelated regression (SUR) model with 8 pre-election observables as dependent variables: inspection rate, union-representative share, violation index, penalty index, injury index, bargaining-unit size in the focal election and its square, and minor-industry (SIC 2-digit) fatal and nonfatal injury rates. Each dependent variable depends on a piecewise linear function of vote share allowing for discrete intercepts and slopes on either side of the certification threshold, including a certification indicator. After estimating the SUR system, we test the joint hypothesis that the certification effects for all the dependent variables equal 0 and report the p value.
We perform this test across various subsamples, starting with establishments that had vote shares only very close to the threshold and expand the bandwidth for inclusion and sample incrementally. Table 3 reports the estimated discontinuity coefficients for each dependent variable, with each column reporting results from a specific bandwidth. The joint null of no pre-election differences is not rejected at 10% significance at any bandwidth up to 0.325 (which includes focal elections with 15–85% vote share), consistent with no significant discontinuity in pre-election characteristics’ distribution and with the validity of the RD design using close elections.
Coefficients on Union Certified in Seemingly Unrelated Regression at Varied Bandwidth
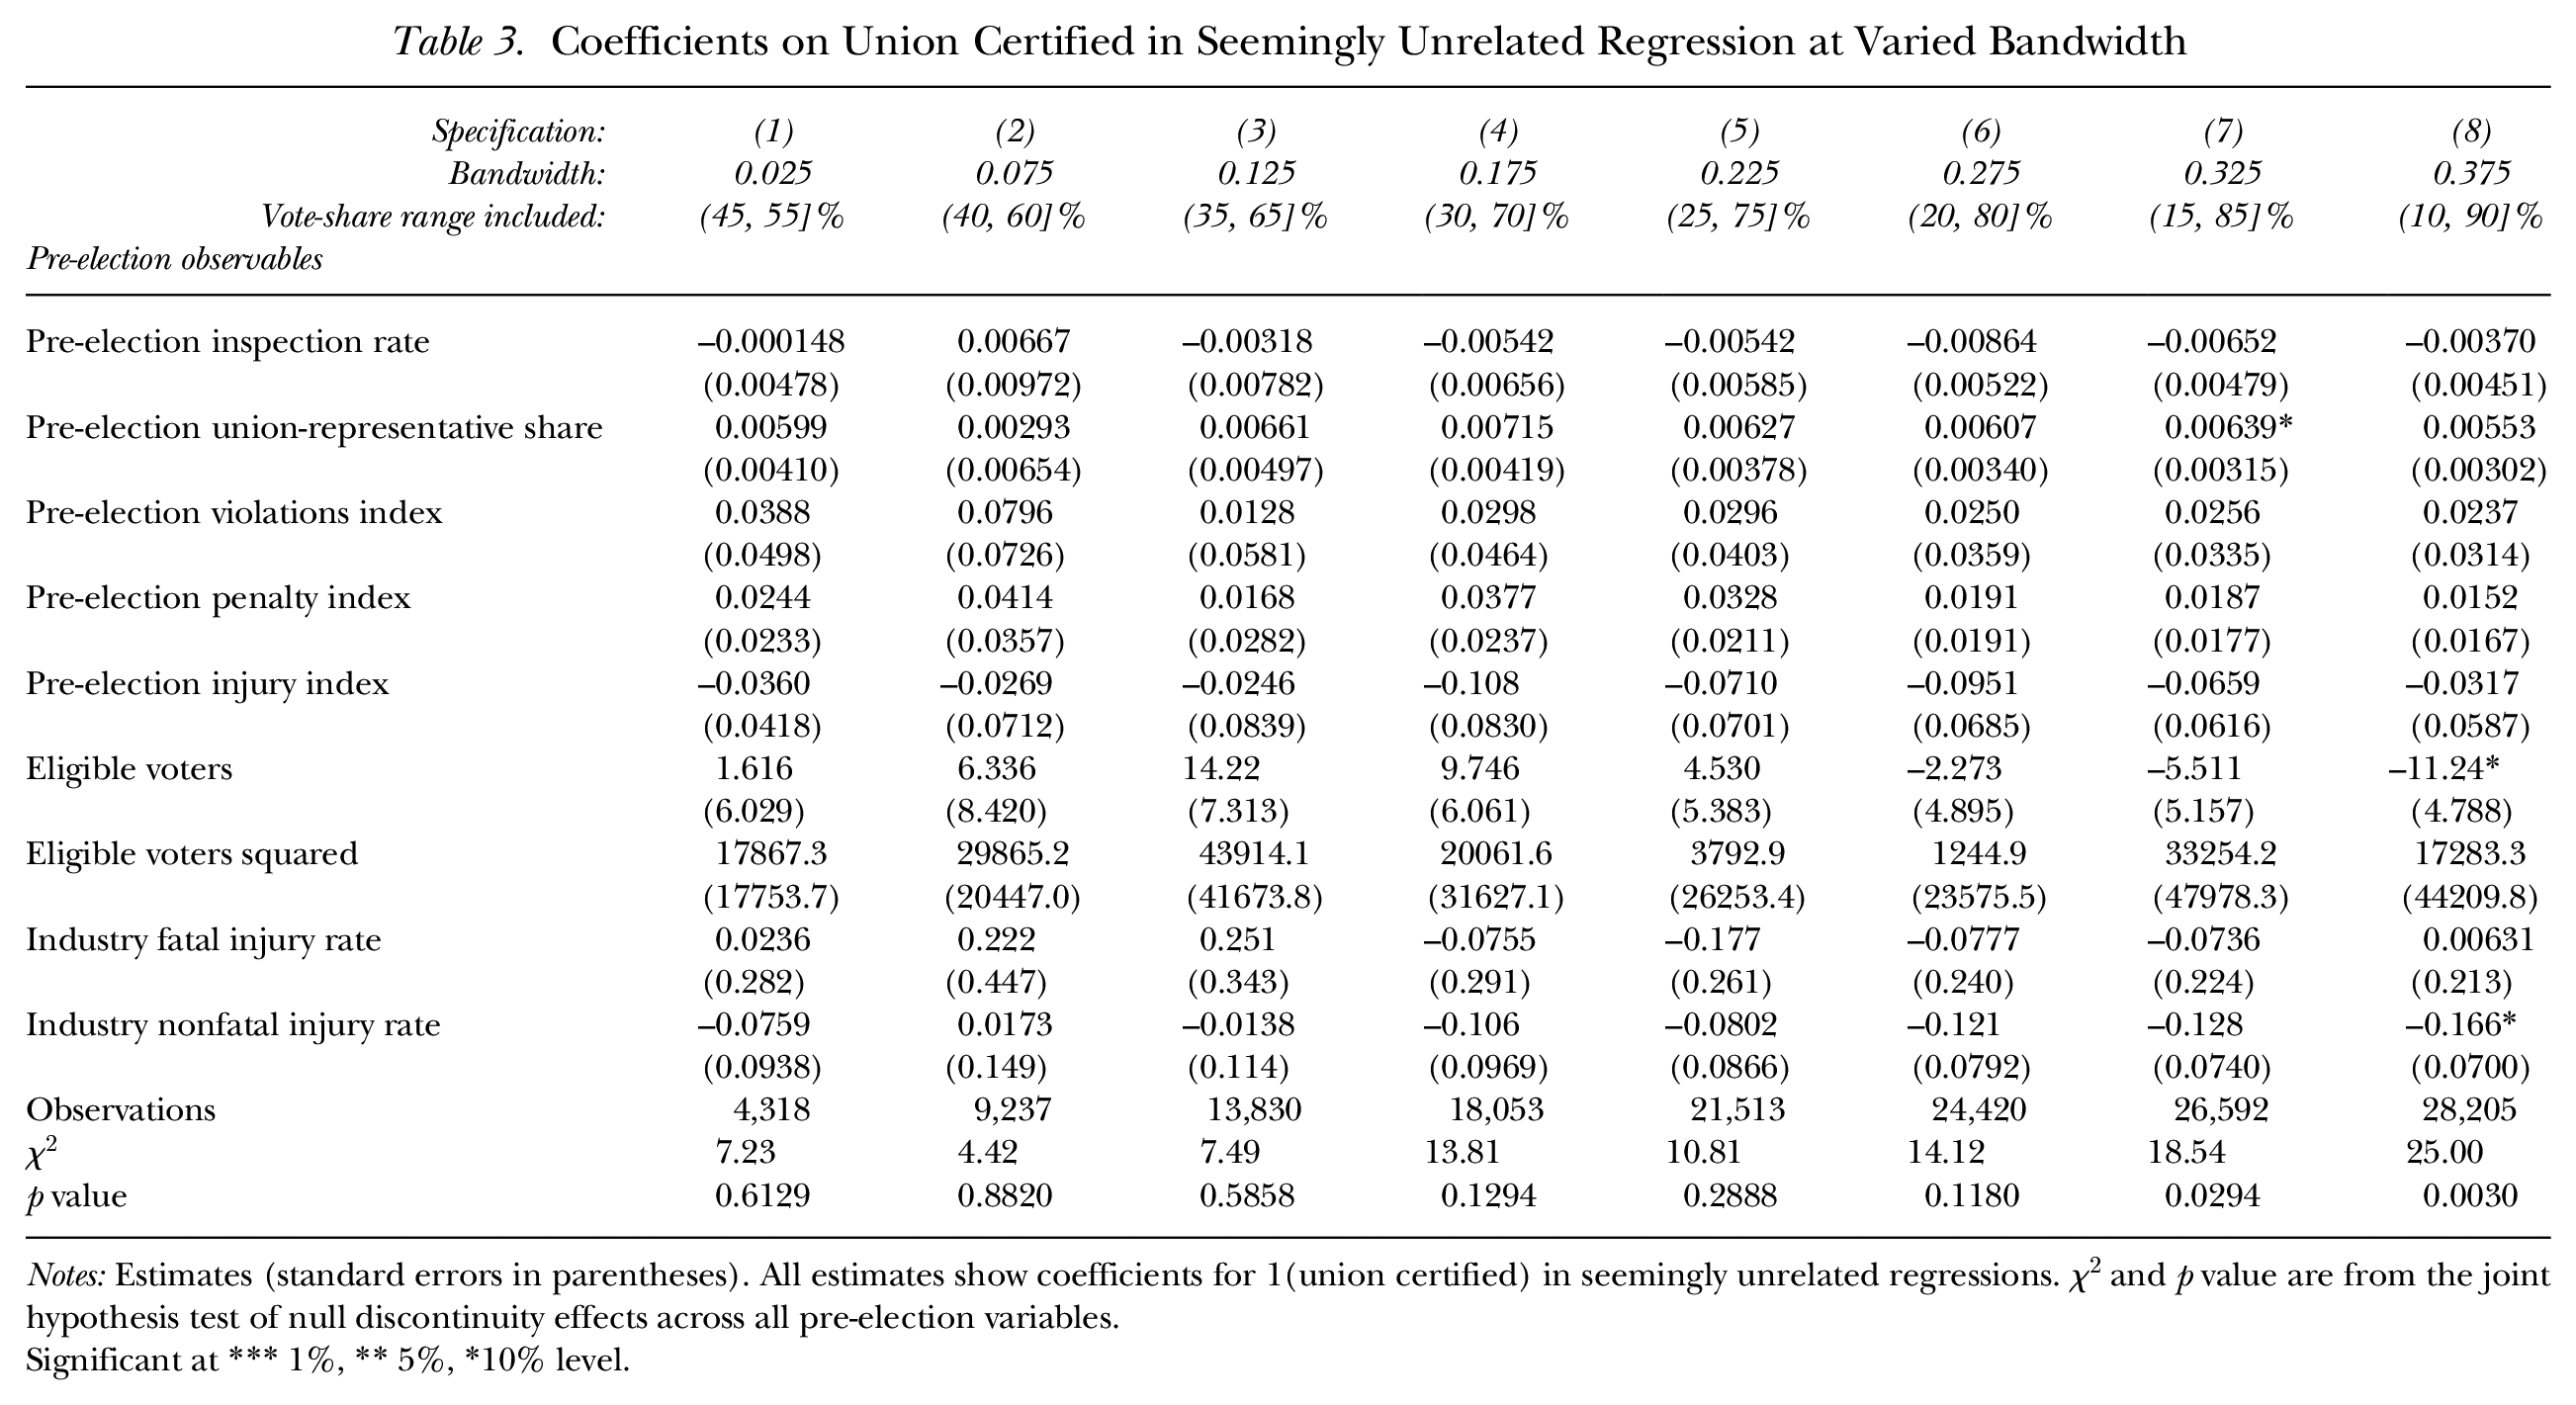
Notes: Estimates (standard errors in parentheses). All estimates show coefficients for 1(union certified) in seemingly unrelated regressions.
Significant at *** 1%, ** 5%, *10% level.
Union-Certification Effects
To start the analysis of effects, inspect the right-side graphs in Figure 3’s panels. Panel (a) plots the mean post-election inspection rate for each vote-share bin. The effect of certification would appear as a discontinuous change in the conditional mean across the certification threshold. Restricting attention to establishments with close elections, there appears to be a slightly higher inspection rate for unions that narrowly won compared to those that narrowly lost but the difference appears small and isolated to establishments with (50%, 55%] 5 pro-union vote share.
Figure 3, panel (b) plots the conditional mean of union-representative share. Here the certification effect is clear. The outcome increases smoothly with vote share below the certification threshold and also moves relatively smoothly with vote share above the threshold; however, a large, positive discontinuity is apparent when the threshold is crossed. The magnitude of the effect appears to be approximately 0.07. Interpreted causally, this implies that certification causes a 7 percentage point increase in the share of inspections attended by a union representative. However, because this outcome is defined for only the 26% of the sample with any linked OSHA inspections, the result could be interpreted as consistent with a 27% increase in union-inspection share if all establishments had been inspected. 6 This result provides clear evidence that certification triggers enduring unionization.
In the other figures, effects on violations, penalties, and injuries appear small or null. Any effects appear to be generated by variations immediately around the threshold, particularly in the (50%, 55%] pro-union vote-share bin.
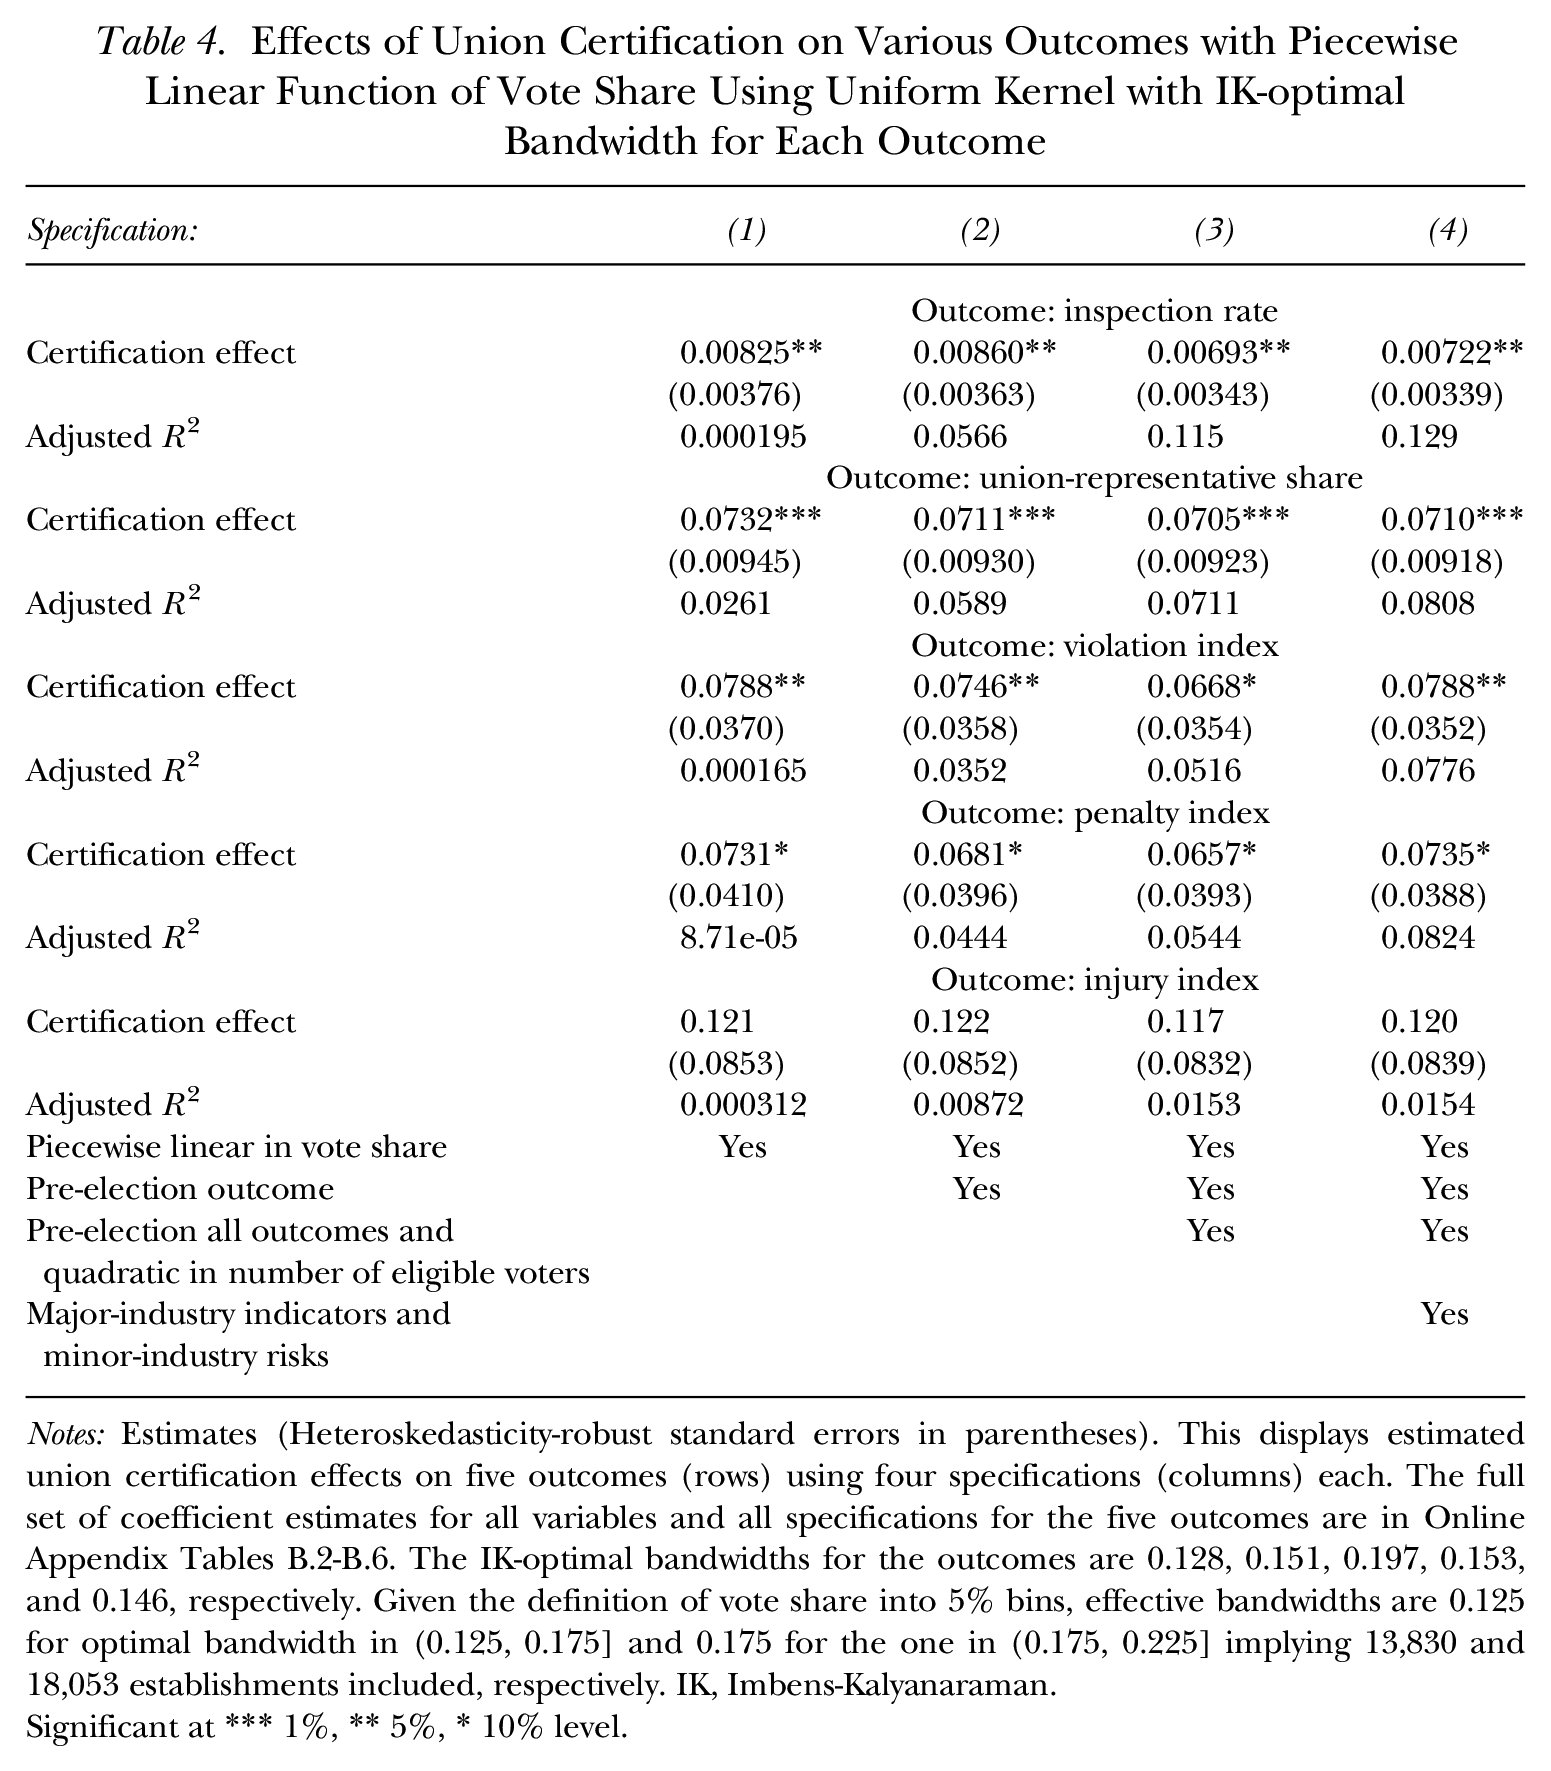
To formalize this analysis and to allow for controls, we use regression analysis. We estimate the effect of union certification on each outcome among establishments with NLRB election vote shares within a certain range, a bandwidth, of the certification threshold. We use first-order local-linear regression with a uniform kernel. The bandwidth for each outcome is chosen using the optimality criterion of Imbens and Kalyanaraman (2012). For each outcome, we estimate four specifications, with increasingly rich sets of control variables. Table 4 displays the estimated coefficient (SE) on the won-certification indicator (D) from four specifications in columns for each of the five outcomes, in panels from top to bottom. The top panel contains estimates of the effect of certification on establishments’ annual rate of OSHA inspection. Specification (1) includes only a certification indicator and a piecewise linear function of vote share. The estimated certification effect (SE) is 0.00825 (0.0038), which is significant at 5% and has a 95% confidence interval of +0.001 to +0.016.
Effects of Union Certification on Various Outcomes with Piecewise Linear Function of Vote Share Using Uniform Kernel with IK-optimal Bandwidth for Each Outcome
Notes: Estimates (Heteroskedasticity-robust standard errors in parentheses). This displays estimated union certification effects on five outcomes (rows) using four specifications (columns) each. The full set of coefficient estimates for all variables and all specifications for the five outcomes are in Online Appendix Tables B.2-B.6. The IK-optimal bandwidths for the outcomes are 0.128, 0.151, 0.197, 0.153, and 0.146, respectively. Given the definition of vote share into 5% bins, effective bandwidths are 0.125 for optimal bandwidth in (0.125, 0.175] and 0.175 for the one in (0.175, 0.225] implying 13,830 and 18,053 establishments included, respectively. IK, Imbens-Kalyanaraman.
Significant at *** 1%, ** 5%, * 10% level.
Specification (2) adds establishment pre-election inspection rate as a control variable. The estimated certification effect remains similar, 0.00860 (0.00363). The establishment’s own lagged outcome is a strong predictor, which raises the adjusted R2 from 0.0002 to 0.0566. To save space, Table 4 presents estimated coefficients for only the 1(union-certified) variable. For the inspection-rate outcome, estimated coefficients for all control variables are in Online Appendix Table B.2. We consider most of these estimates to be sensible. For instance, the establishment’s own pre-election inspection rate is a strong predictor of post-election inspection rate. Online Appendix Tables B.3 to B.6 present full estimates for other outcomes.
Specification (3) adds the vector of the other four lagged-outcome variables, size of the bargaining unit, and its square as controls. With these strong control variables, the estimated effect falls slightly to 0.00693 (0.00343) but remains significant. Specification (4) adds the set of industry-division indicators and the minor-industry fatality risk measure as predictors. Because it contains the richest set of control variables, we prefer to focus on specification (4). The estimate is similar to the others, 0.00722 (0.00339) with a 95% CI of +0.0006 to +0.0139. Taken together, this is consistent with a positive union-certification effect on the probability of OSHA inspection such that union certification causes an additional 7.2 inspections per 1,000 establishment per year.
To understand the magnitude, consider a few points of reference. In the private economy broadly, approximately 9 establishments per 1,000 were inspected in 2014. The effect would almost double that. In the analytic sample of establishments, the mean post-election inspection rate is 30 per 1,000, with an SD of 110 per 1,000. The estimated effect is approximately one-quarter of the mean level and about 7% of an SD.
The second panel of Table 4 presents estimates of union-certification effects across the analogous four specifications on union-representative share. The only difference is that in specification (2), adding the lagged-outcome control means adding lagged union-representative share rather than adding lagged inspection rate as we did in the first panel. Across the four specifications, the estimated effect is very stable, the standard error does not rise, and adjusted R2 does. In specification (4), the estimated effect of certification on union-representative share is 0.0710 (0.00918) with a 95% CI of +0.053 to +0.089. The mean (SD) in the post-election period is 0.06 (0.23) suggesting that the effect exceeds the mean and implies a 0.31 effect size. The estimates’ stability as strong control variables are added is consistent with the validity of the research design, as in an experiment. Scaling this up by 3.8 to approximate the effect if all establishments were inspected implies a 0.27 union-representative share effect of certification. That is, conditional on being inspected, certification raises the probability of having a union representative accompany the inspector by 27 percentage points.
The third panel reports the certification effect on the violation index. Again, the estimated effects are stable as more controls are added. In the richest specification, union certification is estimated to cause an increase in cited violations equivalent to 7.88% of an SD with a 95% CI of +1.0% to +14.8%. Recall that increasing the violation index by an SD is, on average, equivalent to having 0.28 additional violations per establishment annually in the post-election, control group. Therefore, a +7.88% of an SD effect of union certification on the violation index implies an increase of 2.2 violations per year per 100 establishments.
The fourth panel reports the certification effect on the OSHA penalty index. Estimated effects are again stable but significant at the 10% level, not 5%. The richest specification yields a point estimate of +7.35% of an SD with a 95% CI of –0.002% to +15.0%. This finding is similar in magnitude to the effect on violations. Certification causes an additional $139 in penalties per year per establishment on average.
Finally, the fifth panel reports the estimated certification effect on the injury index. Point estimates are stable across specifications. The preferred specification yields a point estimate of +12.0% of an SD but is not significant at the 10% level. A positive effect here is consistent with some combination of two mechanisms. Certification may actually cause more injuries, a real effect, or it may simply raise the probability of investigations leading to injury findings, a spurious channel. The injury index differs categorically from the other outcomes: inspection rate, union-representative share, violations, and penalties. Those are outcomes for which the OSHA data represent a reliable and complete census. By contrast, for injuries, these OSHA data are incomplete. In any case, the estimate is not statistically significant, a null result.
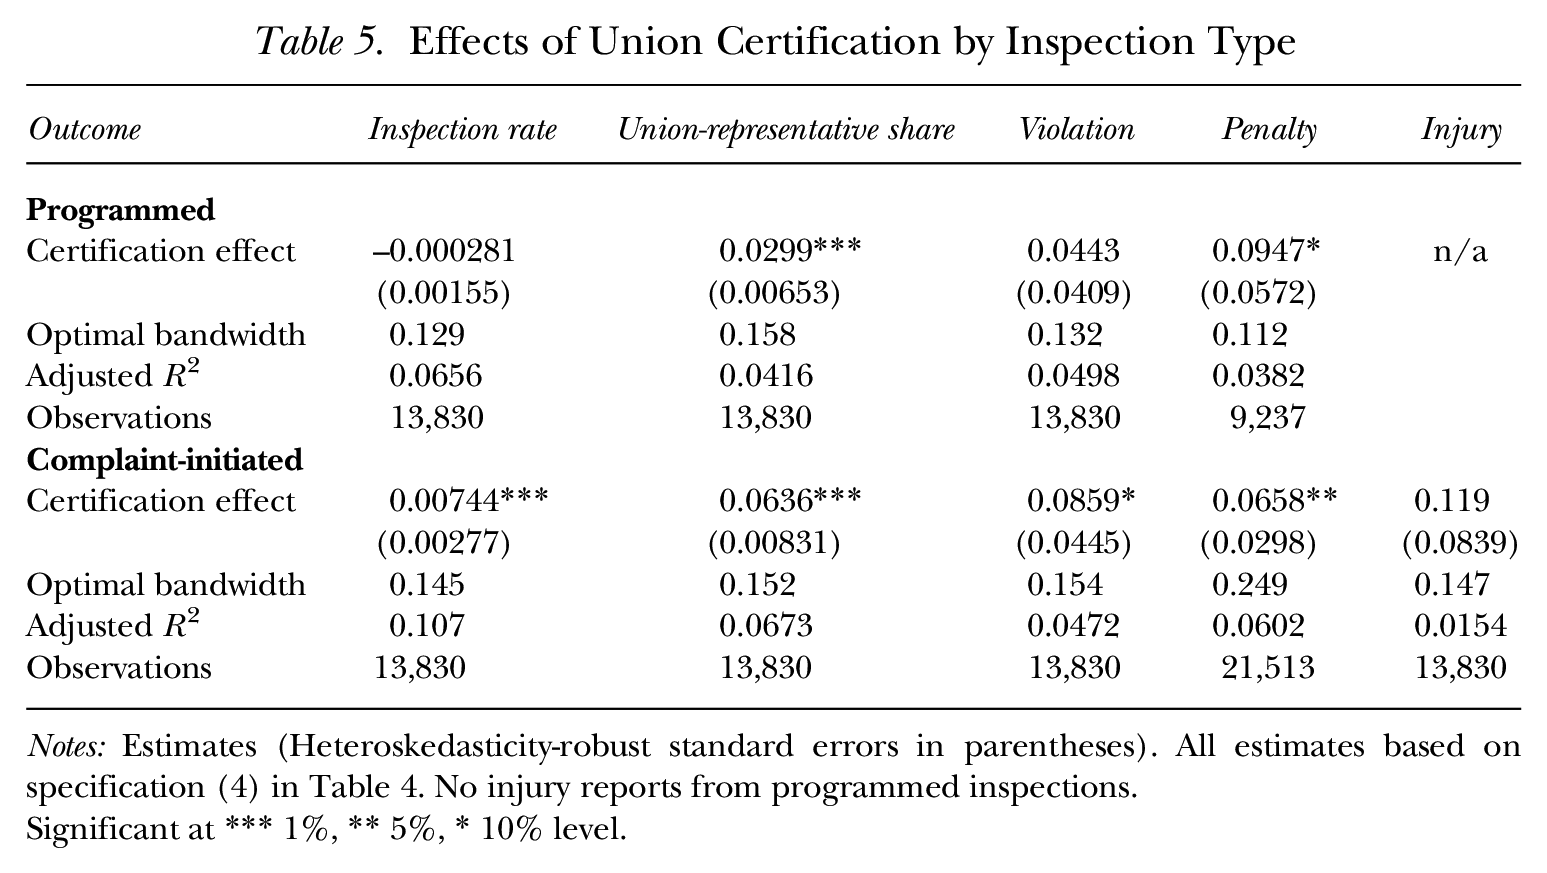
OSHA conducts two types of inspections: programmed and complaint-initiated. Programmed inspections depend on establishment characteristics other than unionization status and are scheduled centrally by OSHA staff looking across the whole universe of establishments. If our analysis found a large effect of union certification on programmed inspection rates, it would be a red flag that the design is flawed, though increased exercise of walk-around rights during programmed inspections could lead to additional violations and penalties. By contrast, complaint-initiated inspections are triggered by actions taken by workers, unions, or others. Union certification should primarily affect inspection rates through complaint-initiated, not programmed, inspections.
To check whether mechanisms are operating as expected, we construct two separate versions of each outcome, one based solely on programmed inspections and the other based solely on complaint-initiated ones. To keep units stable, we use scoring coefficients from Table 2 to construct penalty, violation, and injury indices. 7 Union certification effects are estimated on each. Table 5 displays results. First, the effect of certification on inspection rate operates completely through complaint-initiated inspections, as expected. Second, we observe significant increases in the exercise of walk-around rights in both types of inspections, consistent with certification leading to unionization, which increases general labor representation in the enforcement process. The effect is stronger for complaint-initiated inspections, consistent with unionization driving these reports. There is weak evidence of an increase in violations and penalties during programmed inspections, suggesting that having union representatives during inspections may increase enforcement intensity in some manner.
Effects of Union Certification by Inspection Type
Notes: Estimates (Heteroskedasticity-robust standard errors in parentheses). All estimates based on specification (4) in Table 4. No injury reports from programmed inspections.
Significant at *** 1%, ** 5%, * 10% level.
Evidence that certification causes increases in inspection rates, exercise of walk-around rights, violations, and penalties raises further questions about mechanisms. To provide evidence, we measure the share of inspections with any violations at the establishment level and analyze the effect of certification on this outcome. We obtain a tight null result—an estimated effect of +0.04% with 0.85% standard error. Certification increases complaint-initiated inspection probability and increases the share of all inspections attended by union representatives but not the share of inspections finding any violations conditional on inspection. This is a null result on the extensive margin of violations. Next, we look at the intensive margin of violations: Does certification cause more violations or more-severe violations to be found conditional on being inspected and having any violations? Here we start with our baseline estimator of the effect of certification on the violation index (Table 4, specification (4)) and add two additional control variables: an indicator of whether the establishment experienced any post-election inspections to “dummy out” the no-inspection case and the post-election inspection rate. We want to understand the extent to which an establishment’s post-election inspection rate absorbs the certification effect on the violation index. After controlling for post-election inspection rate, the estimated certification effect on the violation index is 0.050 (0.028) with p = 0.076. This is evidence that certification increases the intensive margin of violation intensity.
In sum, certification appears to increase exercise of walk-around rights on both programmed and complaint-initiated inspections. It increases complaint-initiated inspection rates but not programmed inspection rates. Conditional on inspection, it does not appear to affect the probability of any violations being found but does increase the intensity of violations cited and penalties levied.
Robustness and Limitations
We assess the robustness of the main results to three threats to internal validity: misspecification of the longitudinal-matching algorithm to define establishments; strategic manipulation in very close elections; and the use of alternative measures of penalty, violation, and injury propensity. In all these analyses, we use the richest specification, (4), as our baseline and deviate from that baseline in various ways. For compactness, we present only the estimated union-certification coefficient in each case.
First, we assess the robustness of the main results to misspecification of the longitudinal-matching algorithm to define establishments. The entire analysis is dependent on the algorithm that we used to measure records that belong to the same establishment within and across the NLRB and OSHA data sets. Within state and industry, the matching algorithm penalizes mismatched string values in the establishment name, address, and city fields. Matches with quality above a given threshold are retained. We constructed two alternative measures of which NLRB records belong to the same establishment by varying the threshold up and down. Each defines a somewhat dissimilar set of establishments and, consequently, a distinct set of focal elections. A more strict matching criterion generates fewer matches and so more unique establishments and focal elections; less strict implies fewer establishments. The more strict, baseline, and less strict criterion imply 31,151, 31,052, and 30,728 unique establishments, respectively. Consequently, all variables defined at the establishment level and the effect estimates vary somewhat. Table 6 presents estimates based on the two alternative match-quality thresholds, along with baseline estimates. Across all outcomes, results are stable.
Effects of Union Certification by Strictness of Matching-Algorithm Used to Construct Establishment Panel

Notes: Estimates (Heteroskedasticity-robust standard errors in parentheses). Establishments were matched using three different matching algorithms by strictness. All estimates based on specification (4) in Table 4. Baseline results are in the middle column (strgroup threshold 0.25). These are compared to results based on using stricter (0.2) and less strict (0.3) criterion. The total number of observations for all bandwidth for stricter criterion is 31,151, and 30,728 for less strict criterion. The IK-optimal bandwidths for the outcomes of stricter criteria are 0.133, 0.156, 0.189, 0.140, and 0.149, respectively. Also, IK-optimal bandwidths for the outcomes of less strict criteria are 0.133, 0.161, 0.206, 0.151, and 0.141 respectively. IK, Imbens-Kalyanaraman.
Significant at *** 1%, ** 5%, * 10% level.
Second, Frandsen (2013) reported evidence that, in very close elections, post-election legal maneuvering may undermine the key identifying assumption of the RDD. In the elections with the narrowest margins of victory (the smallest difference between the number of pro-union votes cast and the number of pro-union votes necessary for the union to win certification), incentives for manipulation are strongest and there is compelling evidence that management and unions are able to manipulate final vote counts in the elections with the narrowest margins of victory (MOV). As discussed earlier and displayed in Figure 2, evidence from the McCrary test is consistent with this kind of violation in our data. To deal with this, in the main analysis, we exploit the panel nature of the data by conditioning on pre-election lagged outcomes and covariates. Here, we use a second approach. Because concern about manipulation is greater when MOV is smaller, we use a donut-RD approach (Barreca, Guldi, Lindo, and Waddell 2011) to exclude establishments with the smallest MOV and assess how results change. Results, displayed and discussed in Online Appendix Table B.8, are qualitatively similar.
Third, we use more-conventional measures of violations, penalties, and injuries. For violations, instead of using factor analysis to aggregate across the multiple types of violations, we 1) compute the sum of violations within establishment across types within period, 2) divide by the number of years to produce total violations per year, and then 3) use log(1+total) as the establishment outcome. We do the same for penalties. For injuries, we do the same but apply the scaling factor in step 1 to convert from injury counts to injury rates per 1,000 establishment employees. We use post-election versions as outcomes and pre-election versions as controls. Table 7 presents specification (4) results using these alternative measures. Inspection rate and union-representative share have the same outcomes; these estimates differ only slightly from the main result, attributable only to using alternative measures as controls. Estimated effects on violations, penalties, and injuries all have the same sign and significance levels as in the main results, though the magnitudes differ somewhat and there is greater divergence for violations and penalties than in the main results.
Estimated Certification Effects Using Alternative Measures of Violations, Penalties, and Injuries

Notes: Estimates (Heteroskedasticity-robust standard errors in parentheses). All estimates based on specification (4) in Table 4.
Significant at *** 1%, ** 5%, * 10% level.
Conclusion
Union victory in close NLRB certification elections evidently leads to increased occupational-safety law-enforcement activity and increased worker representation in the enforcement process. Union certification increases the share of inspections that have a union representative participating by 27 percentage points conditional on having any OSHA inspection. This finding provides the strongest evidence in the literature documenting a rights-facilitation effect of unions. Our results imply that falling unionization rates nationally are reducing workers’ exercise of their rights to participate in the occupational safety enforcement process and weakening a private actor that may co-produce law enforcement along with agency staff.
Union certification appears to increase OSHA activity—inspection rates, violations cited, and penalties assigned—by approximately 7% of a standard deviation for each outcome. The rise is partly attributable to an increase in the rate of complaint-initiated inspections and, conditional on inspection, to the intensive margin of violations—more violations and more-extreme violations are found. It does not appear that certification affects the extensive margin of violations, which is the probability of finding any violations conditional on inspection.
The enforcement effects are driven by a spike in enforcement activity in establishments after unions win very close elections—those in which the union receives more than 50% but not more than 55% of the vote share—not after they win by larger shares. This result could simply be a statistical anomaly, but we find that explanation unlikely. It does suggest, however, a very localized effect—a close certification effect—rather than a general certification effect on enforcement activity. It is possible that unions that win by higher votes shares have recourse to alternative means of producing safety or alternative strategies for advancing members’ interests and that a strategy of initiating OSHA complaints and advocating for the finding of more severe violations and penalties has appeal particularly to these marginal units.
Despite union effects in increasing OSHA enforcement activity and consistent with the results in Li et al. (2018), we do not see evidence of a substantial reduction in occupational injury though we have access only to a flawed measure of injuries. 8 This result is consistent with three basic interpretations. On its face, a naïve interpretation suggests that increased enforcement activity does not increase safety and that the marginal enforcement activity is wasteful. This interpretation is consistent with the finding that the effects of OSHA inspections on workplace safety in manufacturing fell to nothing over 1987 to 1998, the first decade of our study period (Gray and Mendeloff 2005). Other interpretations also merit consideration. First, there may a real effect of unionization in increasing injury risk. Suppose unionization raises hourly pay and fringe benefits and management responds to this pressure on profits by seeking to reduce costs on other margins, including reducing job safety (Fairris 1995). In that case, OSHA may become more active either on its own or in response to increased worker and union reporting. We would observe a positive effect of unionization on OSHA enforcement activity. These enforcement efforts may succeed in holding the line on safety levels, thereby producing a null effect on safety. That is, the enforcement activity may raise safety above what would have been observed if workers unionized, received raises, and did not have recourse to OSHA. Second, certification may raise the likelihood that each injury is reported to OSHA. Even if unionization causes injury rates to fall, it may also cause reported injuries to rise.
Supplemental Material
ILRR_Sojourner_Yang_Supplemental_Online_Appendix – Supplemental material for Effects of Union Certification on Workplace-Safety Enforcement: Regression-Discontinuity Evidence
Supplemental material, ILRR_Sojourner_Yang_Supplemental_Online_Appendix for Effects of Union Certification on Workplace-Safety Enforcement: Regression-Discontinuity Evidence by Aaron Sojourner and Jooyoung Yang in ILR Review
Footnotes
Acknowledgements
We thank Suyoun Han and Christina Owen for excellent research assistance on this project, John Budd and Alison Morantz for helpful comments, and the U.S. Department of Labor Emerging Scholars Program for financial support.
Our data on NLRB elections are posted at https://www.dropbox.com/s/m92aw4vb1u3qy0n/nlrb_elections_19622009.dta?dl=0. Data from OSHA inspections are posted at 
For information regarding the data and/or computer programs used for this study, please address correspondence to
1
2
We transform raw vote shares following . We create 20 bins with a width of 5% and consider each establishment to have the vote share of the mid-point of its bin so that the possible values of X do not vary with the number of votes cast in the election. We also re-center so that the union-victory threshold has the value 0.
3
A limitation of our design is the inability to distinguish whether an establishment does not show up in the OSHA enforcement data because they are not operating or if they are operating but not inspected. Ideally, we would link to business registry data to distinguish these cases. Given the nature of our measures and results, however, under reasonable assumptions, this inability would create a negative bias in estimated certification effects. Outcome measures are attenuated down because an establishment may fail before the end of our observation window. In those cases, we divide by too many years before standardizing. If certification does not affect survival rates (Freeman and Kleiner 1999; Sojourner et al. 2015), this measurement error in outcomes is uncorrelated with certification but does diminish the contrast between establishments across the certification threshold, leading the estimator to be attenuated to 0. If certification lowers survival rates, as found in , then the attenuation is stronger in establishments in which certification occurs than in those it does not. This condition would lead to more negative bias in the estimator of certification effects. Given that our lack of registry data may cause negative bias in our estimator, our estimated positive effects are conservative and consistent with true effects that are larger.
4
Over a similar period, linked NLRB election data to the Census Longitudinal Business Database registry, which gives a measure of each establishment’s number of employees. In establishments with elections, the average number of voters is 93 and average number of employees is 254. The number of eligible voters, not turn-out rates, are reported. In our very similar sample, among focal elections with more than 20 voters, the average turnout rate ≡ #voters/#eligible = 0.89. To estimate the number of establishment employees at the time of the focal election from the number of eligible voters, we compute a scaling factor as #employees/#eligible = #employees×(turnout rate/#voters) = 254 × (.89/93) = 2.43. So, for each of the three types of injury counts, we construct an injury rate per 100,000 employees per year as (100,000×#count)/(2.43×#eligible×#years).
5
This notation indicates all numbers between 50 and 55; it does not include 50 but does include 55.
6
For the 74% of establishments with no linked OSHA records, “share of inspections attended by labor representatives” is not defined; the denominator is 0. In these cases, we set the measured share to 0. Because the effect of union certification in this 74% is 0 by construction, any observed non-zero effect of certification must be driven by the contrast among the 26% with linked OSHA records. To approximate the effect if all establishments experienced inspections, one might scale up the estimated effect by a factor of 3.8 (=1/0.26), which implies that certification would cause a 27 percentage point increase in union-representation share. This outcome is plausible given that only approximately half of certifications lead to enduring unionization (Ferguson 2008) and not every OSHA inspection in an establishment with any union workers has a labor representative participate. , figure IIIb) reported evidence that the probability of reaching first contract is not correlated with vote share, conditional on the union winning.
7
Generally, no injuries are associated with programmed inspections so we cannot construct measures for them.
8
Research has produced strong evidence of unions reducing fatal occupational injuries in mining historically (Boal 2009) and more recently (). Evidence from other settings has been mixed, however. Boal wrote, “Studies of unionism and occupational safety are surprisingly few and disappointingly inconclusive” (2009, 98). Morantz made a related point, “The empirical literature on the relationship between unionization and workplace safety presents a curious puzzle. On the one hand, scholars have documented numerous ways unions help to promote safe work practices. . . . Yet most empirical studies of the relationship between unionization and important safety outcomes, such as injuries and fatalities, have failed to find statistically significant evidence of a ‘union safety effect’” (2013, 88–89). We add to this body of work.
References
Supplementary Material
Please find the following supplemental material available below.
For Open Access articles published under a Creative Commons License, all supplemental material carries the same license as the article it is associated with.
For non-Open Access articles published, all supplemental material carries a non-exclusive license, and permission requests for re-use of supplemental material or any part of supplemental material shall be sent directly to the copyright owner as specified in the copyright notice associated with the article.
