



Abstract
This study examines how democracy, government ideology, and globalization have shaped social expenditures in 67 less developed countries from 1975 to 2005. The empirical results show that more democratic nations spend a greater amount on social security and welfare (SSW), while leftist governments spend more on education. This is because, in most less developed nations, SSW programs disproportionately benefit formal-sector workers, who tend to be the decisive voters in the countries, and education spending helps a broader spectrum of people. The article also examines factors related to globalization and finds that a higher level of external debt is strongly associated with reduced SSW spending, which imposes direct costs and burdens to business. The results in this article provide evidence that, even in less developed countries, political leaders’ commitment to social expenditures varies according to their electoral, ideological, and economic interests.
Keywords
In the past few decades, many less developed countries (LDCs) have experienced dramatic economic and political changes stemming from rapid market liberalization and democratization (Marshall and Jaggers, 2002). Leftist parties have grown stronger in various regions such as Asia, Central and Eastern Europe, and Latin America (Careja and Emmenegger, 2009; Kim, 2010; Levitsky and Roberts, 2011). Citizens in LDCs also increasingly believe that governments are responsible for providing for their citizens (Nooruddin and Rudra, 2014). From these trends flows the research question that motivates this study: How do these economic and political changes affect social spending in the less developed world?
In advanced industrial nations, this question is relatively easier to answer, as social expenditures are generally used to mitigate inequality and serve the underprivileged (Kollmeyer, 2012). 1 However, the effects are more nuanced in LDCs because in this context, political leaders historically used social spending for political control and patronage (Huber and Stephens, 2012; McGuire, 1999; Mares and Carnes, 2009; Mesa-Lago, 1994; Weyland, 1996). Social security and welfare (SSW) spending in LDCs, which is mostly directed to public pensions, tends to be allocated disproportionally to formal-sector workers, while education spending typically reaches a larger segment of the population (De Ferranti et al., 2004; Economic Commission for Latin America and the Caribbean (ECLAC), 2002; Huber and Stephens, 2012; Kaufman and Segura-Ubiergo, 2001; Kohli, 2004; Lindert et al., 2005; Pribble et al., 2009; Rudra, 2008; Rudra and Nooruddin, 2010; Wibbels and Ahlquist, 2011). Given the distinct characteristics of these two social spending categories, political leaders in LDCs are likely to have different policy preferences regarding which of these two approaches to prioritize. Therefore, the ideological orientation – left, center, or right – of these political leaders should play a significant role in shaping social expenditures. However, most of the comparative empirical studies on social welfare expenditures in LDCs pay little attention to the effect of the ideological orientation of the government; the literature generally focuses on the effects of regime type and/or economic factors. A few existing studies on the topic are limited to certain regional or nation-specific areas of the larger group of LDCs (Careja and Emmenegger, 2009; Huber et al., 2008; Kaufman and Segura-Ubiergo, 2001; Noy, 2011).
This article, by analyzing new data on the ideological orientation of government parties, extends the comparative study of the impact of partisan politics on social expenditures to a global sample of LDCs. To do this, I use fixed-effects panel regression to empirically investigate how democracy, government ideology, and globalization shape SSW and education expenditures in 67 LDCs from 1975 to 2005. The empirical results show that higher levels of democracy are positively associated with SSW expenditures, which appeal to decisive voters in LDCs, and that stronger leftist governments are positively related to education expenditures, which reach a larger population, including the lower-middle and lower classes. The findings provide support to the idea that government ideology as well as the level of democratization significantly influences the allocation of social expenditures in LDCs. I also find that the amount of external debt a nation holds is significantly and negatively associated with SSW expenditures, but has less impact on education expenditures. This suggests that SSW spending, perhaps because it is believed to reduce economic competitiveness, is more vulnerable to pressure from foreign investors than education spending, which is generally considered an investment that benefits economic growth. 2
This article is organized into four parts. In the first section, I discuss how democracy and government ideology shape SSW and education expenditures in LDCs. I also discuss how factors related to globalization, such as trade, foreign direct investments (FDI), and external debts, can affect social expenditures in LDCs. In the second section, I detail the data sources and statistical models used in the empirical analysis. The third section presents the results of the statistical models. The last section discusses the implications of the results and identifies some important unanswered questions for future research.
Literature and theory
The effect of democracy and government ideology on social spending
Most scholars who study social spending in LDCs focus on a state’s regime type – whether it is democratic or authoritarian – as the main political explanatory factor (see, for example, Brown and Hunter, 1999; Kaufman and Segura-Ubiergo, 2001; Nooruddin and Simmons, 2009; Rudra and Haggard, 2005). According to median voter theorem, the median voter is the decisive voter in an electoral democracy, and political leaders have strong incentives to respond to the interests of the median voter (Downs, 1957). Because the median voter’s income is below the mean income in most societies, the median voter prefers redistributive policies (Meltzer and Richard, 1981). Confronting electoral competition between political groups, political leaders in democratic regimes have strong incentives to provide public goods to satisfy the median voter. On the other hand, political leaders in authoritarian regimes face less electoral pressure to deliver public goods and are subject more to individual pressures or favoritism from the upper class.
As a greater number of regimes become more democratic, this should provide the opportunity for the less well-off to pressure political leaders for redistributive policies – especially because democratization often allows underprivileged groups to form political organizations. However, increased electoral competition does not necessarily guarantee greater representation for the poor or middle class. Because voters with higher socioeconomic status are well endowed with individual resources and motivation, the upper- to upper-middle classes in LDCs are often the decisive groups in elections (Nel, 2005; Verba et al., 1995). Voters with lower socioeconomic status also tend to have incomplete voting information (Keefer and Khemani, 2005) and vote at lower rates (Acemoglu and Robinson, 2008; Robinson, 2010) – and are thus underrepresented in the political system (Verba et al., 1995). If the wealthy dominate electoral politics, government policies will more likely maintain or reinforce their interests; in this fashion, democracy may attenuate spending on redistributive policies. This effect can be checked when the poor and lower-middle classes are well organized and effectively represented by democratic political institutions.
Following this logic, the strength of leftist parties and their participation in government should be an important condition for the achievement of greater redistribution in LDCs. In general, the expectation is that political leaders who lean left will prioritize social welfare concerns and the interests of the poor and thus favor redistributive policies that help these groups. In contrast, governments that are right-leaning will favor growth and prosperity without regard for the distributive consequences. According to ‘power resource theory’ or ‘political class struggle approach’, the distribution of political power between leftist, centrist, and rightist parties is a significant determinant of the size of welfare states and how they allocate resources to various kinds of social welfare projects (Huber and Stephens, 2001). Leftist governments aligned with strong labor unions tend to favor generous and inclusive social welfare policies, whereas rightist and centrist governments tend to spend less on these kinds of programs (Esping-Andersen, 1985; Garrett, 1998; Huber and Stephens, 2001).
However, compared to the extensive research literature on democracy, scholars studying LDCs pay less attention to the impact of political ideology on redistributive policies – mainly because they consider parties and voters in LDCs to be less ideologically and programmatically oriented than those in established democracies (Mainwaring and Torcal, 2006). But, recent studies of LDCs show that parties do cohere programmatically and represent voters’ policy preferences and policymakers’ party affiliation, and that ideological orientation does affect policy formation (Baker and Greene, 2011; Kim, 2010; Lipsmeyer, 2000; Luna and Zechmeister, 2005; Murillo, 2001). Recent empirical studies find that the ideological orientation of political leadership affects policy on a wide range of issues that include income inequality (Ha, 2012; Huber et al., 2006; Huber and Stephens, 2012), the welfare of the poor (London and Williams, 1990; Moon and Dixon, 1985; Pribble et al., 2009), monetary policies (Mukherjee and Singer, 2008), and how a government responds to financial crises (Ha and Kang, 2015).
In their cross-country study of 116 countries, 1970–1975, Moon and Dixon (1985) find that leftist regimes tend to provide more for basic needs as their state strength increases, whereas rightist regimes tend to provide less for basic needs as their state strength increases. Moon and Dixon (1985) code leftist, centrist, and rightist regimes based on government norms 3 and measure state strength using central government expenditures as a percentage of gross national product. They measure the provision of basic needs using the Physical Quality of Life Index (PQLI), which combines measures of infant mortality, literacy, and life expectancy. London and Williams (1990) expand Moon and Dixon’s (1985) analysis to a broader cross-section of national populations using the Index of Net Social Progress (INSP). The INSP combines 41 different indicators including education progress, health status, economic growth, demographic conditions, political stability, political participation, cultural diversity, and welfare effort. Consistent with Moon and Dixon’s (1985) findings, London and Williams (1990) also find that leftist regimes with greater state strength tend to have higher INSPs, even under the penetration of multinational corporations and trade dependency, whereas rightist regimes with greater state strength tend to have lower INSPs.
Importantly, both studies find that state strength by itself is strongly and negatively associated with PQLI and INSP, but it is significantly and positively related with the two measures when interacted with leftist regime. The results suggest that larger central government expenditures per se do not improve the well-being of the poor (PQLI) or the population (INSP) – but is determined by who allocates the resources. Following these results, researchers should pay close attention to the role government ideology plays in shaping different kinds of social welfare spending.
However, only a few empirical studies explore the impact of the ideological orientation on social expenditures in LDCs. In a study of 14 Latin American countries, 1973–1997, Kaufman and Segura-Ubiergo (2001) find that SSW spending is positively associated with ‘popularly based’ presidents. The orientation of president is coded based on the founding coalition or constituency of the president’s party: a president is coded as 1 if his or her party is ‘closely connected with labor unions’ (e.g. Peronists in Argentina) and/or oriented toward ‘the popular sector’ (e.g. the Movimiento Nacionalista Revolucionario (MNR) or Siles Suazo in Bolivia), and 1 otherwise. In a study of 18 Latin American countries from 1970 to 2000, Huber et al. (2008) analyze social spending using the ‘legislative partisan balance’ and the ‘executive partisan balance’. These two indices track the cumulative ideological center of gravity in the lower house and executive, respectively, from 1945 to the year of the observation, but they find no statistically significant relationships. In a study of 23 Latin American and Caribbean countries, 1980–2000, Noy (2011) finds that leftist power, measured by the proportion of leftist seats in legislature, has little impact on SSW and health spending as a share of gross domestic product (GDP). In a study of 12 Central and Eastern European countries from 1993 to 2002, Careja and Emmenegger (2009) find that the presence of strong leftist parties in government is significantly and robustly associated with larger total public and social expenditures.
In summary, although some scholars analyze the impact of government ideology on welfare spending, existing empirical studies are limited in geographic scope, and empirical results are mixed. In an effort to better test the theory discussed above, this study redirects findings by analyzing a global sample of LDCs.
Distributional effects of social spending
According to median voter and power resource theory, a more democratic and a more leftist government should spend more on social programs. However, there are some reasons to challenge this expectation, primarily because SSW schemes in LDCs are often inefficient and poorly targeted (Barat et al., 2003; Castro-Leal et al., 1999; Reinikka and Svensson, 2004). In addition, SSW schemes in most LDCs were designed as instruments of political control and patronage (Huber and Stephens, 2012; Kwon, 2005; McGuire, 1999; Mares and Carnes, 2009; Mesa-Lago, 1994; Weyland, 1996). According to Mares and Carnes (2009), most SSW programs in LDCs were first created by authoritarian regimes. Their study finds, in a sample of 51 LDCs, that authoritarian governments started 87 percent of old age, 86 percent of disability, 85 percent of sickness, and 38 percent of unemployment programs. SSW schemes in LDCs were often implemented in a ‘top-down’ fashion: first established for privileged groups such as civil servants and military officers and then extended to white-collar workers and then, in some cases, to well-unionized blue-collar workers and to general formal-sector workers (Huber et al., 2008). Even in LDCs with less pervasive clientelism and patronage, social welfare provisions are often limited to the formal sector, which covers only roughly 10 percent of the workers in most LDCs (International Labor Organization, 2001).
SSW spending in most LDCs is employment and contributory based 4 and allocated disproportionally to upper to middle classes (De Ferranti et al., 2004; ECLAC, 2002; Huber et al., 2008; Huber and Stephens, 2012; Kaufman and Segura-Ubiergo, 2001; Kohli, 2004; Kwon, 2005; Lindert et al., 2005; Noorrudin and Rudra, 2014; Orenstein, 2008; Pribble et al., 2009; Rudra, 2008; Wibbels and Ahlquist, 2011). For example, approximately 50 percent of social security spending in Brazil 1997 and Uruguay 1998 was distributed to the top quintile, and less than 8 percent went to the bottom quintile of household income groups in each country (Huber and Stephens, 2012). Since only formal-sector workers (i.e. the beneficiaries) contribute to the SSW system, one may assume that SSW spending is not necessarily unfair to the non-beneficiaries. However, welfare benefits in LDCs are often financed not just by payroll taxes from workers and employers but also subsided by general taxes (Haggard and Kaufman, 2008; Huber and Stephens, 2012). So, informal-sector workers subsidize the benefits paid to formal-sector workers to the extent that they pay indirect taxes (e.g. value-added taxes). So, although the public pension plans in most LDCs are defined as ‘pay-as-you-go’ systems, most beneficiaries in LDCs ‘contribute much less (sometimes nothing) than they receive, receive a full pension after only a limited years in the workforce, and retire and collect at a relatively early age’ (Rudra and Nooruddin, 2010: 11).
In contrast to many LDCs, Central and Eastern European countries had universal pension systems during the communist period, but most of them changed to pay-as-you-go systems during the political and economic transition of the 1990s. However, many governments in Central and Eastern Europe still fund budget deficits in their pension systems (Lipsmeyer, 2000). Even when LDC governments do not deliberately manipulate social insurance to benefit clients, they often lack the administrative capacity to enforce equal contributions to social insurance (Mares and Carnes, 2009). Although some countries implement non-employment-based and more progressive SSW programs, such as non-contributory pensions and conditional cash transfers, these expenditures are still relatively scarce and poorly funded in most LDCs (De Ferranti et al., 2004; Morley and Coady, 2003; Pribble et al., 2009; Ross, 2006).
Compared to SSW spending, education spending in LDCs typically reaches a larger segment of the population, including the lower-middle to lower class (Huber and Stephens, 2012; Pribble et al., 2009; Rudra, 2008). Education spending on primary and secondary schools is generally considered pro-poor because, in most regions, poorer families have more young children who attend school at the primary level. Several studies show that public expenditures on primary and secondary education have a progressive effect, whereas expenditures on tertiary education are regressive because these funds support higher income students (ECLAC, 2002; Haggard and Kaufman, 2008; Milanovic, 1995; Wodon, 2003). However, the progressive components of education spending in general outweigh the regressive components, and thus education spending has progressive effects overall (De Ferranti et al., 2004; Huber and Stephens, 2012; Lindert et al., 2005). Compared to patronage-ridden SSW programs, education services in LDCs are provided as the ‘rights of citizens’ and thus have better coverage for all sectors of society (Pribble et al., 2009). Thus, in summary, education spending in LDCs is generally considered to be broadly beneficial as compared to SSW spending (De Ferranti et al., 2004; ECLAC, 2002; Huber et al., 2006; Huber and Stephens, 2012; Kaufman and Segura-Ubiergo, 2001; Lindert et al., 2005; Pribble et al., 2009; Rudra, 2008).
Leftist parties in government have made efforts to expand social policy programs, reform the regressive nature of some social policies (e.g. pension systems), and redirect the benefits toward the poor (e.g. basic income support programs for poor families). However, leftist parties are often constrained in implementing and administering social policy program, by limited state capacity, and by their own constituencies, particularly trade unions (Cook et al., 1999; Haggard et al., 2013; Haggard and Kaufman, 2008; Mares and Carnes, 2009; Mesa-Lago, 1985; Pierson, 1996; Weyland, 1996). As LDCs developed social policy programs, privileged groups formed rent-seeking distributional coalitions (Mesa-Lago, 1985; Pierson, 1996; Weyland, 1996). These relatively small, but politically powerful, coalitions vigorously defend their existing benefits (Mesa-Lago, 1985; Pierson, 1996; Weyland, 1996). Because SSW schemes often divide benefits between secure, higher-paid, formal-sector workers and precarious, lower-paid, informal-sector workers, labor unions in LDCs often face a collective action problem (Harris and Todaro, 1970). Labor union members who enjoy social insurance privileges oppose the expansion of coverage (which would dilute their existing benefits) and retrenchment of programs that are traditionally focused on them (Haggard et al., 2013; Haggard and Kaufman, 2008; Mares and Carnes, 2009). Therefore, SSW schemes in LDCs are in different stages, but the benefits to rural and informal workers still lag far behind those enjoyed by the upper to upper-middle classes.
The effect of globalization on social spending
Most studies on the impact of globalization on social expenditures make a case for either the efficiency or the compensation thesis. The efficiency thesis argues that increased competition in trade and financial markets pressures states to limit welfare spending (Aspinwall, 1996; Nooruddin and Simmons, 2009; Rudra, 2008; Strange, 1996). According to the efficiency thesis, generous welfare programs raise production costs and reduce profit margins by increasing tax burdens and regulatory barriers and making the labor-market less flexible. As domestic producers are exposed to international markets and capital becomes mobile, governments have to cut generous welfare programs to help producers compete effectively in the global market and to encourage international firms and financial institutions to invest in the domestic economy. Market liberalization can also affect social welfare programs by causing economic volatility and balance of payment crises, which can limit a government’s ability to spend freely (Wibbels, 2006).
The compensation thesis argues that economic integration induces states to expand social expenditures in order to provide social safety nets for those hurt by economic competition (Cameron, 1978; Garrett, 1998; Rodrik, 1998). Because greater market liberalization creates social dislocations and economic insecurity, increased market exposure will increase demands for welfare expenditures to cushion the impact. Thus, to guard against political instability, political leaders will strengthen social insurance mechanisms to shield exposed citizens and to maintain public support for free trade. 5
The effects of globalization – created by trade flows, foreign investment flows, or external debts – have different effects on different kinds of social welfare spending. SSW expenditures are likely to be more susceptible to the competitive pressures of the integrated world market because they create unnecessary tax burdens and obstruct the efficient operation of the market. In a relatively closed economy, employers can easily pass the costs of SSW spending to consumers. But with more openness, SSW transfers are a direct and high cost to employers because they add to the wage bill, yet are not easily passed on to consumers. Still, because trade liberalization hurts the historically protected and politically powerful import-competing sectors and their privileged organized laborers, political leaders in LDCs may also have strong incentive to mollify these groups through increased SSW expenditures.
Education expenditures are also subject to efficiency pressure to the extent that they are funded by government tax revenues. Yet, public education is generally viewed as a tool to enhance the skill level and the productivity of the labor force. Trade liberalization and FDI in LDCs increase skill premium and thus significantly and broadly increases the demand for skills (Acemoglu, 2003; Feenstra and Hanson, 1997; Hanson and Harrison, 1999; Mazumdar and Mazaheri, 2000; Robbins, 1995). Holding technology constant, increased supply of skilled labor reduces the skill premium. As the quality of education increases, the level of skill in the labor force rises, and this should produce higher returns to the national economies (Birdsall, 1996). As demonstrated by the economic success of East Asian countries, educational investment is particularly important for producing productive labor and promoting long-term economic growth (Barro, 1991). Given this, employers and foreign investors may be less concerned about (or even favor) higher expenditures on education in the long term to the extent that government finances them with revenues from non-corporate taxes. As such, efficiency pressure may favor a nation spending on education as compared to SSW programs. 6
To sum up the discussion thus far: although most studies on social welfare programs in LDCs focus on the increased electoral pressure that democratization creates, the discussion should also be extended to include the ideological orientation of the government – as well as economic pressures related to globalization. Given the conflicting theoretical arguments and empirical evidence, the next section of the article uses a statistical model to examine the impact of democracy, ideology, and globalization on the two major types of social spending policies while controlling for a variety of demographic and economic factors.
Variables and models for analysis
The dependent and independent variables used in this article are outlined in the following section; Appendix 1 contains a detailed description of the variables and data sources.
Social expenditures
The main dependent variables are government expenditures on SSW and education as a percentage of GDP, compiled from the International Monetary Fund’s (IMF) Government Finance Statistics. Expenditures on SSW include (1) sickness, maternity, and temporary disablement benefits, (2) government employee pension schemes, (3) old age, disability, and survivors’ benefits other than for government employees, (4) family and child allowances, children’s residential institutions, (5) unemployment compensation benefits, (6) housing as social assistance to persons, and (7) research and development on social protection. Expenditures on education include (1) pre-primary and primary education and services, (2) secondary education and services, (3) post-secondary (non-tertiary) education, (4) tertiary education, (5) education not definable by level, (6) subsidiary services to education, and (7) research and development on education. Government Finance Statistics data on SSW spending in LDCs do not provide data that distinguish between contributory and non-contributory benefits nor do they provide separate data for pension expenditures.
Government ideology
Government ideology is the ideological orientation – left, center, or right – of the government. The government ideology variable used in this article comes from the data set of party ideology and chief executives’ ideology compiled by the author (Ha, 2007, 2012). The World Bank’s Database of Political Institutions (DPI) codes the three largest government parties as left, center, and right. DPI categorizes the parties first by asking ‘whether the orientation of a party was immediately obvious from its name or its description in the Political Handbook of the World’ and then by checking party policy positions regarding ‘state control of the economy’ on a standard left-right scale (Beck et al., 2001). Parties are coded ‘right’ if ‘conservative’, ‘Christian democratic’, or ‘right-wing’ are included in their names or cross-check sources. Parties are labeled as ‘left’ if ‘communist, socialist, or social democratic’ or the label ‘left-wing’ are included in their names or in the cross-check sources. Parties are classified as ‘centrist’ when parties emphasize ‘private enterprises with a social-liberal context but also support redistribution’ in their names or in the sources.
Although DPI is the only available data set that covers a wide range of LDCs and years, the data set has three limitations. First, DPI covers only the three largest government parties. This can generate significant measurement errors when there is a fourth or fifth largest government party with only one or two seats fewer than the third party. Second, DPI contains errors and missing values in government composition data. For example, Taiwan Solidarity Union (2002–2004), which does not have any cabinet portfolio, is coded as a government party. Third, DPI does not provide the government formation dates, but uses election dates, which can generate some measurement errors.
Accordingly, I improve DPI’s government party data in the following three ways. First, I expand the government party data to include all government parties. Second, I refine the government composition data by including parties with cabinet portfolios only and fill in any available missing data. Finally, I code government formation dates with cabinet formation dates (and election dates when cabinet formation dates are unavailable). When two or three governments with different ideological preferences coexist in the same year, I weigh my government ideology data by the number of dates that each government spent in power in the year (see Appendix 2 for detailed coding rules, data resources, and data quality checks).
Using this revised data set, I create an improved measure of government ideology. When calculating government ideology, I treat government parties as veto players, which are defined as individual or collective actors whose agreement is required for policy change (Tsebelis, 2002). As veto players, all parties in a coalition government have an ‘opportunity to exercise veto power’ on policy decisions (Tsebelis, 2002: 87). If the parties in a coalition government have different policy positions, they will adjust them to a shared policy position. If they cannot agree on the adjustment, the coalition government will confront a crisis and dissolve.
Because all parties in a coalition government are considered to be veto players, they should have equal influence on policy change, regardless of their number of seats in the legislature (or their number of cabinet portfolios). Therefore, I generate the government ideology variable by summing the ideological positions of each party in government (left = 1, center = 0, and right = −1) and dividing this sum by the number of government parties. For authoritarian governments (where no parties are legally allowed), I assume that a dictator is the only veto player in the political system and use his or her ideological preference to generate the government ideology variable. As a result, the government ideology variable ranges from −1 (rightist) to 1 (leftist). The government ideology measure has the advantage of showing changes in government ideology in any direction (e.g. from rightist to centrist or centrist to leftist).
Democracy
I use the democracy measurement from the Polity IV data set, which measures regimes type using two indices, each with a 0–10 range (Marshall and Jaggers, 2002). Polity measures democracy as a weighted sum of the competitiveness and openness of executive recruitment, the regulation and competitiveness of participation, and constraints on the chief executive (Marshall and Jaggers, 2002). One index measures the democratic characteristics of the regime and the second index measures the autocratic characteristics of the regime. Following the precedent of many other studies on democracy and government expenditures, I measure the level of democracy by the difference between the democracy index and the autocracy index. As a result, this variable ranges from −10 (most autocratic) to 10 (most democratic).
Checks
The checks and balances of representative government may constrain government ability to expand social expenditures by increasing the number of veto players who can block policy changes (Ha, 2008; Huber and Stephens, 2001; Tsebelis, 2002). The checks and balances are measured by the variable Checks from DPI. In presidential systems, the value of Checks is added by 1 for the president, 1 if the president is competitively elected, 1 for each legislative chamber, and 1 if the ideological orientation (left, right, or center) of the first government party is closer to the orientation of the first opposition party than to that of the party of the president. The legislature is not counted as a check if the legislature is elected with a closed list and the president’s party has a majority in the legislature. Similarly, the legislature is not counted as a check if it is not competitively elected, assuming that the president entirely controls policy. In parliamentary systems, the process is similar. Yet, the value of Checks is increased by 1 for the prime minister (instead of the president) and by 1 for the number of parties in the coalition government; it is reduced by 1 if the legislature is elected with a closed list and the coalition government includes the prime minister’s party.
Globalization
Globalization is measured by three variables: trade openness, FDI, and external debts, compiled from the World Bank’s World Development Indicators. Trade openness is measured by the sum of imports and exports as a percentage of GDP; FDI is measured by the sum of inflows and outflows as a percentage of GDP. External debts are measured by total external debt as a percentage of gross national income (GNI).
Controls
To isolate the effects of democracy, ideology, and globalization, I also include control variables that are commonly used in research on social expenditures.
First, GDP per capita and economic growth are common control variables because both can have an impact on welfare spending. A higher level of economic development and economic activity increases the revenue base used to support welfare spending. At the same time, economic growth leads to greater social welfare and economic activity, which can reduce the number of people who need social benefits, resulting in automatic and discretionary decreases in welfare spending (Ha, 2008). Therefore, I include logged GDP per capita (adjusted for purchasing power parity) and growth of GDP percentage change from previous year.
Second, the proportion of population age groups is another common control because an older population is more likely to result in increased SSW spending, and a younger population would be expected to result in increased education spending. The size of the senior age group in a country is measured by the proportion of the population aged 65 years and older; the size of the youth age group is measured by the proportion of the population aged 14 years and younger.
Third, the proportion of a country’s population living in cities may also impact SSW spending. Larger urban populations are likely to increase social expenditures as urban residents have more access to information, access to social insurance and services, and higher expectations in terms of living standards (Lipton, 1977). Urban population is measured by the percentage of the population living in areas defined as urban.
Fourth, the inflation rate can either reduce or increase welfare spending (Ha, 2008). Inflation reduces real monetary value. Accordingly, an increased inflation reduces social expenditures. Yet, policymakers under political pressure can overcompensate for inflation and increase welfare spending.
Finally, when a country receives loans from the IMF, its government is typically required to adjust its macroeconomic policies along the lines of specific policy recommendations known as IMF conditionalities (Dreher, 2006). Usually, the IMF recommends both monetary and fiscal tightening policies for loan recipients. This external pressure might be even more severe under the conditions of a financial crisis, which hit many LDCs in recent decades. Based on Laeven and Valencia’s (2008) financial crisis data, I code a dummy variable as 1 if a country suffers a financial crisis (currency, banking, or sovereign debt) in a given year, and 0 otherwise. Following Vreeland (2007), the dummy of IMF program participation is coded as 1 if a country has a Stand By, Extended Fund Facility, or Structural Adjustment Facility agreement with the IMF in operation in a given calendar year, and 0 otherwise.
Models
For this article, I build a series of regression estimates of SSW and education expenditures in 67 LDCs for the years 1975–2005 (see Appendix 1 for a full list of included countries). LDCs included in the data analysis are middle- and low-income countries, conventionally defined in the literature as those excluding the high-income Organization for Economic Cooperation and Development countries.
To analyze the panel data, I use the fixed-effects model with robust-cluster standard errors. Regression model estimation from panel data is problematic because errors are often not independent across observations, and ordinary least squares regression procedures produce incorrect standard errors for coefficients (Greene, 1993). These correlated errors in panel data can be dealt with several ways. First, one can use a unit-specific autoregressive process (which can be constrained to be the same across units) if the errors are serially correlated within each unit. However, this approach requires temporally dominated panel data (i.e. panel data with relatively few units but many time points; Beck and Katz, 1995). The data used in this article do not satisfy the condition because the number of time points (31) is much smaller than the number of units (67). Another approach is a random-effects model, where the error term is assumed to contain a unit-specific component, which differs across units but is stable over time for a given unit. The stable unit-specific component suggests that observations for the same unit are correlated by the same amount ρ at different time points. While the random-effects model strategy is feasible with my data, it requires rather strong assumptions that errors are equally correlated within units. 7
Therefore, I adopt an alternative estimation strategy, which deals with the correlation problem with a robust-cluster estimator of the standard errors. The standard Huber-White robust estimator provides correct standard errors even when the variance of the error terms is unequal (heteroskedastic), but not when the errors are correlated (i.e. when the covariance matrix of the errors has nonzero off-diagonal elements; Long and Ervin, 2000). The robust-cluster variance estimator, a variant of the Huber–While robust estimator, provides correct standard errors even in the presence of any pattern of correlations among errors within units such as serial correlation and correlation attributable to unit-specific components (Sribney, 1998). The likelihood-ratio test with iterated generalized least squares and the Wooldridge test for serial correlation in panel data indicate that there are panel-level heteroskedasticity and autocorrelation in the data (Wiggins and Poi, 2013). The fixed-effect model with robust-cluster standard errors used in this article is robust to the heteroskedasticity and within-panel (serial) correlation (Wooldridge, 2013)

The model above is used to analyze the effects of democracy, government ideology, and globalization on social expenditures. Social spending denotes SSW and education spending (% GDP). Government ideology denotes the ideological orientation of government, and Polity denotes democratic development. Globalization is measured by Trade (% GDP), FDI (% GDP), and External debts (% GNI). The βs are parameter estimates, k indicates control variables, and the subscripts i and t denote the country and year of the observations, respectively.
Results of analyses
The results of my statistical analyses are summarized in Tables 1 to 3. Table 1 first reports the results for SSW expenditures (% GDP). Among the explanatory variables, Checks is highly correlated with Polity (r = 0.60), and urban population is also highly correlated with logged GDP per capita (r = 0.77; see Appendix 3 for correlation table). These correlations are natural because more democratic countries have stronger checks and balances in the political system and urbanization follows industrialization in LDCs. Tests for collinearity show that there are no serious issues as the variance inflation factor is smaller than 3.1 for all variables. Regression [1] shows that the results are robust without Checks and urban population. Democratic development may provide more opportunity for leftist parties to be represented in the government. In fact, the correlation between Polity and government ideology is very low (r = −0.07) in the sample of LDCs. Still, regressions [2] and [3] test models without Polity and government ideology, respectively.
The impact of globalization and political institutions on SSW spending.
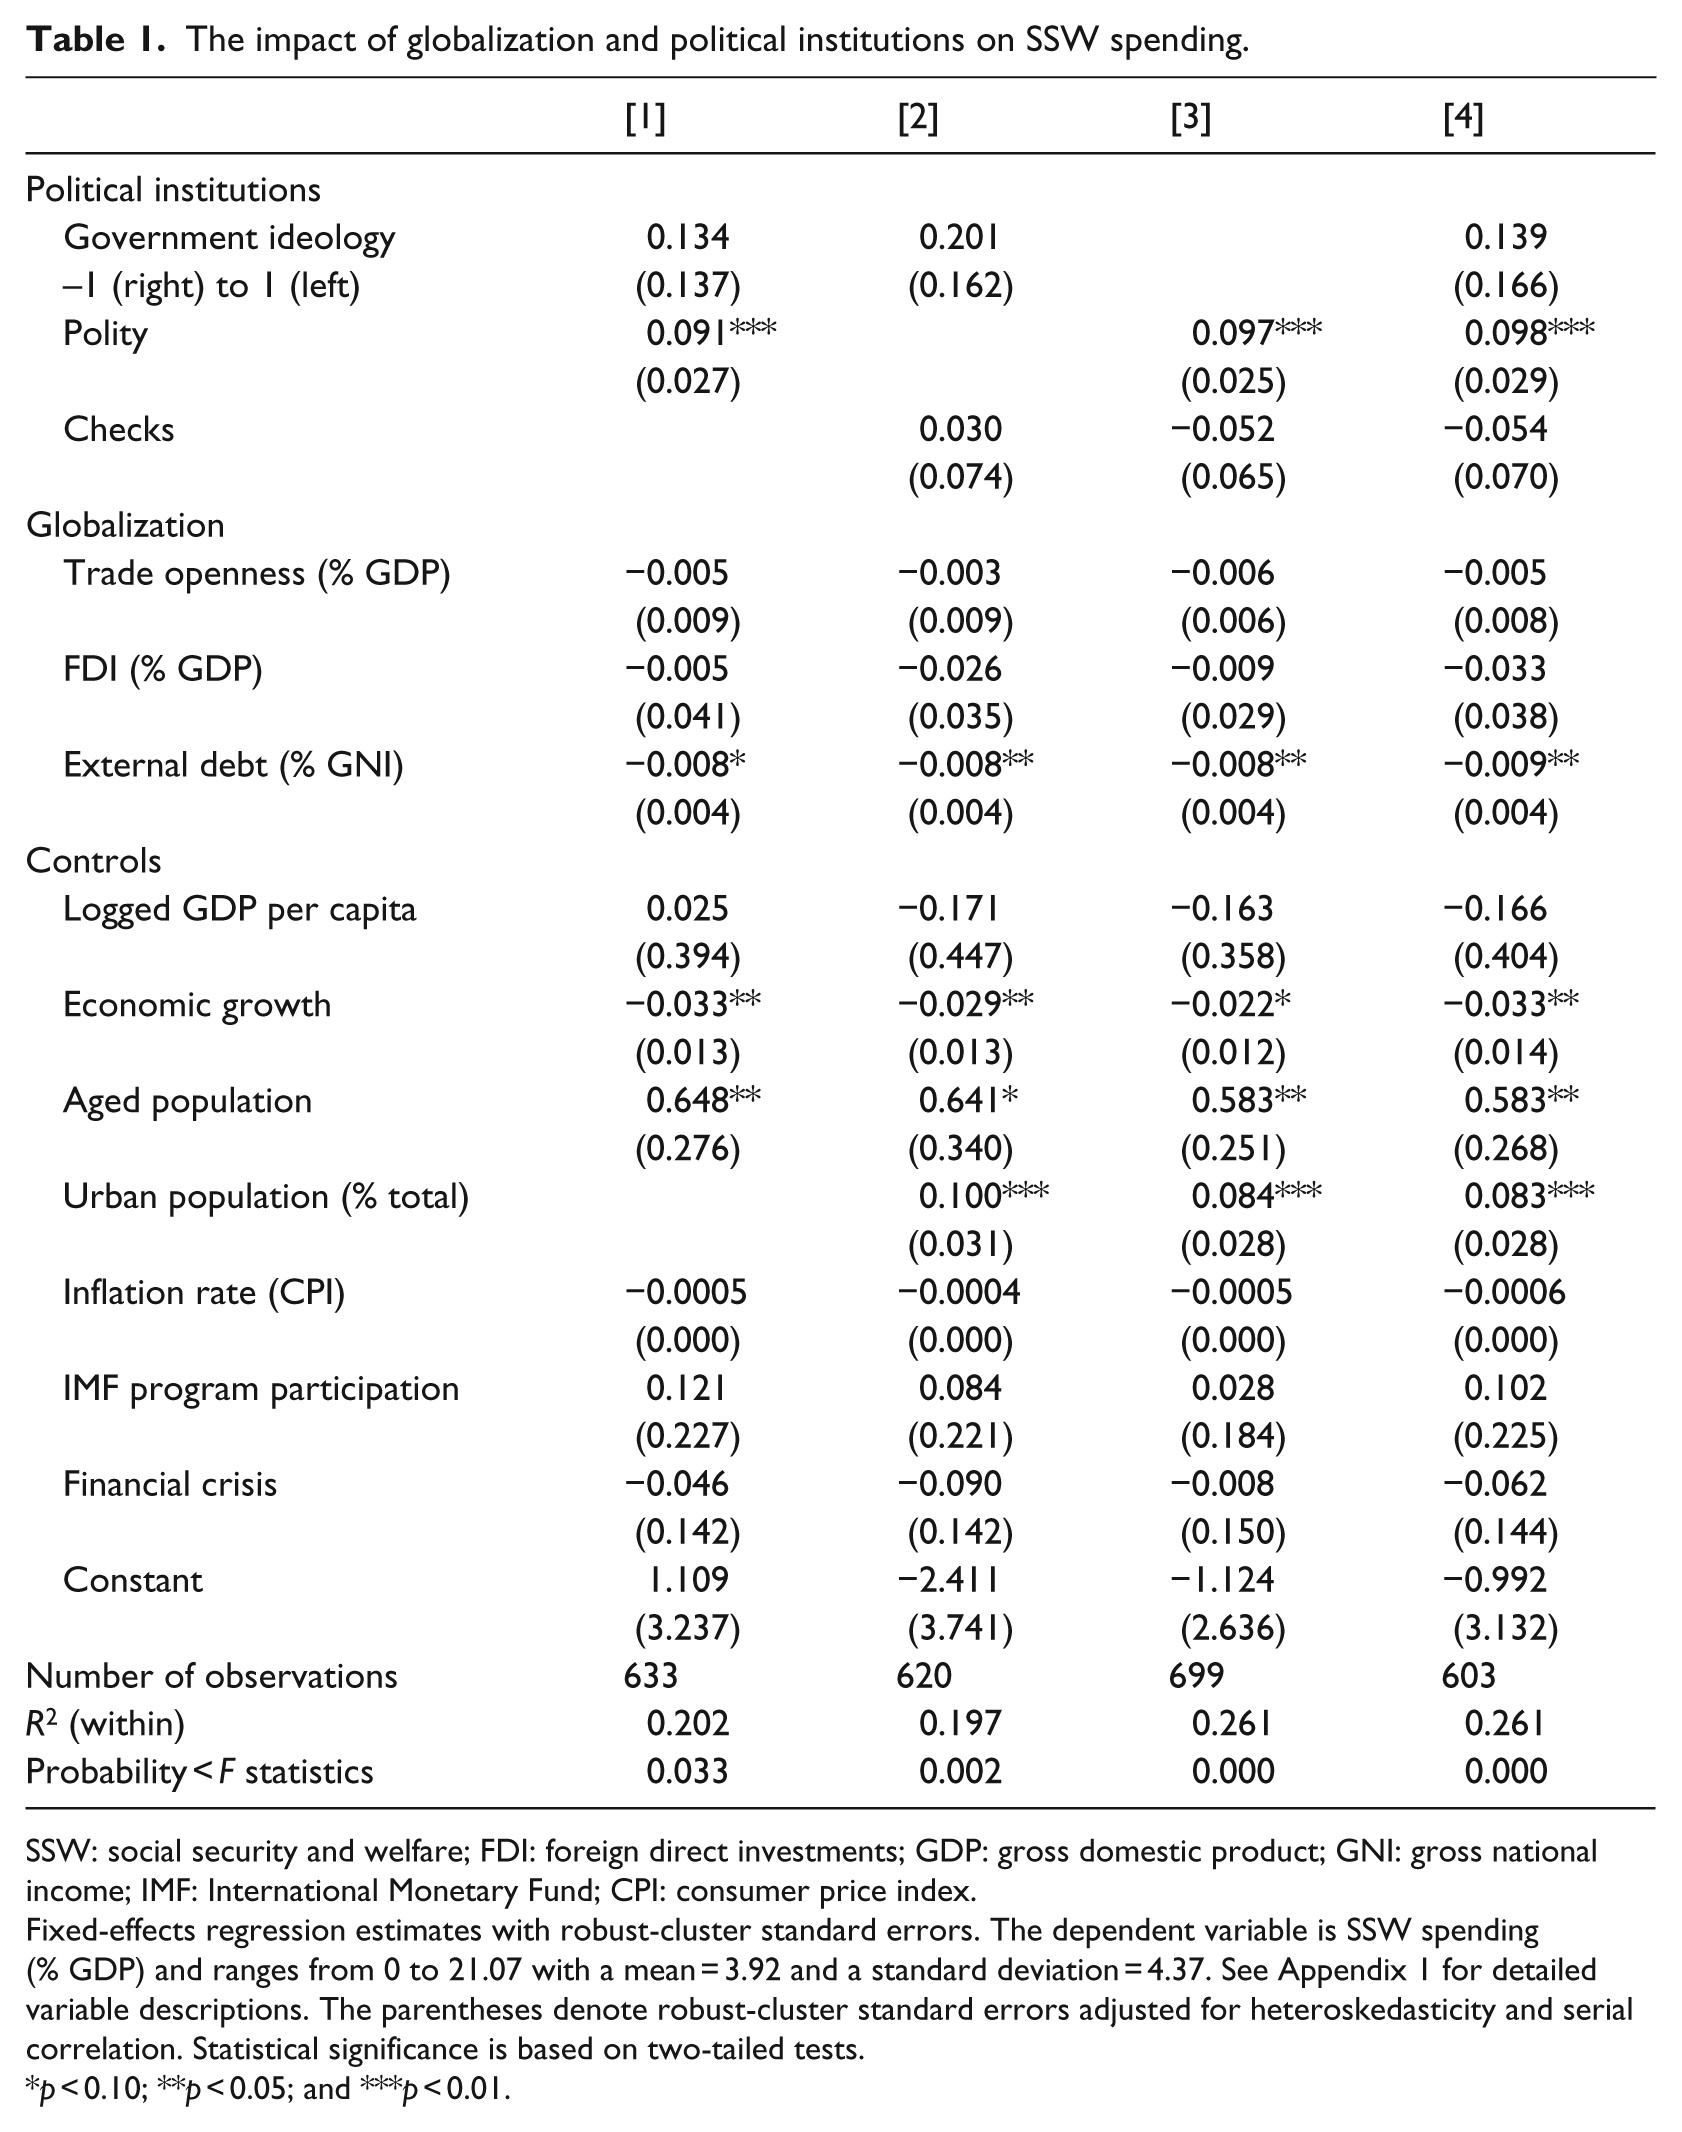
SSW: social security and welfare; FDI: foreign direct investments; GDP: gross domestic product; GNI: gross national income; IMF: International Monetary Fund; CPI: consumer price index.
Fixed-effects regression estimates with robust-cluster standard errors. The dependent variable is SSW spending (% GDP) and ranges from 0 to 21.07 with a mean = 3.92 and a standard deviation = 4.37. See Appendix 1 for detailed variable descriptions. The parentheses denote robust-cluster standard errors adjusted for heteroskedasticity and serial correlation. Statistical significance is based on two-tailed tests.
p < 0.10; **p < 0.05; and ***p < 0.01.
The impact of globalization and political institutions on education spending.
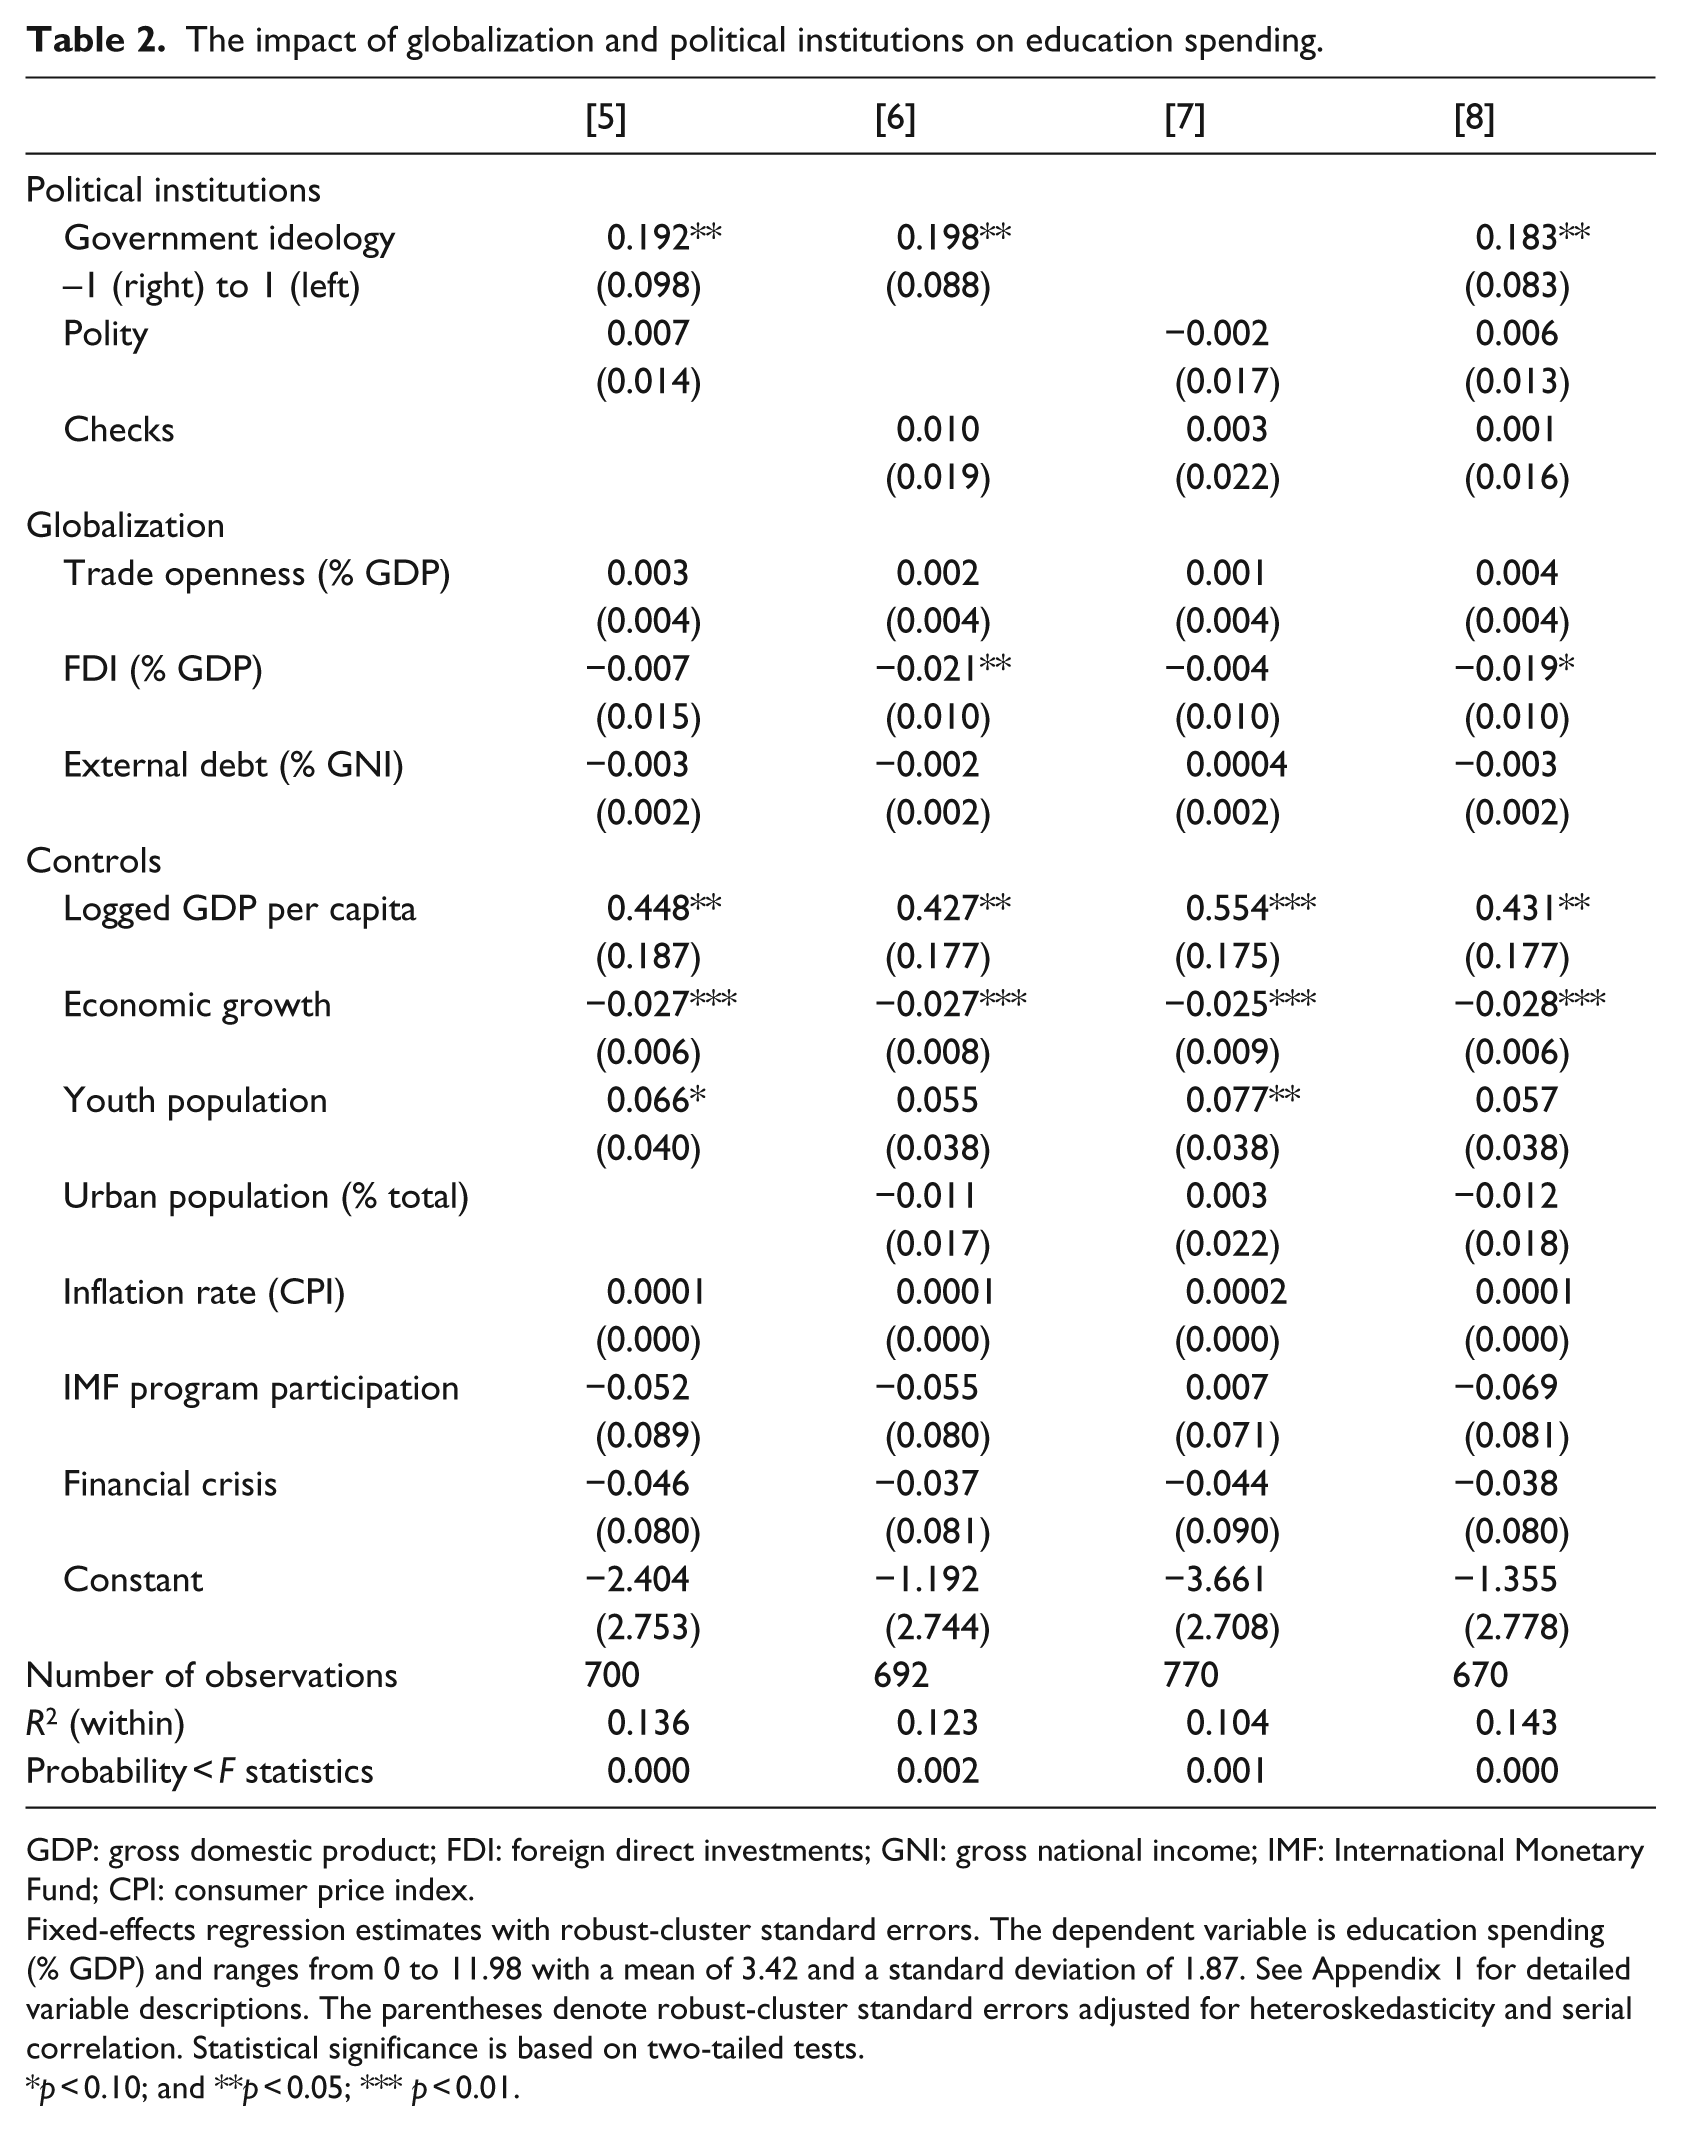
GDP: gross domestic product; FDI: foreign direct investments; GNI: gross national income; IMF: International Monetary Fund; CPI: consumer price index.
Fixed-effects regression estimates with robust-cluster standard errors. The dependent variable is education spending (% GDP) and ranges from 0 to 11.98 with a mean of 3.42 and a standard deviation of 1.87. See Appendix 1 for detailed variable descriptions. The parentheses denote robust-cluster standard errors adjusted for heteroskedasticity and serial correlation. Statistical significance is based on two-tailed tests.
p < 0.10; and **p < 0.05; *** p < 0.01.
Robustness tests.
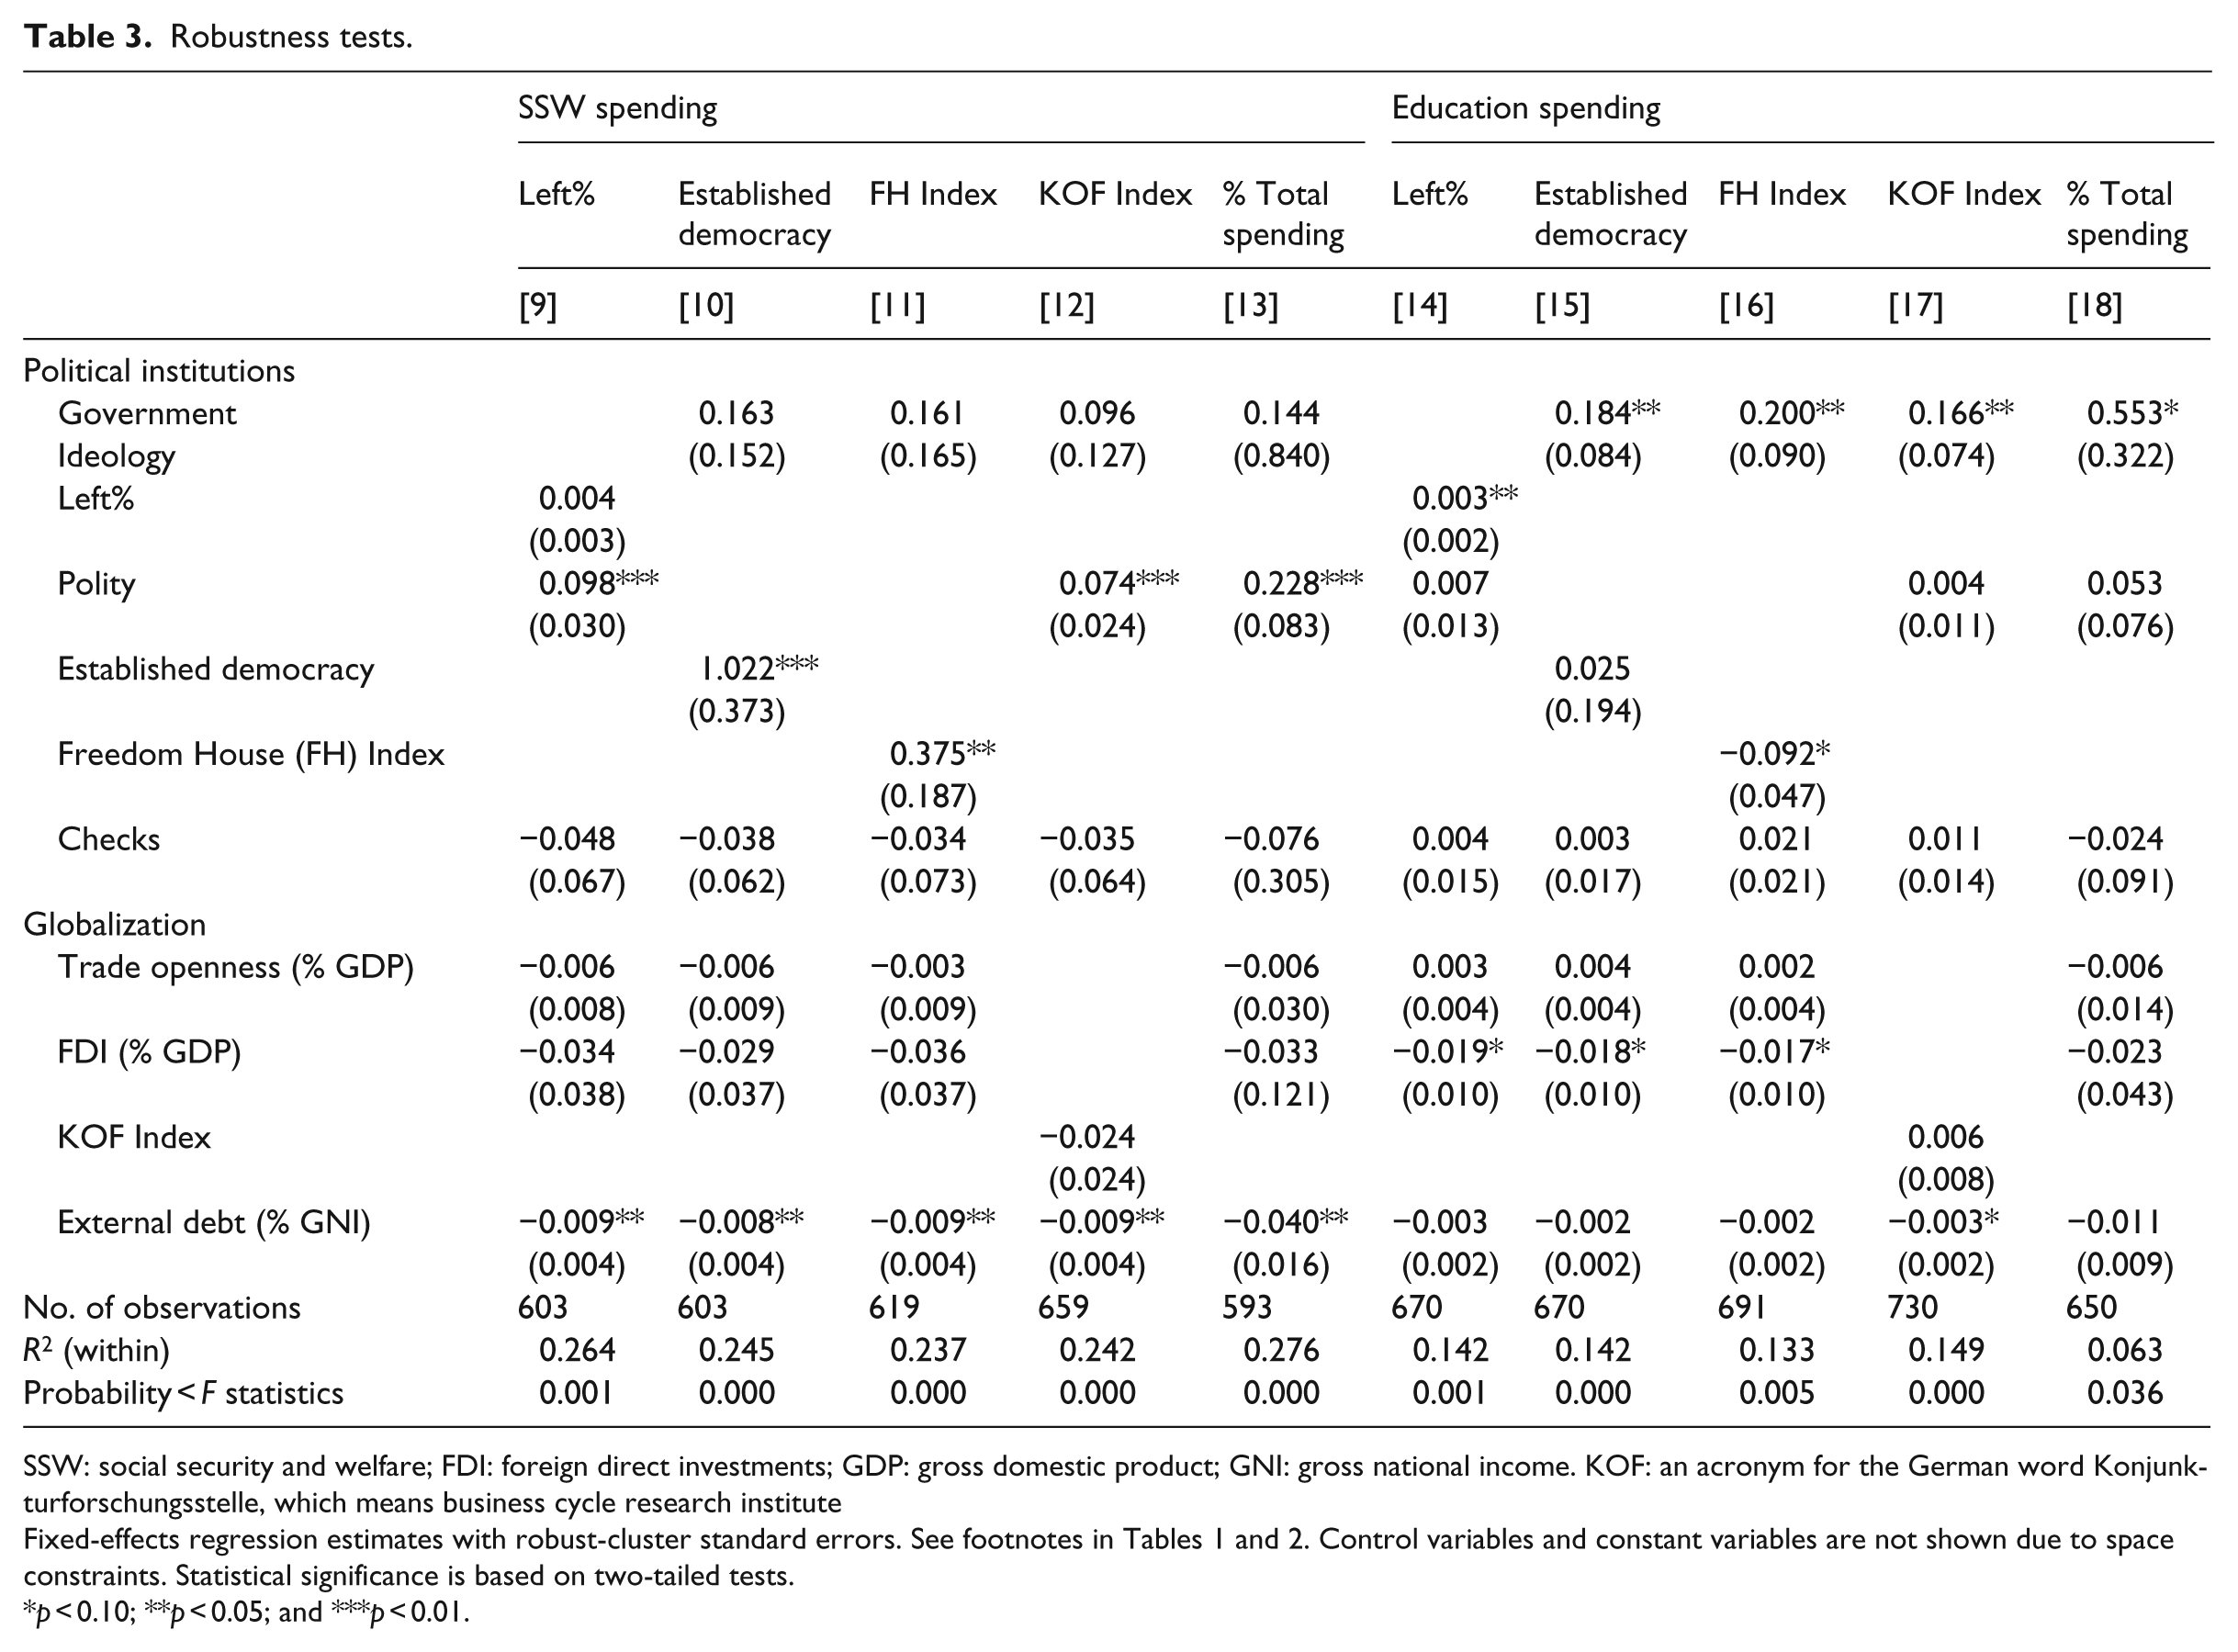
SSW: social security and welfare; FDI: foreign direct investments; GDP: gross domestic product; GNI: gross national income. KOF: an acronym for the German word Konjunkturforschungsstelle, which means business cycle research institute
Fixed-effects regression estimates with robust-cluster standard errors. See footnotes in Tables 1 and 2. Control variables and constant variables are not shown due to space constraints. Statistical significance is based on two-tailed tests.
p < 0.10; **p < 0.05; and ***p < 0.01.
The results show that Polity is significantly and positively associated with SSW spending. The results of Polity are also substantively large. According to the full model in regression [4], if a LDC government becomes more democratic by 6.95 (1 standard deviation of external debts in the sample), it is likely to spend more on SSW by 0.68 percent of GDP, which is about 17 percent of the average SSW expenditures (3.92% of GDP) in the sample. If a LDC government changes from a full autocracy (−10) to a full democracy (10), it is likely to spend more on SSW by 1.96 percent of GDP, which is almost 50 percent of the average SSW expenditures. Yet, neither government ideology nor Checks has a statistically significant relationship with SSW spending.
On the other hand, external debt (% GNI) is significantly and negatively associated with SSW spending in all regressions. Increases in external debt seem to exert significant downward pressure on SSW spending in LDCs. The effect of external debt is also substantively meaningful. According to the full model in regression [4], if a nation’s external debts increase by 79.17 percent of GDP (1 standard deviation of the average external debts in the sample), its government will reduce SSW expenditures by 0.71 percent of GDP, which is about 18 percent of the average SSW expenditures in the sample.
The control variables show that the level of SSW expenditures is also affected by demographic and economic conditions. Economic growth is strongly and negatively associated with SSW spending, while the proportion of senior population and the proportion of urban population are both strongly and positively associated with SSW spending. Economic growth and increased economic activity seem to reduce SSW spending by reducing the number of people who need social benefits. On the other hand, and as expected by theory, if a larger share of the population is older or living in cities, this increases the demand for SSW programs.
Table 2 reports the results for education expenditures (% GDP). Again, regression [5] reports the results without Checks and urban population, and regressions [6] and [7] report the results without Polity and government ideology, respectively. Regression [8] shows the results from the full model. The results first show that government ideology is significantly and positively associated with education spending. The results of government ideology are also substantively meaningful. According to the full model in regression [8], when government ideology shifts from right (−1) to left (1), the government is likely to expand education expenditures by 0.37 percent of GDP, which is about 11 percent of the average education spending in the sample (3.42% of GDP). Yet, neither Polity nor Checks has statistically significant relationship with education spending.
On the other hand, FDI (% GDP) shows some strong and negative associations with education spending (in regressions [6] and [8]), but the effect is not consistent (in regressions [5] and [7]). Among control variables, logged GDP per capita is strongly and positively associated with education spending, while economic growth is strongly and negatively related with it. LDCs with higher levels of economic development spend more on education. Yet, rapid economic growth in LDCs seems to reduce the number of young people who need the government’s education support. While not consistent, youth population is also strongly related with higher education spending, suggesting that a larger youth population increases the number of young people who require public education. 8
Table 3 reports robustness tests with alternative measurements of main variables. First, I test the results with an alternative measure of government ideology: leftist government parties’ seats in the legislature as a percentage of all government parties’ seats in the legislature (Left%). In this measure, government parties with more seats in legislature are assumed to exercise more power to employ their preferable policies. For example, if a coalition government is composed of leftist parties with 80 percent of the seats and rightist parties with 20 percent of the seats, then the coalition government is assumed to employ 80 percent leftist policies. Because the data for government portfolios and the ideological position of opposition parties in legislature are unavailable for most LDCs, I cannot measure leftist power by leftist parties’ share of total government portfolios or leftist parties’ share of total seats in the legislature. Instead, I employ this alternative measure. Regressions [9] and [14] show that the main results are robust to this alternative. I also check the interactive effects of Polity and government ideology on SSW and education spending, but the interaction terms are insignificant, and the marginal effect graphs do not produce meaningful results.
Second, I test the results with alternative measures of democracy. Following Rudra and Haggard (2005), I test the effects of a dummy of highly democratic countries, which is coded as 1 if Polity value is higher or equal to 7, and 0 if otherwise. I also use the Freedom House Index, which captures a broader concept of democracy related to personal freedom. The Freedom House Index has two scores: the degree of political freedoms of citizens (e.g. free and fair competitive elections) and the degree of civil liberties (e.g. freedom of speech and freedom of religion). The two scores are averaged and then reversed to make the resulting index range from 1 (denoting the lowest level of democracy) to 7 (denoting the highest level of democracy) (Freedom House, 2015). The main results (regressions [10], [11], [15], and [16]) are robust to these alternative specifications, except that the Freedom House Index is negatively associated with education spending.
Third, I test the results with Dreher’s (2006) KOF Index of economic globalization, which captures the overall impact of various globalization measures. The economic globalization index is calculated using actual flows of trade and investments, as well as restrictions on trade and capital such as tariff rates. Regressions [12] and [17] show that the main results are robust, while external debt (% GNI) is strongly and negatively associated with both SSW and education spending. I also test the results with (1) logged value of trade openness to check the impact of extreme values of trade flows and (2) imports (% GDP) and FDI net inflows (% GDP). The main results are robust to the inclusion of these additional terms.
Finally, I check the results with SSW and education expenditures as a percentage of total government expenditures (% total). These measures show how LDC governments allocate their revenue resources to different social spending categories. SSW and education spending (% total) are highly and strongly correlated with SSW (r = 0.89, p < 0.0000) and education spending (% GDP; r = 0.65, p < 0.0000). Regressions [13] and [18] show that the main results are robust to this alternative measure of social expenditures.
I also test the robustness of the main empirical results in a variety of ways. First, I test the results with imputed missing data to ensure that unbalanced data or the small number of observations is not affecting the results. 9 I also test a large number of alternative model specifications such as running the regressions with and without each control variable, with additional control variables (e.g. population size and unemployment rate), using a panel jackknife, excluding one specific group at a time, and excluding one region at a time. These tests confirm that the main results are not driven by a particular control variable, country, group, or region. The result tables are available from the author upon request. See Appendix 4 for some of the additional robustness tests.
Conclusion and implications
This article adds to the current discussion of social expenditures in LDCs by studying the effect of democracy, government ideology, and globalization on a global sample of LDCs. The empirical results show that the level of democracy is significantly and positively associated with greater spending on SSW programs, while leftist government ideology is strongly and positively associated with higher education spending. These results provide evidence for the argument that political leaders’ commitment to social expenditures varies according to their political conditions. Democratic development and concomitant electoral competition motivates politicians to spend significantly more on SSW, which in the less developed world benefits urban-formal workers or the upper-middle class. At the same time, this environment creates incentives for leftist politicians to spend significantly more on education, which reaches a broader group of constituents including rural-informal workers or the lower-middle to lower class.
Second, the results provide some support for the efficiency hypothesis. External debts are strongly associated with lower SSW spending, while they are less related to spending on education. FDI also shows some negative associations with education spending, although the effects are not statistically significant in a consistent fashion. The results suggest that capital flows, particularly those that increase external debts, put budgetary pressure on political leaders. Confronting budgetary pressures from large external debts, governments in the less developed world are more likely to reduce SSW spending, which creates more direct costs and burdens to corporations as compared to spending on education.
The theoretical and empirical discussion in this article underscores the need to bring the ideology of political leadership into research on LDCs. As discussed, Moon and Dixon (1985) and London and Williams (1990) find that the ideological orientation of government is significantly associated with the provision of basic needs or the well-being of the population. Their studies suggest that who allocates government expenditures is more important for policy outcomes than the size of the expenditures. This study extends this work by expanding the discussion further to who allocates resources to what kinds of policies: SSW or education spending. This study also demonstrates that leftist governments spend more on education as compared to SSW programs. Thus, researchers studying the less developed world should focus on more than just democratic development or economic factors when analyzing government spending. A more complete explanation of variance in the allocation of social expenditures across countries and time must also pay attention to the ideological orientation of government as a key factor in shaping policy outcomes.
This study also calls attention to the need for further research on the effects of the electoral, ideological, and economic interests of political leaders on redistributive policies. Although this study analyzes the two most significant areas of social expenditures (SSW and education), because of limits on data availability, I could not analyze the subcomponents of these two categories. When comparative data become available, it will be revealing to study the impact of democracy, government ideology, and globalization on the subcomponents of SSW and education spending. For example, how do political leaders under electoral, partisan, or economic pressure allocate government resources differently to primary, secondary, and tertiary education? Or, how do political leaders allocate government resources to contributory and non-contributory SSW spending programs?
These findings open up new avenues for normative research that can help provide support to national and intergovernmental efforts to reduce poverty and improve economic growth in the less developed world. Additional work could focus on determining, what types of educational programs return the biggest benefits? Or researchers could examine, how best to bolster national educational programs through the provision of educational resources? Although many social welfare programs in LDCs owe their structure to past patronage, identifying the best of breed policies that provide broad benefits could provide important assistance to millions of people who struggle in a rapidly globalizing world.
Footnotes
Appendix 2
Appendix 1.
Variables used to predict social spending, 1975–2005.
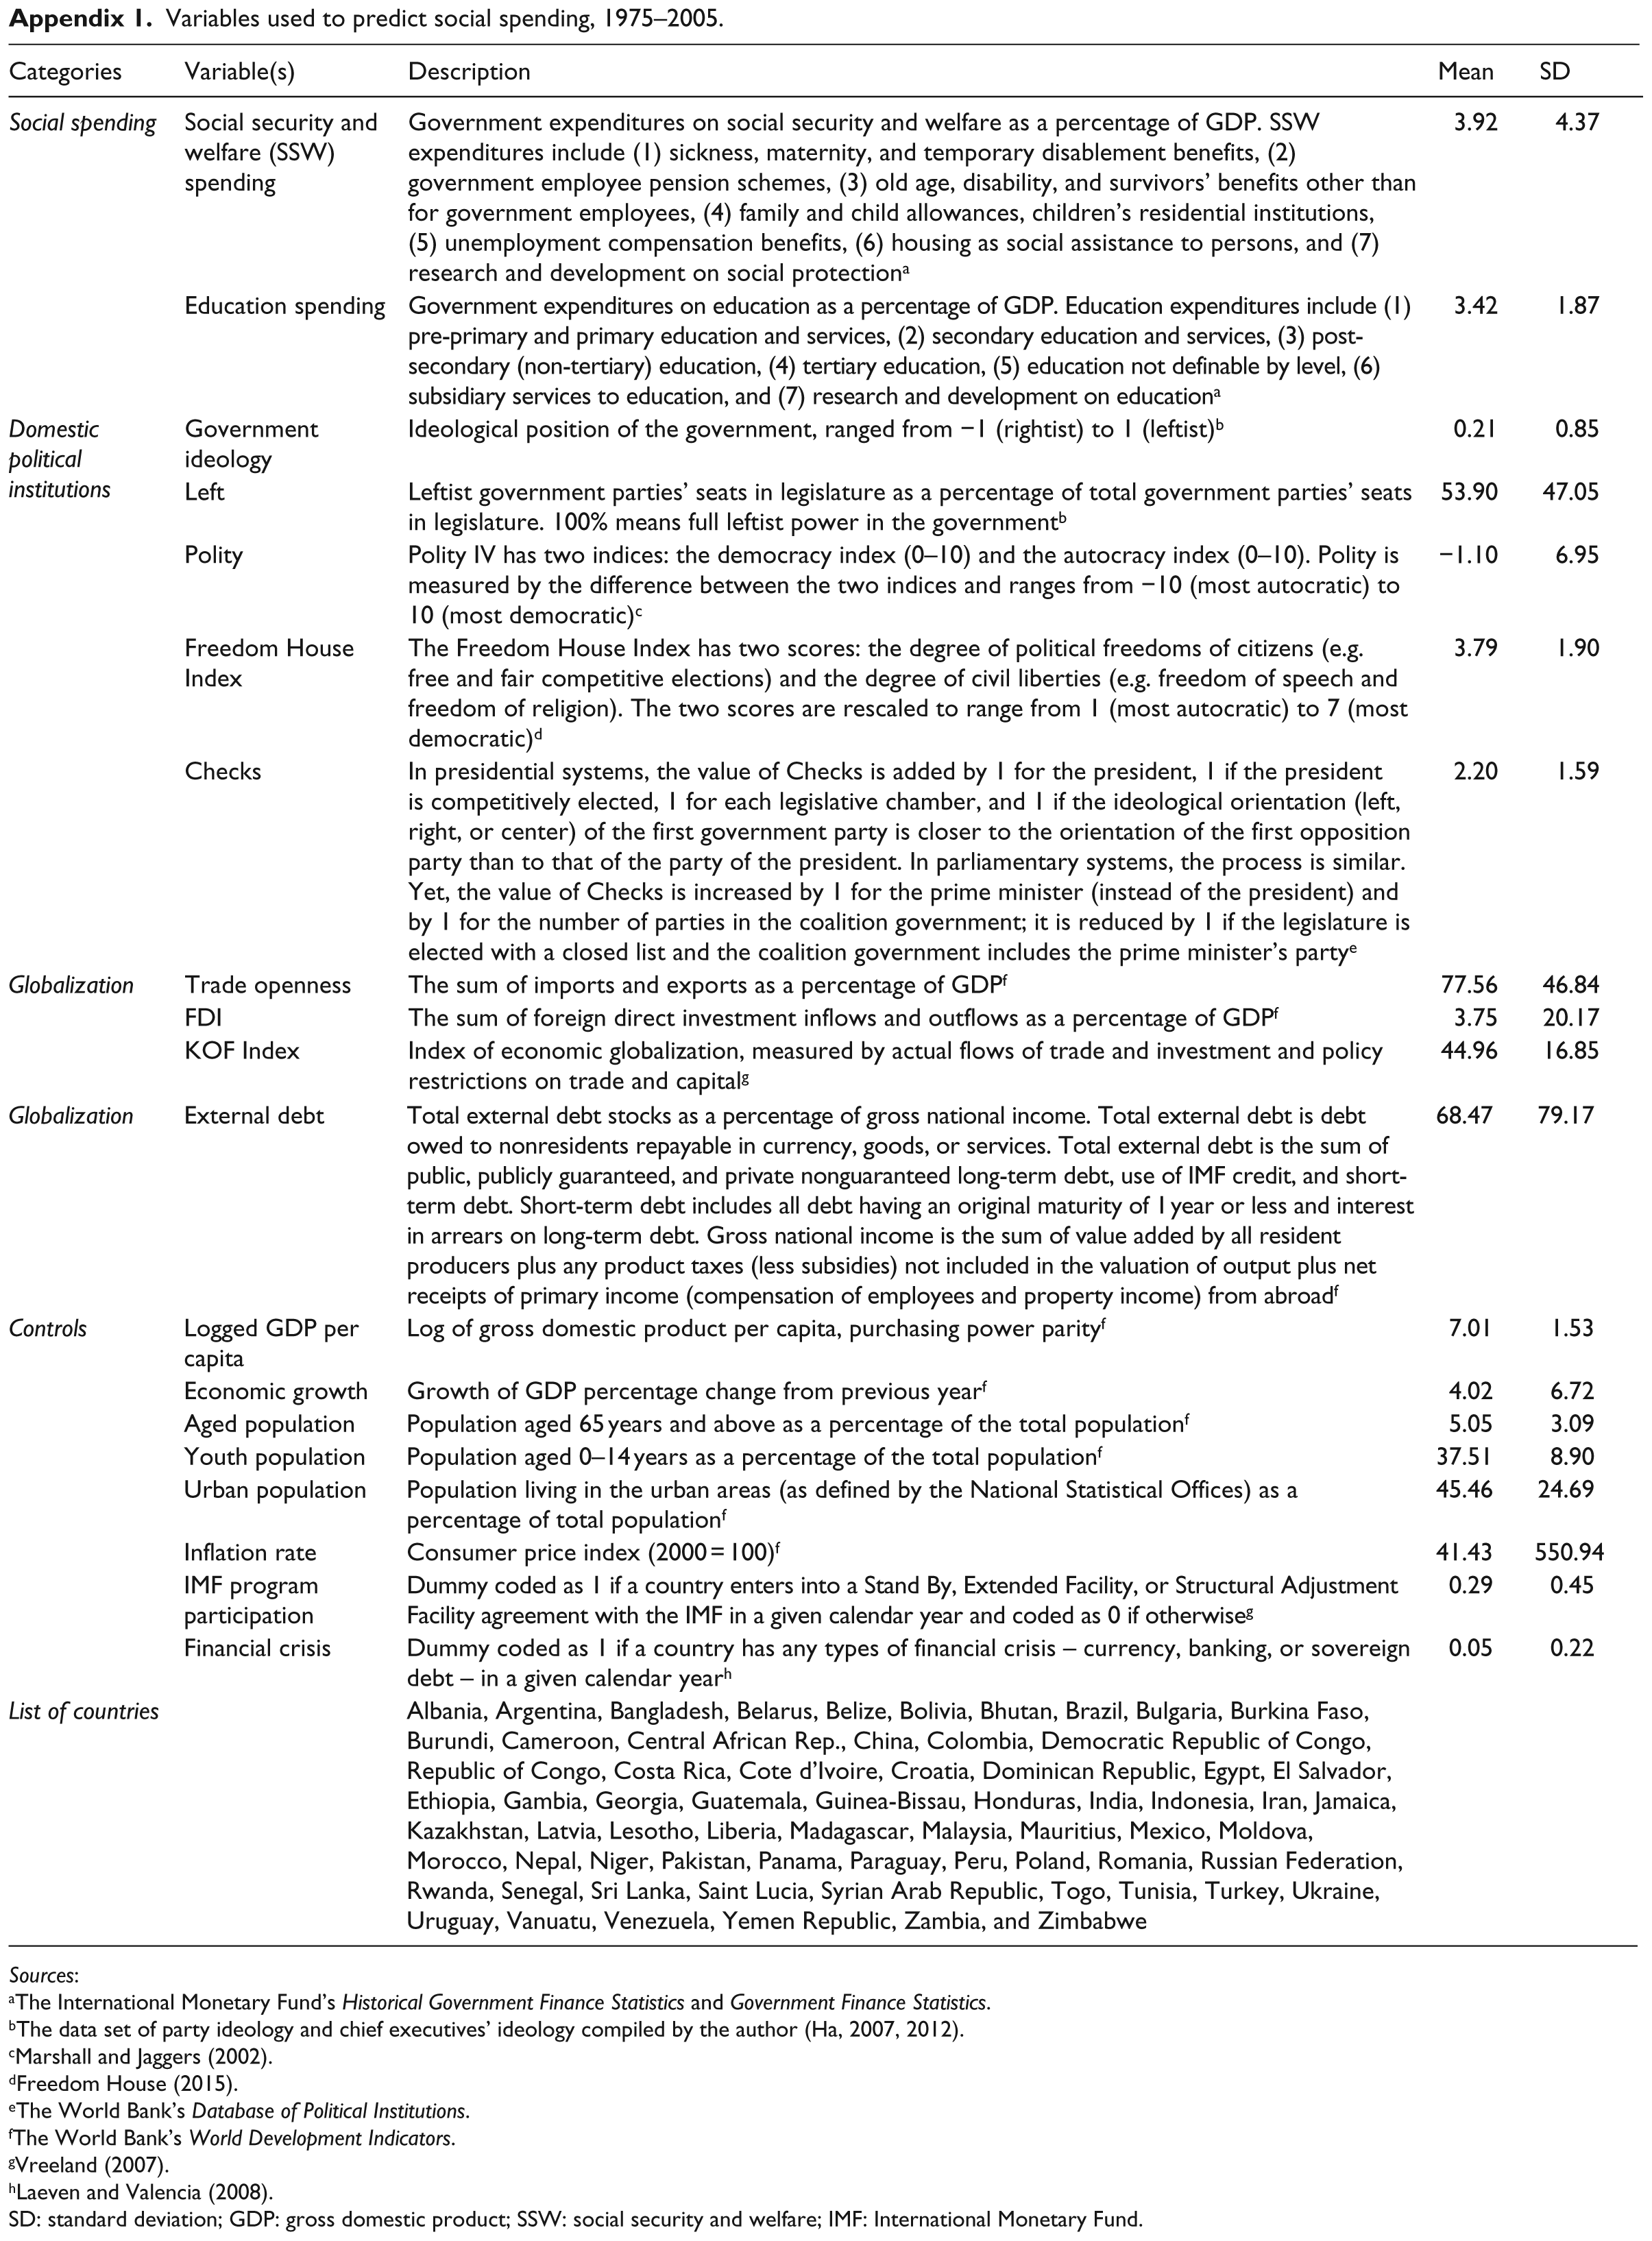
| Categories | Variable(s) | Description | Mean | SD |
|---|---|---|---|---|
| Social spending | Social security and welfare (SSW) spending | Government expenditures on social security and welfare as a percentage of GDP. SSW expenditures include (1) sickness, maternity, and temporary disablement benefits, (2) government employee pension schemes, (3) old age, disability, and survivors’ benefits other than for government employees, (4) family and child allowances, children’s residential institutions, (5) unemployment compensation benefits, (6) housing as social assistance to persons, and (7) research and development on social protection a | 3.92 | 4.37 |
| Education spending | Government expenditures on education as a percentage of GDP. Education expenditures include (1) pre-primary and primary education and services, (2) secondary education and services, (3) post-secondary (non-tertiary) education, (4) tertiary education, (5) education not definable by level, (6) subsidiary services to education, and (7) research and development on education a | 3.42 | 1.87 | |
| Domestic political institutions | Government ideology | Ideological position of the government, ranged from −1 (rightist) to 1 (leftist) b | 0.21 | 0.85 |
| Left | Leftist government parties’ seats in legislature as a percentage of total government parties’ seats in legislature. 100% means full leftist power in the government b | 53.90 | 47.05 | |
| Polity | Polity IV has two indices: the democracy index (0–10) and the autocracy index (0–10). Polity is measured by the difference between the two indices and ranges from −10 (most autocratic) to 10 (most democratic) c | −1.10 | 6.95 | |
| Freedom House Index | The Freedom House Index has two scores: the degree of political freedoms of citizens (e.g. free and fair competitive elections) and the degree of civil liberties (e.g. freedom of speech and freedom of religion). The two scores are rescaled to range from 1 (most autocratic) to 7 (most democratic) d | 3.79 | 1.90 | |
| Checks | In presidential systems, the value of Checks is added by 1 for the president, 1 if the president is competitively elected, 1 for each legislative chamber, and 1 if the ideological orientation (left, right, or center) of the first government party is closer to the orientation of the first opposition party than to that of the party of the president. In parliamentary systems, the process is similar. Yet, the value of Checks is increased by 1 for the prime minister (instead of the president) and by 1 for the number of parties in the coalition government; it is reduced by 1 if the legislature is elected with a closed list and the coalition government includes the prime minister’s party e | 2.20 | 1.59 | |
| Globalization | Trade openness | The sum of imports and exports as a percentage of GDP f | 77.56 | 46.84 |
| FDI | The sum of foreign direct investment inflows and outflows as a percentage of GDP f | 3.75 | 20.17 | |
| KOF Index | Index of economic globalization, measured by actual flows of trade and investment and policy restrictions on trade and capital g | 44.96 | 16.85 | |
| Globalization | External debt | Total external debt stocks as a percentage of gross national income. Total external debt is debt owed to nonresidents repayable in currency, goods, or services. Total external debt is the sum of public, publicly guaranteed, and private nonguaranteed long-term debt, use of IMF credit, and short-term debt. Short-term debt includes all debt having an original maturity of 1 year or less and interest in arrears on long-term debt. Gross national income is the sum of value added by all resident producers plus any product taxes (less subsidies) not included in the valuation of output plus net receipts of primary income (compensation of employees and property income) from abroad f | 68.47 | 79.17 |
| Controls | Logged GDP per capita | Log of gross domestic product per capita, purchasing power parity f | 7.01 | 1.53 |
| Economic growth | Growth of GDP percentage change from previous year f | 4.02 | 6.72 | |
| Aged population | Population aged 65 years and above as a percentage of the total population f | 5.05 | 3.09 | |
| Youth population | Population aged 0–14 years as a percentage of the total population f | 37.51 | 8.90 | |
| Urban population | Population living in the urban areas (as defined by the National Statistical Offices) as a percentage of total population f | 45.46 | 24.69 | |
| Inflation rate | Consumer price index (2000 = 100) f | 41.43 | 550.94 | |
| IMF program participation | Dummy coded as 1 if a country enters into a Stand By, Extended Facility, or Structural Adjustment Facility agreement with the IMF in a given calendar year and coded as 0 if otherwise g | 0.29 | 0.45 | |
| Financial crisis | Dummy coded as 1 if a country has any types of financial crisis – currency, banking, or sovereign debt – in a given calendar year h | 0.05 | 0.22 | |
| List of countries | Albania, Argentina, Bangladesh, Belarus, Belize, Bolivia, Bhutan, Brazil, Bulgaria, Burkina Faso, Burundi, Cameroon, Central African Rep., China, Colombia, Democratic Republic of Congo, Republic of Congo, Costa Rica, Cote d’Ivoire, Croatia, Dominican Republic, Egypt, El Salvador, Ethiopia, Gambia, Georgia, Guatemala, Guinea-Bissau, Honduras, India, Indonesia, Iran, Jamaica, Kazakhstan, Latvia, Lesotho, Liberia, Madagascar, Malaysia, Mauritius, Mexico, Moldova, Morocco, Nepal, Niger, Pakistan, Panama, Paraguay, Peru, Poland, Romania, Russian Federation, Rwanda, Senegal, Sri Lanka, Saint Lucia, Syrian Arab Republic, Togo, Tunisia, Turkey, Ukraine, Uruguay, Vanuatu, Venezuela, Yemen Republic, Zambia, and Zimbabwe |
Sources:
The International Monetary Fund’s Historical Government Finance Statistics and Government Finance Statistics.
The data set of party ideology and chief executives’ ideology compiled by the author (Ha, 2007, 2012).
The World Bank’s Database of Political Institutions.
The World Bank’s World Development Indicators.
SD: standard deviation; GDP: gross domestic product; SSW: social security and welfare; IMF: International Monetary Fund.
Acknowledgements
The author is grateful to Acir Almeida, Puspa Amri, Richard Baum, Lisa Blaydes, Nicholas Cain, Heather Campbell, José Antonio Cheibub, Geoffrey Garrett, Barbara Geddes, Tasos Kalandrakis, Edward Leamer, Dong-wook Lee, Melissa Rogers, Ronald Rogowski, and George Tsebelis for their help with various aspects of this article. She is highly indebted to the editor, David Smith, and five anonymous reviewers for the development of this article. All remaining errors are her sole responsibility.
Declaration of Conflicting Interests
The author(s) declared no potential conflicts of interest with respect to the research, authorship, and/or publication of this article.
Funding
The author(s) received no financial support for the research, authorship, and/or publication of this article.