




Abstract
Background:
While loneliness is recognized as a risk to mental and physical health, there is a lack of data covering a broad age range. This study used a Slovenian adult sample to investigate loneliness.
Aims:
To examine levels of social, emotional and general loneliness within the general population.
Method:
A survey on a sample representative of the general population (N = 1,189; aged between 18 and 95 years old (M = 46.74, standard deviation (SD) = 16.18); 49.7% were men) was conducted in Slovenia by means of an online questionnaire, covering data on demographic variables and levels of emotional, social and general loneliness.
Results:
In general, people experienced more social than emotional loneliness. Demographic variables that were significant for emotional, social and general loneliness were the history of past mental illness, civil status and employment status. Other demographic variables played different roles in different types of loneliness.
Conclusions:
Our study shows that differences in loneliness among demographic subgroups are an important factor in understanding and studying loneliness, especially with regard to the distinction between social and emotional loneliness. Given that loneliness represents today not only a social threat but also a significant health problem, it is important to understand which demographic subgroups are more at risk and how we can help them.
Introduction
Loneliness is both a perception and an emotion, and can be a form of psychosocial stress (Power et al., 2019). It is a state in which individuals perceive themselves as socially isolated, even when they are among other people (Cacioppo & Cacioppo, 2018). Thus, loneliness concerns the subjective evaluation of the situation individuals find themselves in. However, the subject of this evaluation can have two different faces: the social and the emotional loneliness. Social loneliness is characterized by a number of relationships smaller than the desired one, while emotional loneliness is characterized as situations in which intimacy in relationships one wishes for has not been realized. This means that social loneliness occurs when someone misses a wider social network and therefore can be attributed to deficits in the support network, while emotional loneliness occurs when someone misses an intimate relationship and therefore is associated with the absence of a partner (De Jong Gierveld & Van Tilburg, 2010; Dykstra & Fokkema, 2007).
Loneliness can have a significant effect on levels on depression (Erzen & Çikrikci, 2018) and can influence addiction to social media (Shettar et al., 2017), with emotional loneliness being more damaging to health than social loneliness (O’Súilleabháin et al., 2019), meaning that the perceived quality of interpersonal relationships is associated with poorer mental health (Hyland et al., 2018).
Previous studies have shown that loneliness differs according to gender and age groups (e.g., De Jong Gierveld & Van Tilburg, 2010); however, findings are not consistent as to which group is more lonely. For example, Victor and Yang (2012) concluded that women are more likely to report loneliness than men. However, when different dimensions of loneliness are considered, the results are more complex–the quality of loneliness is different for men and women (Rokach et al., 2007). It appears that men report more social loneliness, while women experience more emotional loneliness (de Jong Gierveld et al., 2009; De Jong Gierveld & Van Tilburg, 2010; Hyland et al., 2018).
Loneliness is often associated with age, but many studies have shown that the relationship is not straightforward. Even if it is assumed that older people are more emotionally and socially lonely, researchers point out that age differences can be understood to a large extent by background characteristics, such as differences in partner and parental status (De Jong Gierveld & Van Tilburg, 2010). Various regression models showed greater effects of partner and parental status than effects of age and gender (De Jong Gierveld & Van Tilburg, 2010). For example, in a study of different socio-demographic and health-related risk factors for loneliness among older adults, civil status was the primary explanatory variable, while age and gender were not significant predictors of loneliness (Theeke, 2009). Regardless of age and gender differences, single and divorced people are more at risk of being lonely than married people (de Jong Gierveld et al., 2009; Dykstra & Fokkema, 2007; Hyland et al., 2018; Victor & Yang, 2012), with greater differences in emotional loneliness than in social loneliness. Much less is known about the relationship between loneliness and parental status. A study by Dykstra and de Jong Gierveld (2004) showed that the connection is complex and depends on the quality of parenthood.
Socio-demographic factors also play a role. In a study of college students, researchers found that family income significantly predicts the general and social loneliness of college men (Chen & Chung, 2007). Furthermore, living in rural areas is recognized as a risk factor for loneliness (Kelly et al., 2019).
Notably, most studies examined loneliness in age-specific samples (e.g. among older people or students) and focused on a narrow set of demographic variables (e.g. gender and civil status); thus, there is a lack of current community data covering a broad age range and various socio-demographic factors. The purpose of this study was to determine the prevalence and determinants of loneliness among men and women in the general population aged 18–95 years.
Method
Participants
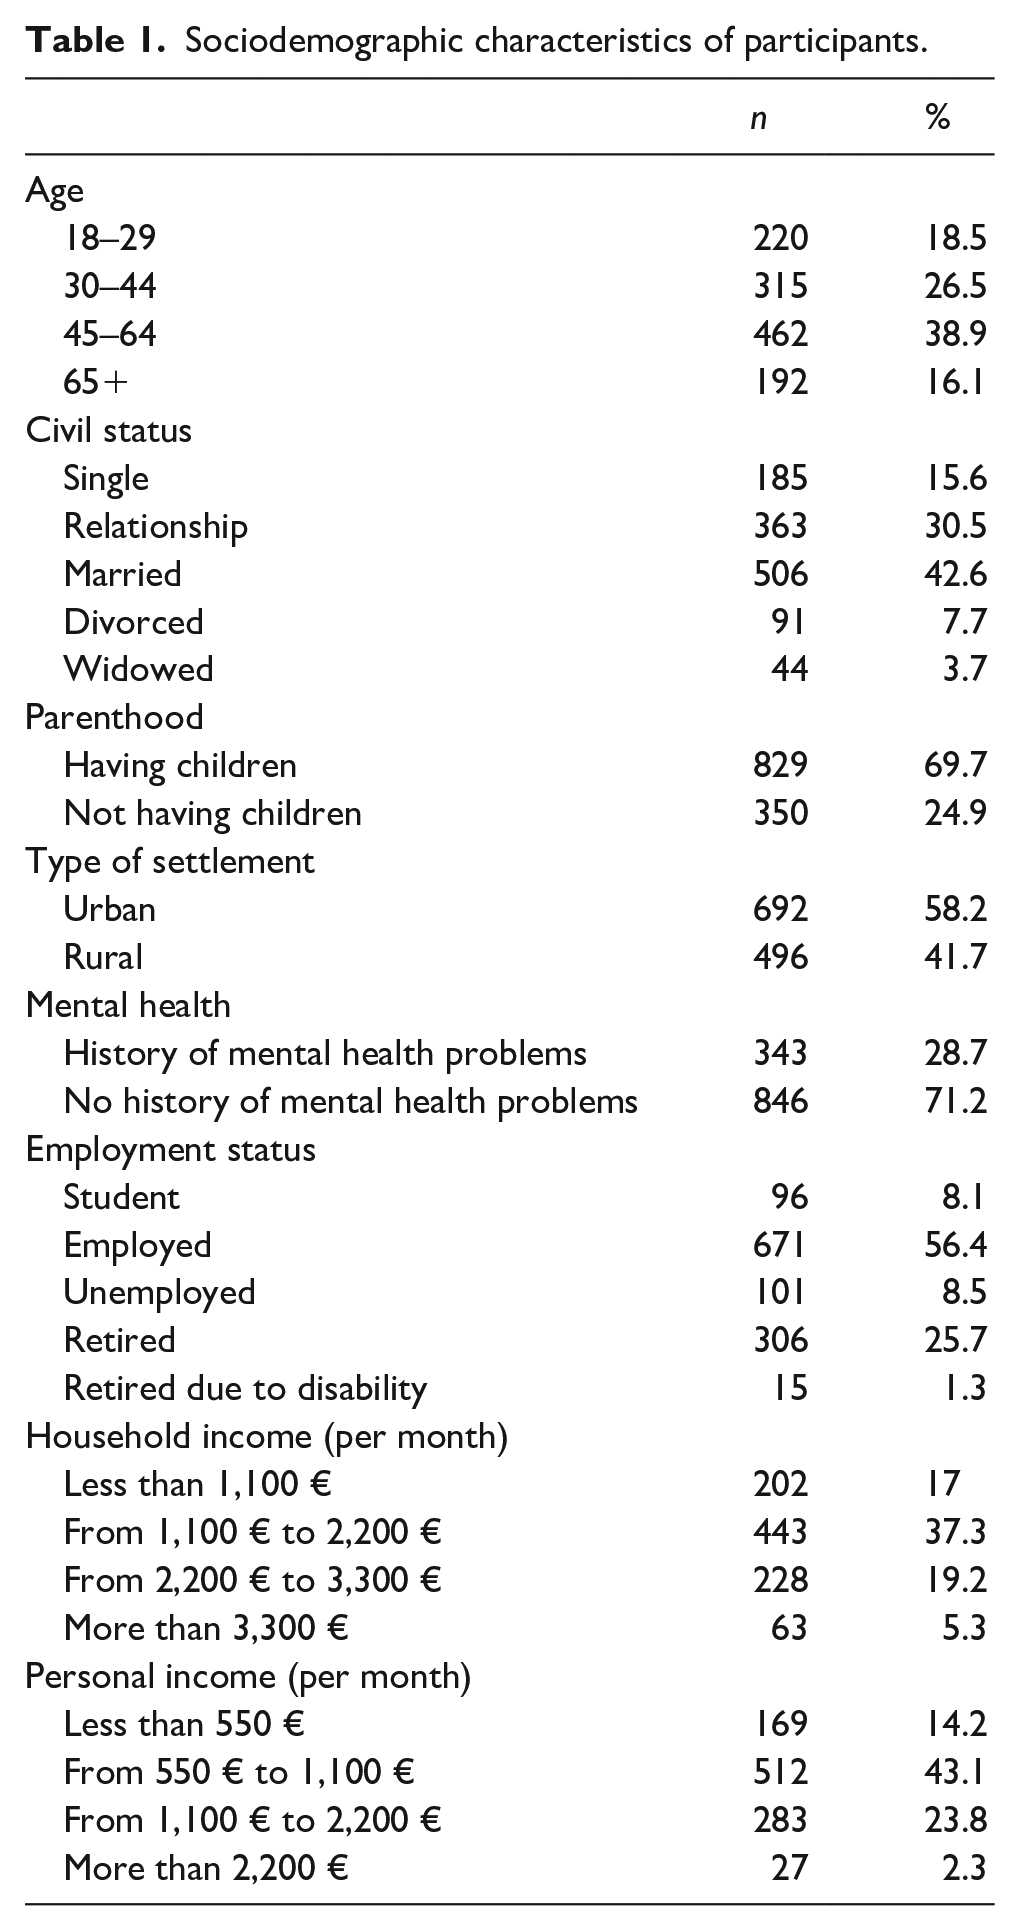
In total, we included 1,189 participants, of which 591 (49.7%) were men and 589 (50.3%) were women. The age range was from 18 to 95 years, the average age being 46.74 years (standard deviation (SD) = 16.18). Detailed sample characteristics can be seen in Table 1.
Sociodemographic characteristics of participants.
Measures
To measure loneliness, we used the De Jong Gierveld short scales for emotional and social loneliness, which consist of three items each. The short version of the scale was constructed from the original 11-item scale. The scale can also be applied as a 6-item unidimensional loneliness scale, which means that the application of the scale is threefold: it comprises the emotional loneliness scale, the social loneliness scale and the general loneliness scale.
For assessing emotional loneliness, the scale is composed from three negatively formulated items: ‘I experience a general sense of emptiness’, ‘I miss having people around’, and ‘I often feel rejected’. The scale for social loneliness consists of three positively worded items: ‘There are plenty of people I can rely on when I have problems’, ‘There are many people I can trust completely’ and ‘There are enough people I feel close to’.
Every item has three possible answers: ‘Yes’, ‘More or less’ or ‘No’. On the negatively worded items, the neutral and positive answers are scored as ‘1’, and on the positively worded items the neutral and negative answers are scored as ‘1’. This gives a possible range of scores from zero to six for general loneliness scale and from zero to three for emotional and social loneliness subscales, separately, with zero meaning ‘Least lonely’ and six (or in the case of subscales, three) meaning ‘Most lonely’. Demographic and other background characteristics include age at the time of the survey, net monthly income for a person (ranging from less than 550 € to more than 2,200 €) and for a household (ranging from less than 1,100 € to more than 3,300 €), employment status, and civil status. The employment status was determined with a question ‘What is your employment status?’ and possible answers being student, employed, unemployed, retired or retired due to disability. The civil status was determined with the use of a question ‘What is your civil status?’ and the possible answers being single, in a relationship, married, divorced or widowed.
Procedure
This study obtained data from Mental Health Literacy Project, conducted in Slovenia from 2018 to 2020. Participants were invited through e-mail to complete an online questionnaire. The process of participant selection was supported by the company Valicon, a private company for data collection that uses quota sampling for ensuring representativeness of the sample. Those participants who accepted to complete the questionnaire received compensation in the form of shopping points.
Data analysis was accomplished using SPSS version 25. Initially, descriptive analyses were performed to examine sample characteristics. This was followed by comparing different demographic categories using t-tests and analysis of variance (ANOVA) with Hochberg’s GT2 and Games-Howell post hoc tests. We used an alpha level of .05 for all statistical tests.
Results
In general, people experienced more social (M = 1.87, SD = 1.21) than emotional loneliness (M = 0.89, SD = 1.05). Average general loneliness in the sample was M = 2.77, SD = 1.79. Age and social loneliness were weakly positively correlated (r(1,187) = .08, p = .005) but age and emotional loneliness were weakly negatively correlated (r(1,187) = -.09, p = .003). For general loneliness, the correlation with age was not significant.
Differences among groups across the emotional, social and general loneliness can be seen in Table 2. Parenthood is not included in the table, as there were no significant difference among levels of loneliness in those that had children and those that did not.
Descriptive statistics for each type of loneliness across demographic variables.
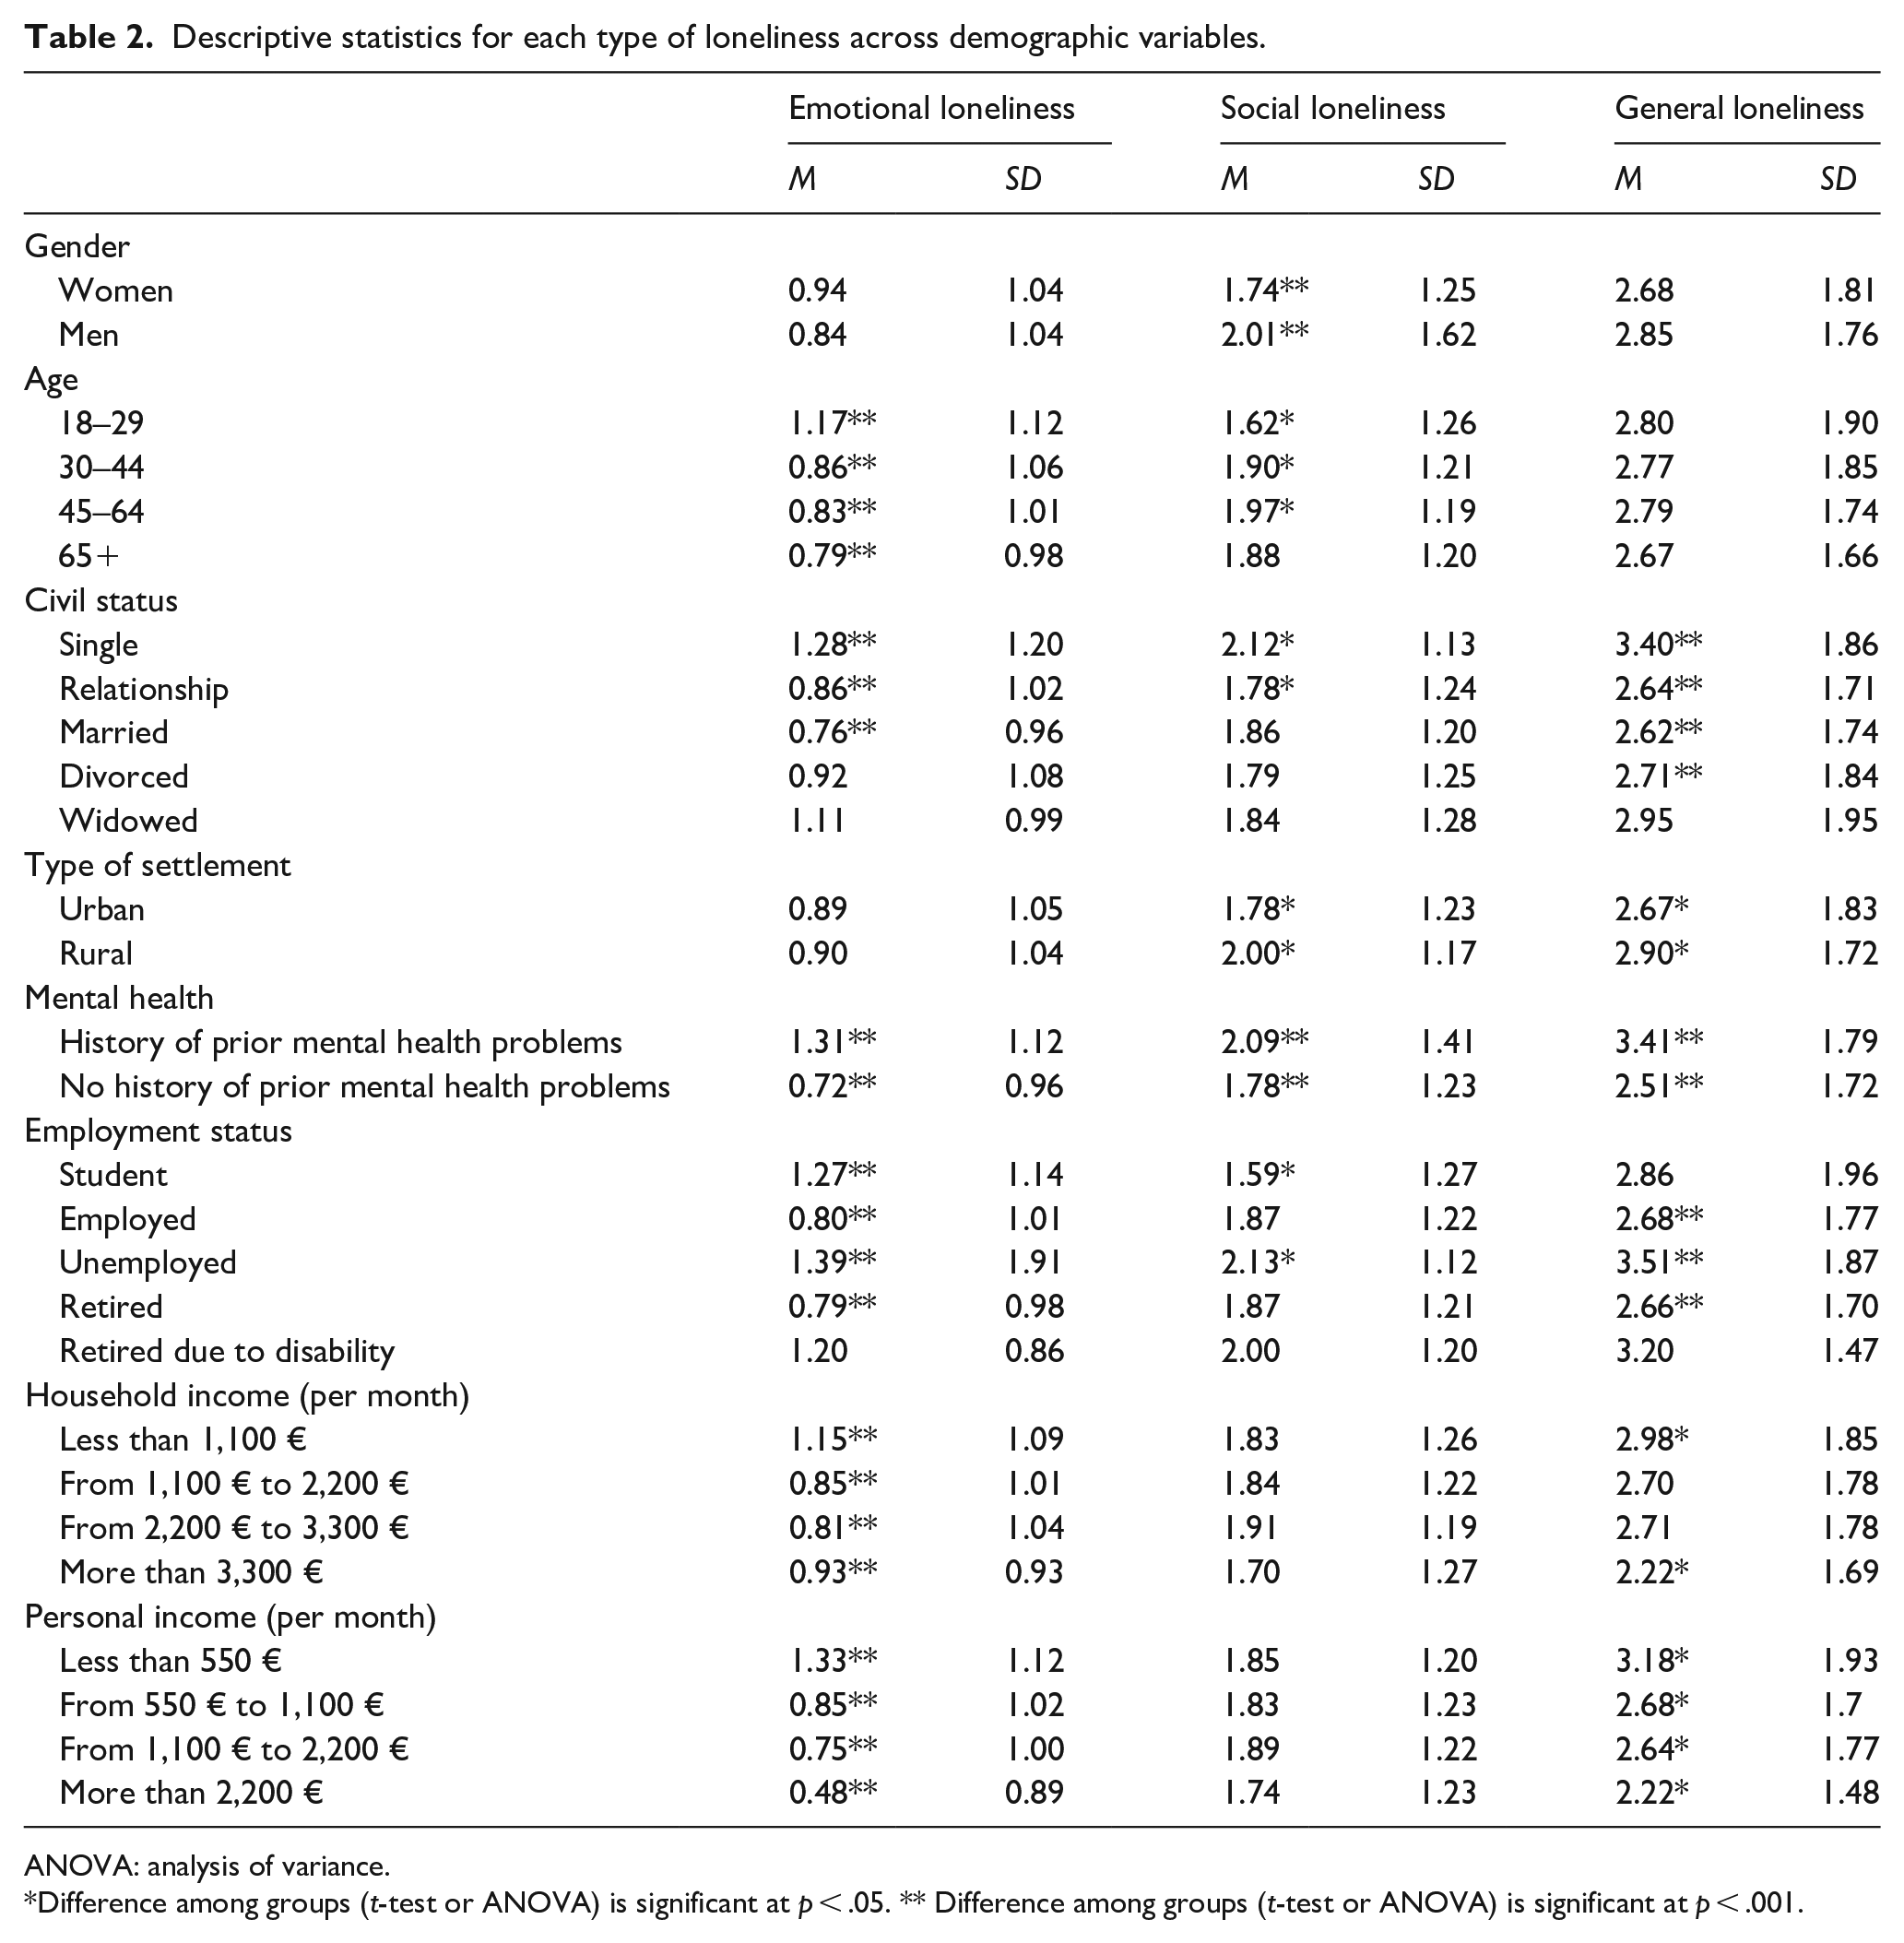
ANOVA: analysis of variance.
Difference among groups (t-test or ANOVA) is significant at p < .05. ** Difference among groups (t-test or ANOVA) is significant at p < .001.
As depicted in Table 2, men were significantly more socially lonely than women (t(1,187) = 3.83, p < .001); those who lived in rural areas were significantly more socially (t(1,186) = -3.14, p = .002) and overall lonely (t(1,186) = -2.15, p = .03) than those who lived in urban areas, and those participants who experienced mental health problems in the past were more emotionally (t(1,187) = 8.52, p < .001), socially (t(1,187) = 4.16, p < .001) and overall lonely (t(1,187) = 8.06, p < .001) than those who did not.
Results of ANOVA for emotional, social and general loneliness, separately, are depicted in Table 3. Where we could not confirm the assumption of equal variances, we used Welch’s ANOVA, ω2 as an estimate for effect size, and Games-Howell post hoc tests. In cases, where assumption of equal variances was confirmed we used partial η2 as an estimate for effect size and Hochberg’s GT2 post hoc tests.
Significant differences among groups (results of ANOVAs) for emotional, social and general loneliness.
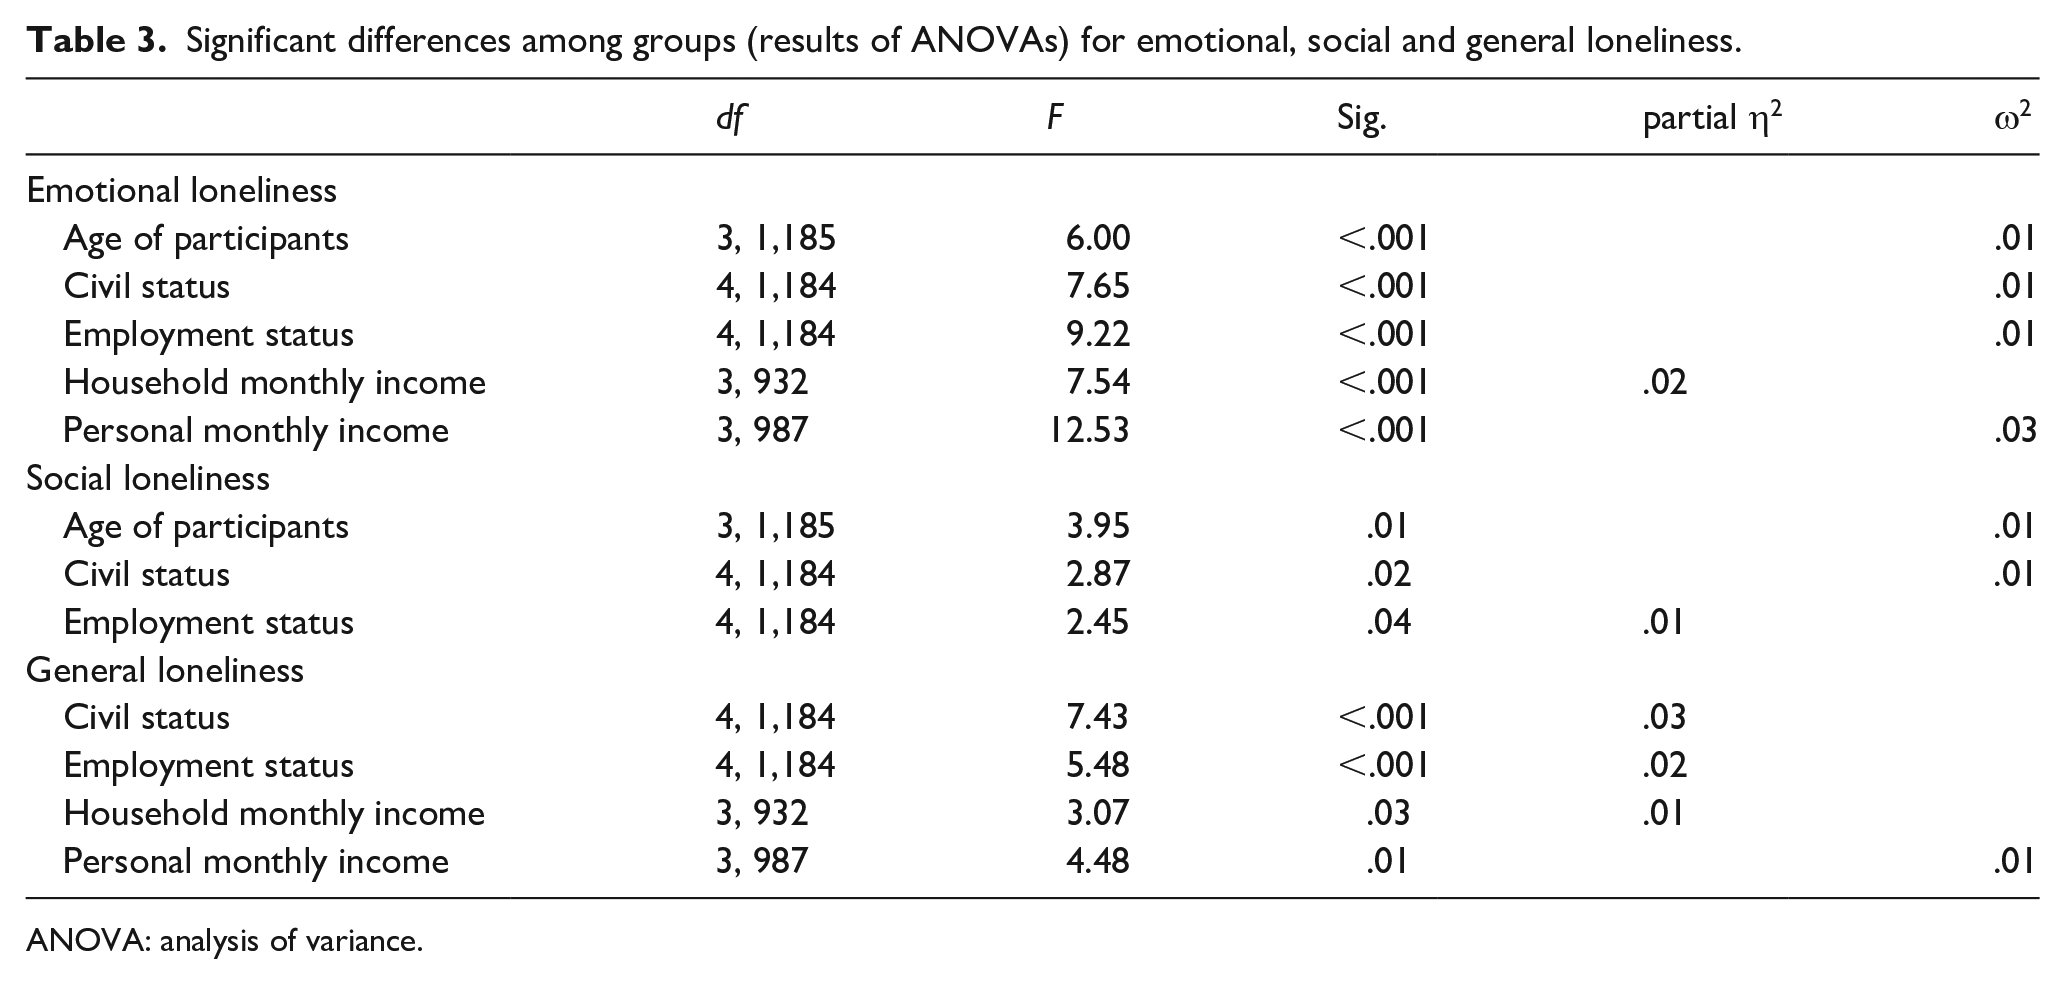
ANOVA: analysis of variance.
The youngest age group (18–29) was more emotionally lonely than the 30–44 years olds (ΔM = .31, standard error (SE) = .10, p = .01, 95% confidence interval (CI) (.10, .54)), the 45- to 64-year-olds (ΔM = .35, SE = .09, p = .001, 95% CI (.14, .54)) and the 65-year-olds and older (ΔM = .38, SE = .11, p = .001, 95% CI (.16, .61)). As far as social loneliness is concerned, however, the youngest age group was less lonely than those aged 30–44 (ΔM = -.28, SE = .11, p = .05, 95% CI (-.50, -.06)) or 45 to 64 (ΔM = -.35, SE = .10, p = .004, 95% CI (-.53, -.16)).
Single people experienced significantly more emotional loneliness than people in a relationship (ΔM = .42, SE = .11, p = .001, 95% CI (.21, .62)) or married people (ΔM = .52, SE = .10, p < .001, 95% CI (.34, .70)). In addition, single people experienced significantly more social loneliness than people in relationships (ΔM = .34, SE = .11, p = .01, 95% CI (.12, .54)). As for general loneliness, single people experienced more loneliness than people in a relationship (ΔM = .76, SE = .16, p < .001, 95% CI (.47, 1.10)), married (ΔM = .78, SE = .16, p < .001, 95% CI (.46, 1.10)) or divorced people (ΔM = .69, SE = .23, p = .03, 95% CI (.22, 1.20)).
In terms of employment status, the greatest differences were in emotional loneliness; students were emotionally lonelier than those who were employed (ΔM = .47, SE = .12, p = .002, 95% CI (.23, .70)) or retired (ΔM = .48, SE = .13, p = .003, 95% CI (.22, .74)). The same is true for unemployed people who were emotionally lonelier than those in employment (ΔM = .58, SE = .11, p < .001, 95% CI (.27, .89)) and retired people (ΔM = .58, SE = .12, p < .001, 95% CI (.35, .82)). In social loneliness, the only significant difference was between the group of students and the group of unemployed, with the unemployed being socially lonelier (ΔM = .54, SE = .18, p = .02, 95% CI (.20, .87)). In terms of general loneliness, unemployed people were more lonely than employed (ΔM = .43, SE = .20, p < .001, 95% CI (.44, 1.25)) or retired people (ΔM = .85, SE = .21, p = .001, 95% CI (.39, 1.30)).
Those with the lower household income per month (less than 1,100 €) were emotionally loneliest; this is true if we compare them with the group with an income of 1,100 to 2,200 € (ΔM = .30, SE = .09, p = .01, 95% CI (.11, .47)), those with an income of 2,200 to 3,300 € (ΔM = .34, SE = .11, p = .004, 95% CI (.14, .55)) and those with an income above 3300 € per month (ΔM = .62, SE = .14, p < .001, 95% CI (.35, .91)). There were also differences in general loneliness regarding household income, with those with an income of less than 1,100 € per month being lonelier than those with an income of more than 3,300 € per month (ΔM = .76, SE = .25, p = .02, 95% CI (.29, 1.23)).
Looking at personal monthly income, the results are similar to those for monthly household income. Those with the lower personal monthly income (less than 550 €) were emotionally loneliest; they were lonelier than those with an income of 550 to 1,100 € (ΔM = .48, SE = .10, p < .001, 95% CI (.30, .67)), those with income of 1,100 to 2,200 € (ΔM = .58, SE = 10, p < .001, 95% CI (.39, .77)) and those with an income above 2,200 € per month (ΔM = .85, SE = .20, p < .001, 95% CI (.43, 1.20)). In general loneliness, those with a personal income of less than 550 € per month were lonelier than those with an income of 550 to 1,100 € (ΔM = .50, SE = .17, p = .02, 95% CI (.20, .83)), those with an income of 1,100 to 2,200 € per month (ΔM = .54, SE = .18, p = .02, 95% CI (.20, .89)), and those with an income of more than 2,200 € per month (ΔM = .96, SE = .31, p = .02, 95% CI (.30, 1.55)).
In this study, the reliability coefficients (Cronbach’s alpha) for the emotional and the social subscales are .66 and .80, respectively. The reliability coefficients for total scale is .71. This was the first use of the Slovene version of the scale; therefore, the validity of the scale was ensured with the use of double blind back-translation. The two-dimensionality of the scale was confirmed with factor analysis.
To have the wrist of the level of loneliness in our Slovenian population, we compared it to the average loneliness data from a study by De Jong Gierveld and Van Tilburg (2010), in which these authors tested the scales for emotional and social loneliness using reports from seven countries (France, Germany, the Netherlands, Russia, Bulgaria, Georgia and Japan). The participants in their study were 18–79 years old. Compared to the average emotional and social loneliness in seven countries from the study conducted with one-way t-test, the participants in our sample were both more emotionally (ΔM = .11, t(1,188) = 3.77, p < .001, 95% CI (.05, .17)) and socially lonely (ΔM = .44, t(1,188) = 12.58, p < .001, 95% CI (.37, .51)) than the countries examined by De Jong Gierveld and Van Tilburg (2010).
Discussion
The aim of this study was to examine levels of social, emotional and general loneliness in the general population of Slovenia. Our results differ for emotional, social and general loneliness. The only demographic variables that played a significant role in all types of loneliness were history of past mental illness, civil status and employment status. In terms of civil status, single people represent the loneliest group, which seems to be consistent with other studies (de Dykstra & de Jong Gierveld, 2004; de Jong Gierveld et al., 2009; Dykstra & Fokkema, 2007; Hyland et al., 2018; Victor & Yang, 2012). The least lonely were married people (for emotional and general loneliness) and people in a relationship (for social loneliness). In terms of employment status, unemployed people were the loneliest in all types of loneliness. Interestingly, the least lonely of all types of loneliness, when considering employment status, were those who were retired. In summary, the answer to the question of who is generally the loneliest is to be found among single and unemployed people and those with a history of mental illness.
The type of settlement also played an important role in general loneliness. Those who lived in rural areas were generally lonelier than those from urban areas. This also applies to social loneliness. In addition, personal and household incomes per month were important factors in general loneliness, with those on the lowest income being most at risk of experiencing loneliness. The importance of income for loneliness was also important for emotional loneliness, but not for social loneliness. In emotional loneliness, similar to general loneliness, loneliness decreased as personal and household income increased.
Moreover, emotional loneliness decreased with the age of the participants, which is in contrast to the role of age in social loneliness, where loneliness increased with the age of the participants, except for participants who were older than 65 years, who did not differ significantly from other age groups in levels of social loneliness.
For social loneliness, gender also played a role, in addition to the history of previous mental illness, the type of settlement, civil status, employment status and age, with men being more socially lonely than women.
Limitations
There are some limitations for the current study. Data analysis with large sample sizes can give significant results that may not be present in smaller samples. The self-report nature of the variables is also a limitation, as is the cross-sectional design, which limits the implications for causality and does not provide information on changes over time. There is also a problem of representativeness of the sample, as we used a private agency (Valicon) – although officially certified and regularly used by the government–to recruit participants. Therefore, the sample could be biased, as we cannot know whether the persons responding to this type of web-based recruitment may really represent the general population of Slovenia.
The aim of the article was to draw an overall picture of the state of loneliness within the general population in Slovenia; this means that we cannot talk about in-depth understanding of the issue of loneliness in the country. Therefore, we recommend that our findings be complemented with more data from both quantitative and qualitative research.
Conclusion
Our study shows that differences in loneliness among demographic subgroups are an important factor in understanding and studying loneliness, especially with regard to the distinction between social and emotional loneliness. Given that loneliness represents today a significant public health problem, it is important to understand which demographic subgroups are more at risk and how we can help them.
