




Abstract
This article examines the variation in the level of use of information and communication technologies by national bodies of labour administrations across 81 different countries. Extending empirical research on the state of information and communication technology use, it introduces a prototype index of country-level information and communication technology use. The index allows for the exposition of the contributions of sub-dimensions of information and communication technology use, including labour inspection, public employment services and labour dispute prevention and settlement. Graphical evidence showing sub-index and final index formulations for individual countries is given, along with graphical evidence of the country-level ranking and geographical variations of information and communication technology use (including the sub-dimensions of this use). The future potential of the prescribed approach is demonstrated by offering possible explanations behind the results on a sample of countries.
Points for practitioners
In times of pressure on public administration worldwide for the greater provision of information and communication technology-enabled products and services to citizens, policymakers, public procurers of technology-based solutions and providers of information and communication technology assistance programmes should have access to toolkits for the assessment and comparison of the use of new technologies in and across public organizations. In this article, we offer future value for such practitioners by proposing one such tool. Using global data on the use of information and communication technologies from the field of labour administration, we demonstrate its potential to construct indices of information and communication technology use in selected areas of the public service.
Keywords
Introduction
Interest in the impact of information and communication technologies (ICT) on the public administration modernization agenda has accelerated in the last 20 years (see, e.g., Bellamy and Taylor, 1994). Governments are under pressure to increasingly render their services through the competent application of ICT (Šiugždinienė et al., 2017; Van Jaarsveldt and Wessels, 2015). Despite growth in the number of studies evaluating the adoption, acceptance, performance or success of national public administrations in general (see Wirtz and Daiser, 2018), the specific area of labour administration remains poorly understood (Hastings, 2016). As defined by Convention 150 of the International Labour Organization (ILO) – a United Nations agency developing labour standards, policies and programmes to promote decent work – labour administration refers to ‘public administration activities in the field of national labour policies’ (ILO, 1978). This includes the functions of labour ministries and/or their equivalents, public employment services, labour inspection, dispute prevention and settlement services, and vocational education and training institutions (Heyes and Rychly, 2013: 1). Related to this, the Convention defines the system of labour administration as ‘all public administration bodies responsible for and/or engaged in labour administration’ (ILO, 1978).
In this article, we complement the state of e-government research by empirically scrutinizing technology use by national labour administration systems. Specifically, we demonstrate the rigorous development of a tool that might allow for assessments of the level and variation of levels of ICT across nations. In so doing, we contribute to the creation of scientific knowledge in the arena of labour administration, which is a nascent academic field of study that still features only as a subcategory of the discipline of public administration (see Hastings, 2016). 1 We report an assessment of ICT use achieved by representing the findings of a comparative cross-national report on the use of ICT in labour administration published by the ILO (Galazka, 2015). We apply an innovative indexing approach (Beynon et al., 2016) to convert statistical results into single indices of ‘ICT use’, and graphically show individual contributions from Galazka’s (2015) focal labour administration components, namely, labour inspection, public employment services and labour dispute prevention and settlement. Our aim is to highlight the possibilities of the index approach to profile specific regions and labour-related functions where the state of ICT use might be lacking and that might therefore be ripe for targeted future interventions to improve administrative functions.
This article proceeds by first reviewing studies on ICT use in public administration. The next section explains the methods used. The results are then considered in terms of comparatively assessing the extent of new technology adoption in labour administration worldwide. Finally, we reflect on the potential of the method to be used in future policymaking and research in labour administration and beyond.
The impact of ICT on public administration
Since the 1970s, public agencies worldwide have been increasingly using ICT in administrative procedures of storing and processing large amounts of data, as well as in regulating public and private sectors alike (Kennedy, 2016; Liu and Yuan, 2015). From the introduction of personal computers, through time-sharing systems, to social media applications, the adoption of modern ICT has been claimed to improve the efficiency, effectiveness, availability and transparency of public administration.
From the early 2000s onwards, various studies have examined the benefits that this brings. For example, Tat-Kei Ho (2002) content-analysed the local government websites of the most populous cities in the US and surveyed web development officials, and showed a paradigm change away from standardized bureaucratic systems towards citizen-centred government premised on networks, collaboration and a customer services orientation. Seifert and Petersen (2002) suggested that ICT has the potential to enhance government accessibility and citizen participation. Thomas and Streib (2003) found that government websites are an effective vehicle for citizens to contact the government. West (2004) found that e-government can increase democratic performance and responsiveness to citizens’ questions, thus boosting beliefs about government effectiveness. Welch et al. (2005) used survey data to explore the interrelationship between citizens’ experience with e-government and their trust in government. The results indicated that citizen satisfaction with government website use was positively associated with their satisfaction with e-government and with the trust they placed in government. Moreover, their research showed that transparency was improved through raising awareness of government initiatives by means of the rapid dissemination of more accessible and complete information.
Despite the alluring appeal of such claims, the actual implementation of ICT by public agencies and its outcomes have been mixed. Welch et al. (2005) described citizen dissatisfaction with the transactionality and interactivity of websites, while West (2004) suggested that governments could do better in terms of harnessing the potential of ICT to improve their service delivery and increase the level of citizen trust in government. Allen et al. (2001) suggest that unless a culture change is achieved away from long-standing vertical structures of power and towards open, flexible and horizontal decision-making, the full benefits of ICT cannot be harnessed. In reality, access to and the use and impact of ICT in the public sector has been unequal both within and between developing and industrialized nations (Allen et al., 2001; Gichoya, 2005; Ndou, 2004; Norris and Reddick, 2013). Unsurprisingly, this pattern is also observed in the specific field of labour administration (Galazka, 2015).
Dealing with the complexity of ICT use in the public sector: An indexing-tool approach
Reflecting on the historical developments of ICT in public administration, Meijer et al. (2012: 203–204) noted that ‘the impact of ICT in public sphere is a subject often associated with complexities’. This might be why politicians and public administrators find it difficult to design and implement high-level ICT policies (Meijer, 2007). Although much focus in studies on technology-supported public services has been on qualitative explorations of the benefits and shortcomings of ICT use, Wirtz and Daiser (2018) note that there is still demand for rigorous quantitative empirical e-government research.
We take action on this point and argue that to develop a thorough understanding of the role of ICT in enhancing the efficiency and effectiveness of labour administration, it is important to first appreciate the level of ICT use and how varied this level might be across various labour administrations and across their individual components. We therefore ‘bypass’ an investigation into the causes and effects of these complexities, examining instead the level of ICT use in labour administration. An innovative methodology is applied to consider the extent and variation of the adoption of ICT in public agencies in the field of labour inspection, public employment services and labour dispute prevention and settlement. This is done by quantitatively measuring and visualizing the presences of computerized functions, rather than in terms of qualitatively analysing the profiles of individual ICT-enabled labour administration functions.
Why would such a tool prove to be of value to academics and policymakers? Researching ICT is like ‘shooting at a moving target’ (Meijer, 2007; Meijer et al., 2012). The pace of technological development is too high to render detailed analyses of specific technologies usable for a longer time as such developments are soon made redundant and replaced by other technologies (Meijer et al., 2012). Therefore, scholars and practitioners might be more interested in standardized methodologies that offer an optic for a quick assessment, demonstration and comparison of ICT use in public administrations relative to other developing and industrialized countries. As observed by Ma and Zheng (2017: 2), recent years have seen an increase in the publication of rankings of e-government. These include Brown University’s Global E-Government Report (West, 2005), the Waseda International E-Government Rankings Survey (Obi, 2008), Rutgers University’s Digital Governance in Municipalities Worldwide (Holzer and Manoharan, 2016) and the United Nations’ E-Government Survey (UN, 2016). Building on from this trend, we begin to develop an index of ICT use in labour administration.
As the amount of information on ICT use in labour administration is scarce, it becomes all the more important that all such information is captured and evaluated. We believe that the indexing approach can become a useful new toolkit for recording such data. The data could then be used to develop an annual indexing of ICT use in labour administration across countries, individual labour administration components and over time, offering real insights to practitioners. Moreover, the incorporation of an indexing approach into research on ICT use in the public sector responds to calls by Wirtz and Daiser (2018) to address the shortage of quantitative e-government research. By proposing a new method for e-government exploration and testing it in labour administration, we hope to increase the academic visibility of labour administration as a scientific field.
The empirical originality of this study is that it is one of the first to explicitly examine the use of ICT specifically by agencies operating in the field of labour administration. Here, variations across national systems of labour administration in terms of the number of agencies, their status, their functions and the extent to which a government devolves responsibilities to other bodies (Heyes and Rychly, 2013) make it difficult to conduct comparative research. Practitioner publications stress the potential of ICT to, for example: enhance the elaboration, implementation and monitoring of labour laws; improve working conditions; and assist workers with registering job changes, accessing company information from the public domain or filing electronic complaints (Express Computer, 2015). However, this has not been matched by the level of academic interest in electronic labour administration. We begin to redress this inattention.
Data
This study uses descriptive data collected during the first author’s involvement in the ILO’s first evaluation of the state of new technologies use in labour administration (see Galazka, 2015). An online questionnaire was sent to 185 ILO member states 2 and returned by 81 countries. Participants included labour ministries, labour inspectorates, public employment services and labour dispute prevention and settlement agencies. 3 The ILO entrusted representatives from its own database of contacts with identifying appropriate respondents to comment on the questions. For each country, one questionnaire was sent per ministry of labour or equivalent, and the person contacted was given an option to either return one questionnaire for the whole labour administration system, or to distribute copies of it to specialized institutions. As a result, 12 countries returned multiple questionnaires (between two and four) and there was no correspondence in the final data set between the number of completed questionnaires and the number of participating countries. Therefore, some countries (e.g. Austria) were over-represented among survey respondents, while the contributions of other participants may have been potentially diluted by those from more active member states.
The questionnaire consisted of general questions about technological tools and channels used across all labour administration institutions, which have been excluded from the present analysis, and specific questions about the extent of computerization of various functions within the three focal areas of labour inspection (LI), public employment services (PES) and labour dispute prevention and settlement (LDPS). The latter informed the development of the sub-indices of ICT-Use (LI, PES, LDPS) and the single index value of ICT-Use in this study. Figure 1 further details the functional sub-dimensions of each intended ICT-Use sub-index.
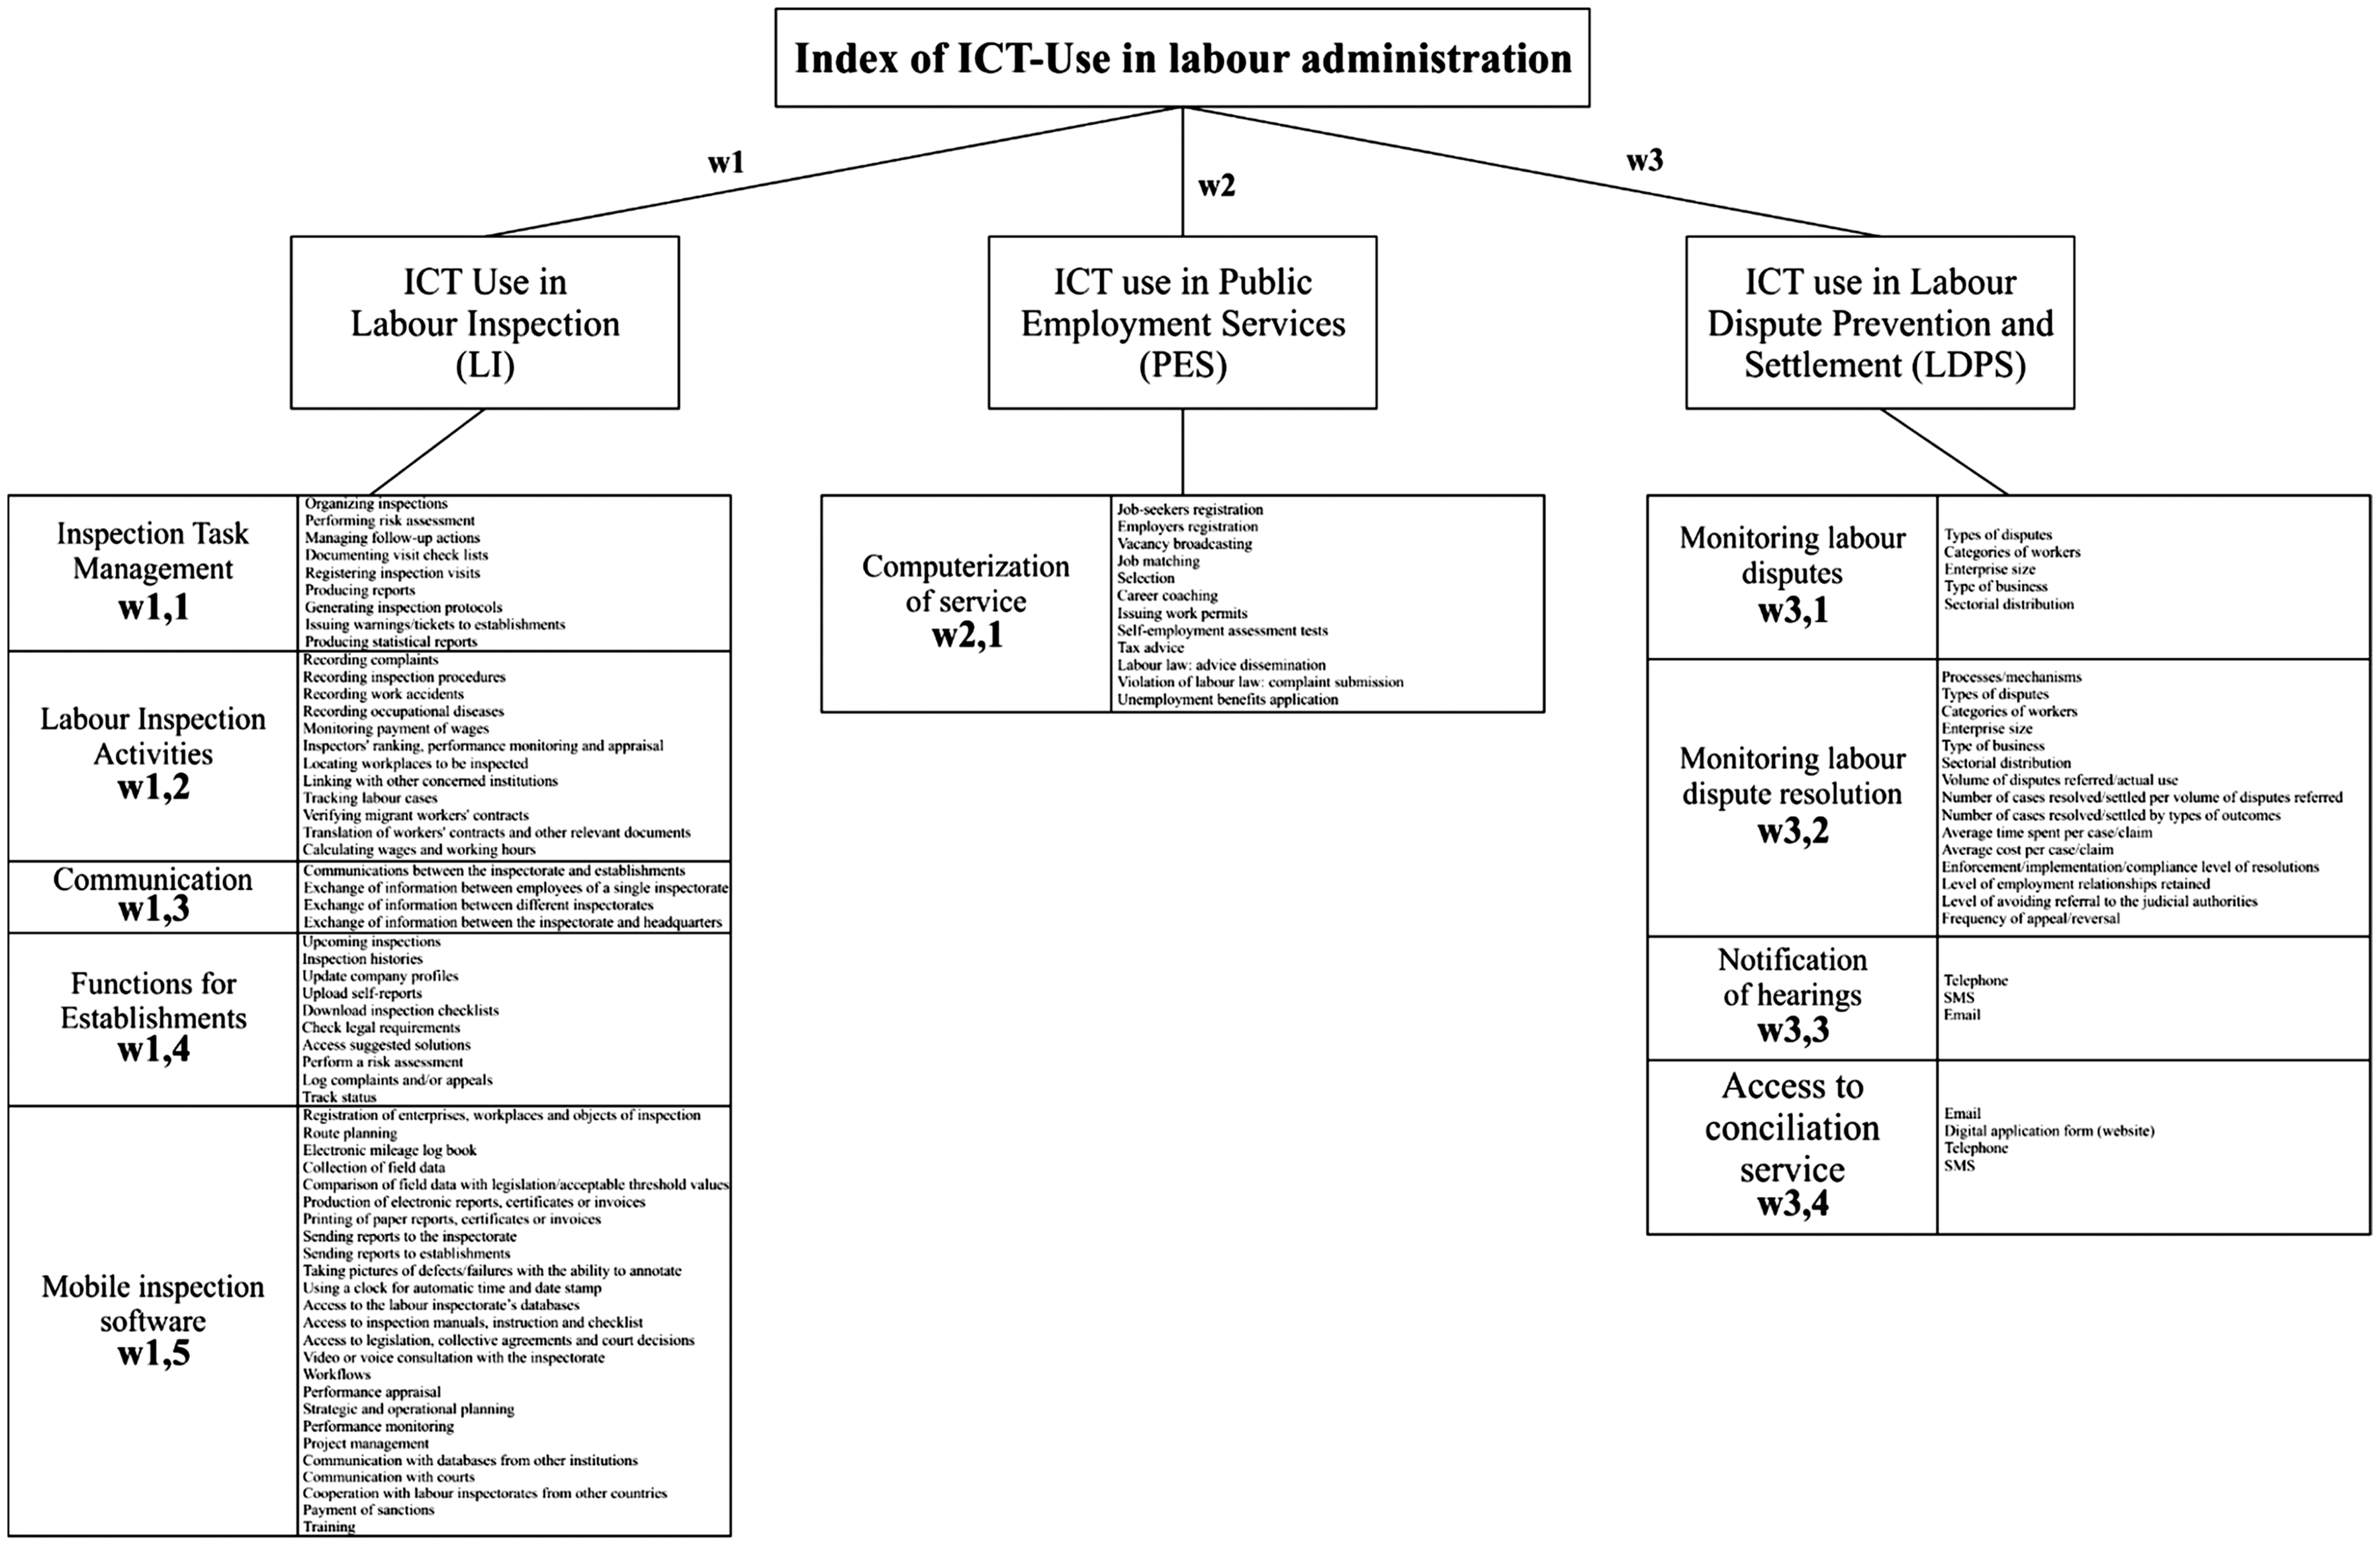
Graphical breakdown of ICT-Use index (and sub-index) construction.
Referring to Figure 1, in each of the three sections of the questionnaire (ICT use in LI, ICT use in PES and ICT use in LDPS), participating labour administration institutions were asked to indicate whether particular pre-given activities (columns to the right across paths in Figure 1) falling under each sub-dimension of the three labour administration areas (columns to the left across paths in Figure 1) were computerized. The relevant data were then extracted and experts, including authors and field practitioners from the ILO who commented on earlier drafts of the questionnaire, considered the weighting of importance 4 of various sub-dimensions of the sub-indices of ICT use (wis and wi,js).
As an exploratory study (including concomitant index construction in this area), no weights of importance were attached to individual activities within each sub-dimension of labour administration functions as these were deemed as operating at too high a level of granulation. The weights (wis and wi,js) quantify the contribution of dimensions and sub-dimensions to the issue of ICT use in terms of equal weights at this initial exploratory stage (see Table 1). It was acknowledged by the experts that in the future employment of this approach, variation in weights will enable specific emphasis to be instilled in analysis, dependent on the relevant focus.
Weights employed in ICT-Use indexing.
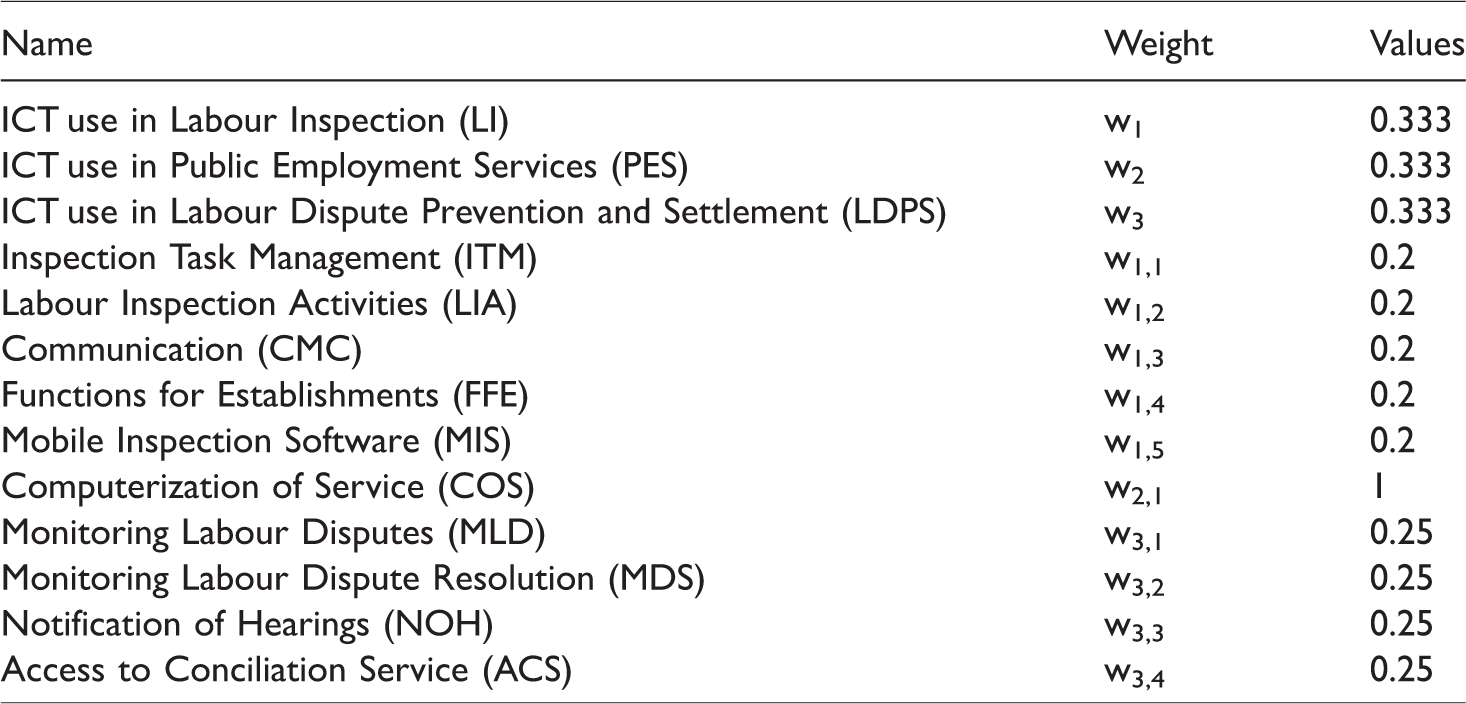
Among the weights, it is noted that with w2,1 = 1, its inclusion is to maintain the weight and sub-weight throughout, even though there is only one sub-dimension under PES. We again note here that the future employment of the later described indexing approach could employ different weights, subject to discussion on what is being considered.
The instances of multiple representations of a country were taken into account for the country-level analysis underpinning this article. Specifically, for each response, the different ICT activity was noted by its existence or absence; hence, for multiple institution responses from a single country, the existence of that ICT activity in any of its responses is enough to say that it exists for that country. The rubric allows us to reduce the data set down to individual countries, found here to number 81.
Results
Details on the indexing approach behind the results presented are given in Appendix 1, with further examples of its previous elucidation and application in Beynon et al. (2016) and Fuller et al. (2017). It is noted that the indexing results are relative, meaning that they are scaled based on the data, so index values range from 0 to 1, based on the countries for which data were available to consider.
The first set of results presented are at the ICT-Use sub-index level (LI, PES and LDPS), along with the final (aggregated) level of ICT-Use. Throughout the exposition of results, as acknowledged in Beynon et al. (2016), emphasis is on the visualization of findings (acknowledging this as being an appropriate form of result elucidation for policymakers in the future).
Sub-indexes (LI, PES and LDPS) of ICT-Use
Graphical results for sub-index-level findings, using constellation graphs, for the sub-dimensions of LI, PES and LDPS are shown in Figure 2.
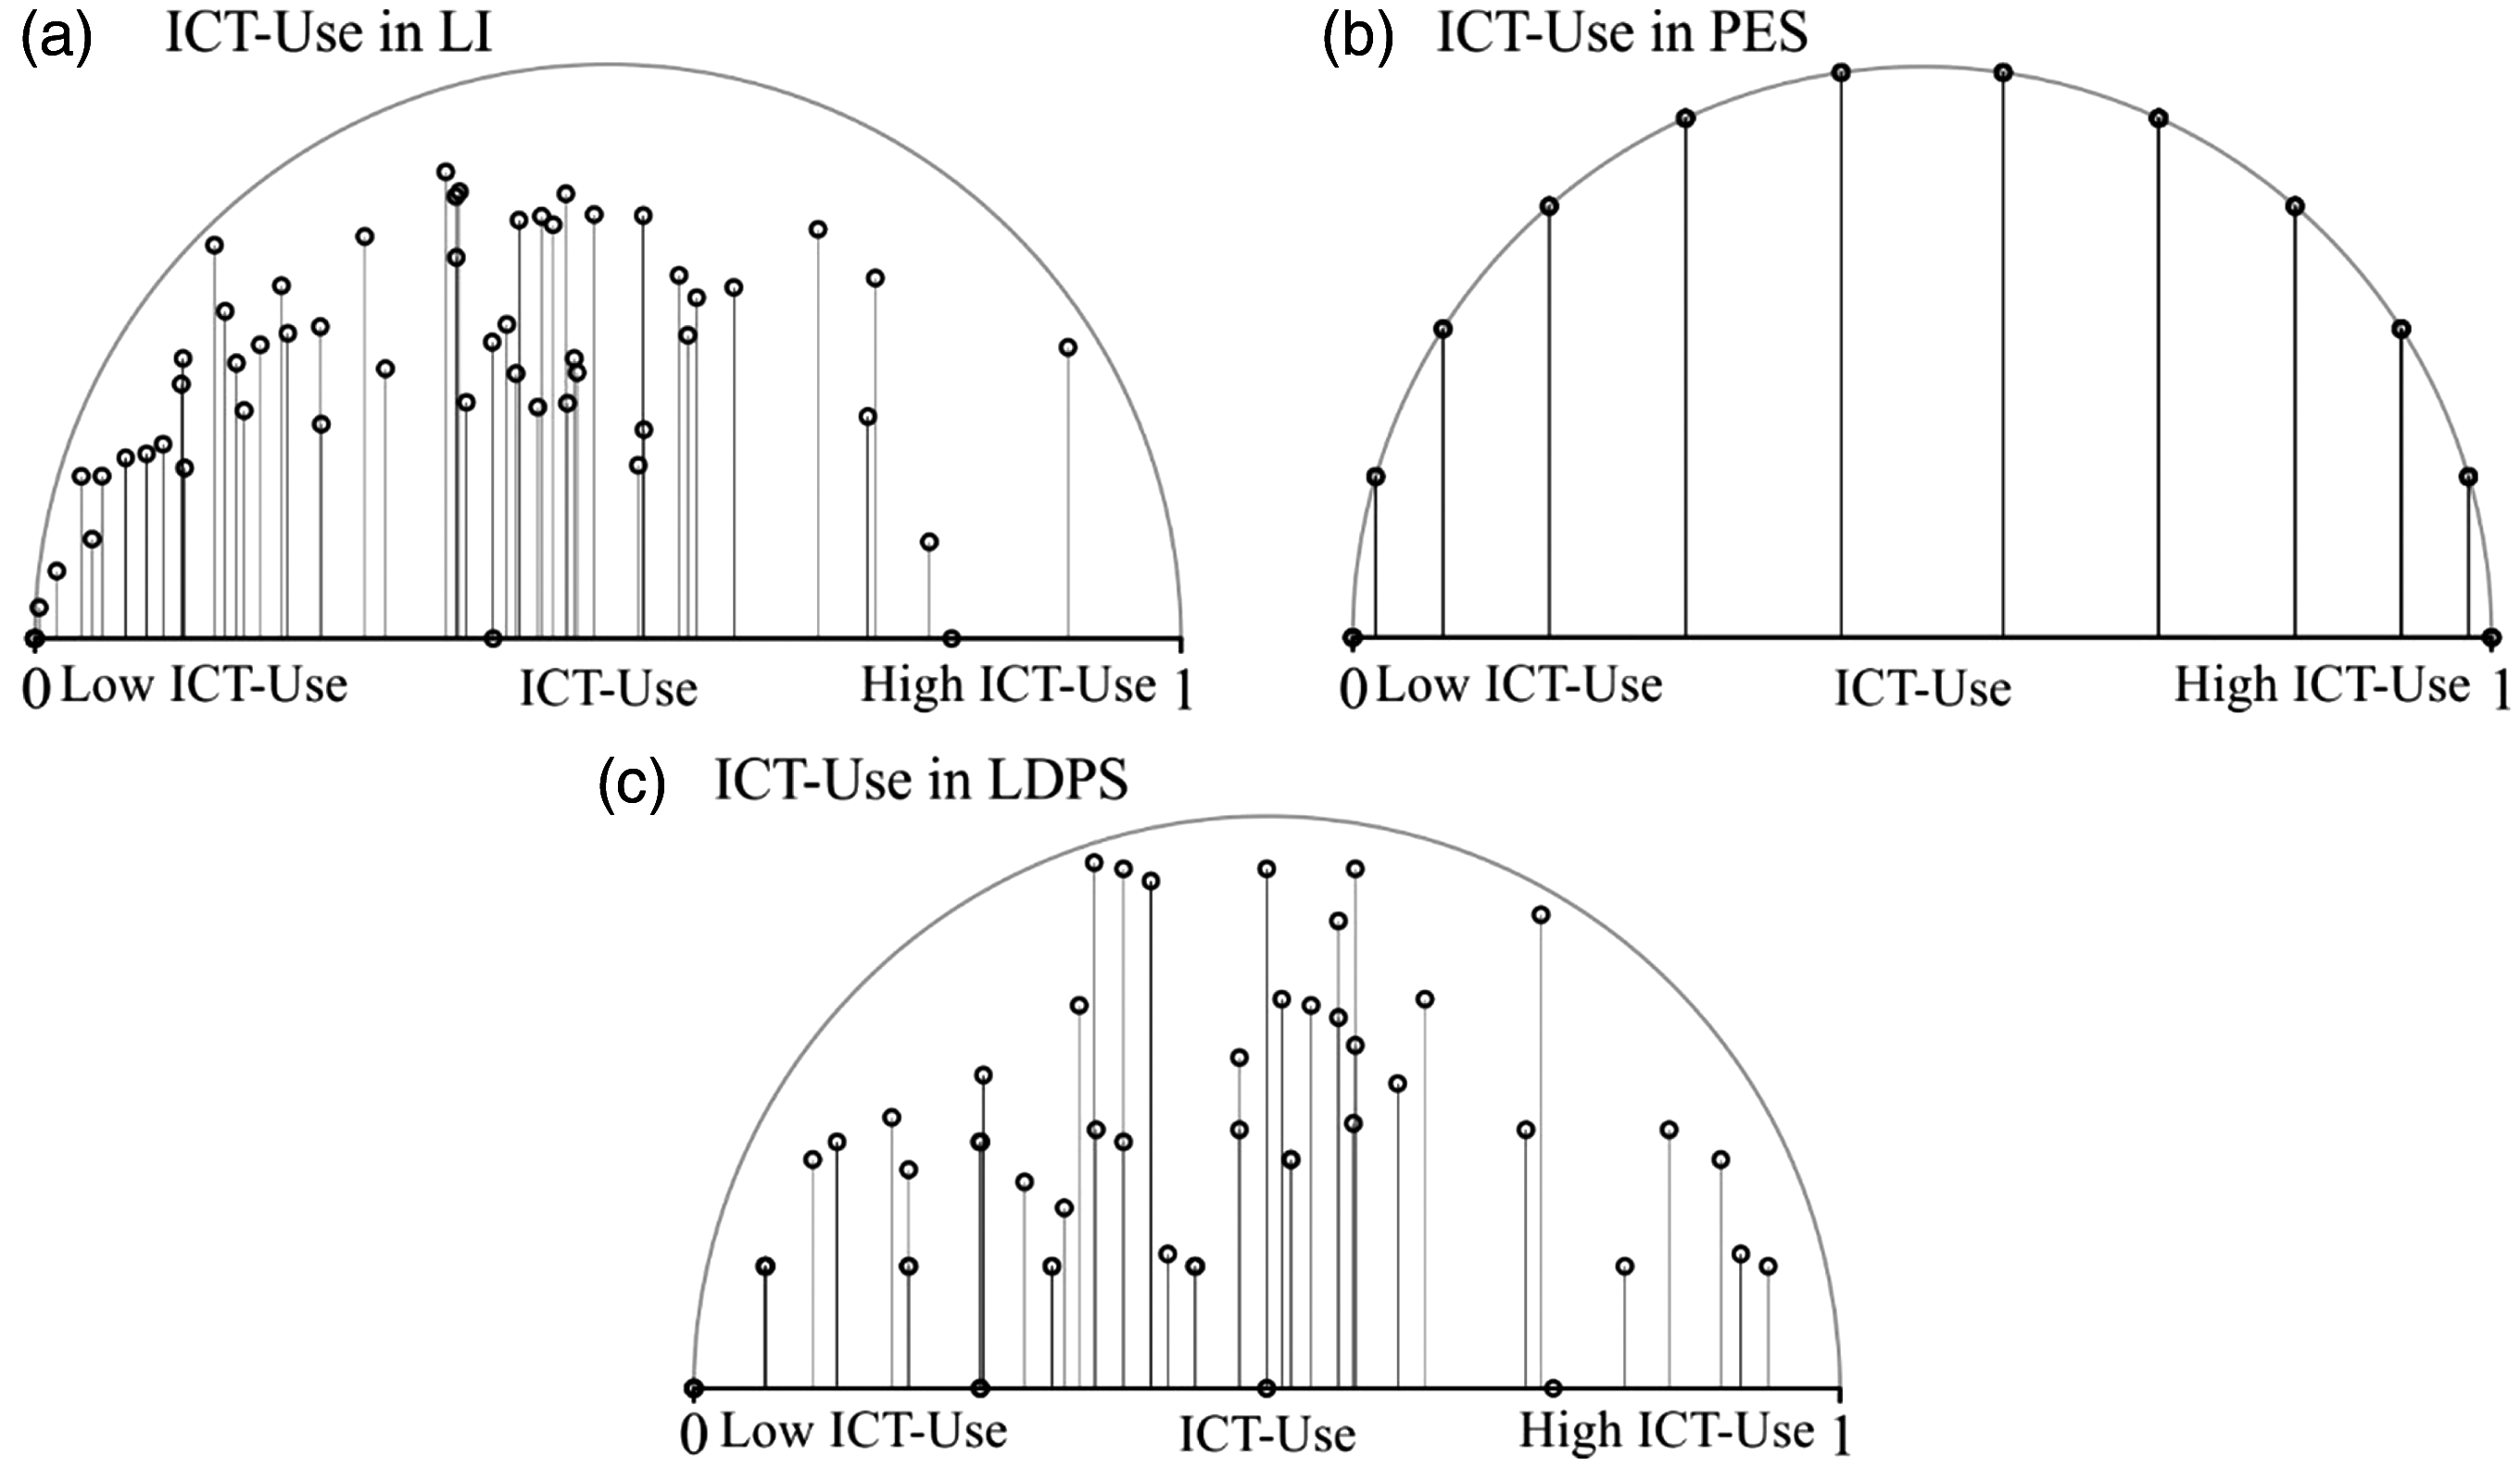
Constellation graph elucidation of sub-index of ICT-Use across 81 considered countries (over sub-dimensions LI, PES and LDPS).
For each sub-dimension of ICT-Use, a respective constellation graph is shown (see Beynon et al., 2016). Within each graph, an individual circle (constellation coordinate) represents a country’s position within that sub-dimension’s ICT-Use graphical domain (for their technical construction details, see Appendix 1). The positions of each constellation coordinate away from the circle boundary (edge) is an indication of the consistency of the contributory evidence from the considered values making up a sub-index value for a country. 5
Drawn down from each constellation coordinate are lines mapping their positions in the constellation graph domain to the baseline, which has the sub-index domain of 0 (left) to 1 (right), representing the numerical limits of low to high ICT-Use (hence, each country takes a sub-index value from 0 to 1). Positions along this baseline, where the mapped down lines meet the baseline, do not overpopulate these graphs and individual country labels and values are not included (this will take place at the individual country-level analyses undertaken later). The evidence spread of the sub-index values (as indicated by the vertical mapping lines) indicates values across the sub-index domains, suggesting that even at the sub-dimension levels, there are wide disparities in the level of ICT-Use across the considered 81 countries.
Final index of ICT-Use
Following the elucidation of the individual sub-indexes (LI, PES and LDPS), next considered is the aggregation of the sub-index values to the establishment of a final ICT-Use index (see Figure 3).

Constellation graph elucidation of aggregated final index of ICT-Use across 81 considered countries.
In Figure 3, a single constellation graph is presented, including the constellation coordinates representing the final ICT-Use positions of 81 considered countries in this domain (found from weight-aggregating the respective constellation coordinates based on the sub-dimensions – shown in Figure 2a–c). With this represented graph, associated with each circle is a numerical label of the country it represents (for the list of countries and labels, see Appendix 2).
Mapping down from each country-labelled constellation coordinate (top of vertical mapping lines) to the baseline again elucidates the associated final ICT-Use index values (for each country). As with the sub-index results, the spread of the ‘mapping down’ lines onto the baseline (between 0 and 1) shows wide disparities across the 81 considered countries in terms of their final index of ICT-Use.
To further explicate these final index findings and more fully enable interpretation over these initial constellation graph results, further graphical elucidations of the final ICT-Use index values are presented, namely, based on a histogram-based ranking of these index values (see Figure 4) and a world map-based heatmap of these values (see Figure 5).

Ranking of 81 considered countries based on final ICT-Use index values (based on equal weighting throughout).

World map showing heatmap of final ICT-Use index values of 81 considered countries (based on equal weighting throughout).
The results in Figure 4 (histogram ranking) and Figure 5 (world heatmap) enable a more understandable interpretation to the final ICT-Use index value results for the considered 81 countries. What is noticeable in the histogram ranking is a high variation in the scope of ICT use in labour administration across different countries. The world heatmap contains a lot of blank areas, which correspond to countries that did not participate in the survey. Notwithstanding the missing data or any data inaccuracies that fed into the models presented here, the article shows that the indexing method allows for the generation of a visual aid in developing valuable insights about the use of ICT.
Individual country-level elucidation
One feature of the Beynon et al. (2016) index approach is the ability to elucidate all the index information for an individual case (here, country) using the constellation graph approach (as employed on Welsh counties in Beynon et al. (2016) and UK universities in Fuller et al. (2017)). Moreover, the intention of these next constellation graph-based results is to elucidate how a final ICT-Use index value (via a constellation coordinate shown in Figure 3) is derived from the respective sub-dimension sub-index values previously constructed (as shown in Figure 2), and also how these sub-index values are themselves constructed from their constituent sub-sub-dimensions (see Figure 1). Indeed, from Figure 1, these sub-sub-dimensions are again next briefly listed:
LI – Inspection Task Management (ITM), Labour Inspection Activities (LIA), Communication (CMC), Functions for Establishments (FFE) and Mobile Inspection Software (MIS). PES – Computerization of Service (COS). LDPS – Monitoring Labour Disputes (MLD), Monitoring Labour Dispute Resolution (MDS), Notification of Hearings (NOH) and Access to Conciliation Service (ACS).
Here, 10 countries are considered in terms of the full evidence breakdown to the sub-index and final index values in reference to ICT-Use (see Figure 6).
In each constellation graph shown in Figure 6, a single country is described in terms of their viewed ICT-Use. The final ICT-Use index (Fnl ICT) is shown both in terms of constellation coordinate and mapped baseline value. The sub-index ICT-Use values for LI (ICT in LI), PES (ICT in PES) and LDPS (ICT in LDPS) are also shown (constellation coordinates and mapped baseline values). For each of these sub-indexes, the contribution of the sub-sub-dimensions are also shown (e.g. ITM, LIA, CMC, FFE and MLT for ICT in LI), joined by line-point lines to respective constellation coordinates.
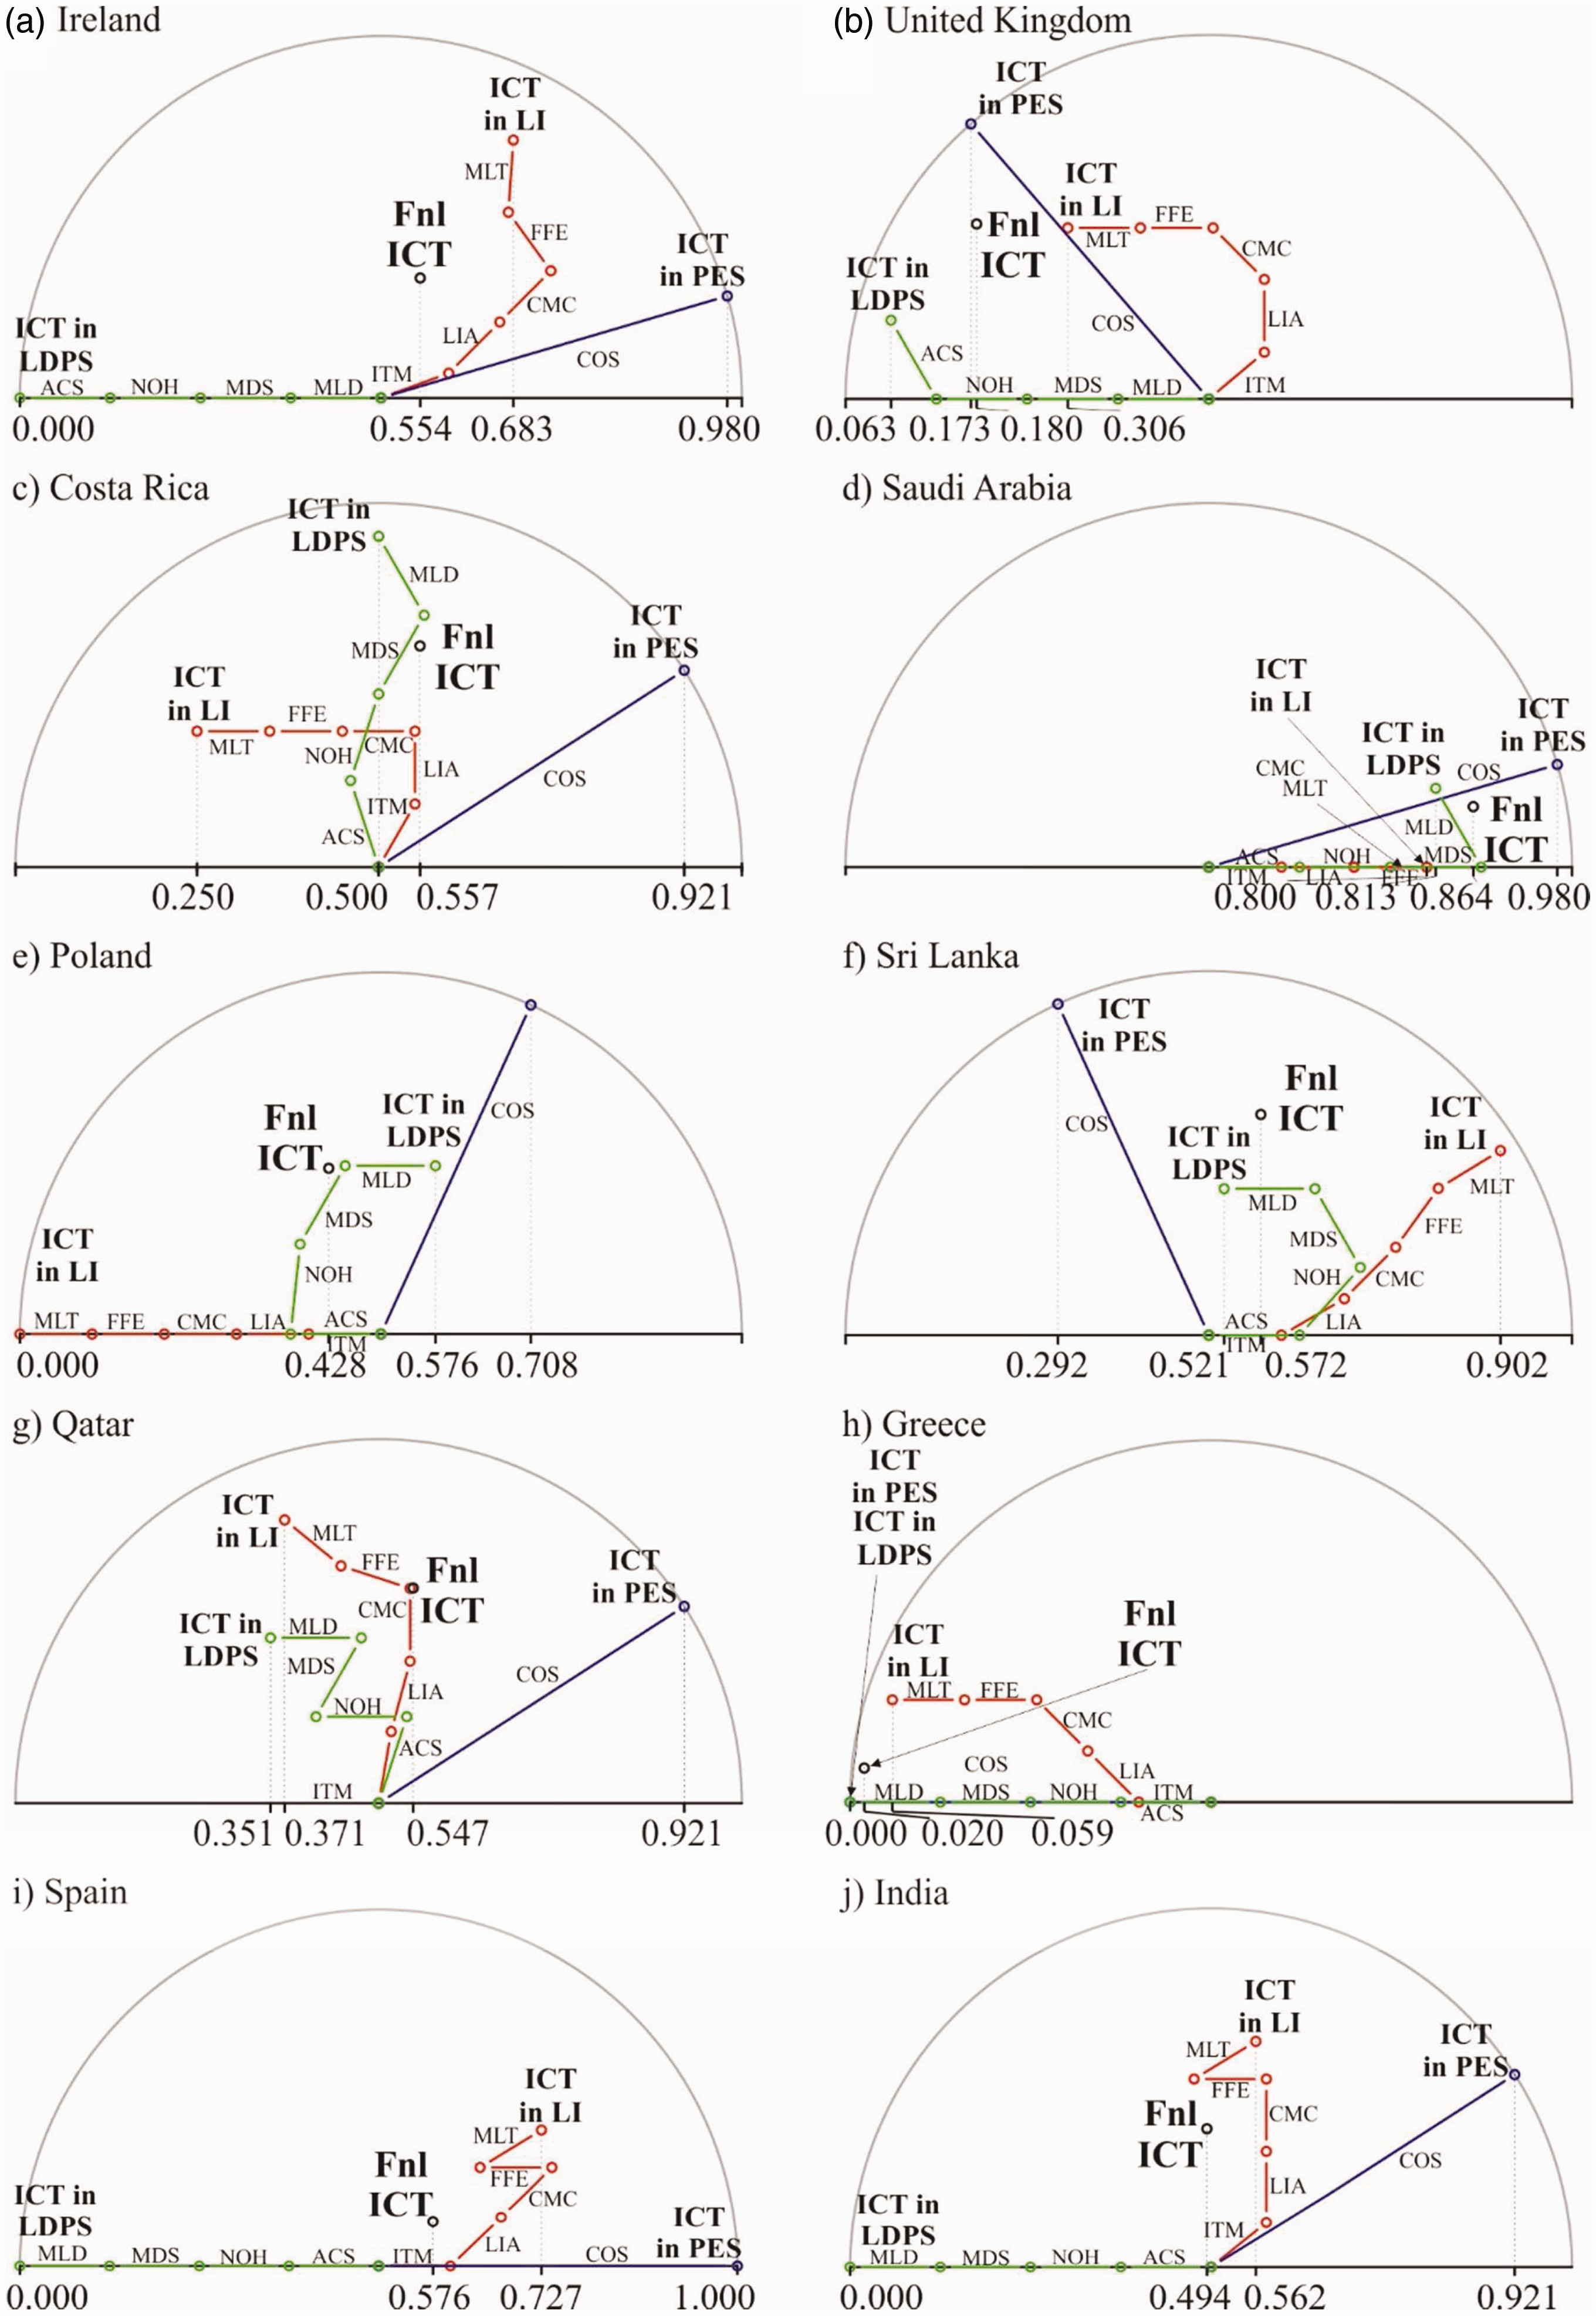
Constellation graph elucidation of country-level index values for the countries (a) Ireland, (b) UK, (c) Costa Rica, (d) Saudi Arabia, (e) Poland, (f) Sri Lanka, (g) Qatar, (h) Greece, (i) Spain and (j) India.
The primarily methodological focus of the study precludes an examination of specific technologies behind the indices presented here. Nonetheless, as an illustration of the utility of the indexing and constellation graph approach, it is important to try and flesh out some of the constellation graphs with, in this case, (1) actual descriptions of successful technological programmes that could account for high index scores in some countries, as well as (2) barriers to technology adoption in order to shed light on the possible explanations behind low index scores in other nations. Given the relative lack of academic research into the extent of ICT adoption in the specific field of labour administration, professional and practitioner publications issued around the time of data collection are also drawn on to build the bigger picture behind the country-level graphical evidence.
First, starting with the example of Saudi Arabia (Figure 6d), which was accorded the highest ICT-Use index of 0.864, and a very high ICT-Use index in public employment services of 0.980 (ICT in PES), one possible explanation for the high index value could lie, at least partially, in the Saudi Arabian Wage Protection System (WPS), implemented in 2013 to facilitate the trouble-free payment of wages. The programme requires companies to register with an electronic WPS and open a payroll file, which must be authenticated by the bank. Employers are then required to supply information on the monthly payment of wages to the Ministry of Labour via an e-service programme linked to the ministry’s website. A database of wage information is also maintained (Perrin, 2013).
Next, in the example of the Spanish labour administration system (Figure 6i), a high level of technology use in public employment services was accorded an index value of 1 (ICT in PES). Possible explanations behind that score can be found in the Spanish Ministry of Labor and Social Security’s programme of changes to its welfare and health services, which involved the issuing of a new social security smart card (Kaplan, 1996). Smart cards can be used by citizens via touch-screen terminals to access online bulletin boards with information about government agencies, job offers and courses for the unemployed. The use of smart-card technology has made information about government programmes and policies more accessible to the public. Moreover, the system has been said to improve control over fraud, particularly for unemployment and incapacity benefits.
Moving away from public employment services, Sri Lanka’s labour inspection (Figure 6f) ranked highly on its ICT use (0.902 – ICT in LI). Indeed, after years of experimentation with technology, in 2013, the Sri Lankan labour inspection system recently underwent a substantial transformation after entering into a collaborative partnership with the ILO and the US Department of Labor, which was additionally fuelled by the technical assistance of a private services provider. The outcome of this partnership was a tablet built-in mobile software application that has greatly increased the speed and ease of labour inspection task completion, both on site and with regard to monitoring and follow-up (Hastings, 2016). The use of this application has since also been reported in India – ranked 0.562 (ICT in LI) on its labour inspection ICT-Use index (Figure 6j) – where its potential to increase the transparency and boost the effectiveness of labour inspection has been noted (Nigam, 2015).
Retaining a focus on labour inspection, the United Kingdom achieved a relatively modest ranking of 0.306 on its technology use in this area (Figure 6b). Given the self-reported quantitative nature of the data that we had available, it is not entirely obvious what led to such a modest ICT-use reading. It is possible that it could be derived from a conceivably neutral and broad approach to ICT at the policy level in the area of labour inspection. One example of this approach is the strategy of the Department for Business, Innovation and Skills of naming and shaming companies that commit labour law violations, with punishment limited to a potential loss of reputation. In 2011, the Department launched an online naming-and-shaming scheme to name employers who break the National Minimum Wage law. The records of such companies are published on the Department’s website (Anonymous, no date) to give workers more detailed information about potential employers and to help them make better-informed decisions about which company to apply to, or to give them the courage to make complaints in case of labour law violations. Of course, it is highly unlikely that this is the only application of technology in the labour inspection portfolio of the UK, but we offer a possible explanation for a surprisingly modest reading of the country’s relevant ICT score in reasons that talk to general policies rather than specific applications of ICT. Another explanation could simply refer to how the person who provided the data for our study interpreted the ‘computerization’ of specific functions of labour administration when answering the questions asked in the survey.
A similar explanation holds for Qatar. Qatari labour inspection scored an index of 0.371 on its use of ICT (ICT in LI – Figure 6g) based on the data that we had available. Again, we recognize that there might be many reasons explaining such a modest ranking. We can only hypothesize about some of them stemming from a neutral policy approach to ICT, as expressed in the strategy adopted by the Ministry of Labour of Qatar. Here, every six months, companies are classed into categories A, B and C, which reflect their compliance with labour laws. The assessments are then uploaded onto the website of the labour ministry. However, rather than to punish those companies that disrespect labour laws, this is done to encourage worse-performing employers to bring their standards up to more in line with the companies that score higher on the ministerial classification (Galazka, 2015). Given this analytical uncertainty, we understand that while the method we use offers powerful visualizations of data, analysing the results requires qualitative analyses in the specific country contexts.
Finally, the example of Greek labour administration (Figure 6h) stands out because of its low scores of ICT use in general (0.020 – Fnl ICT). Moreover, the data available pointed to no technology deployment in the area of labour dispute prevention and settlement and very little technology use in the area of labour inspection (0.059). Indeed, recent reports into the technological situation in the Greek social security and labour inspectorate (e.g. Carbajo Amigo, 2016) confirm problems with limited or unnecessarily duplicated functionalities, poor usability, lack of access to full data sets of information, and absence of coordination and information exchange across different technological systems.
Conclusions
This article, which has considered labour administration within the context of a shifting and difficult technological landscape, has sought to show how the innovative indexing approach could assist policymakers and practitioners in labour administration to quickly assess countries’ ICT use through index values. Indeed, as demonstrated in the discussion surrounding the individual country details (in Figure 6), this ICT-Use index approach offers a point of focus for debate on this issue – something, in itself, the worth of which should not be underestimated.
In this article, such index values not only depict the general state of technology use in labour administration, but also elucidate the individual contributions of key areas of technology use in labour inspection, public employment services and labour dispute prevention and settlement. The indexing approach could be incorporated into the toolkit of validated methodologies that organizations use to gather, store, analyse and visually represent data on a variety of issues, for example, of a financial or epidemiological nature. Diverse global comparisons could then be drawn to highlight areas of high performance from which lessons could be learnt to inform and improve relevant performance in those areas where assistance might be required.
To our best knowledge, such indexing approaches are not yet used in public administration and our study is one of the first to pay specific attention to labour administration, balanced evenly across its different components. In addition to offering graphical representations of the values of the index of ICT-Use in the form of constellation graphs, it facilitates understanding the individual areas of labour administration that make up the indices not just in terms of the presences of some computerized functionalities, but also in terms of their absences through comparison with different countries. Our aim in presenting this toolkit is to awaken the interest of public administration practitioners in the availability of toolkits for ongoing reviews of ICT use and needs. This can allow for benchmarking the use of technology on a regular basis in order to identify gaps as well as to navigate ICT investment decisions.
Footnotes
Acknowledgements
The idea for this article was presented at the meeting of the Work, Employment and Labour Administration Network in Sheffield (2016). We would like to thank all participants for their support. Special thanks go to Professor Jason Heyes (University of Sheffield) and Mr Ludek Rychly (International Labour Organization) for their comments on our work.
Declaration of conflicting interests
The author(s) declared no potential conflicts of interest with respect to the research, authorship, and/or publication of this article.
Funding
The author(s) received no financial support for the research, authorship, and/or publication of this article.