
Abstract
Does social mobility foster political stability? While there is a vibrant literature on the effect of economic inequality on political unrest, the recent literature has remained silent about the effect of social mobility on instability. Yet, inequality and social mobility, although related, are fundamentally distinct, and immobility is likely to be perceived as even more unfair than inequality, meaning that it may generate at least as much grievances. In this article, I argue that social immobility fuels political instability. To test this hypothesis, I develop an indicator of social mobility covering more than 100 countries worldwide. I then conduct the first large-N cross-national test of the effect of social mobility on political instability to date. Consistent with my argument, I find that countries with low social mobility levels are more likely to experience riots, general strikes, antigovernment demonstrations, political assassinations, guerillas, revolutions, and civil wars.
Keywords
Does social mobility foster political stability? 1 While there is a vibrant literature on the effect of economic inequality on political unrest (e.g., Baten and Mumme 2013; Boix 2008), the recent literature has remained silent about the effect of social mobility on instability. Yet, inequality and social mobility, although related, are fundamentally distinct, and immobility is likely to be perceived as even more unfair than inequality (Andrews and Leigh 2009; Jencks and Tach 2006), meaning that it may generate at least as much grievances.
The lack of attention given to the effect of social mobility is particularly puzzling in light of the central role played by social mobility in the pioneer literature on political instability. Pareto ([1916] 1983) in his pathbreaking book The Mind and Society, for example, argued that revolutions occur when there is a “slowdown in the circulation of the elite.” de Tocqueville ([1835] 2004) viewed social mobility as one of the main sources of democratic stability in the United States. This idea was later developed further by Blau and Duncan, who wrote that “The stability of American democracy is undoubtedly related to the superior chances of upward mobility in this country” (1967, 439). Finally, Marx ([1852] 1944) argued that class consciousness—and thus the potential for class mobilization and class-based conflict—in the United States is low because “though classes, indeed, exist, they have not yet become fixed, but continually change and interchange their elements in a constant state of flux” (p. 324).
Multiple case studies support the idea that low levels of social mobility induce instability. For example, looking at the causes of the Arab Spring, Malik and Awadallah (2013) argue that “Arab revolutions were fueled by poverty, unemployment and lack of economic opportunity” (p. 296) and that they involved “the young who see little hope for economic and social mobility” (p. 297). Moreover, Zhao (2001) posits that one of the main causes of the Tiananmen Square protests of 1989 was the worsening prospect of upward mobility of college students. Similarly, Bai and Jai (2016) show that the abolition of the civil exam system in China in 1905—which was the main source of upward mobility for commoners—was one of the main causes of the 1911 Xinhai Revolution that overthrew the Qing dynasty. Yet, despite the central role played by social mobility in early theories of political stability and in the case study literature, to my knowledge, there is not a single large-N cross-national test of the effect of social mobility on instability.
This article bridges this gap by analyzing and testing the effect of social mobility—defined “as the process by which individuals move from one stratum of society to another” (Lipset and Bendix 1959, 6)—on political unrest. I argue that social immobility breeds instability through four closely related mechanisms. First, social immobility, like inequality, generates grievances, which, in turn, incite the masses to challenge the established order. Second, the lack of social mobility creates incentives for individuals in the lower class to employ political violence as a mean to alter the social hierarchy, for example, through revolutionary action.
Third, low social mobility reduces the opportunity cost of taking part in instability-generating activities. Social immobility thus creates opportunities for political violence because it reduces the cost of potential recruits, which facilitates mobilization. Fourth, individuals who have personally experienced mobility—either upward or downward—tend to espouse conservative political ideologies and to be more supportive of the political system and economic hierarchy in place (Clifford and Heath 1993). Therefore, in countries in which a larger share of the population has experienced mobility, there should be fewer people willing to support antiregime movements.
To test this hypothesis, I develop a country-level indicator of social mobility using the International Social Survey Programme (ISSP), Afrobarometer (2004; round 2), Latinobarometer, and Demographic and Health Surveys (DHS). While previous country-level data sets cover a maximum of about twenty-five countries, most of which are from the developed world, the data set I employ covers more than 100 countries worldwide.
I then conduct the first cross-national test of the effect of social mobility on political instability to date. More specially, I test the effect of mobility on civil war onset as well as riots, general strikes, antigovernment demonstrations, political assassinations, guerillas, and revolutions. I find that countries with low mobility levels are indeed more likely to experience all seven forms of political unrest. The effect of mobility is found to be more robust than that of economic inequality. I also contribute to the literature by conducting the first ethnic group-level analysis of the effect of group-level mobility on the onset of ethnic civil wars (Sections 4 and 5 in the Online Appendix). I find that ethnic groups with low levels of upward mobility are more likely to wage civil wars.
What Is Social Mobility and How Does It Differ from Inequality?
In general terms, social mobility refers to the degree to which an individual’s status (e.g., income or profession) at one point in time (e.g., childhood) can predict his or her status at a later point in time (e.g., adulthood). I call the first point in time the origin and the second the destination. Beyond this general definition, however, there are different ways in which social mobility may be conceptualized. First, one can look at either horizontal or vertical mobility. The former refers to movements among groups without an obvious order, such as professions, and the latter to movements across ordered groups, such as wealth quintiles. I focus on vertical mobility, notably because the lack of mobility across ordered groups is likely to generate more grievances.
Second, I am interested in the political implications of relative—as opposed to absolute—social mobility. Relative mobility refers to the extent to which individuals can expect to find themselves in different ranks in the social hierarchy at different points in time. Absolute mobility captures the degree to which an individual’s income increases or decreases between different points in time. While the former is about the ranks of the individuals relative to other individuals in the same society, the latter is about their absolute income/wealth. Relative mobility cannot be positive (or negative) for all members of the society. In order for an individual to go up in the social hierarchy, another individual has to go down. However, this is not the case with absolute mobility, since an individual’s income can increase (decrease) without another individual becoming poorer (richer) by exactly the same amount.
Relative mobility better captures my argument because it is not as sensible to economic performances as absolute mobility. If the income of all individuals in the society increases by the same amount, for example, the level of relative mobility would be zero, since the ranking would remain unchanged. The absolute mobility level, however, would be positive because everybody would have moved upward. Moreover, relative mobility is less sensitive to the level of inequality than absolute inequality (D’Agostino and Dardanoni 2009). Looking at relative mobility enables me to distinguish between the effects of mobility, on the one hand, and growth and inequality, on the other hand. Throughout the article, the term mobility refers exclusively to relative mobility.
Another related distinction is that between upward and downward mobility. One may argue that the absence of upward mobility should be associated with unrest, whereas the effect of downward mobility is less clear. This distinction is most relevant to absolute mobility, since a high level of relative mobility necessarily involves high degrees of both upward and downward mobility: someone’s position in the ranking has to decrease for someone else’s position to increase. However, this distinction is clearly relevant to the effect of social mobility on instability. Therefore, the empirical analysis does provide evidence that countries with low levels of upward mobility—not only low levels of overall (relative) mobility—are more unstable (Section 3 in the Online Appendix).
One may also distinguish between intergenerational and intragenerational mobility. The former refers to mobility across generations and the latter to mobility within an individual’s lifetime. This article is concerned with both forms on mobility. I expect societies with low intergenerational mobility and/or low intragenerational mobility to be more unstable.
Although related, the concepts of social mobility and inequality are fundamentally distinct. Economic inequality refers to the degree to which people within the same society have different income/wealth levels. In principle, a society could be highly unequal, for example, without social mobility being low. In such a society, the difference in income/wealth between the rich and the poor would be large, but people who are born among the latter may be able to join the former depending on their abilities and the choices they make.
This is not to say that the two concepts are not related. In fact, according to the “Great Gatsby Curve,” there is a negative relationship between economic inequality and social mobility (Jerrin and Macmillian 2015). Inequality, for example, may worsen the opportunities of children who are born in poor families relative to those of children born in rich families, which reduces mobility. In other words, when inequality is high, the gap that the poor need to bridge in order to join the rich is wider. Yet, inequality and social mobility are conceptually distinct.
Social Mobility and Political Instability
Despite the central role played by social mobility in early theories of political instability, the question of the effect of social mobility on instability has gathered little attention among recent authors. 2 In this section, I build on the pioneer literature on political stability and argue that social immobility fuels instability through four related mechanisms. First, the lack of relative mobility creates discontent among the poor, which increases the likelihood that its members take part in destabilizing activities, such as riots, demonstrations, or even civil wars. Individuals are more likely to perceive the established order as fundamentally unfair and to ultimately voice their discontent by generating instability if they know that they are unlikely to improve their relative standing regardless of their efforts and abilities.
This argument is closely related to those developed by previous authors who argue that inequality—including horizontal inequality—generates political instability (e.g., see Alesina and Perotti 1996; Baten and Mumme 2013; Bartusevičius 2014; Houle 2016; Østby 2008; Roe and Siegel 2011; Russett 1964). The basic idea is that inequality produces grievances among the poor, which, in turn, incite them to take part in rebellious activities. The arguments made by these authors are also relevant to the question of the effect of social immobility. Social immobility is likely to produce at least as much grievances as economic inequality. In fact, one of the reasons why inequality is perceived as unfair is that it reduces the prospect for mobility among those who happened to be born in poor families. As argued by Friedman and Friedman (1980, 127), “Much of the moral fervor behind the drive for equality of outcome comes from the widespread belief that it is not fair that some children should have a great advantage over others simply because they happen to have wealthy parents.”
Evidence indeed suggests that most individuals perceive the lack of mobility as more unfair than inequality (Andrews and Leigh 2009; Jencks and Tach 2006). For example, in a series of surveys conducted in 1991 and 1996 in thirteen countries, the International Social Justice Project found that, on average, 75.8 percent of the respondents either strongly or somewhat agreed with the following statement: “It’s fair if people have more money or wealth, but only if there are equal opportunities.” Only 12.6 percent of the respondents either strongly or somewhat disagreed with the statement (and 11.6 percent were indifferent). At the same time, 64.9 percent of the respondents either strongly or somewhat disagreed with the statement “The fairest way of distributing wealth and income would be to give everyone equal shares.” This suggests that the lack of mobility is perceived as more unfair than inequality, and that it should generate at least as much discontent and political unrest.
Second, when prospects of mobility are bleak, individuals who happened to be born in the lower class have incentives to employ political violence as a mean to alter the social hierarchy (Lipset and Bendix 1959; Pareto [1916] 1983). For example, they can overthrow the current order through revolutionary action and use political power to radically transform the society. 3 Unless they challenge the rules in place, the poor are likely to remain at the bottom of the social ranking regardless of their efforts and abilities. Revolutions and other forms of political violence can transform the basic relations of power between social classes; hence enabling previously deprived classes to increase their status in the social hierarchy.
Bai and Jia (2016), for example, argue that the lack of mobility played a crucial role during the Chinese Xinhai Revolution of 1911, which overthrew the Qing dynasty. Following the abolition of the civil exam system in 1905, commoners had little prospect of moving up in the social hierarchy. Prior to 1905, the civil system exam had been the main channel through which ambitious and gifted commoners could experience upward mobility. Its abolition thus incited commoners to join the revolution and overthrow the current system and replace it with a new one, in which they believed they could improve their living conditions. This is illustrated by a statement made by Hu Hanmin, one of the main leaders of the revolution, “who would have followed the revolution if the exam had not been abolished?” (cited in Bai and Jia 2016, 695).
Inequality, by itself, may not create the same impetus to use violence as a tool to improve one’s relative position. Even when inequality is high, individuals may be able to move up in the social hierarchy through “regular,” nonviolent, means. Social immobility, however, by definition, indicates that the poor lack such opportunities. This mechanism differs from the first one in that it is not primarily driven by grievances. Instead, it implies that in countries with low relative mobility, the poor have little alternative to improve their relative standing outside of using violence. Moreover, as explained below, these two mechanisms are likely to lead to different forms of political instability: while the grievance mechanism is more pertinent to small scale and spontaneous forms of conflict, the second mechanism is more relevant to medium- and large-scale conflicts, such as revolutions, that involve the fundamental transformation of the society and the overthrow of the regime.
Third, at any fixed average income level, low relative mobility creates opportunities for conflict by reducing the cost of recruits. This mechanism builds on greed-based approaches to instability (e.g., Collier and Hoeffler 2004). When prospects are bleak, individuals who were born in the lower classes have a low opportunity cost, which decreases the cost that political entrepreneurs need to pay to mobilize them and thus increases the likelihood of conflict (Houle 2016). This is particularly important for forms of political violence that require large-scale mobilization, such as civil wars. Low relative mobility creates a large pool of individuals willing to join a conflict in exchange for a meager salary and access to spoils. When relative mobility is high, however, the opportunity cost of potential recruits—and thus the cost of mobilizing a large fighting force—is larger.
This argument is closely associated to those of Esteban and Ray (2011) and Huber and Mayoral (2014) according to which inequality among members of the same ethnic group increases the likelihood of civil conflict. According to them, inequality within ethnic groups decreases the cost of mobilization by creating a large group of cheap potentially fighters. 4 Although within-group inequality is not the same as social immobility, they both facilitate mobilization.
While the first three mechanisms pertain to how the prospect of relative mobility affects instability, the fourth mechanism operates through an individual’s personal experience of mobility. The previous literature has found that individuals who experienced mobility—either upward or downward—tend to espouse conservative political ideologies and to be more supportive of the political and socioeconomic systems in place (Clifford and Heath 1993; De Graaf, Nieuwbeerta, and Heath 1995; Lipset and Bendix 1959). 5
On the one hand, individuals who experienced upward mobility tend to identify with the ideology of their new social class and to support the current system that enabled them to move up. On the other hand, those who experienced downward mobility identify more closely with their class of origin than with their new class. Therefore, they tend to be more supportive of the system in place and less likely to voice their discontent than other poor individuals (although they may be more likely to do so than rich individuals who did not experience downward mobility). This argument is consistent with that of Shayo (2009) according to which individuals are more likely to identify with groups that have a high status than with those with a low status.
Countries with high levels of relative mobility—that is, countries in which many individuals move up and down—should thus tend to be more stable because a smaller proportion of their population will be willing to support antiregime movements. Those who experienced upward mobility will be less likely to want to change the status quo than other individuals, meaning that they would not be more likely to take part in rebellious activities than those who have always been rich. At the same time, individuals who were initially rich but who experience downward mobility will be less likely to support destabilizing movements than other members of the lower class who were poor at the origin and destination, because they retain prosystem values. Since relative mobility does not change the number of individuals in each social class—only the identity of those individuals—relative mobility should reduce instability.
Combining these four arguments suggests that countries with more relative mobility should be less likely to experience diverse forms of instability, such as riots, revolutions, and civil wars. This article thus follows the recent literature that looks at different forms of conflict simultaneously rather than in isolation (e.g., Bodea, Elbadawi, and Houle 2017). The different types of conflict I consider can be grouped into three categories: small-scale conflicts (e.g., riots and demonstrations), medium-scale conflicts (e.g., revolutions and guerillas), and large-scale conflicts (civil wars). Small-scale conflicts require the least organization and are often (albeit not always) spontaneous, while large-scale conflicts are highly organized and necessitate the sustained mobilization of a large number of fighters. Medium-scale conflicts lie in the middle.
I argue that immobility should foster all three types of conflict. However, the relative importance of each mechanism should vary depending on the type of conflict. The third mechanism, which is about the effect of mobility on opportunities for conflict, should be especially relevant to forms of conflict that require large-scale organization and mobilization. It is only if the conflict involves prolonged fighting that the cost of recruits is relevant. Similarly, the second mechanism is more pertinent to medium- and large-scale conflicts, most notably revolutions, that have the potential to transform the class structure of the society and that involve the downfall of the regime. The mechanism about grievances, for its part, is more relevant to forms of instability that require little organization and that are often spontaneous, although, of course, grievances can also play a role in larger conflicts. The fourth mechanism should apply regardless of the level of organization of the conflict. Individuals with prosystem values should be less likely to engage in any form of rebellious activity.
Relatedly, civil wars—because they require extensive organization and mobilization—are often fought by groups that already possess dense networks, such as ethnic groups. 6 This is particularly relevant, given that the previous literature finds that class conflicts can be driven by ethnic divisions (see Esteban and Ray 2008, 2011, 2012). Section 4 of the Online Appendix addresses this issue by conducting an ethnic group-level analysis. It shows that ethnic groups with low levels of upward mobility are more likely to instigate ethnic wars.
There are three other issues that need to be discussed. First, the effect of relative mobility may depend on a country’s level of economic development and/or current growth rate. For example, the inability of individuals to climb the social ranking may not create as much grievances if their absolute economic status is improving. However, one could also argue that the lack of mobility among a given group may generate even more grievances if the country as a whole is experiencing growth. The Online Appendix directly tests these possibilities and finds little evidence that the effect of mobility is contingent on economic development or growth (Section 2 of the Online Appendix).
Second, and relatedly, it is possible that inequality in mobility across groups, rather than the lack of mobility per se, generates unrest. This is particularly true for the grievances mechanism, since members of a given group, such as an ethnic group or a social class, may feel that their failure to climb the social ladder is more unjust if other groups are able to do so. This argument is tested in Section 5 of the Online Appendix. I conduct two types of tests: the first shows that countries are more unstable when the lower class experiences less upward mobility than other social classes and the second demonstrates that ethnic groups whose level of upward mobility is lower than that of other ethnic groups of the same country are more likely to wage wars. These two tests thus capture inequality in mobility across social classes and ethnic groups, respectively.
Third, social immobility may have different effects depending on who it affects. On the one hand, it could have more influence when it harms the rich than the poor, notably because the former can more easily solve their collective action problem. On the other hand, social immobility could generate more grievances when it harms the lower classes. Moreover, the bulk of the fighting forces in most civil conflicts are usually members of the poorest classes. This suggests that the lack of mobility among the poor could create more opportunities for violence, because it decreases the opportunity cost of potential fighters. This question is addressed in the Online Appendix (section 3). I find that the lack of upward mobility is most harmful when it hurts the lower classes. Among the upper classes, it is actually the lack of downward mobility—and thus the lack of upward mobility among the other social classes—that generates instability.
Data and Testing Strategy
The unit-of-analysis is the country-year and the main sample covers around 4,200 observations on 102 countries between 1960 and 2007. This is a substantial improvement over previous data sets that cover a maximum of about 25 countries, most of which are from the developed world. The focus on the country level can be justified by the fact that in three of the four mechanisms proposed above, it is the prospect of mobility—rather than whether an individual has personally experienced mobility—that affects instability. An individual may be less likely to oppose the established order if she or he believes she or he has a chance of climbing the social ladder, even if she or he has yet to move up. The argument is thus best captured by an analysis looking at how a society’s overall level of social mobility affects its likelihood of experiencing instability. Summary statistics for all variables are available in Online Appendix Table A22.
Dependent Variables and Testing Strategy
I estimate the effect of mobility on seven forms of political instability. First, I employ six indicators taken from Banks’s (2014) data: riots, antigovernment demonstrations, general strikes, revolutions, guerilla warfare, and political assassinations. 7 Riots, demonstration, and strikes are relatively small forms of opposition—although they can have important implications—and necessitate less organization than the other forms of opposition considered. Guerrillas and revolutions are middle-scale conflicts and often necessitate some organization (albeit not as much as civil wars). Assassinations are also relevant because they typically indicate opposition to the system or leadership in place. They are more difficult to classify in terms of their level of organization since they can be carried out by isolated individuals or by organized groups.
These variables indicate the number of riots, demonstrations, and so on, that a country has endured within a given year. The models employing these six dependent variables are estimated using negative binomial models. I also run models in which the dependent variables are six binary variables that take the value 1 if a country had at least one riot, strike, demonstration, revolution, guerilla, and assassination in a given year (Online Appendix Table A33). These estimations employ probit models.
Second, I estimate the effect of social mobility on civil war onset. I employ the measure of the UCDP/PRIO Version 4-2009 (Gleditsch et al. 2002), which defines conflict as “a contested incompatibility that concerns government and/or territory where the use of armed force between two parties, of which at least one is the government of a state, results in at least 25 battle-related deaths” (UCDP/PRIO Codebook, 1). Powell and Thyne (2011) report that thirty-eight of the armed conflicts included in the UCDP/PRIO data set are actually bloody coups. Since coups are different than civil wars, I purged the data set from the coups identified by Powell and Thyne (2011). This dependent variable is binary, and thus the models employ probit models. I also use four additional measures of civil conflicts as robustness tests (Online Appendix Table A27).
Independent Variable
I computed the measure of relative social mobility using four surveys: the ISSP (1999, 2009), the Afrobarometer (round 2), the Latinobarometer, and the DHS. Online Appendix Table A1 lists the surveys/years available for each country, and Online Appendix Table A2 ranks all countries from the one that has the highest to the lowest mobility levels. Online Appendix Figure A1 shows the distribution of the social mobility indicator.
The observations constructed using the ISSP, Afrobarometer, and Latinobarometer are based on two questions: one that asks the wealth of the respondents at the origin (e.g., the wealth of their parents during the respondents’ childhood) and the other at the destination. At both points in time, the respondents are asked to place themselves (or their parents) on a 1–10 (or 0–10) scale, where 1 (0) is the poorest and 10 is the richest. The exact questions differ somewhat across surveys and are listed in Online Appendix Table A3. Since the ability of women to join the labor market varies across countries, I follow common practices and only include male respondents (Andrews and Leigh 2009).
One potential limitation with using these questions is that they depend on the perception of respondents rather than their actual income/wealth. Unfortunately, detailed information on the income/wealth of adult sons and their parents—or of the former, say, ten years ago—is simply not available for a wide range of countries. However, several studies show that the perceived level of mobility has more influence than its actual level (Kelly and Kelly 2009; Lipset and Bendix 1959). For example, immobility can only create grievances among the poor if they perceive mobility as being low.
In order to construct an indicator of relative mobility (rather than absolute mobility), I group all observations at the origin and at the destination in five quintiles. For each country/survey/year, I classify all the observations at the origin in five groups (from the poorest to the richest) containing the same number of observations and do the same for the observations at the destination.
My approach is illustrated in Table 1, which shows 5 × 5 mobility matrixes for two fictional countries. Both countries have twenty-five citizens, which are divided into quintiles (of five citizens each) at the origin and at the destination. Cells on the diagonal show individuals for which the quintiles at the origin and at the destination are the same. For example, in country A, four of the five individuals who were in the poorest quintile at the origin remain in the poorest quintile at the destination. Individuals off the diagonal are those who have experienced mobility (either upward or downward).
Examples of Social Mobility Matrices.
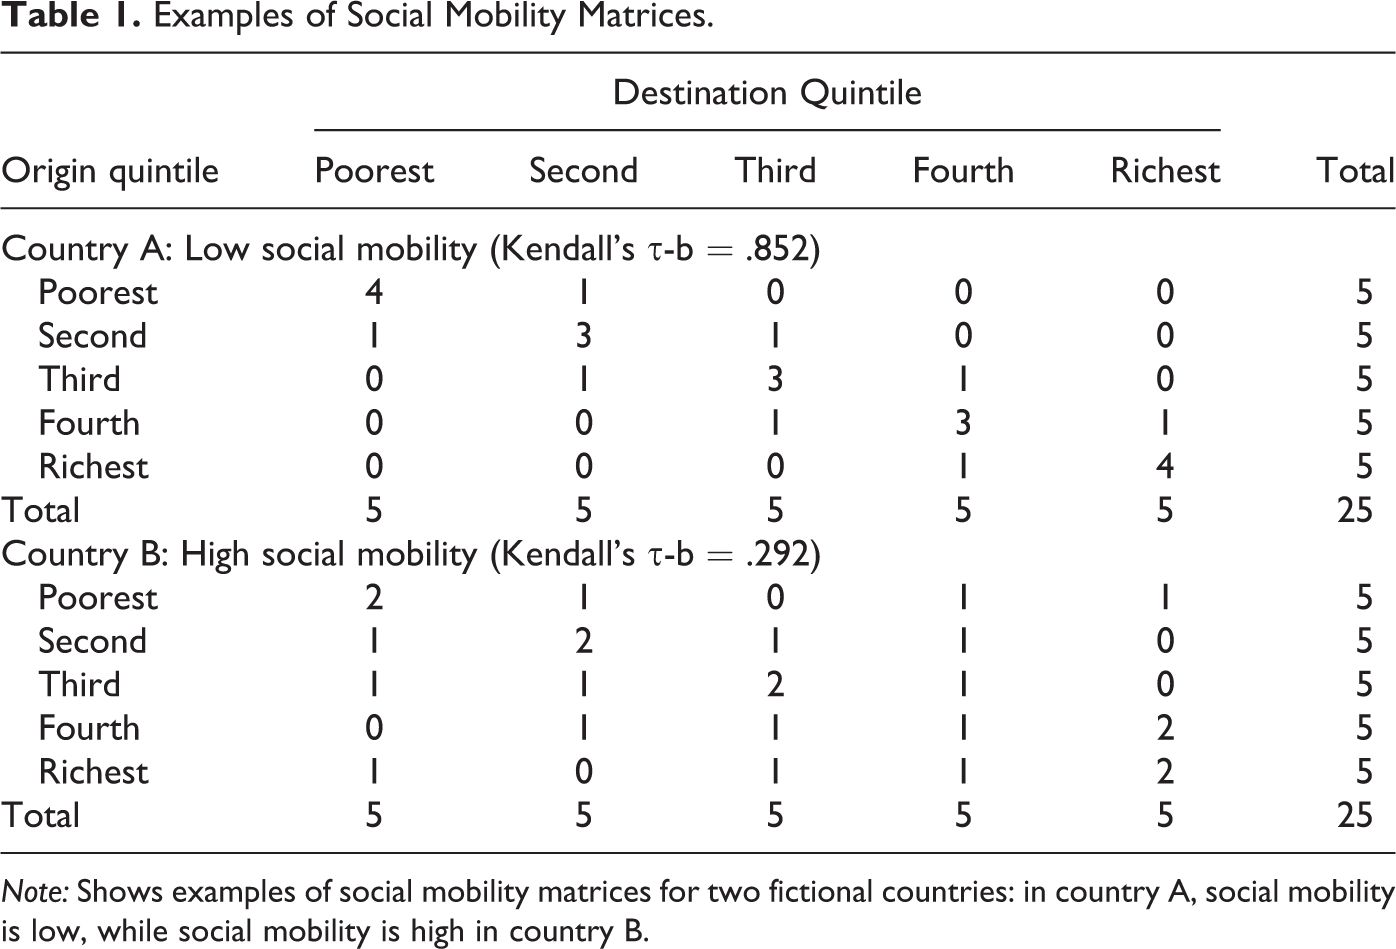
Note: Shows examples of social mobility matrices for two fictional countries: in country A, social mobility is low, while social mobility is high in country B.
The measure indicates the extent to which the rank at the destination can be predicted by the rank at the origin. To do so, I use Kendall’s τ-b, which measures the correlation between rankings. More formally, let xi be the ranking of respondent i at the origin and yi at the destination. Let (x1, y1), (x2, y2), …, (xn, yn) be all origin/destination observations in the country/survey/year. Any pair of observations (xi, yi) and (xj, yj), where i ≠ j, is said to be discordant if xi > xj and yi < yj or if xi < xj and yi > yj. In other words, a pair is discordant if while respondent i was richer (poorer) than respondent j at the origin, respondent i became poorer (richer) than respondent j at the destination. Any pair of observations (xi, yi) and (xj, yj), where i ≠ j, is concordant if xi > xj and yi > yj or if xi < xj and yi < yj. Concordant pairs are those for which the ranking did not change.
Kendall’s τ-b is calculated as follow:

where nc
is the number of concordant pairs, nd
the number of discordant pairs,
Kendall’s τ-b ranges from −1 to 1, where −1 indicates that, for each pair, the respondent who was in the lowest quintile at the origin attained a higher quintile than the other respondent at the destination (i.e., all pairs are discordant). This implies perfect mobility. A score of 1 indicates that the ranks remained unchanged for all pairs (i.e., all pairs are concordant). A score of 0 means that there is no association between origin and destination. In the data, all observations are above 0, meaning that having a higher rank at the origin always increases the rank at the destination. Therefore, in order to have a measure of mobility (rather than immobility), I compute social mobility as 1 minus the Kendall’s τ-b.
In Table 1, country B has a higher level of social mobility than country A. In country A, a larger proportion of individuals remained in the same quintile at the origin and destination. Moreover, those who did experience upward or downward mobility did not move by as many quintiles as in country B. In country B, individuals who originate from high quintiles are still likely to find themselves in higher quintiles at the destination, but their advantage is not as marked as in country A. The Kendall’s τ-b of country A is .852, which is similar to that of Nicaragua and El Salvador in the data, while that of country B is .292, which is close to that of Estonia (see Online Appendix Table A2 for a ranking). The mobility score of country A is .148 (1 − .852) and that of country B is .708 (1 − .292).
Unfortunately, the DHS does not ask the same questions as the other surveys. However, it asks questions about the years of education of different members of the households. Using this information, I assess the degree to which the level of education of the father (origin) is related to that of his son(s) (destination). Of course, education is not a perfect indicator of income/wealth. However, a large number of studies demonstrate that education attainment is one of the main vehicles of social mobility (Jerrim and Macmilliam 2015). Therefore, education years among adolescents and young adults are a good proxy for whether they will experience mobility during adulthood. Clearly, using education as a proxy would not be appropriate in rich countries in which children have to attend school until a certain age. However, the countries that are covered by the DHS are usually poor and have a substantial number of respondents who have never attended school, typically around 15–20 percent.
For each country/year, I group all fathers in five quintiles (from the least to most education years). However, now instead of grouping all sons in the same set of quintiles, I create a different set of quintiles for each age between fourteen and twenty-four years; resulting in eleven sets of age-specific quintiles. For example, I classify all sons who have fourteen years old in five quintiles, then all fifteen years old in five different quintiles, and so on. Sons are only ranked against other boys of the exact same age. We could not compare the education attainment of children of, say, fourteen and twenty years old. Next, I calculate a separate Kendall’s τ-b for each age-group between fourteen and twenty-four years old. This gives me eleven age-specific Kendall τ-b scores for each country/year (i.e., one for each age-group between fourteen and twenty-four years old).
I combine all the age-specific Kendall’s τ-b scores into a single indicator for each country/year. I do so by calculating the weighted average of all age-specific Kendall’s τ-b, where the weights are determined by the number of respondents in each age group:
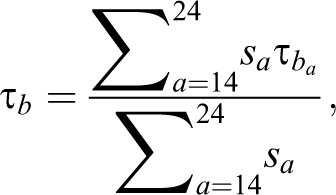
where a refers to the age-group (fourteen to twenty-four), sa
to the number of respondent with age a, and
For countries for which data are available from the ISSP, Afrobarometer, and/or Latinobarometer, I do not use the observations from the DHS, even if they are available (however, I do use them to standardize the observations across surveys, see below). I only rely on the observations of the DHS when no other survey is available. There are sixty-nine countries for which ISSP, Afrobarometer, and/or Latinobarometer surveys are available. The correlation between the measures constructed from the DHS and Afrobarometer/Latinobarometer/ISSP is .31 (p value < .0001). I standardize the observations from the DHS using linear regressions. I do so by taking advantage of the fact that many countries are covered by both groups of surveys. 8 As discussed below, I also redo the analysis without observations taken from the DHS (Online Appendix Table A23).
One potential problem with using Kendall’s τ-b is that it does not enable us to distinguish between the effects of upward and downward mobility. It measures social mobility by subtracting discordant pairs from concordant pairs, and each discordant pair includes an individual who moved up and one who moved down. However, distinguishing between upward and downward mobility is difficult whenever one focuses on relative mobility. In order for an individual to climb the social ranking (upward mobility), another individual has to go down in the ranking (downward mobility). Therefore, upward (relative) mobility implies downward (relative) mobility.
However, the empirical results do suggest that what is important is the lack of upward mobility rather than downward mobility. If downward mobility were causing instability, we would expect countries with low levels of relative mobility—and thus low levels of upward and downward mobility—to be most stable. But, I find the opposite.
Section 3 of the Online Appendix looks at the effects of upward (relative) mobility among the lower quintile and downward (relative) mobility among the upper quintile separately. Online Appendix Table A16 redoes the analysis with a variable that captures the proportion of individuals who were in the first (and poorest) quintile at the origin who remain in the first quintile at the destination. A high value indicates that few very poor individuals experience upward mobility. I find that the lack of upward mobility generates instability (although the relationship does not attain significance for riots).
Online Appendix Table A17 employs a similar variable which gives the proportion of respondents who were in the richest quintile (the fifth) at the origin who remain in this quintile at the destination. A high value indicates that the richest individuals do not experience downward mobility and that those who are poorer (quintiles 1–4) do not reach the top quintile. Perhaps surprisingly, I find that a high degree of downward mobility among the rich reduces instability. This suggests that unrest is generated not by downward mobility at the top but by the lack of upward mobility among the other quintiles. This finding is consistent with the fourth mechanism discussed above, which suggests that downward mobility among the very rich may not necessarily foster unrest. Instead, it is the lack of upward mobility that drives the results.
In order to make sure that my results are not driven by the use of Kendall’s τ-b, I also redo the analysis using four additional measures. First, I use Somers’s D, which is very similar to Kendall’s τ-b. Second, as explained above, one argument against using Kendall’s τ-b is that it subtracts discordant pairs. Therefore, I redo the analysis with a simpler measure that gives the proportion of pairs that are concordant pairs (i.e., the total number of concordant pairs divided by the total number of pairs). One limitation with this indicator is that it treats discordant and tied pairs exactly the same way and thus overestimates mobility in countries with many tied pairs.
The next two measures are constructed using the original 1–10 (0–10) scores or education years rather than quintiles and do not subtract discordant pairs from concordant pairs. The first measure gives the Pearson correlation between the scores/education years at the origin and destination. This approach is used by many authors (e.g., Beller and Hout 2006; D’Agostino and Dardanoni 2009). The last measure is the elasticity, which is also employed by many authors (e.g., Corak 2013). It is calculated by running an ordinary least squares (OLS) regression in which the dependent variable is the score/education year at the destination and the independent variable is the score/education year at the origin. The coefficient on the independent variable is the elasticity. Variables are recoded such that higher values indicate more mobility. The correlation between the Kendall’s τ-b and the other measures is very high: Somers’s D (.93), proportion of concordant pairs (.78), Pearson correlation (.93), and elasticity (.77). Results are largely unchanged, regardless of the measure employed (Online Appendix Tables A4–A7; see section 1 of the Online Appendix for more detail).
Perhaps the main limitation with my data set is the lack of survey data for each country in every year (see Online Appendix Table A1). Each country has been surveyed only a few times over the sample years (sometimes only once) and I use linear interpolation for years between surveys. For years before (or after) the first (last) survey, I use the survey that is closest in time. This creates two potential problems. First, it is possible that mobility varies substantially within countries over time. If that were the case, using a small number of observations to infer missing observations could be problematic, which would imply that the observations that are available would not capture the level of mobility in other years. Second, and relatedly, since many of the observations on which I rely have been collected after the unstable event, it is possible that the latter affects mobility instead of the reverse. In other words, the results could be driven by reverse causation. For example, the losing side during a conflict may see its chances of mobility decrease. Moreover, the lack of instability itself can reduce mobility (Olson 1982). A successful guerilla or revolution, for instance, can create opportunities for mobility.
While these are important limitations, I do not believe that they drive my results. For one thing, relative mobility—unlike absolute mobility—is known to be highly sticky within countries over time (e.g., Beller and Hout 2006; Erikson and Goldthorpe 1992; Kelly and Kelly 2009). 9 In fact, one of the most important findings of Erikson and Goldthorpe’s 1992 book The Constant Flux: A Study of Social Mobility in Industrial Society is that relative mobility is nearly constant within countries over time. Chetty et al. (2014) also point out that mobility has been essentially constant in the United States over the last forty years despite the drastic increase in inequality during the same period. Similarly, Beller and Hout (2006) find that there has been little variation in mobility in the United States since the 1940s. There is indeed little variation in social mobility within countries over time in my data set. Therefore, the assumption that we can use the available observations to fill in missing values is plausible. Moreover, results are unlikely to be caused by reverse causation since there is little change in relative mobility at least in the short and medium run. Relatedly, Olson’s (1982) argument suggests that instability usually increases mobility. But, I find a negative association between mobility and instability, meaning that the bias, if any, would bias my results downward.
I also run a series of additional tests to make sure that my results are not driven by these problems. First, in Online Appendix Table A10, I redo the analysis while excluding all observations for which I do not have a survey in the next or last five years. Basically, I create eleven-year windows around each survey observations. For example, I have only one survey observation for Botswana collected in 2002 (from the Afrobarometer). Therefore, instead of using that observation for all years on Botswana, I only use it from 1997 to 2007. The observations on Botswana between 1960 and 1996 are omitted. Second, since the first surveys were conducted in 1990, Online Appendix Table A11 redoes the analysis for the period 1990–2007.
Third, I rerun the analysis with only observations that follow the first survey for each country (Online Appendix Table A12). For example, I only keep the observations from 2001 to 2007 for Argentina since the first survey on Argentina was conducted in 2000. On balance, results are robust across the three tests, although those on civil wars are often insignificant. This is likely driven by the large proportion of missing values in these tests (between 58 percent and 78 percent of the sample). The reduction in the sample size is more problematic when testing the likelihood of rare events, such as civil wars. Furthermore, I redo the analysis using variables that are associated with social mobility (see section 1 of the Online Appendix for more detail).
It must be noted that many authors who rely on these surveys to construct related indicators use similar methods to handle missing values. For example, Selway (2011) uses some of these surveys to construct a measure of cross-cuttingness that indicates the extent to which different cleavages, such as ethnicity and inequality, crosscut each other. He averages all survey observations for each country and assumes that a country’s cross-cuttingness is constant between 1945 and 1999. Houle (2015) employs these surveys to construct measures of ethnic inequality and uses the same method as me to infer missing values. Although the method I employ is highly imperfect, I believe it is the best that could be done, given the data available, and it is consistent with common practices. The fact that most results, with the exception of those on civil wars, survive the multiple robustness tests described above is encouraging.
Control Variables
Since countries that have experienced instability in the recent past are more likely to be unstable, all models except the ones on civil war include lagged dependent variables (although results are unchanged if they are omitted; Online Appendix Table A26). The models on war include a dummy variable for whether there is an ongoing war as well as the time since the last war along with cubic splines.
Social mobility and inequality are distinct but related concepts. There is a negative association between inequality and mobility (Jerrin and Macmillian 2015). Moreover, inequality fuels riots, revolutions, assassinations, guerillas, demonstrations, and strikes (e.g., Alesina and Perotti 1996; Roe and Siegel 2011), although the evidence on civil war is more mixed. 10 Therefore, I control for the Gini coefficient (Solt [2009] 2014). 11
I include controls that are usually employed in models on instability and civil war and that could be related to mobility: gross domestic product (GDP) per capita in purchasing power parity dollars logged (Treisman 2015), growth in GDP per capita over the last two years, ethnic fractionalization (Przeworski et al. 2000), population logged (World Development Indicator, World Bank), and dummy variables for the cold war period, military regimes (Banks 2014), and Western countries (Western Europe, Canada, the United States, New Zealand, and Australia). Since partial regimes have been found to be more unstable, I add the Polity score and its square.
Following Colgan (2015), the models on civil war include a dummy variable for whether a country produces at least US$100 per capita in a given year (coded from Ross 2012). 12 Results are unchanged if I instead use oil income logged from Ross (2012; available upon request).
Empirical Results
Main Results
Table 2 reports my main analysis. Models 1–6 estimate the effect of social mobility on the number of riots, demonstrations, strikes, revolutions, guerillas, and assassinations, respectively. In all instances, countries with higher levels of mobility tend to experience less political instability, and the relationship is statistically significant at the 1 percent level.
Effect of Social Mobility of Political Instability and Civil War.
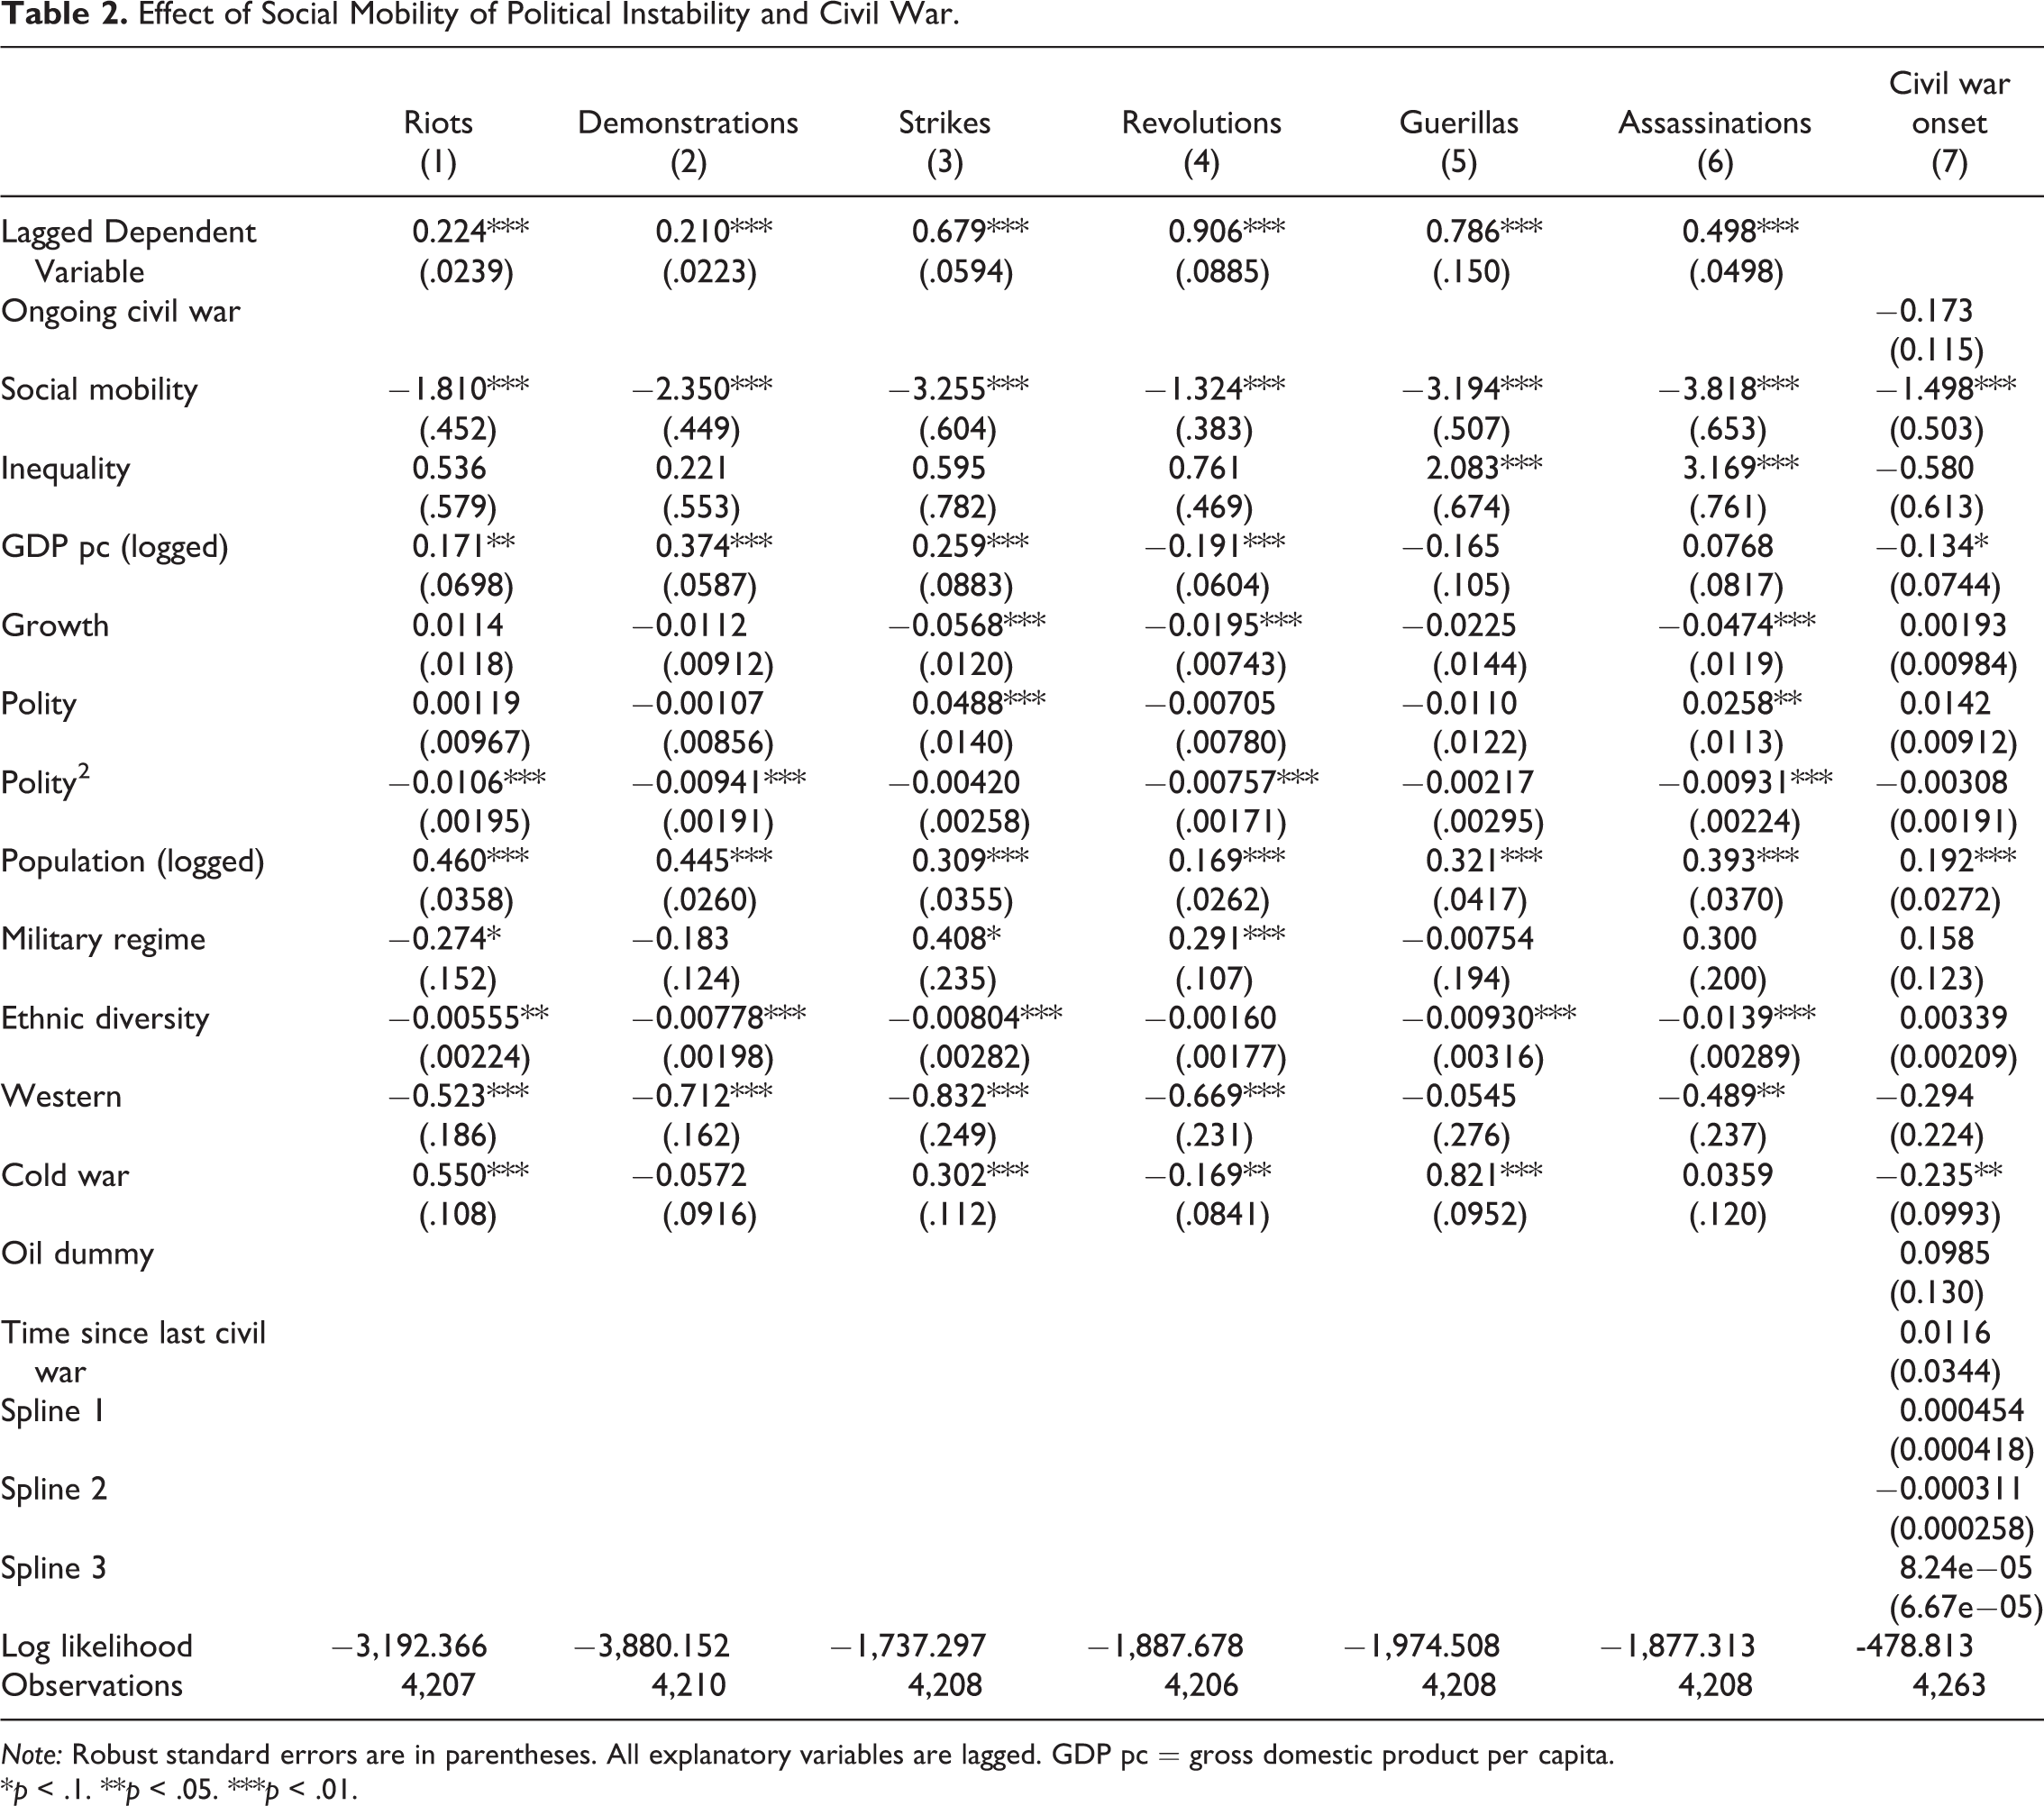
Note: Robust standard errors are in parentheses. All explanatory variables are lagged. GDP pc = gross domestic product per capita.
*p < .1. **p < .05. ***p < .01.
Figure 1 shows the effect of mobility on the predicted number of riots, demonstrations, strikes, guerillas, revolutions, and assassinations in a given year. In all panels, mobility decreases unrest. For example, a country with a mobility level of .2 (e.g., Nicaragua or El Salvador) is expected to experience .461 strikes in a given year. The same country would be expected to experience only .04 strikes if its mobility score were .95 instead (e.g., Latvia or Czech Republic). Crucially, in these scenarios, the two countries experienced the same number of riots in the previous year (i.e., I control for the lagged dependent variable).
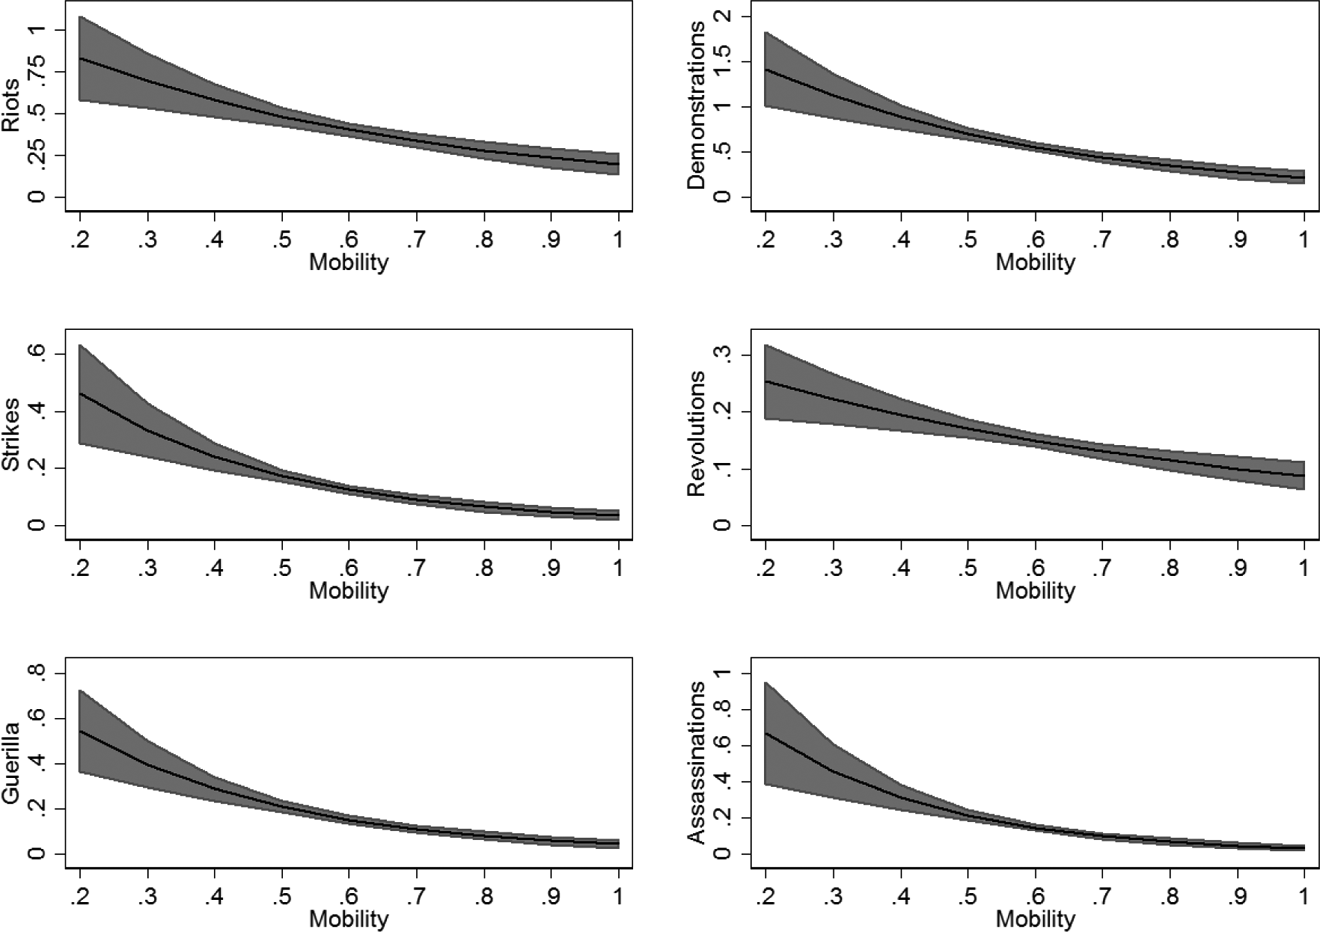
Effect of social mobility on political instability. Shaded areas represent 90 percent confidence intervals. Shows the effect of mobility on the predicted number of riots, demonstrations, strikes, revolutions, guerillas, and assassinations in a given year.
Model 7 estimates the effect of social mobility on civil war onset. As predicted, mobility decreases the likelihood of civil war. Figure 2 shows the effect of mobility on the predicted probability of a war. A country with a mobility level of .2 has a probability of experiencing a war of 8.31 percent per year, while one with a mobility level of .95 has a probability of only 0.8 percent.

Effect of social mobility on the predicted probability of civil war onset. Shaded area represents 90 percent confidence intervals.
Model 7 employs the measure of civil conflict of the PRIO. In Online Appendix Table A24, I show that the results hold when I use alternative measures. Model 1 uses the measure of the Correlates of War (COW) and model 2 the one of the Political Instability Task Force (PITF; Marshall, Gurr, and Harff 2014). 13 Model 3 also uses the data of the PITF but only includes wars that are classified as “revolutionary wars” (as opposed to “ethnic wars”). Mobility, like inequality, may be more directly related to class-based conflicts than to ethnic- or religious-based conflicts (Bartusevičius 2014; Besançon 2005). Finally, model 4 uses Bartusevičius’s (2014) measure of popular rebellions. In all instances, mobility has a negative and statistically significant effect (although in model 2, it is only significant at the 10 percent level).
In Online Appendix Table A23, I redo the analysis with only the observations taken from the ISSP, Afrobarometer, and Latinobarometer (i.e., I omit those from the DHS). The effect of social mobility on civil war remains negative but falls out of statistical significance. However, the sample size drops by about 33 percent. More importantly, the DHS covers the countries that turn out to be the most likely to experience civil wars in the data set, since they tend to be poorer than those covered by other surveys. While the likelihood of a war is 5.26 percent per year in countries that are only covered by the DHS, it is only 1.61 percent in those that are covered by other surveys. Therefore, the difference in the findings on civil wars may be driven by the small sample size. Crucially, however, the results on the six other forms of political instability are robust.
Finally, section 4 of the Online Appendix provides an ethnic group-level analysis. I identify the ethnic group of the respondents using the ethnic group questions available in the four surveys I employ. I then match the ethnic groups of the respondents to those identified in the Ethnic Power Relations (EPR) data set (Cederman, Wimmer, and Min 2010). The independent variable gives the proportion of members of an ethnic group that are in the poorest quintiles at the origin that remain in the poorest quintile at the destination. 14 The dependent variable takes the value 1 if an ethnic group has initiated an ethnic civil war during a given year (data from the EPR). Nonethnic civil wars are not included in the data. The sample covers 164 ethnic groups from fifty-one countries.
I find that ethnic groups that experience little upward mobility are more likely to wage wars (see Online Appendix Table A18). Section 5 of the Online Appendix further develops this analysis and demonstrates that inequality in social mobility levels across ethnic groups of the same country also fosters civil war (Online Appendix Table A21). These findings are important, given that wars are often fought by ethnic groups.
The results on the control variables are generally consistent with those of previous authors. One notable difference, however, is that while, like me, most (but not all) of them do not find that inequality affects civil wars, they find that it fuels other forms of political instability, such as demonstrations or riots (Alesina and Perotti 1996; Roe and Siegel 2011). In Table 2, inequality only increases the likelihood of guerrillas and revolutions. The difference between my findings and those of previous authors is due to the inclusion of social mobility. When I omit social mobility from the regressions, I find that inequality fosters riots, demonstrations, strikes, guerillas, revolutions, and assassinations, although it still has no effect on civil wars (Online Appendix Table A27). This raises the possibility that a large fraction of the destabilizing effect usually attributed to inequality may actually be driven by the lack of mobility.
Robustness Tests
The Online Appendix presents additional robustness tests. First, as shown in Online Appendix Table A3, a large portion of the countries with low mobility are from Latin America, while those with high mobility are often from Eastern Europe. Relatedly, it is important to make sure that the results are not exclusively driven by rich Western democracies. Online Appendix Tables A28–A30 redo the analysis without Latin American countries, Eastern European countries, and Western countries, respectively. Results are unaltered.
To make sure that the results are not driven by outliers, Online Appendix Tables A8 and A9 redo the analysis without observations with social mobility values below the fifth percentile and above the ninety-fifth percentile of the distribution, respectively. Online Appendix Table A25 demonstrates that the results are robust to the inclusion of additional control variables: trade openness (exports plus imports divided by GDP; World Development Indicator, World Bank), proportion of the population that is Muslim (Przeworski et al. 2000), proportion of territory that is mountainous (EPR), and military expenditure per capita logged and military personal per capita logged (COW). Online Appendix Table A34 uses the X-Polity score of Vreeland (2008) rather than the regular Polity score.
The main analysis employs a large number of control variables. Online Appendix Table A35 shows that the results are unchanged when I only control for the lagged dependent variables, inequality, GDP per capita (logged), and the Polity score (and its square). Online Appendix Tables A31 and A32 use capital shares (Houle 2016) and the share income of the top 1 percent (Solt [2009] 2014), respectively, rather than Gini coefficients.
Furthermore, I examine whether my results are affected by multicollinearity between social mobility and inequality. The correlation between the two variables is −.15. To determine whether there is a multicollinearity problem, I rerun model 1 using OLS and calculate the variance inflation factor (VIF) of all variables included in the model. No variable has a VIF above 10, which is the threshold usually employed to detect multicollinearity. The VIFs of social mobility and inequality are 1.32 and 1.86, respectively.
Conclusion
This article argues that social immobility increases the likelihood that a country experiences unrest. Using a new data set on relative mobility covering 102 countries worldwide, I provide the first large-N cross-national test of the effect of mobility on political unrest. I find that countries with low levels of mobility are indeed more likely to experience riots, strikes, demonstrations, political assassinations, guerillas, and revolutions. The findings are robust to multiple sensitivity tests. Moreover, I find that mobility reduces the likelihood of civil war, although the results are not as robust as with other forms of political instability.
These findings point to the importance of distinguishing between the political implications of social mobility and inequality. While there is a large literature looking at the effect of economic inequality on democracy, corruption, party identification, and turnout, among other subjects, few authors have looked at the political consequences of social immobility. 15 Yet, as shown in this study, mobility may have important implications, even when one controls for inequality. In fact, my findings suggest that a large portion of the effect of inequality on instability may actually be driven by social mobility.
Most of the studies that do exist focus on how personally experiences with mobility affect an individual’s political preferences and attitudes (e.g., Abramson 1973; Clifford and Heath 1993; Turner 1992). Yet, this article has demonstrated that a society’s overall level of social mobility—which affects one’s prospect of mobility—also has important implications. Studying the implications of social mobility—both at the individual and society levels—on other political phenomena, such as the emergence and consolidation of democracy, is a promising avenue for future research.
Supplemental Material
Supplemental Material, SuppMat - Social Mobility and Political Instability
Supplemental Material, SuppMat for Social Mobility and Political Instability by Christian Houle in Journal of Conflict Resolution
Footnotes
Acknowledgment
The author would like to thank Fangjin Ye for excellent research assistantship.
Declaration of Conflicting Interests
The author declared no potential conflicts of interest with respect to the research, authorship, and/or publication of this article.
Funding
The author received no financial support for the research, authorship, and/or publication of this article.
Supplemental Material
Supplemental material for this article is available online.
Notes
References
Supplementary Material
Please find the following supplemental material available below.
For Open Access articles published under a Creative Commons License, all supplemental material carries the same license as the article it is associated with.
For non-Open Access articles published, all supplemental material carries a non-exclusive license, and permission requests for re-use of supplemental material or any part of supplemental material shall be sent directly to the copyright owner as specified in the copyright notice associated with the article.