
Abstract
Cultural differences and similarities can be documented not only at the level of the psyche (people’s motivations, beliefs, emotions, or cognitions) but also via shared, tangible representations of culture (such as advertising, texts, architecture, and so on). In this report, the authors present the results of some exploratory meta-analyses of cultural products. Data were sufficient to analyze a variety of cultural traits: positivity, modernity, high (vs. low) context, uncertainty avoidance, and power distance, as well as other dimensions. Thus, this article documents cultural products that measured traits other than individualism-collectivism, the trait the authors analyzed in an earlier article. The data reinforce the value of studying cultural products and fit with recent calls to branch out from the familiar, individualism-collectivism construct into new axes of cultural difference.
The field of cultural psychology was founded on the premise that “culture and psyche make each other up” (Shweder, 1989, p. 73). In other words, people are shaped by participating in the meanings, opportunities, and norms of specific cultural contexts, and in turn, these culturally shaped people reinforce, recreate, and maintain those cultural contexts. Because cultural psychology is the study of both person-shaped cultural contexts and culturally shaped persons, the field should include measures of cultural difference at both of these levels.
Despite this foundational premise, psychologists have traditionally documented cultural phenomena primarily at the level of the individual. Most simply, they might compare cultural groups on their responses to self-reported attitude measures such as individualism/collectivism (e.g., Triandis, 1995). Or they might test differences in cognition, emotion, and behavior in samples of individuals from two different cultural contexts.
Recently, Morling and Lamoreaux (2008) reported a meta-analysis of 51 studies taken from psychology, communication, and business literatures, all of which had studied cultural differences in cultural products. Cultural products were defined as tangible, shared representations of culture, including advertising, television, texts, laws, public behavior norms, internet content, and language. Cultural products are therefore one manifestation of the person-shaped culture. In that initial report, Morling and Lamoreaux focused on cultural products studies that had coded levels of individualism and collectivism. For example, a study might have coded for individualism themes in television advertising from Korea and the United States. In the 22 studies that compared North American cultural products to those from East Asia, Morling and Lamoreaux found that North American cultural products were more individualistic (average g = 0.73) and less collectivistic than those from East Asia (average g = −0.69).
One goal of Morling and Lamoreaux’s original report was to illustrate the use of cultural products in cross-cultural studies and to encourage other researchers to use these methods. A second goal was to compare effect sizes from cultural products to those from self-report, “psyche-level” studies of individualism and collectivism. By using a published meta-analysis of self-report measures as a point of comparison, Morling and Lamoreaux reported that cultural products differences were significantly larger than effect sizes of self-report attitude measures of both individualism and collectivism (Oyserman, Coon, & Kemmelmeier, 2002). Morling and Lamoreaux concluded that cultural products are a viable way of measuring cultural difference and form an important complement to psyche-level measures of culture.
In the current article, we present cultural product data on a number of additional variables other than individualism-collectivism. How have cultural products been used to study cultural differences in variables such as power distance, masculinity and femininity, high versus low context, or other dimensions?
Why Study Cultural Products
We believe that the study of cultural products provides a strong empirical complement to the study of cultural difference and cultural dynamics. Most importantly, cultural psychology is presumably the study of both person and context; it makes sense to study manifestations of culture both “inside” and “outside” the head (Adams & Markus, 2004; Shweder, 1989). Second, although cultural products measures may be susceptible to their own coding biases, they are not susceptible to self-report biases such as reference group effects (Heine, Lehman, Peng, & Greenholtz, 2002), deprivation effects (Peng, Nisbett, & Wong, 1997), or other self-report biases (Schimmack, Oishi, & Diener, 2005). Such biases uniquely challenge the study of cultural difference through self-report.
A third reason to study cultural products is that they can contribute directly to people’s sense of “cultural consensus,” or “common sense.” Recently, cultural researchers have determined that in significant ways people’s behavior is explained not by cultural differences in people’s internal values, traits, or attitudes but rather by people’s beliefs about what others in their culture value, think, or believe. Beliefs about what cultural others think tend to be different from what cultural others actually think, and yet it is the (sometimes erroneous) belief about what others are thinking that apparently drives behavior (see Fischer et al., 2009; Kuran, 1995; Shteynberg, Gelfand, & Kim, 2009; Wan, Chiu, Tam, Lee, Lau, & Peng, 2007; Zou, Tam, Morris, Lee, Lau, & Chiu, 2009). Where do people develop their conceptions of cultural consensus—of “common sense”? It seems likely that one option is to consult public, tangible, cultural products as a source of information. Therefore, cultural products studies can provide a useful complement to this current research on intersubjective consensus models of culture.
Dynamics of Cultural Products
It is worth considering the extent to which cultural products will influence, and be influenced by, individual people in a culture. We propose that although cultural products will probably reflect, to some extent, the psychologies of members of a cultural group, the correspondence cannot be perfect.
How cultural products are created
We can think of several ways in which cultural products might enter some cultural space. One is through intentional, direct design. For instance, in creating an advertising campaign, copywriters might attempt to craft a message intentionally to connect with some particular population. Such cultural products reflect creators’ ideas about what people in that culture “want”—ideas that undoubtedly reflect “common sense,” or intersubjective consensus. In some cases, elected officials set policies, write laws, and in the United States at least, set school curricula—another example of elites crafting cultural products shared (or at least, presumed to be shared) by most members of a cultural group. The process might be driven by consumers of such messages too: Not all ads, texts, laws, or other cultural products will be equally viable in an open market of products and ideas. Therefore, it may sometimes be the case that only certain messages become popular and widespread (Norenzayan, Atran, Faulkner, & Schaller, 2006; Tsai, Louie, Chen, & Uchida, 2007). These two processes—direct creation by elites and subsequent popularization by “consumers”—are likely to be most applicable to cultural products such as advertising, textbooks, or stories.
For other cultural products that have been studied by psychologists, the dynamics may be different. Visible norms (such as walking speed [Levine & Norenzayan, 1999] or public helpfulness [Levine, Norenzayan, & Philbrick, 2001] or pronoun use [Na & Choi, 2009]) may emerge through collective imitation. For example, people may take their cues from how to walk or whether to pick up some dropped pencils (two variables studied in this research) by copying others. That is, some cultural ideas catch on based on how many others adopt the idea and the status of the adopters (with high-status adopters being more copied; see Cohen, 2001, for complete discussion). In addition, most cultural products emerge in some ecological context (Cohen, 2001). For example, specific employment policies (another cultural product that has been studied) probably develop against a complex set of background influences such as level of economic prosperity, patterns of local tradition, demands of local laws, and level of democracy.
Do cultural products shape people?
The people who create advertising (the most common cultural product studied to date) certainly hope that their cultural products will influence people. But do they? Studies have used cultural products as primes and have shown that they do change people’s cognitions and values in predictable ways (Alter & Kwan, 2009; Miyamoto, Nisbett, & Masuda, 2006; Tsai et al., 2007; see also Oyserman & Lee, 2008). In addition, there is a large literature on media effects on behavior (e.g., Bushman & Huesmann, 2001; Davies, Spencer, Quinn, & Gerhardstein, 2002). But public images and messages do not affect people in simple, direct ways. Most evidence fits with an interaction model—messages influence people, depending on people’s attitudes, values, knowledge, or motivation to elaborate (e.g., Alter & Kwan, 2009; Han & Shavitt, 1994; Roth, 1995; Tai, 2005). Importantly, as people react to a variety of cultural messages, they bring their past experiences and current cognitive strategies to bear as they actively accept, reject, or combine information (Sperber, 1996). The possible result is that there may be more variance among people within a culture on self-report measures of cultural difference than there will be among cultural products.
Because the path of influence from person to cultural product back to person is moderated by potentially many forces, researchers should not expect to see perfect correspondence between cultural products and cultural selves. Although the two are undoubtedly related, the cultural patterns that are detected from a study of cultural products may not give the same results as the cultural patterns that are detected from a study of cultural people. As Rozin (2003) predicted, “the mental differences may also be less substantial than the differences in the environments that the cultures have created. . . . It would perhaps be a good idea for psychologists, culturally oriented or otherwise, to do more analysis of environments” (p. 279). Given this reasoning, it was not particularly surprising in our first report that cultural product effect sizes were different from self-report effect sizes, at least for the dimension of individualism-collectivism.
Dimensions Studied in This Review
The present report is meant to complement our original article by presenting exploratory results from a variety of cultural products studies that coded dimensions other than individualism-collectivism. Although individualism-collectivism is by far the most widely studied, and perhaps most centrally relevant, construct of interest to cultural psychologists, many other dimensions have been of interest to cultural researchers.
Across the 75 studies we analyzed, some of the dimensions (such as power distance or uncertainty avoidance) have a long history in cultural or cross-cultural psychology; other dimensions (such as advertising values) are specific to disciplines such as advertising and marketing. The list of dimensions summarized next represents a wide and variable distribution of cultural traits. The dimensions we report here are atheoretically derived, because they represent a range of traits studied in cross-cultural cultural products research rather than any a priori interest. Therefore, our hypotheses were largely exploratory and our results should be viewed as descriptive.
Hofstede’s other dimensions
Although Geert Hofstede’s (1980) work Culture’s Consequences is best known as one of the earliest articulations of the individualism-collectivism construct, his original book also defined three other cultural axes: power distance, uncertainty avoidance, and masculinity. Hofstede’s four-dimension framework is especially influential among marketing, business, and communication scholars, who have often framed cross-cultural hypotheses using Hofstede’s definitions and data.
Power distance is usually understood as a cultural context’s tolerance for hierarchy. In a high-power distance culture, people in less powerful positions accept, and expect, power to be distributed unequally and tolerate this distribution. For examples of power distance and the other dimensions that have been represented in cultural products studies, see Table 1. Hofstede ranked four of the countries in our analysis: Mexico, Hong Kong, the United States, and Great Britain. On the basis of Hofstede’s rankings, we generally predicted Mexico to have more power distance than Hong Kong, followed by the United States and Great Britain. While we reviewed cultural product studies from Korea, this country has no score on Hofstede’s scale because Hofstede did not study it.
Dimensions Studied in the Meta-Analysis

Uncertainty avoidance is understood as a cultural context’s desire for predictability. In high uncertainty avoidance cultures, people prefer stricter laws, safer environments, and certainty in religious belief. In low uncertainty avoidance cultures, people are more tolerant of ambiguity and multiplicity of answers. See Table 1 for cultural products examples. On the basis of Hofstede’s rankings (for countries for which we found concurrent, cultural product data), we predict the following rankings of countries, from highest uncertainty avoidance to lowest: Japan, Mexico, India, the United States, China, and Hong Kong. Again, while we found cultural product data for Korea, it has no score on Hofstede’s scale.
Masculinity, according to Hofstede’s definition, concerns gender roles, specifically how different male gender roles are from female gender roles. According to Hofstede, females’ gender roles are fairly constant across cultures, so cultures mainly differ on how feminine (that is, how similar to women) their men are allowed to be.
Even though Hofstede has provided a definition of the masculinity dimension, researchers have only haphazardly conformed to the one he gave. For example, the authors of one study considered competition displays in ads to manifest masculinity (Moon & Chan, 2003). However, the simple display of competition—in the absence of the actor’s gender—makes it difficult to cleanly classify this operationalization as Hofstede’s “masculinity.” Instead of using Hofstede’s definition, in which the level of masculinity is dependent on the gender of the person displaying the trait, we adopted a definition that was easier to code. Specifically, we chose to use Bem’s (1974) orthogonal dimensions of masculinity and femininity. In Bem’s scale, masculinity is coded by competition, autonomy, forcefulness, and dominance. The orthogonal dimension, femininity, is coded by nurturance, gentleness, sympathy, and being yielding. When cultural products were coded on these two dimensions, we applied Bem’s labels. Therefore, it is important to note that when we are reporting results on masculinity and femininity, we are using Bem’s definitions of these constructs, not Hofstede’s.
Cross-cultural self-report data on gender roles are rather plentiful, but the results do not lead to simple predictions for cultural products. Some researchers have attempted to validate Bem’s sex role inventory in other cultures, with mixed success (Ravinder, 1987; Sugihara & Katsurada, 1999; Ward & Sethi, 1986). That is, which traits are considered “masculine” or “feminine” apparently vary across cultural contexts. In addition, we could find no descriptive cross-cultural self-report studies on which to base predictions for cultural product levels in masculinity and femininity. Either the studies measured androgyny (a combination of both scales; Maloney, Wilkof, & Dambrot, 1981), studied only one culture (e.g., Kulik, 2006), or used Bem’s dimensions mainly as correlates for other behaviors of primary interest.
Other psychological and cultural traits
In addition to analyzing Hofstede’s three categories, the studies in our set also reflected a diverse array of psychological traits. Examples continue in Table 1, with definitions next.
High context and low context
Hall’s (1976) constructs of high context and low context have attracted research attention, mostly in business and communication disciplines. High-context cultures are marked, according to Hall, by implicit understandings of rules and norms. Clear communications in high-context cultures may depend more on gestures and “insider” knowledge, so rules are difficult to discover and follow without a lot of experience. In contrast, low-context cultures are marked by more explicit rules. Rules and norms are made public by rules that are publicly accessible. In low-context cultures, rules are easier to discover and follow. Researchers have studied high and low context within a framework of individualism and collectivism, as a self-report measure of this dimension does not exist (most likely because it captures communication styles rather than individual attitudes or values). Using self-report (Frymier, Klopf, & Ishii, 1990) and behavioral (Ambady, Koo, Lee, & Rosenthal, 1996) data, researchers have linked individualism with low context and collectivism with high context. Therefore, we predict that individualistic cultures will have more low-context cultural products than collectivistic cultures.
Patriotism
A few studies coded the extent to which a cultural product promoted allegiance and devotion to the home country. Patriotism has been measured in self-report cross-culturally. However, a common self-report measure (of nationalism and constructive patriotism) apparently does not meet a measurement equivalence criterion that allows researchers to make meaningful mean comparisons (Davidov, 2009). Indeed, Davidov’s analysis of the patriotism measure casts doubt on almost any other self-report findings, as most of those do not test for measurement equivalence before comparing group means.
Positivity
Many studies coded the overall positivity of messages, coding their overall tones as happy, upbeat, and positive, as opposed to negative or unhappy. Researchers have not typically compared cultures on this dimension at the individual level. However, the positivity of cultural products may correspond to cultural psychological studies on self-esteem (e.g., Heine, Lehman, Markus, & Kitayama, 1999) and high-intensity affect (Tsai et al., 2007). If cultural product positivity is related to cultural levels of self-esteem and high-intensity affect, we would expect that American messages would be more positive than East Asian messages.
Traditional gender roles
Some studies coded the relative roles of women and men depicted in the cultural products. Specifically, studies coded whether women (relative to men) were portrayed as employed or in positions of authority, rather than in a family scene or wearing traditional clothing. In general, this category captured the degree to which women were portrayed as subordinate to men. Studies that coded whether women were depicted in sexually explicit ways were not included in this dimension, because being portrayed as a sexual object or a nonsexualized object could both be considered “traditional” gender roles. One early study (Kalin & Tilby, 1978) measured attitudes toward gender equality in 14 national samples. Men and women from European countries tended to endorse more gender equality than samples from Japan, India, Pakistan, and Nigeria. In that study (30 years ago), North American samples scored about the middle of the 14 samples. More recent studies point to the idea that in general, and in self-report, North Americans endorse more egalitarian gender roles than samples from China or India (Marshall, 2008; Sethi & Allen, 1984).
Traits specific to advertising studies
A number of cultural products studies were conducted only on advertising, and the dimensions they coded were specific to the advertising context. These dimensions are purely exploratory—because they originate in the advertising field, none of the dimensions are intended as self-report variables. However, some of them may correspond to familiar cultural dimensions (noted in the discussion).
Central and peripheral persuasion cues
Because many cultural products studies are in advertising journals, authors frequently coded their persuasive appeals. We used Petty and Cacioppo’s Elaboration Likelihood Model to categorize persuasive appeals. When a study coded the presence of “strong argument” cues (such as research evidence in support of a product), we included it as a “central route” persuasion cue. When a study coded the use of a cue such as repetition, emotional appeal, or spokesperson attractiveness, we included it as a “peripheral route” persuasion cue.
Number of information cues
Several studies categorized the number and type of so-called “information cues” in advertising. An information cue is when information is given about any specific aspect of a product. Many of the studies in our meta-analysis used an information categorization system first developed by Resnik and Stern (1977), who identified 14 possible types of information, such as price, quality, and research information. When researchers used this system, they usually counted the total number of information cues in each advertising unit. Therefore, we were able to meta-analyze the total “number of information cues” in advertisements. Where appropriate, we also included subcategories of Resnik and Stern’s system with other dimensions. For example, “quality” was combined with similar measures of cultural values (described in the next section), and “independent research” was included with other examples of central route cues.
Showing the product
Several studies coded whether, or how often, a product’s image or price was visually depicted in an advertising campaign.
Comparing two products
Several studies coded whether an advertisement directly or indirectly compared two products to each other, as in a side-by-side comparison.
Cultural “values.”
A number of studies analyzed the cultural values manifested in advertising, mostly by using coding systems developed by Cheng and Schweitzer (1996), Mueller (1987), or Pollay (1983). We also included any “information cues” (from Resnik and Stern’s [1977] categorization system) that could also be construed as values. We combined values with similar definitions (and an adequate number of studies) to create seven categories of “values.” Economy is depicted when an ad emphasizes the value of the product (quality for the money). Hedonism is depicted when it emphasizes enjoyment, fun, and happy leisure time. Quality is depicted when an ad emphasizes the excellence or performance of the product. Status is depicted by linking a product with prestige, celebrity, and being admired in the eyes of others. Modernity is about being up-to-date, youthful, and technologically innovative, as opposed to “traditional.” Harmony with nature values are displayed by depicting humans preserving and enjoying natural settings, as opposed to dominating and manipulating natural settings.
Goals and Scope of the Present Analysis
One contribution of this meta-analysis is to continue to demonstrate and promote the use of cultural products in cultural psychology research. A second contribution is to respond to a growing call for cultural psychologists to move beyond the constructs of individualism and collectivism (Cohen, 2007). By presenting these cultural product data, we respond to this suggestion and hope to inspire cultural psychologists to conduct more studies of these traits—both at the psyche and the culture level. Many of our studies are gleaned from nonpsychological literatures (primarily communication, marketing, and business journals), so in this respect, these other social sciences contribute additional dimensions of cultural difference.
The current meta-analysis is meant to be exploratory in nature. Therefore, we primarily intend for this article to collect and document a variety of ways that these traits appear to differ (or not differ) cross-culturally, as measured by cultural products. Most studies have compared North American cultural products to those from another cultural context. Therefore, one trait at a time, we test whether North American cultural products differ from those in the rest of the world.
In this report, we do not compare cultural product effect sizes to self-report effect sizes, as we did in our earlier report, because there are no existing, self-report meta-analyses of these “other” traits (such as would have corresponded to Oyserman et al.’s [2002] meta-analysis of individualism and collectivism). In general, most of the traits in the present article are less studied by cultural psychologists, even at the psyche level.
Method
Our method involved three steps. First, we attempted to identify all studies that compared cultural products from two or more cultures (country of origin was always used as a proxy for culture). Second, after compiling the data, we identified themes in the cultural products that researchers have chosen to study (e.g., whether cultural products differ in their positivity or number of information cues). Third, we assessed whether cultures’ cultural products differed on the basis of those themes.
Literature Review Strategy
After doing pilot searches to identify words to use in the search, we searched for articles that fit all of the following criteria (the first three criteria were in the search at the same time):
The Boolean term “cultur*” was in the abstract.
Any of the following Boolean terms were in the abstract (searched using “or”): compare*, gender*, hedonism, harmony, nature, information, masculin* feminin*, modern*, nurture*, positiv*, negativ*, qualit*, status, power distance, or uncertainty avoidance.
Any of the following Boolean terms were in the title (searched using “or”): cultural product, advertis*, TV, painting*, lyric*, newspaper*, website*, text*, magazine*, or song*.
The article compared cultural products, was peer-reviewed, in English, and had the appropriate statistics to calculate a Hedge’s g.
We also used the ancestry method, searching through the reference list of included studies to identify additional cross-cultural studies of cultural products, and more informally, we used email networking to find articles to identify relevant unpublished or in-press studies.
Two-Country Comparisons
Fifty-three of the studies in the analysis compared pairs of cultures to each other, for example, magazine advertisements in the United States and India. We call such studies two-country comparisons (for example, comparing how much U.S. versus Indian advertisements promote a product on the basis of price; Rajaratnam, Hunt, & Madden, 1995). If a study presented data on cultural products from more than two cultures (e.g., they compared the United States, Korea, and Japan), we could not compare the United States to both non-U.S. cultures in our analysis because the two different effect sizes would be statistically dependent (i.e., the U.S. data are the same for both effect sizes, and therefore, the two effect sizes are not independent). In these cases, we chose the non-U.S. culture that was most common in our data (usually Korea, followed by Japan).
Multiple Country Comparisons
Twenty-four of the studies in the analysis reported correlations between countries’ cultural products and individualism/collectivism, uncertainty avoidance, and power distance. We call such studies “multiple country comparisons” (for example, correlating countries’ power distance ratings with their average pay ratios of a CEO to a manager; Tosi & Greckhammer, 2004). Most studies presented data correlating cultural products with each of Hofstede’s dimensions. Through discussion we identified which coded dimensions in each study would be theoretically related to which of Hofstede’s dimensions and included only dimensions that clearly fit.
Results
Analytic Strategy
Roughly 85% of the data had U.S. cultural products as the comparison group. Of the remaining 15%, no two countries’ cultural products of the same dimension were compared more than once, making that data inappropriate for a meta-analysis. For example, Cutler, Erdem, and Javalgi (1997) studied manifestations of status in U.K. and Japanese cultural products, but no other study compared manifestations of status between the United Kingdom and Japan. Therefore, unfortunately, it was not appropriate to submit data to the meta-analysis that did not have the United States as a country of comparison.
Computing Effect Sizes and Establishing Effect Size Independence
We used Comprehensive Meta-Analysis, Version 2 to perform the meta-analysis. For two-country comparison studies, we used the effect size of Hedges’ g, which weighs the estimated effect size by sample size. We computed g’s by subtracting non-U.S. country data from U.S. data (for example, United States minus India). The multiple country data were analyzed separately, because rather than comparing pairs of countries, these studies associated two continuous variables (i.e., a sample’s rating on some cultural product trait and that sample’s Hofstede rating). We used r to measure effect size in the multiple country comparison analysis because it is a more familiar measure for continuous variables (we also present the g equivalents).
Two-country comparisons
Occasionally, studies used more than one coding of a cultural product dimension. For example, Huang (1995) coded how often a woman relative to a man is portrayed as frustrated and how often a man relative to a woman is portrayed as an authority figure, both of which tap a cultural product’s adherence to traditional gender roles. In such a case, the two effect sizes (the results for relative frustration and the results for relative authority) are statistically dependent because they come from the same sample. Assumptions of statistical analyses require that we use only effect sizes that are statistically independent. When a single study contributed multiple data points of the same type (i.e., multiple codings from the same cultural product dimension), we averaged similar related effect sizes, as outlined by Lipsey and Wilson (2001). This procedure results in one mean effect size for each sample, for each cultural product dimension. Therefore, regardless of the number of ways a cultural product dimension was operationalized in a sample, each sample could only contribute one score for each dimension we identified.
A positive g indicates that the United States is higher on the dimension, and a negative g indicates that the non-U.S. country is higher on the dimension.
All analyses were conducted using a random effects model, as recommended by Hunter and Schmidt (2000). For all analyses we present both the overall effect size and QB, the most frequently used measure of heterogeneity between effect sizes (Viechtbauer, 2007). A significant QB indicates that the effect sizes should not be combined to create a single effect size (in other words, there is significant variability in effect sizes and the overall effect size is not an accurate representation of the effect size for all groups in the analysis). Unfortunately, the Q test has low power when sample size is small (less than 40 effect sizes in the analysis) (Viechtbauer, 2007). The sample sizes in all of our analyses are exceptionally small, never larger than 16 effect sizes. Therefore, we chose to present both the overall effect size and QB, but we acknowledge that the interpretation of QB is limited by our small sample size.
How to interpret the two-country comparison tables
To save space, we will only be explaining the results of the first four dimensions in the text. Recall that each effect size represents the difference between the United States and a particular country. Each table presents an overall g, which is the overall difference between the United States and all other countries. The overall g is not particularly interesting, except that when it is significant, it does mean that the U.S. cultural products differ significantly from cultural products of the other countries studied. The table presents Hedges’ g’s and a confidence interval for each country. An asterisk by a country’s Hedges’ g indicates that the cultural products of that country are significantly different from U.S. cultural products. A significant QB statistic (presented at the top of each table) indicates that the effect sizes in the table differ from each other (are heterogeneous). If significant, it means that there is significant variability in the different “U.S. – [other country]” effect sizes. If QB is significant, then it is appropriate to use confidence intervals for each country to determine which effect sizes are different from each other—we indicate significant differences using subscripts in the sixth column of each table.
Hofstede’s Dimensions of Power Distance and Uncertainty Avoidance
Do countries’ cultural products differ from the United States in the manifestation of power distance?
The overall effect size comparing power distance between all the U.S. and non-U.S. cultural products was not significantly different from 0 (Hedge’s g = 0.10, p = 0.33). Furthermore, there was no significant heterogeneity in the effect sizes comparing power distance in U.S. and non-U.S. cultural products, QB(3) = 5.22, p > .05 (see Table 2). However, as can be seen from the table (column 2), U.S. cultural products manifested power distance significantly more than Korean cultural products.
Do Countries’ Cultural Products Differ From the United States’ in the Manifestation of Power Distance?
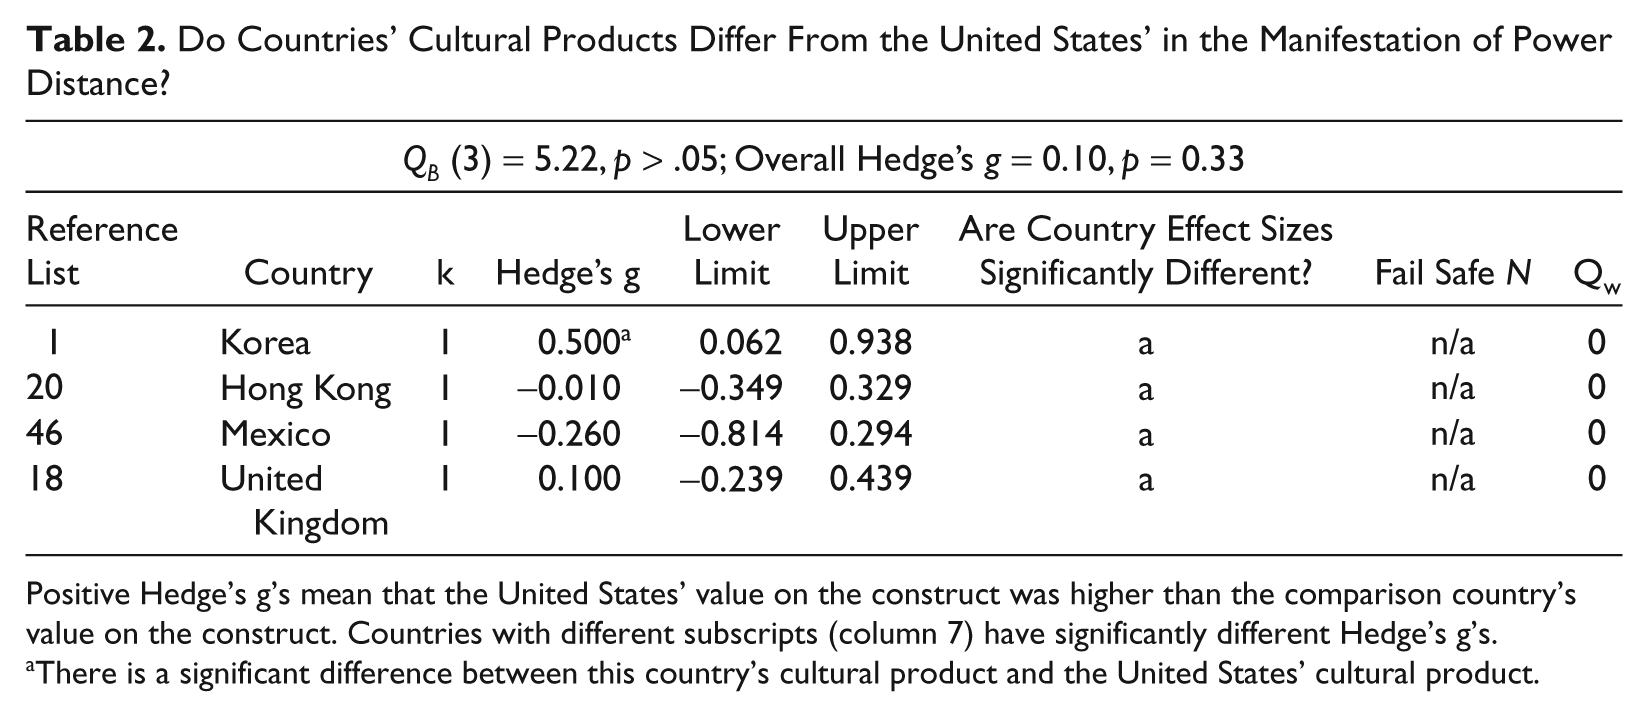
Positive Hedge’s g’s mean that the United States’ value on the construct was higher than the comparison country’s value on the construct. Countries with different subscripts (column 7) have significantly different Hedge’s g’s.
There is a significant difference between this country’s cultural product and the United States’ cultural product.
We predicted Mexico to be higher than Hong Kong, which in turn would be higher than the United States and the United Kingdom, but had no prediction for Korea, as Hofstede did not rank Korea. The United States and Korea were the only two countries in the cultural product analysis that were different from each other on this dimension.
Do countries’ cultural products differ from the United States in the manifestation of uncertainty avoidance?
The overall effect size comparing uncertainty avoidance between all the U.S. and non-U.S. cultural products was not significantly different from 0 (Hedge’s g = 0.25, p = 0.045). There was significant heterogeneity in the effect sizes comparing uncertainty avoidance in U.S. and non-U.S. cultural products, QB(10) = 18.41, p < .05 (see Table 3). However, follow-up analyses did not indicate which effect sizes differed from each other. As can be seen from the table, U.S. cultural products manifested uncertainty avoidance more than Japanese or Hong Kong cultural products.
Do Countries’ Cultural Products Differ From the United States’ in the Manifestation of Uncertainty Avoidance?
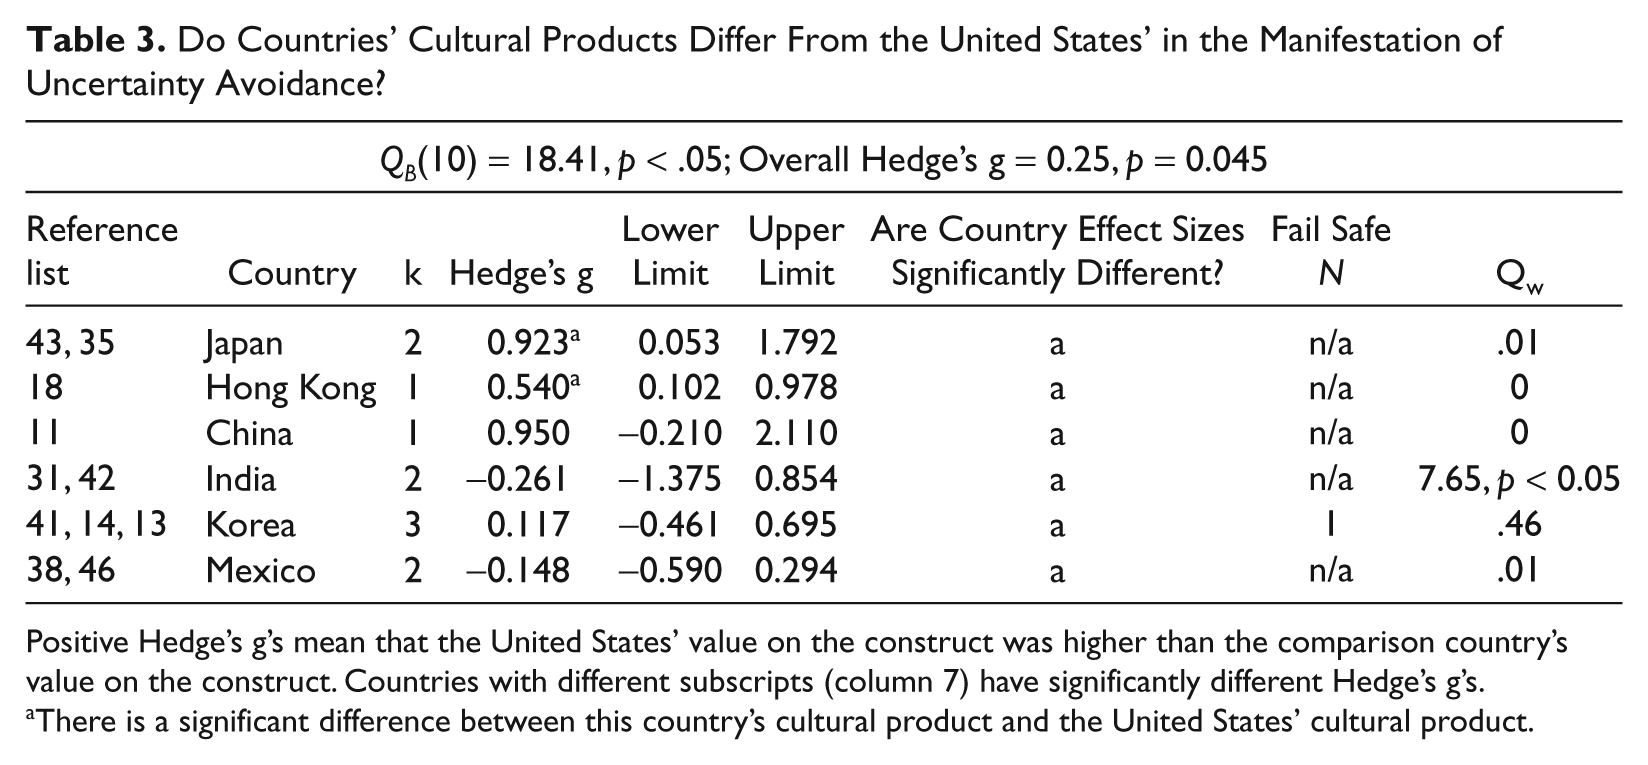
Positive Hedge’s g’s mean that the United States’ value on the construct was higher than the comparison country’s value on the construct. Countries with different subscripts (column 7) have significantly different Hedge’s g’s.
There is a significant difference between this country’s cultural product and the United States’ cultural product.
We predicted the following rankings of countries, from highest to lowest: Japan, Mexico, India, United States, China, and Hong Kong. U.S. cultural products were higher than those from Hong Kong, but Japanese cultural products were lower than those from the United States. There were no differences between cultural products from the United States and China, India, or Mexico.
Bem’s Categories of Masculinity and Femininity
Do countries’ cultural products differ from the United States in the manifestation of feminine characteristics?
The overall effect size comparing femininity between all the U.S. and non-U.S. cultural products was significantly different from 0 (Hedge’s g = 0.44, p = 0.001). There was no significant heterogeneity in the effect sizes comparing power distance in U.S. and non-U.S. cultural products, QB(6) = 10.58, p > .05 (see Table 4). However, as can be seen from the table, U.S. cultural products manifested feminine characteristics less than Mexican, Korean, or Hong Kong cultural products.
Do Countries’ Cultural Products Differ From the United States’ in the Manifestation of Feminine Characteristics?
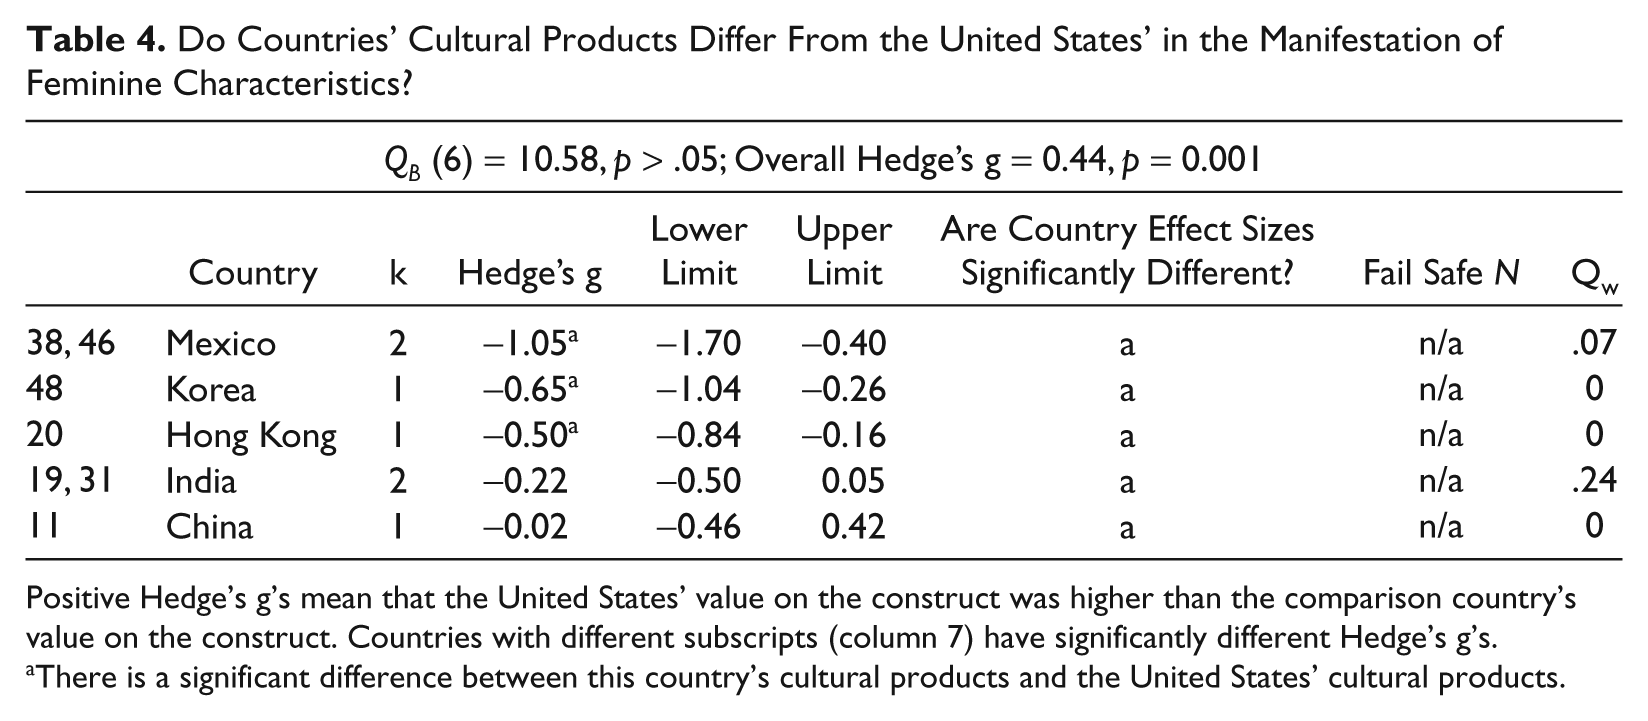
Positive Hedge’s g’s mean that the United States’ value on the construct was higher than the comparison country’s value on the construct. Countries with different subscripts (column 7) have significantly different Hedge’s g’s.
There is a significant difference between this country’s cultural products and the United States’ cultural products.
Do countries’ cultural products differ from the United States in the manifestation of masculine characteristics?
The overall effect size comparing masculinity between all the U.S. and non-U.S. cultural products was significantly different from 0 (Hedge’s g = 0.70, p = 0.04). There was significant heterogeneity in the effect sizes comparing masculinity in U.S. and non-U.S. cultural products, QB(3) = 86.65, p < .001 (see Table 5). Specifically, the U.S.-China effect size is significantly different from the U.S.-Australia effect size, although neither effect size is significantly different from the U.S.-Japan effect size. In addition, as can be seen from the table, U.S. cultural products manifested masculinity more than Chinese cultural products.
Do Countries’ Cultural Products Differ From the United States’ in the Manifestation of Masculine Characteristics?

Positive Hedge’s g’s mean that the United States’ value on the construct was higher than the comparison country’s value on the construct. Countries with different subscripts (column 7) have significantly different Hedge’s g’s.
There is a significant difference between this country’s cultural product and the United States’ cultural product.
Other Psychological and Cultural Traits
To save space and redundancy, we will not be explaining in detail the remaining analyses. We direct readers to each table, using the earlier paragraph “How to interpret the tables” for guidance (Tables 6 through 20 present the remaining two-country comparisons). However, in addition to power distance and uncertainty avoidance, there were three other dimensions for which we had specific predictions: high versus low context, positivity, and adherence to traditional gender roles. We will review the predictions for those three dimensions and discuss whether they were supported.
Do Countries’ Cultural Products Differ From the United States’ in the Manifestation of High Context?

Positive Hedge’s g’s mean that the United States’ value on the construct was higher than the comparison country’s value on the construct. Countries with different subscripts (column 7) have significantly different Hedge’s g’s.
There is a significant difference between this country’s cultural product and the United States’ cultural product.
Do Countries’ Cultural Products Differ From the United States’ in the Promotion of Patriotism?

Positive Hedge’s g’s mean that the United States’ value on the construct was higher than the comparison country’s value on the construct. Countries with different subscripts (column 7) have significantly different Hedge’s g’s.
Do Countries’ Cultural Products Differ From the United States’ in the Manifestation of Positivity?
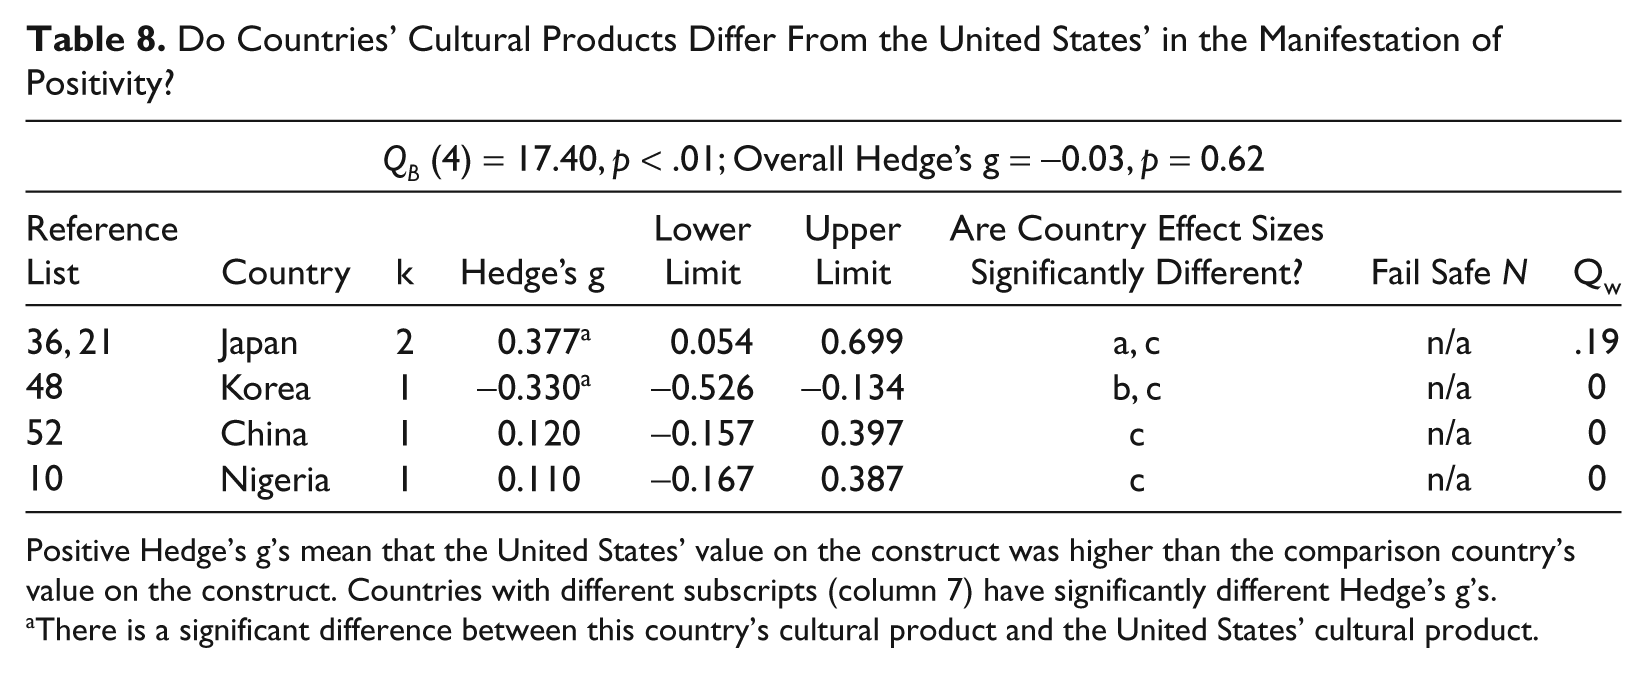
Positive Hedge’s g’s mean that the United States’ value on the construct was higher than the comparison country’s value on the construct. Countries with different subscripts (column 7) have significantly different Hedge’s g’s.
There is a significant difference between this country’s cultural product and the United States’ cultural product.
Do Countries’ Cultural Products Differ From the United States’ in the Adherence to Traditional Gender Roles?
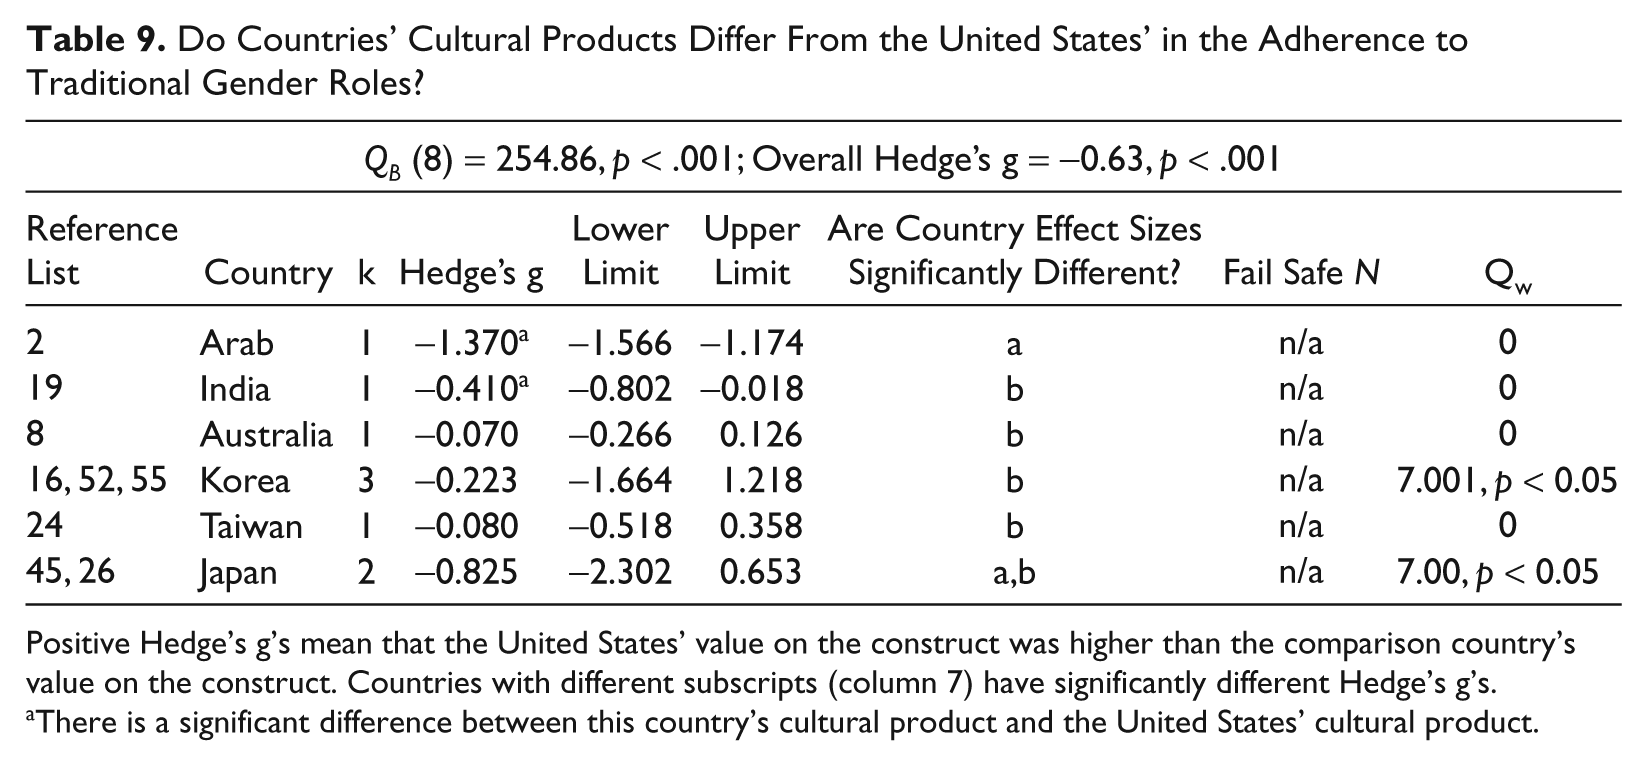
Positive Hedge’s g’s mean that the United States’ value on the construct was higher than the comparison country’s value on the construct. Countries with different subscripts (column 7) have significantly different Hedge’s g’s.
There is a significant difference between this country’s cultural product and the United States’ cultural product.
Do Countries’ Advertisements Differ From the United States’ in Use of the Central Route to Persuasion?

Positive Hedge’s g’s mean that the United States’ value on the construct was higher than the comparison country’s value on the construct. Countries with different subscripts (column 7) have significantly different Hedge’s g’s.
There is a significant difference between this country’s cultural product and the United States’ cultural product.
Do Countries’ Advertisements Differ From the United States’ in Their Use of the Peripheral Route to Persuasion?
Positive Hedge’s g’s mean that the United States’ value on the construct was higher than the comparison country’s value on the construct. Countries with different subscripts (column 7) have significantly different Hedge’s g’s.
There is a significant difference between this country’s cultural product and the United States’ cultural product.
Do Countries’ Advertisements Differ From the United States’ in Their Tendencies to Compare Products?

Positive Hedge’s g’s mean that the United States’ value on the construct was higher than the comparison country’s value on the construct. Countries with different subscripts (column 7) have significantly different Hedge’s g’s.
There is a significant difference between this country’s cultural product and the United States’ cultural product.
Do Countries’ Advertisements Differ From the United States’ in the Amount of Provided Information Cues?

Positive Hedge’s g’s mean that the United States’ value on the construct was higher than the comparison country’s value on the construct. Countries with different subscripts (column 7) have significantly different Hedge’s g’s.
There is a significant difference between this country’s cultural product and the United States’ cultural product.
Do Countries’ Advertisements Differ From the United States’ in the Amount They Show the Product?

Positive Hedge’s g’s mean that the United States’ value on the construct was higher than the comparison country’s value on the construct. Countries with different subscripts (column 7) have significantly different Hedge’s g’s.
There is a significant difference between this country’s cultural product and the United States’ cultural product.
Do Countries’ Advertisements Differ From the United States’ in Their Use of Promoting Economy as a Virtue?

Positive Hedge’s g’s mean that the United States’ value on the construct was higher than the comparison country’s value on the construct. Countries with different subscripts (column 7) have significantly different Hedge’s g’s.
There is a significant difference between this country’s cultural product and the US’s cultural product.
Do Countries’ Advertisements Differ From the United States’ in the Promotion of Harmony With Nature?
Positive Hedge’s g’s mean that the United States’ value on the construct was higher than the comparison country’s value on the construct. Countries with different subscripts (column 7) have significantly different Hedge’s g’s.
There is a significant difference between this country’s cultural product and the United States’ cultural product.
Do Countries’ Advertisements Differ From the United States’ in the Promotion of Hedonism?

Positive Hedge’s g’s mean that the United States’ value on the construct was higher than the comparison country’s value on the construct. Countries with different subscripts (column 7) have significantly different Hedge’s g’s.
There is a significant difference between this country’s cultural product and the United States’ cultural product.
Do Countries’ Advertisements Differ From the United States’ in the Promotion of Modernity?

Positive Hedge’s g’s mean that the United States’ value on the construct was higher than the comparison country’s value on the construct. Countries with different subscripts (column 7) have significantly different Hedge’s g’s.
There is a significant difference between this country’s cultural product and the United States’ cultural product.
Do Countries’ Advertisements Differ From the United States’ in the Amount of Quality Promotion?
Positive Hedge’s g’s mean that the United States’ value on the construct was higher than the comparison country’s value on the construct. Countries with different subscripts (column 7) have significantly different Hedge’s g’s.
There is a significant difference between this country’s cultural product and the United States’ cultural product.
Do Countries’ Advertisements Differ From the United States’ in the Amount They Promote Status’s Desirability?

Positive Hedge’s g’s mean that the United States’ value on the construct was higher than the comparison country’s value on the construct. Countries with different subscripts (column 7) have significantly different Hedge’s g’s.
There is a significant difference between this country’s cultural product and the United States’ cultural product.
High versus low context
We predicted that products from individualist countries would be more high context than collectivist countries and found data comparing the United States with Taiwan, China, Korea, and the United Kingdom. According to Hofstede, all but the United Kingdom have much lower individualism scores than the United States, indicating that the United States should be more high context than Taiwan, China, and Korea. However, Taiwanese cultural products were significantly more high context than U.S. cultural products, contrary to our prediction. There were no other differences between the countries of comparison. This lack of support is not surprising given that high (versus low) context has exclusively been studied within a framework of individualism/collectivism, even though the two (individualism/collectivism and high, versus low, context) theoretically are orthogonal dimensions.
Positivity
On the basis of a (perhaps tenuous) similarity to hypotheses about cultural differences in self-esteem and high-intensity affect, we predicted that American cultural products would be more positive than East Asian messages and found data comparing the United States with Japan, Korea, and China. We found that U.S. cultural products were more positive than Japanese cultural products but were less positive than Korean cultural products and that there was no difference between U.S. and Chinese cultural products.
Adherence to traditional gender roles
Although we had data for multiple countries to compare adherence to gender roles, we used past data to specifically predict that Indian cultural products would adhere more to gender roles than American cultural products, and that hypothesis was supported. As a reminder, in our analyses, we used Bem’s categories of feminine and masculine gender roles (for instance, grouping “nurturance” as a feminine dimension).
Multiple Country Comparisons (Correlational Results)
We present meta-analyses of multiple country comparisons (i.e., analyses of correlation data) for Hofstede’s dimensions of power distance and uncertainty avoidance (these were the only dimensions researchers have studied in multiple country analyses). Researchers have used these rankings to correlate country of origin with cultural products’ manifestations of power distance or uncertainty avoidance.
Across ten studies, uncertainty avoidance, as measured by Hofstede, did not correlate with uncertainty avoidance as measured by cultural products, r(10) = 0.064, p > 0.05, Hedge’s g equivalent = 0.120. However, across 10 studies, power distance, as measured by Hofstede, did correlate with power distance as measured by various cultural products, r(10) = 0.285, p < 0.001, Hedge’s g equivalent = 0.625. In our original article (Morling & Lamoreaux, 2008), we reported a correlation of 0.52 for 11 studies that had correlated individualism-collectivism in multiple countries. In the course of conducting this follow-up meta-analysis, we found an additional nine studies and chose to recalculate the meta-analytic r with all 20 studies. With the addition of these studies, the overall correlation became nonsignificant, r(20) = 0.007, p = 0.877, Hedge’s g = 0.123. Therefore, the correlation we originally reported does not stand up when these additional studies were added.
Discussion
This article provides an exploratory, descriptive catalog of cultural products studies that did not measure individualism-collectivism. We hope that this collection of interdisciplinary results provides a service to future investigators of cultural difference. Our meta-analysis might help researchers identify areas of inquiry outside the familiar individualism-collectivism dimension as well as encourage researchers to look outside the head for measures of cultural difference. In addition, the results from the cultural products studies that we report here might be used to complement and enhance self-report data on corresponding dimensions.
In many cases, the cultural product ratings did not neatly replicate published self-report results. In our previous analysis, we reported that cultural product effect sizes for individualism and collectivism were significantly larger than, but in the same direction as, effect sizes for self-report measures of the same dimension (Morling & Lamoreaux, 2008). However, in the current report, cultural product differences were not always in the same direction as self-report results we found in the literature.
Importantly, if we assume that people do not perfectly internalize the cultural messages they read (e.g., Sperber, 1996), then it may not be surprising to find that cultural differences in people are not always the same magnitude as cultural differences in cultural products. On the surface, it is reasonable to expect that the directions of cultural difference would be in similar directions in the two measurement modes. But on the other hand, as research and theory on pluralistic ignorance has reminded us, there are significant cases in which people’s relatively private, self-reported beliefs run opposite to the public, collective view. For example, Prentice and Miller (2002, p. 354) refer to the relatively tolerant private beliefs of a group of Methodist citizens in the 1920s. Privately, most of the citizens smoked, drank alcohol, and played cards, yet most of these same citizens believed that their neighbors did not. In light of this phenomenon, then, it is less surprising that some self-report results run counter to cultural-product measures. Additionally, cultural-products are public, whereas self-reports are often private. Whether the self-report results are in the same direction as the cultural product results likely depends on specifically what dimension is being assessed; we might expect greater discrepancies on dimensions that are politically sensitive or that are more easily portrayed in cultural products.
Another issue concerns measurement. The self-report data on which comparisons are based have typically not been tested for measurement equivalence. Recent statistical advances have outlined multivariate tests that will measure whether country means on a self-report instrument can be meaningfully compared (the self-report instrument must have equivalent factor structures in two cultures; e.g., Chen, 2008; Davidov, 2009). Therefore, self-report scales are not necessarily the gold standard for assessing cultural difference. Many writers argue that multiple methods—self-report, cultural products, behavior, ethnographies, and other methods—must be used to capture cultural dynamics (Cohen, 2007). We agree, because we do not have clear evidence supporting which measure of cultural difference is the best one. We argue that self-report measures should ultimately be combined with cultural products measures for the most complete picture of cultural difference (even if that picture is contradictory).
Lastly, it may be impractical to find a concrete rule that explains whether self-report and cultural product data would be in the same direction. Because culture is inherently multifaceted, it may best be viewed through a multiplicity of methodological lenses, of which cultural products and self-reports are only two.
Limitations
Limitations of two country comparisons
One limitation of the present results is that for most dimensions, the country-level results are based on a single sample (i.e., k = 1). In other words, the Korea-U.S. difference on power distance is only based on one study comparing the United States and Korea. In some cases, this apparently single effect size may be deceiving, because when a single study used multiple measures of the same dimension, we computed a single, average effect size for the meta-analysis (as described in the Method section). Nevertheless, most of the results at the country level are based on a very limited number of studies and should be interpreted accordingly.
To increase the values of k in these analyses, we could have combined countries into regions (for example, combining effect sizes from Taiwan, Korea, Japan, and China into an “East Asian” comparison region). However, there is no theoretical reason to expect that countries’ individualism/collectivism ranks would be similar to their ranks in other cultural dimensions. Therefore, it would not be prudent to group countries on the basis of individualism/collectivism scores in order to compare them along other cultural dimensions. Indeed, inspecting the various tables quickly reveals that the effect sizes for these countries are often very different from each other. Combining their effect sizes would therefore have masked truly variable results.
Limitations of the multiple country comparisons (correlational results)
Correlations for multicountry comparisons did not show consistent, significant relationships between cultural product ratings and published ratings by Hofstede (1980). One reason for these null correlations might be that the studies using this method have studied any number of countries—from 4 to 43. Further, the actual countries included varied from study to study, and yet all were combined in this meta-analytic result. This may be a case, therefore, in which meta-analysis obscures, rather than enlightens, data trends.
In addition to variance in how many, and which, countries were studied, there was a great deal of variance in what cultural product features were equated with power distance, uncertainty avoidance, or individualism, and some may have been inappropriately coded. For example, power distance was indicated when a country’s laws included human rights policies, when a country had strong tipping customs, and when a country’s CEOs earned a lot more than their managers. If there were a study included in the meta-analysis that used inappropriate (i.e., theoretically unsupported) operational definitions of the dimension, the overall meta-analysis r would be lower than if all the operational definitions of the dimension were appropriate. The pure variety of operationalizations may have obscured any true relationships between Hofstede’s rankings and cultural product rankings. (Importantly, to a great extent, the simpler, two country comparisons, which provide the bulk of this report, are exempt from these problems.)
Another reason for these null correlations may involve Hofstede’s rankings of countries. Other authors have indicated that his rankings, while widely used, are either simplistic, not construct valid, or simply outdated (e.g., Holden, 2002; McSweeney, 2002). Indeed, Merkin (2006) re-administered the same questionnaire Hofstede used to assess uncertainty avoidance and found that countries produced different uncertainty avoidance scores, changing their relative rankings. If Hofstede’s rankings do not reflect actual differences between cultures on uncertainty avoidance and power distance, we would be less likely to find a relationship between his rankings and the rankings of cultural products.
Complementing Current Research
Although the tables of results we present are dizzying, our intent was to catalog a variety of results, providing researchers with an interdisciplinary multiculture data set. Researchers can use our results to inspire or complement their current work. As an illustration, positivity and hedonism were dimensions for which Japanese cultural products scored lower than U.S. cultural products. These results for cultural products can potentially complement self-report research on self-esteem (e.g., Heine & Hamamura, 2007) or desire for high-intensity emotions (Tsai, 2007). The results from these sources all suggest, for example, that Americans are more interested in intensely happy, positive messages (both in self-report and cultural products measures) compared to East Asians.
A second example is that of high-context (vs. low-context) culture. Seven studies in our meta-analysis had measured high-context features in cultural products. In addition, the related measure of “showing” a product might also indicate an explicit, low-context message and was measured in 13 studies. Another dimension that may indicate an explicit, low-context message measured the extent to which an advertisement provided a large number of information cues and was measured in 11 studies. Future researchers can use these results to complement many current and future cultural investigations on the degree to which different ethnic populations emphasize the use of low-context, explicit communications versus high-context, implicit messages (Hall, 1976). For instance, the high- versus low-context communication dimension is relevant to a recent work on cultural transmission and communication processes (e.g., Kashima, 2000; Lau, Lee, & Chiu, 2004).
Inspiring Future Research
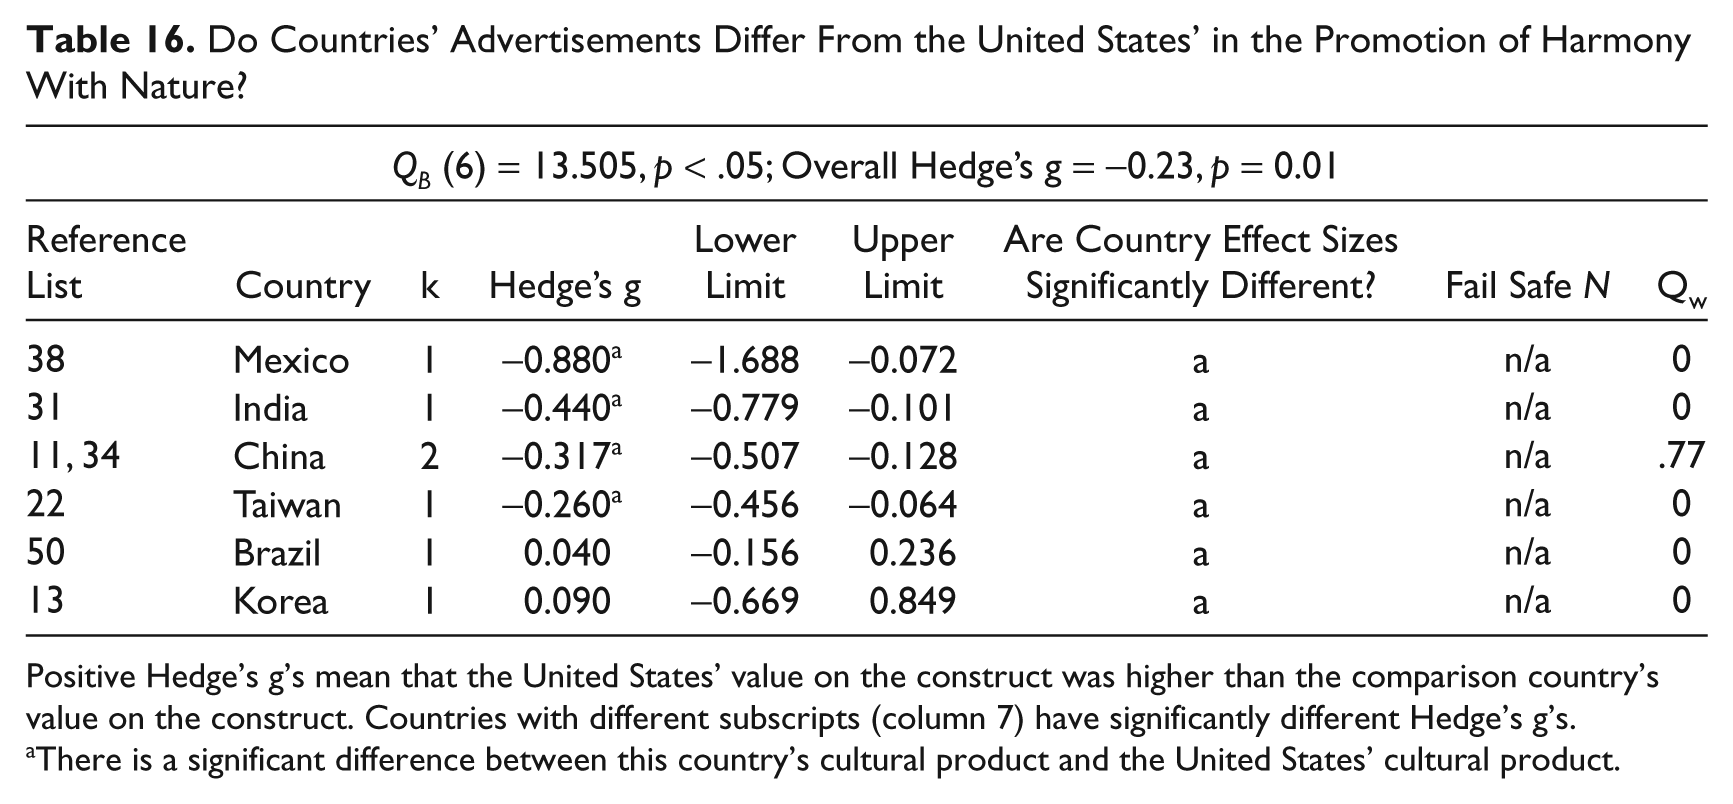
The cultural product studies revealed some dimensions of cultural difference that have not yet been deeply investigated in psyche-level investigations. One example of how cultural products studies might inspire new work at the psyche level comes from the dimension “harmony with nature,” an advertising dimension that showed North American cultural products to be lower than all other countries. Harmony with nature may be a psychological value that is not indigenously elaborated in North America (indeed, a sample of North Americans rated it 54 out of 56 values in a recent study; Wan et al., 2007). And yet cultural products studies may have “discovered” this dimension’s importance in other world regions. Indeed, the “harmony with nature” dimension potentially complements other work on accommodation or secondary control (e.g., Morling, Kitayama, & Miyamoto, 2002). Given that American cultural contexts do not typically elaborate accommodation processes, it makes sense that harmony with the natural environment was not “discovered” as a dimension until cultural products studies—using products from non-Western cultures—coded it.
Another example of how cultural products studies might inspire new work at the psyche level comes from the dimensions of masculinity and femininity as rated in cultural products. Although the differences are not always significant, the trend was such that U.S. products were less feminine, and more masculine, than those of other countries. The cultural product emphasis on masculinity and femininity might reflect cultural values for agency and competitiveness versus accommodation and nurturance.
One particularly promising avenue for future investigations is to use cultural products measures to complement emerging techniques for measuring cultural consensus, variously called “common sense,” perceived cultural importance, or descriptive norms. As introduced earlier, individual differences in cultural values are not the only predictors of cultural differences in counterfactual thinking (Zou et al., 2009), attributions (Shteynberg et al., 2009; Zou et al., 2009), and social identity (Wan et al., 2007). Instead, evidence is accumulating that these cultural effects are influenced by people’s perceptions of the cultural consensus: “What do others think?” For example, American students, compared to Polish students, were less persuaded by peers in a conformity situation. This cultural difference was predicted by what students thought others’ collectivism was—the “perceived consensual collectivism.” An important source of information for perceived consensus very likely comes from cultural products. Public, tangible representations have the potential to shape people’s views of what most others in their culture think.
The present meta-analyses are meant to support and encourage two emerging trends in the study of cultural differences. First, these data document that cultural products are a viable, interesting, and somewhat popular way to measure cultural difference and similarity. Cultural products, we argue, should be an important element of any research that follows Shweder’s cultural psychology tradition, in which both culture and psyche “make each other up.” The results from the cultural products studies that we report here might be used to complement and enhance self-report data on corresponding dimensions. Second, these data respond to a recent call to expand cultural research beyond familiar axes such as individualism-collectivism (Cohen, 2007). We hope the variety of dimensions that we have presented here will point out some specific avenues for future research in cultural difference and similarity.
Footnotes
Acknowledgements
We would like to thank Courtney Cadle for her assistance in preparing this manuscript.
The authors declared that they had no conflicts of interests with respect to their authorship or the publication of this article.
The authors declared that they received no financial support for their research and/or authorship of this article.