



Abstract
Studies on social perception reveal that on many dimensions, smiling individuals are perceived more positively in comparison with non-smiling individuals. The experiment carried out in seven countries (China, Germany, Iran, Norway, Poland, USA, and the Republic of South Africa) showed that in some cultures, smiling individuals may be perceived less favorably than non-smiling individuals. We compared ratings of intelligence made by participants viewing photos of smiling and non-smiling people. The results showed that smiling individuals were perceived as more intelligent in Germany and in China; smiling individuals were perceived as less intelligent than the (same) non-smiling individuals in Iran. We suggest that the obtained effects can be explained by the cultural diversity within the dimension of uncertainty avoidance described in the GLOBE (Global Leadership and Organizational Behavior Effectiveness) project by House, Hanges, Javidan, Dorfman, and Gupta.
“Don’t leave home without a smile, as you won’t see many on the streets because smiling at strangers is seen as a sign of stupidity.”
The Lonely Planet Guidebook warns tourists visiting Poland that smiling to strangers is perceived as a sign of stupidity (Bedford, Fallon, & McAdam, 2008). A Norwegian labor market agency booklet informs that in Norway, it is understandable that, when a stranger on the street smiles at you, you assume that he or she is drunk, insane, American, or all of the above (Living and Working in Norway, 2010). Research on social perception indicates that smiling individuals are perceived either more favorably or at least not less favorably than non-smiling individuals. However, the abovementioned non-scientific premises suggest that in some contexts and in some cultures, smiling individuals may be perceived less positively than non-smiling ones.
Social Perception of Smiling Individuals
Humans are ultra-social beings. Each day, we encounter new people, interact with them, and form personal impressions based on quick and automatic inferences from minimal contextual information (Vrticka, Andersson, Sander, & Vuilleumier, 2009). Research suggests that people form impressions of others based on their facial expression in a very fast and automatic manner (e.g., Tuk, Verlegh, Smidts, & Wigboldus, 2009). The smile is perhaps the most commonly observed affiliative signal (Mehu & Dunbar, 2008).
Smiling individuals are perceived as happier in general (e.g., in Brazil; Otta, Lira, Delevati, Cesar, & Pires, 1994), and more attractive, kind, honest, and competent (e.g., in Canada; Hess, Beaupre, & Cheung, 2002) than non-smiling individuals. In addition, they are more likable (e.g., in the United States; Palmer & Simmons, 1995) and elicit more cooperative behaviors and affiliative signals from others than people who do not smile (e.g., in the United States; Gonzaga, Keltner, Londahl, & Smith, 2001). Many researchers suggest that there are two main dimensions of social perception: warmth/communion and competence/agency (e.g., Fiske, Cuddy, & Glick, 2006; Wojciszke, 1994). Most of the previously mentioned research on the effects of smiles has focused on the warmth dimension, but smiles may also be linked to the competence dimension. As Hareli and Hess (2010; see also Szarota, 2011) suggest, a person who smiles can be perceived as self-confident and high in self-esteem. Therefore, it can be also assumed that smile is a non-verbal signal of success and self-confidence, which usually are the result of high agency, competence, and intelligence. The aim of our research was to examine the differences in the perception of smiling and non-smiling people on the competence dimension. The rare studies dealing with this topic yielded mixed results: Smiling individuals were perceived as more intelligent than non-smiling individuals in Hong Kong (Lau, 1982) and the United States (Matsumoto & Kudoh, 1993) but not in Brazil (Otta et al., 1994) or Japan (Matsumoto & Kudoh, 1993). These studies used different stimuli, sometimes using only one male and one female target. Thus, their results cannot be broadly generalized and are not directly comparable.
In our research, we compare social perception processes across cultures, because different cultures may shape different logics of perception (Leung & Cohen, 2011). We suggest that cultural variety in the social perception of intelligence of smiling individuals relates to cultures’ diversity on the project GLOBE’s uncertainty avoidance (UA) dimension 1 (House, Hanges, Javidan, Dorfman, & Gupta, 2004). Societies ranked high on the GLOBE’s UA dimension alleviate the social unpredictability and unexpectedness; they stress structure and clear rules (e.g., In this society, orderliness and consistency are stressed, even at the expense of experimentation and innovation). In cultures ranked low on the UA, the future is relatively less predictable, and there are fewer societal requirements and instructions on how to behave. We hypothesize that in cultures low on the UA dimension, expressing certainty by smiling (Hareli & Hess, 2010) in the uncertain social conditions can be puzzling for observers and are perceived as inconsistent. Research suggests that people who exhibit inconsistency are likely to elicit negative evaluations (e.g., Heinrich & Borkenau, 1998; Weisbuch, Ambady, Clarke, Achor, & Weele, 2010). Therefore, we assume that in exhibiting self-confidence by smiling in a highly uncertain social condition (cultures low at UA), people are perceived to be exhibiting inconsistency, which will be negatively evaluated as unintelligent behavior. In other words, we hypothesize that the cultural practices of UA will predict the ratings of intelligence of smiling and non-smiling individuals.
Method
The present research was carried out on samples from China, Germany, Iran, Norway, Poland, the United States, and the Republic of South Africa. Similar to House et al. (2004), we treated country samples as culture samples with the exception of South Africa, where we distinguish between two cultures: White and non-White. 2
Participants
While the study included 612 individuals, 53 participants were excluded due to missing data or for being over the age of 40 years. The final sample consisted of 559 individuals originating from Renmin University of China (China; 53 female [F], 62 male [M]); University of Jena (Germany; 37 F, 41 M); University of Queshm (Iran; 31 F, 11 M), University of Bergen (Norway; 52 F, 35 M), University of Lódź (Poland; 51 F, 19 M), University of Cape Town (South Africa; 47 F, 43 M), and University of Wisconsin–Madison (United States; 54 F, 23 M). In addition, the South African sample was divided into two subcategories: people declaring “White” ethnicity (22 F, 23 M) and people declaring “non-White” ethnicity (“Black,” “Mixed race,” “Colored,” “Malay,” “Indian,” or “African”; 25 F, 20 M). Correlation of the age and intelligence ratings of the targets was not significant (p = .64). We dealt with the gender imbalance within certain samples by including gender comparisons as a factor into our analyses and testing its effects. The mean age of participants was between 20.71 and 22.86 years (China = 22.86; Germany = 22.08; Iran = 21.21; Norway = 22.38; Poland = 22.74; South Africa, White = 20.71; South Africa, non-White = 21.00; USA = 21.56).
Materials and Procedure
Participants were asked to rate eight smiling and non-smiling faces of various ethnicities (the need of ethnical diversity is stressed by Matsumoto & Kudoh, 1993). Face photographs of people with neutral and smiling face expressions were taken from an online database of standardized photos (Minear & Park, 2004). There were two sets of photographs: Individuals presented smiling in one set were not smiling in the other set (Figure 1). Photographs in each set were randomized. Half of the participants received one set, the other half received the other set. Materials were written in Polish and English and were translated into languages of each country where the study was carried out. We used the materials in the following languages: Mandarin (China), German, Farsi (Iran), Norwegian, Polish, and English (for the South African and USA samples). The two independent variables were (1) the smile of the perceived individual (present or absent) and (2) the culture of origin of study participants. The dependent variable was perceived intelligence measured with the items intelligent, smart, and reversed stupid, dumb on a 7-point Likert-type scale (1 = trait doesn’t fit at all to 7 = trait fits perfectly; for reliabilities see Table 1, all reliabilities were satisfactory).

Two sets of photographs (miniatures) assessed by participants.
Ratings of Intelligence of Smiling and Non-Smiling Individuals in Researched Cultural Samples.

Note. The cultures are ordered from the highest to the lowest GLOBE’s uncertainty avoidance practices scores (UA; scale: 1 = low, 7 = high). α presents Cronbach’s alpha coefficients. Means’ comparisons were performed using a t test, and the p values are reported for two-tailed significance tests.
Results
To test our hypothesis regarding cultural variety of the social perception of smiling individuals, we conducted a 2 (smile present or absent) × 8 (culture) × 2 (gender of observer) × 2 (gender of target) mixed analysis of variance (ANOVA). Smile and gender of target were within-subject factors and culture and gender of observer were between-subjects factors. There was a main effect of culture, F(7, 543) = 3.21, p = .002,
As predicted, we observed a two-way Culture × Smile interaction, F(7, 543) = 9.16, p < 0.001,
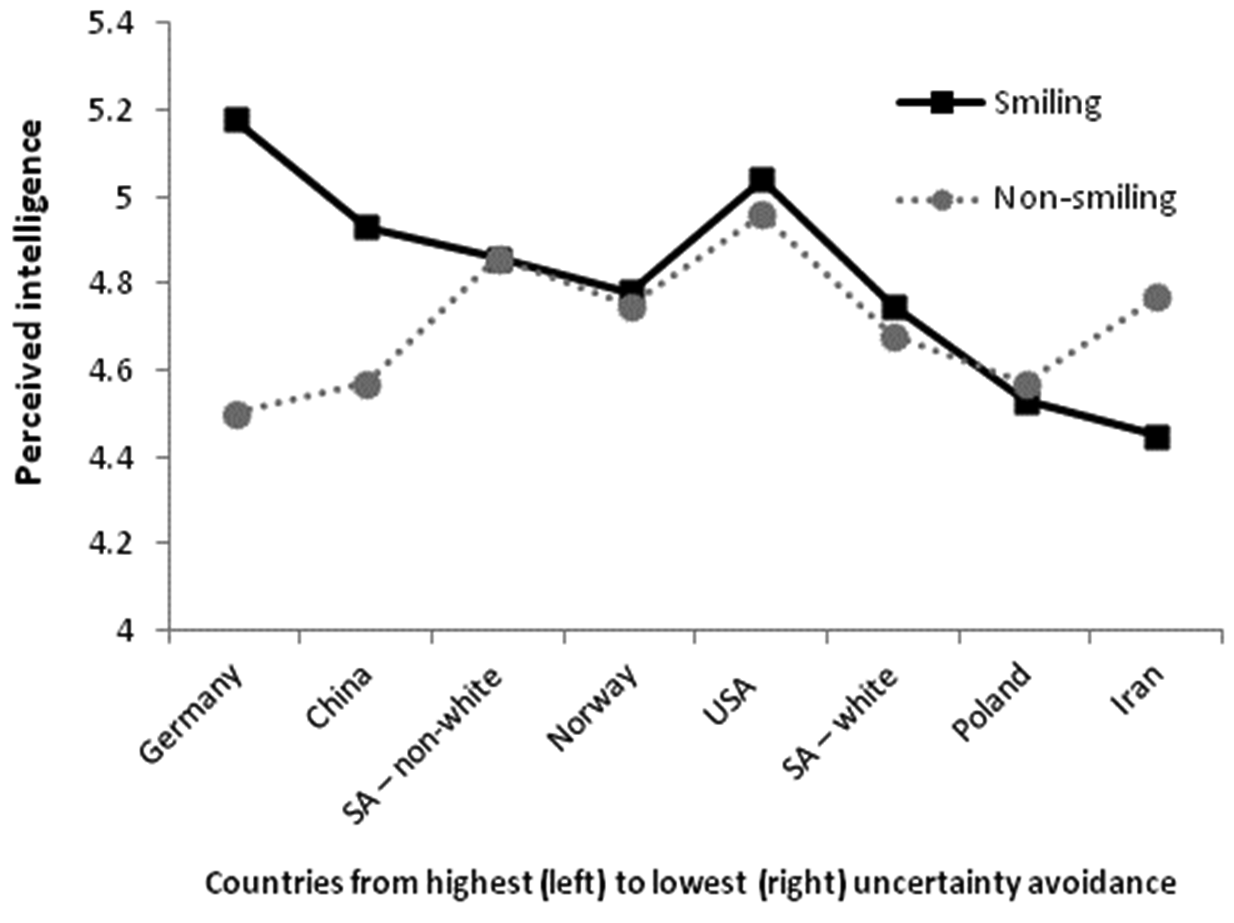
Perceptions of intelligence of smiling and non-smiling people by country’s GLOBE uncertainty avoidance score.
As shown in Table 1, cultural practices of UA of House et al. (2004; for Norway, Warner-Søderholm, 2010) revealed significant and predicted correlation with differences between ratings of intelligence of smiling and non-smiling individuals measured with Cohen’s d coefficient, r(8) = .88, p = .004—for females r(8) = .91, p = .002; for males r(8) = .73, p = .04. Correlations with all other dimensions described in the GLOBE project (e.g., collectivism, gender egalitarianism, future orientation) were not statistically significant (−.53 < r < .38, p > .22).
Discussion
Results of the experiment supported the hypothesis that social perception of competence-related traits of smiling individuals can vary depending on culture. Although previous studies have shown that smiling individuals are often perceived more positively on communal traits, our study showed such positive effect of smile with regard to competence only in Germany and China. Smiling and non-smiling individuals were perceived as similarly intelligent in Norway, Poland, United States, and in both samples in South Africa. In Iran, they were perceived as less intelligent than non-smiling individuals. Although our study did not directly support the common knowledge that in Poland and Norway smile is perceived as a sign of stupidity, in those cultures, smile was not perceived as a sign of intelligence.
As hypothesized, an explanation for those differences could be provided by psychological diversity of cultures on the UA dimension described in the project GLOBE of House et al. (2004). The high correlation of cultures’ scores on this dimension with the difference in the perception of intelligence of smiling and non-smiling individuals supports our hypothesis. If we treat cultural dimensions as a source of differences in the perception of others, we can say that the higher the tendency of cultural UA (the unpredictability of future events is alleviated by structure and order), the higher the ratings of smiling individuals in comparison with non-smiling ones (expression of self-confidence is justified and perceived as a non-verbal signal of intelligence).
It is important to note, however, that this type of UA is defined in a different way than the one by Hofstede (1980). Questions asked by House et al. (2004) and Hofstede were formulated in a different manner and in different times (before vs. after the fall of communism). Whereas Hofstede’s scale reflects longing for reducing uncertainty that is present, high UA in the GLOBE project (House et al., 2004) reflects the presence of clear structures, which ensure certainty (see also Boski, 2009).
Although the predicted relationship was strong, a weakness of the presented research is a small sample of cultures, which makes it more difficult to detect some (other) relationships even if they exist. Although no other correlation was significant, it would be beneficial to verify the results on more cultural samples. Another objection might be that we focused on UA, but with such a small sample, we cannot control for the variations within other cultural dimensions. Even though other cultural dimensions did not significantly correlate with perceptions of intelligence, differences on cultural dimensions may interact with evaluations and with each other. Future studies should take this fact into consideration.
Further research may also help to verify other potential explanations based on, for example, the specificity of post-communist countries as non-smiling cultures (Szarota, 2011) or on the cultures of high and low context in which smile may have different functions (Hall & Hall, 1990). Furthermore, generalization of the results to other contexts than ratings of individuals presented on photographs should be done with caution. Context plays an important role in the perception and judgment of smiles (Niedenthal, Mermillod, Maringer, & Hess, 2010) and can change the meaning of a given smile for the observer (Maringer, Krumhuber, Fischer, & Niedenthal, 2011). Our hypothesis could and should be examined in other contexts as well. One alternative example would be the context of job applications.
We are shaped by the cultures in which we were born. Although situational factors influence our perception, the cultural factors constitute yet the broader frame for perception processes. The present study suggests that cultural differences in the perception of intelligence of smiling individuals exist and might be explained with psychological diversity of cultures. In the globalizing world, social encounters may be less problematic if we better understand the relationship between culture and social perception. This is especially important for processes that are fast, automatic, and not fully conscious, such as impression formation.
Footnotes
Acknowledgements
The authors would like to express their gratitude to all partners engaged in translations, data collection, and lingusitic corrections, especially to Bjørn Ekelund, Faezeh Kasir, Shin Elisabeth Kim, Claudia Niedlich, Mark Price, Magdalena Rychłowska, Veronika Sandanger, Maral Shahi, Sebastian Wilfling, and Jafar Yaghobi. They also thank the editor Jenny Kurman and two anonymous reviewers for their comments on the earlier drafts of this manuscript.
Declaration of Conflicting Interests
The author(s) declared no potential conflicts of interest with respect to the research, authorship, and/or publication of this article.
Funding
The author(s) disclosed receipt of the following financial support for the research, authorship, and/or publication of this article: Parts of this research were supported by the National Science Centre Grant 2011/03/N/HS6/05112 awarded to Kuba Krys. The Norwegian part of this project was completed with the support granted to Kuba Krys by Iceland, Liechtenstein, and Norway by means of co-financing from the European Economic Area Financial Mechanism and the Norwegian Financial Mechanism as part of the Scholarship and Training Fund. German part of the project was completed with the support granted to Karolina Hansen in the programme ProExzellenz of the German state of Thuringia, and writing of this paper by her was supported by the Marie Curie Initial Training Network funded by the European Community’s Seventh Framework Programme (FP7/2007-2013, 237907). Chinese part of the project was completed with the support granted to Cai Xing by National Natural Science Foundation of China (Grant No. 31200788).