
Abstract
This study investigated the role of strategy instruction and working memory capacity (WMC) on word problem solving accuracy in children with (n = 100) and without (n = 92) math difficulties (MD). Within classrooms, children in Grades 2 and 3 were randomly assigned to one of four treatment conditions: verbal-only strategies (e.g., underlining question sentence), verbal + visual strategies, visual-only strategies (e.g., correctly placing numbers in diagrams), or untreated control. Strategy interventions included 20 sessions in both Year 1 and Year 2. The intent-to-treat as well as the “as-treated” analyses showed that treatment effects were significantly moderated by WMC. In general, treatment outcomes were higher when WMC was set to a high rather than low level. When set to a relatively high WMC level, children with MD performed significantly better under visual-only strategy conditions and children without MD performed better under verbal + visual conditions when compared to control conditions.
Word problems are an important part of mathematics programs in elementary schools. This is because word problems help students apply formal mathematical knowledge and skills to real world situations. Much of the evidence indicates that word problem solving performance improves as children gain greater ability in (a) understanding underlying arithmetic operations (e.g., Andersson, 2010), (b) distinguishing types of word problems on a basis of mathematical operations (e.g., Ng & Lee, 2009), and (c) effectively using selection strategies (e.g., Siegler, 1988). Improvements in mathematical skills, however, do not provide a complete account of changes in word problem solving ability. There is evidence that general cognitive processes, such as working memory, may play an important role. For example, solving a word problem, such as “15 dolls are for sale, 7 dolls have hats. The dolls are large. How many dolls do not have hats?” involves the development of a variety of mental activities (Barrouillet & Lépine, 2005; Swanson, Jerman, & Zheng, 2008). Children must access prestored information (e.g., 15 dolls), access the appropriate algorithm (15 minus 7), and apply problem solving processes to control its execution (e.g., ignore the irrelevant information). Given the multistep nature of word problems, working memory (WM) plays a major role in word problem solution.
Given that WM is a fundamental component of children’s mathematical problem solving (e.g., LeBlanc & Weber-Russell, 1996), as well as underlies some of the difficulties found in children with math difficulties (MD; Geary, 2010; Swanson et al., 2008), few intervention studies (to the authors’ knowledge) have explicitly explored the demands they place on children’s WM. Intervention studies directed to improve problem solving accuracy in children with MD have found support for teaching cognitive strategies. Several studies have found that verbal strategy instructions (e.g., Montague, 2008; Montague, Warger, & Morgan, 2000; Xin, 2008) as well as visual-spatial strategies (e.g., Kolloffel, Eysink, de Jong, & Wilhelm, 2009; van Garderen, 2007) enhance children’s math performance relative to control conditions (for reviews, see Baker, Gersten, & Lee, 2002; Gersten et al., 2009). Additional successful strategy models have included diagramming (van Garderen, 2007), identifying keywords (e.g., Mastropieri, Scruggs, & Shiah, 1997), and metacognitive strategies (e.g., Case, Harris, & Graham, 1992; Montague, 2008; see Gersten et al., 2009, Xin & Jitendra, 1999, for reviews). These studies strongly suggest that the training of cognitive strategies facilitates problem solving accuracy in children with MD. However, despite the overall benefits of strategy instruction in remediating problem solving word difficulties, the use of strategies for some children with MD may not always be advantageous because of the excessive strain they place on working memory capacity (WMC).
In this study, we hypothesize that the availability of ample WM resources is an important precondition for strategy training to be successful for children with MD. This is because strategies are resource demanding. As a consequence, children with relatively smaller WMCs may be easily overtaxed with certain strategies, which may lead to even poorer learning outcomes after training. Accordingly, word problem solving is an activity that draws on WMC to a considerable degree. Because children with MD have been known to experience WM difficulties (e.g., Geary, Hoard, Byrd-Craven, Nugent, & Numtee, 2007; Swanson & Beebe-Frankenberger, 2004), their poor problem solving skills plus their low WMC may have direct consequence on the effectiveness of cognitive strategy interventions. In contrast, children with MD who meet a certain threshold (yet to be determined) of WMC would have spare WM resources to benefit from cognitive strategies. Our hypothesis is in line with correlational studies linking WMC to achievement (e.g., Alloway, Gathercole, Kirkwood, & Elliott, 2009; Swanson & Alloway, 2012). Thus, we assume that individuals with MD and relatively higher WMC are better able to utilize cognitive strategies than children with lower WMC. This is because strategies rely on declarative representations and serial cognitive processes that require a large amount of WMC (e.g., Anderson, 1987), and the utilization of cognitive strategies that have been recently acquired imposes demands on WMC. In the context of this study, we define WM as a processing resource of limited capacity, involved in the preservation of information while simultaneously processing the same or other information (e.g., Baddeley & Logie, 1999; Engle, Tuholski, Laughlin, & Conway, 1999; Unsworth & Engle, 2007).
In summary, the purpose of this study was to investigate the role of WMC in strategy training in children with MD. We compared three cognitive interventions to boost word problem solving performance on norm-referenced measures. Training involved explicit instructions regarding verbal strategies that direct children to identify (e.g., via underlining, circling) relevant or key propositions within the problems, visual strategies that require children to place numbers into diagrams, and a combined strategy condition that combines both verbal and visual strategies. Consistent with reviews that have identified key components related to treatment effectiveness (Gersten et al., 2009, Xin & Jitendra, 1999), each strategy training session involved explicit practice and feedback related to strategy use and performance. Also, because warm-up activities related to calculation have been found to be effective in problem solving interventions, this component was also included in all training sessions (e.g., Fuchs et al., 2003). The cognitive intervention sessions focused on directing children’s attention to the relevant propositions within word problems related to accessing numerical, relational, and question information, as well as accessing the appropriate operations and algorithms for obtaining a solution (Mayer & Hegarty, 1996). Instructions to focus on relevant information for solution accuracy in the context of increasing distractions related number of irrelevant propositions (sentences) within word problems were embedded within lessons. This is an important component because difficulties in controlled attention have been found to underlie some of the cognitive deficits experienced by children with MD (e.g., Passolunghi, Cornoldi, & De Liberto, 2001; Passolunghi & Siegel, 2001).
To explore the relationship between strategy training and WMC in children with MD, this study addressed three questions.
1. Do some strategies place greater demands on the WMC in children with MD than other strategies?
To address this question, we used a treatment by covariate interaction design (e.g., Judd, McClelland, & Smith, 1996). The model has been discussed elsewhere (Cohen & Cohen, 1983; Judd et al., 1996; Leon, Portera, Lowell, & Rheinheimer, 1998; Littell, Milliken, Stroup, Wolfinger, & Schabenberger, 2010) but has the advantage of testing whether treatment outcomes are conditional on the level at which WMC is set before initial training occurs. The design allows us to measure the magnitude of treatment effect after accounting for incremental changes in WMC. Thus, the interpretation, direction, and magnitude of the treatment effects are conditioned on the level of WMC set prior to treatment. Based on this design, we predict that because WMC is a limiting factor in strategy interventions in children with MD, a significant interaction will occur between WMC and treatment outcomes. We hypothesize that treatment outcomes will be in favor of setting WMC to a relatively higher rather than lower threshold. The alternative, of course, is that the significant interaction between WMC and treatment conditions may show that strategy conditions favor setting WMC to a low rather than high level. This finding would suggest that strategy conditions compensate for low WMC in children with MD.
2. Are some cognitive strategies more effective than others in reducing the performance differences between children with and without MD?
Regardless of WMC, we assume that some cognitive strategies are more effective than others in allowing children with MD to catch up to their peers in problem solving accuracy. A meta-analysis of the cognitive literature on MD has suggested that such children experience greater processing difficulties on verbal rather than visual tasks (e.g., Swanson & Jerman, 2006) and visual strategies have been found to yield large effect sizes relative to control conditions (e.g., Gersten et al., 2009, p. 1217; median effect size estimates of .67 relative to control conditions). Based on the assumption that visual processing in children with MD is relatively more intact than verbal processing (Swanson & Beebe-Frankenberger, 2004; however see, Andersson, 2010), we predict that visual-spatial strategies will yield higher accuracy scores when compared to verbal strategy conditions.
3. Are the effects of WMC on strategy intervention more pronounced on the earlier rather than later treatment phases?
Studies have shown that deficits in word problem solving capability are persistent across the elementary school years even when calculation and reading skills are within the normal achievement range (e.g., Swanson et al., 2008), and therefore we expected that the effects of treatment would not be immediately apparent in our study. The effects of WMC on later treatment performance, however, are unclear. For this study, interventions for children with MD included 8 weeks in Year 1 and 8 weeks in Year 2. We assumed that the potential moderating effects of WMC would change with longer intervention periods. Models of skill acquisition (e.g., Ackerman, 1988) suggest, for example, that WMC may be important in the early phases of skill acquisition, but become less important with longer interventions when the implementation of strategies is automatized. Thus, we predict that although the positive effects of strategy training on problem solving deficits may not be apparent until later intervention sessions, the effects of WMC on treatment outcomes would be more apparent on the earlier rather than the later treatment sessions.
Method
Participants
For the first year of intervention, 192 children from Grades 2 and 3 from a large southwestern public school district participated in this study. Children were selected from a larger longitudinal sample (N = 420) that included children with a wide array of reading and math ability levels including reading difficulties and MD. We chose to focus on children with MD in the lower grades because this is when word problems are introduced into the curriculum. Of the 192 children selected, 98 were males and 94 were females. Ethnic representation of the sample was 109 Anglo, 36 Hispanic, 14 African American, 10 Asian, and 23 mixed and/or other (e.g., Anglo and Hispanic or Native American). The mean socioeconomic status (SES) of the sample was primarily low SES to middle SES based on federal free and reduced-price lunch participation, parent education, or parent occupation. After random assignment to conditions within classrooms, children were divided into those with MD (n = 100) and those without MD (n = 92) based on the criteria provided below.
For the second year of intervention, the sample size was reduced. The nonretained children had moved out of the school district. Only 42 of the children with MD and 58 of the children without MD were retained for the last treatment phase. No significant differences occurred between retained and nonretained children as a function of assignment to treatment conditions, χ2(3, n = 192) = 3.53, p = .31 or gender, χ2(1, n = 192) = 1.91, p = .59. Additional comparisons between the retained and nonretained on the criterion measures are discussed in the results section.
Definition of MD
We sought to identify children with difficulties in problem solving performance over a 2-year period. Because the majority of children were not diagnosed with specific learning disabilities in math, however, we utilized the term math difficulties (MD). Because the focus of this study was on children’s word problem solving difficulties, we examined children who performed in the lower 25th percentile on a norm-referenced word problem solving math test. The 25th percentile cutoff score on standardized achievement measures has been commonly used to identify children at risk (e.g., Fletcher et al., 1989; Siegel & Ryan, 1989). No doubt, the criteria we used to define math disabilities or MD vary across investigators and states. However, for purposes of this research the term math difficulties will be adopted and was operationalized as performance in word problem performance below the 25th percentile. Our focus on problem solving, however, is appropriate given that current categories of learning disabilities include as specific disabilities not only the area of calculation but also mathematical problem solving (see Individuals with Disabilities Education Improvement Act, 2004, Sec. 300.8(c)(10)).
Obviously, the 25th percentile as a cutoff on our part is arbitrary and there is no reason to assume that children in the 26th percentile and above would perform differently. It is important to note because of our sample size, however, we did not create extreme groups (deleting children from the analysis who were in the 25th percentile to the 50th percentile range and retaining only the lower and upper percentiles). Removal of children to create extreme groups has come under criticism because it creates several artifacts and unwarranted assumptions about linearity, group membership, and the reliability of the findings are more likely to be reduced rather than increased related to these procedures (Preacher, Rucker, MacCallum, & Nicewander, 2005).
Our procedure to identify children with MD, however, needs justification. We relied on the Story Problem subtest taken from the Test of Math Abilities (TOMA; Brown, Cronin, & McEntire, 1994), to determine risk status. However, as a precaution in our data analysis, we compared two cutoff points (standard score of 90 and 85, or scale score of 8 or 7, respectively). We used a measure referred to as the Affected-Status Agreement (Cicchetti & Feinstein, 1990; Waesche, Schatschneider, Maner, Ahmed, & Wagner, 2011), which in this case is the proportion of children classified as at risk by either a cutoff score at the 25th percentile (scale score of 8) or a cutoff score at the 16th percentile (scale score of 7) or both. The same 84 children were identified as at risk (from a total of n = 100) on both cutoff scores. An additional 16 children were identified as a risk with a cutoff score of 8. The affected status agreement was .84 (84 / 84 + 16 + 0). We computed the standard error (.029; see Waesche et al., 2011, p. 300, for the formula) and determined the 95% confidence interval (.029 × 1.96), which yielded an affected status range from .99 to .90. Because our status score was greater than chance (confidence intervals did not contain 0), we assumed a standard score of 90 (scale score of 8) was an appropriate cutoff score to infer that children were at risk.
Considering these issues, our criteria for defining children with MD was a cutoff score at or below the 25th percentile (below a standard score of 90 or scale score of 8) on the Problem Solving subtest of the TOMA (Brown et al., 1994) and scores between the 35th and 90th percentiles on measures of fluid intelligence (Colored Progressive Matrices Test; Raven, 1976) and reading (using the Passage Comprehension subtest from the Test of Reading Comprehension [Brown, Hammill, & Weiderholt, 1995] and the Word Identification subtest from the Wide Range Achievement Test [WRAT; Wilkinson, 1993]), on the Arithmetic Computation subtest from the WRAT (Wilkinson, 1993), and on the Numerical Operations subtest from the Wechsler Individual Achievement Test (WIAT; Psychological Corporation, 1992). Children with MD problem solving performance was also compared on similar subtests from the KeyMath (Connolly, 1998) and Comprehensive Mathematical Abilities Test (CMAT; Hresko, Schlieve, Herron, Sawain, & Sherbenou, 2003), which again yielded for this sample performance below the 25th percentile. These latter two tests were used as criterion measures in the analysis.
Table 1 shows the means and standard deviations for children with and without MD for both the retained and nonretained samples at Wave 1. As shown in Table 1, performance on standardized measures of word problem solving accuracy for the MD sample was at or below the 25th percentile (scale score at or below 8, standard score below 90), whereas their norm-referenced scores on calculation, reading comprehension, and fluid intelligence were above the 35th percentile.
Means and Standard Deviation for Norm-Referenced Measures as a Function of Math Group and Retention.
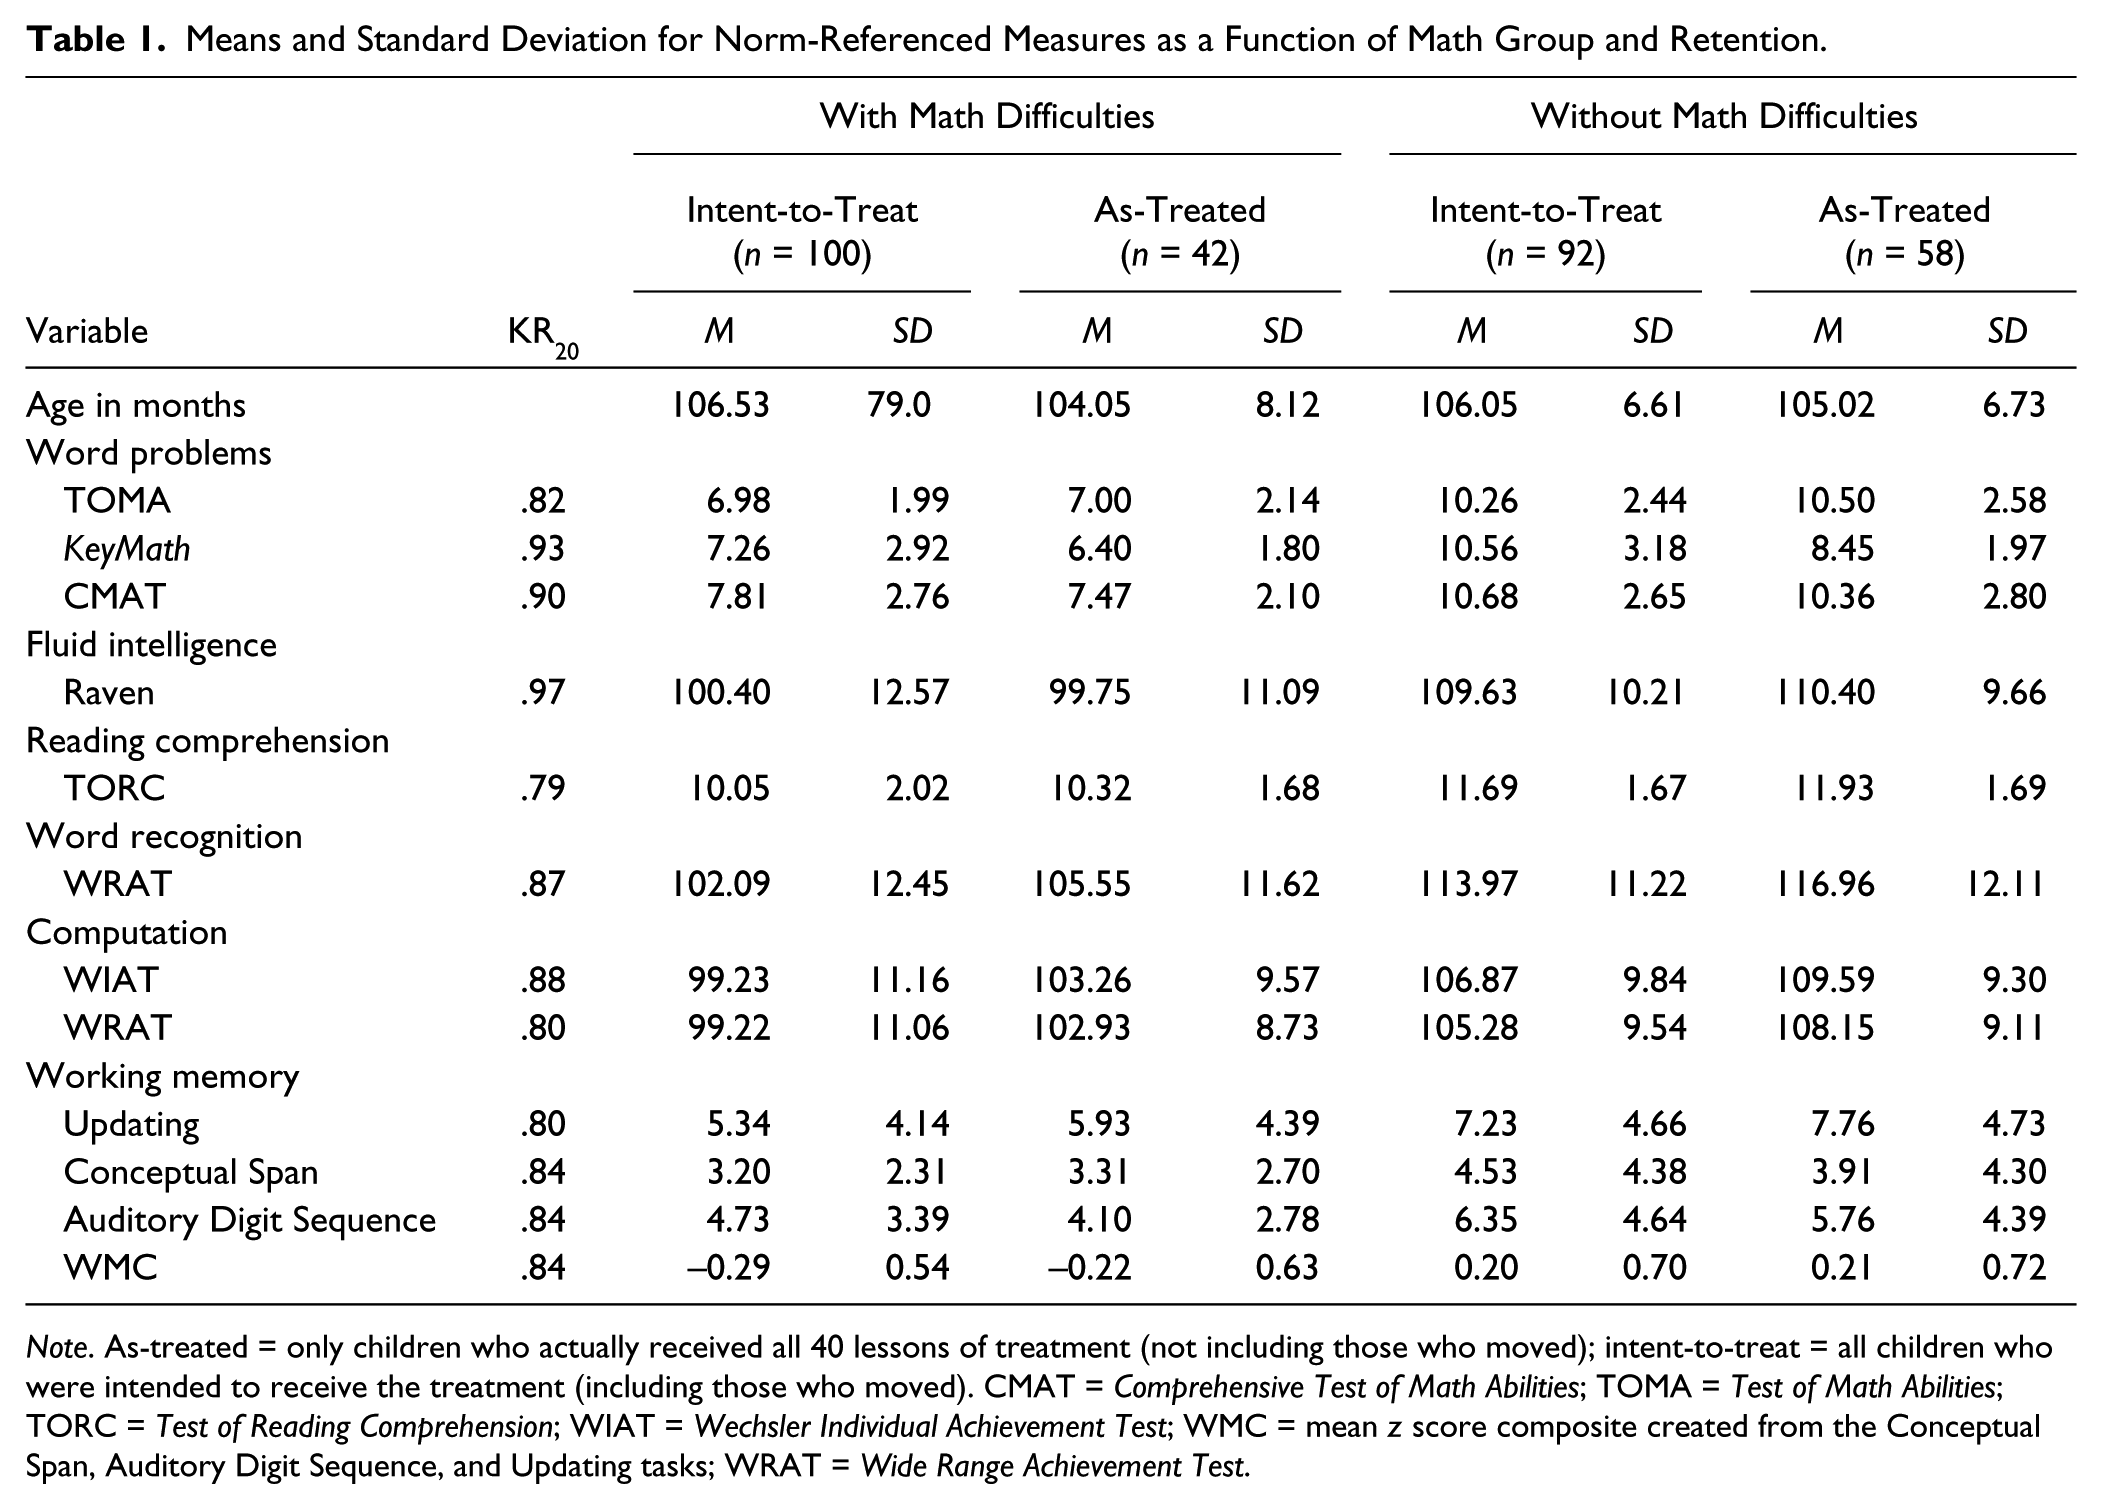
Note. As-treated = only children who actually received all 40 lessons of treatment (not including those who moved); intent-to-treat = all children who were intended to receive the treatment (including those who moved). CMAT = Comprehensive Test of Math Abilities; TOMA = Test of Math Abilities; TORC = Test of Reading Comprehension; WIAT = Wechsler Individual Achievement Test; WMC = mean z score composite created from the Conceptual Span, Auditory Digit Sequence, and Updating tasks; WRAT = Wide Range Achievement Test.
Design and Treatment Conditions
Random assignment
At Year 1 of the study, children were randomly assigned to one of the three treatment conditions (described below) or a control condition within each classroom. After assignment, children were divided, for analysis purposes, as children with and without MD. When comparing demographics across the four treatment conditions (verbal-only, verbal + visual, visual-only, and control), no significant differences emerged between conditions as a function of ability group (children with and without MD), χ2(df = 3, n = 192) = 2.69, p = .45. The number of children within each condition at Wave 1 is shown in Table 2. The unequal sample sizes reflect removing children with low reading or fluid intelligence scores from the data analysis.
Means and Standard Deviations for Composite Problem Solving Accuracy Scores as a Function of Treatment and Testing Wave, Adjusted for Working Memory Capacity.
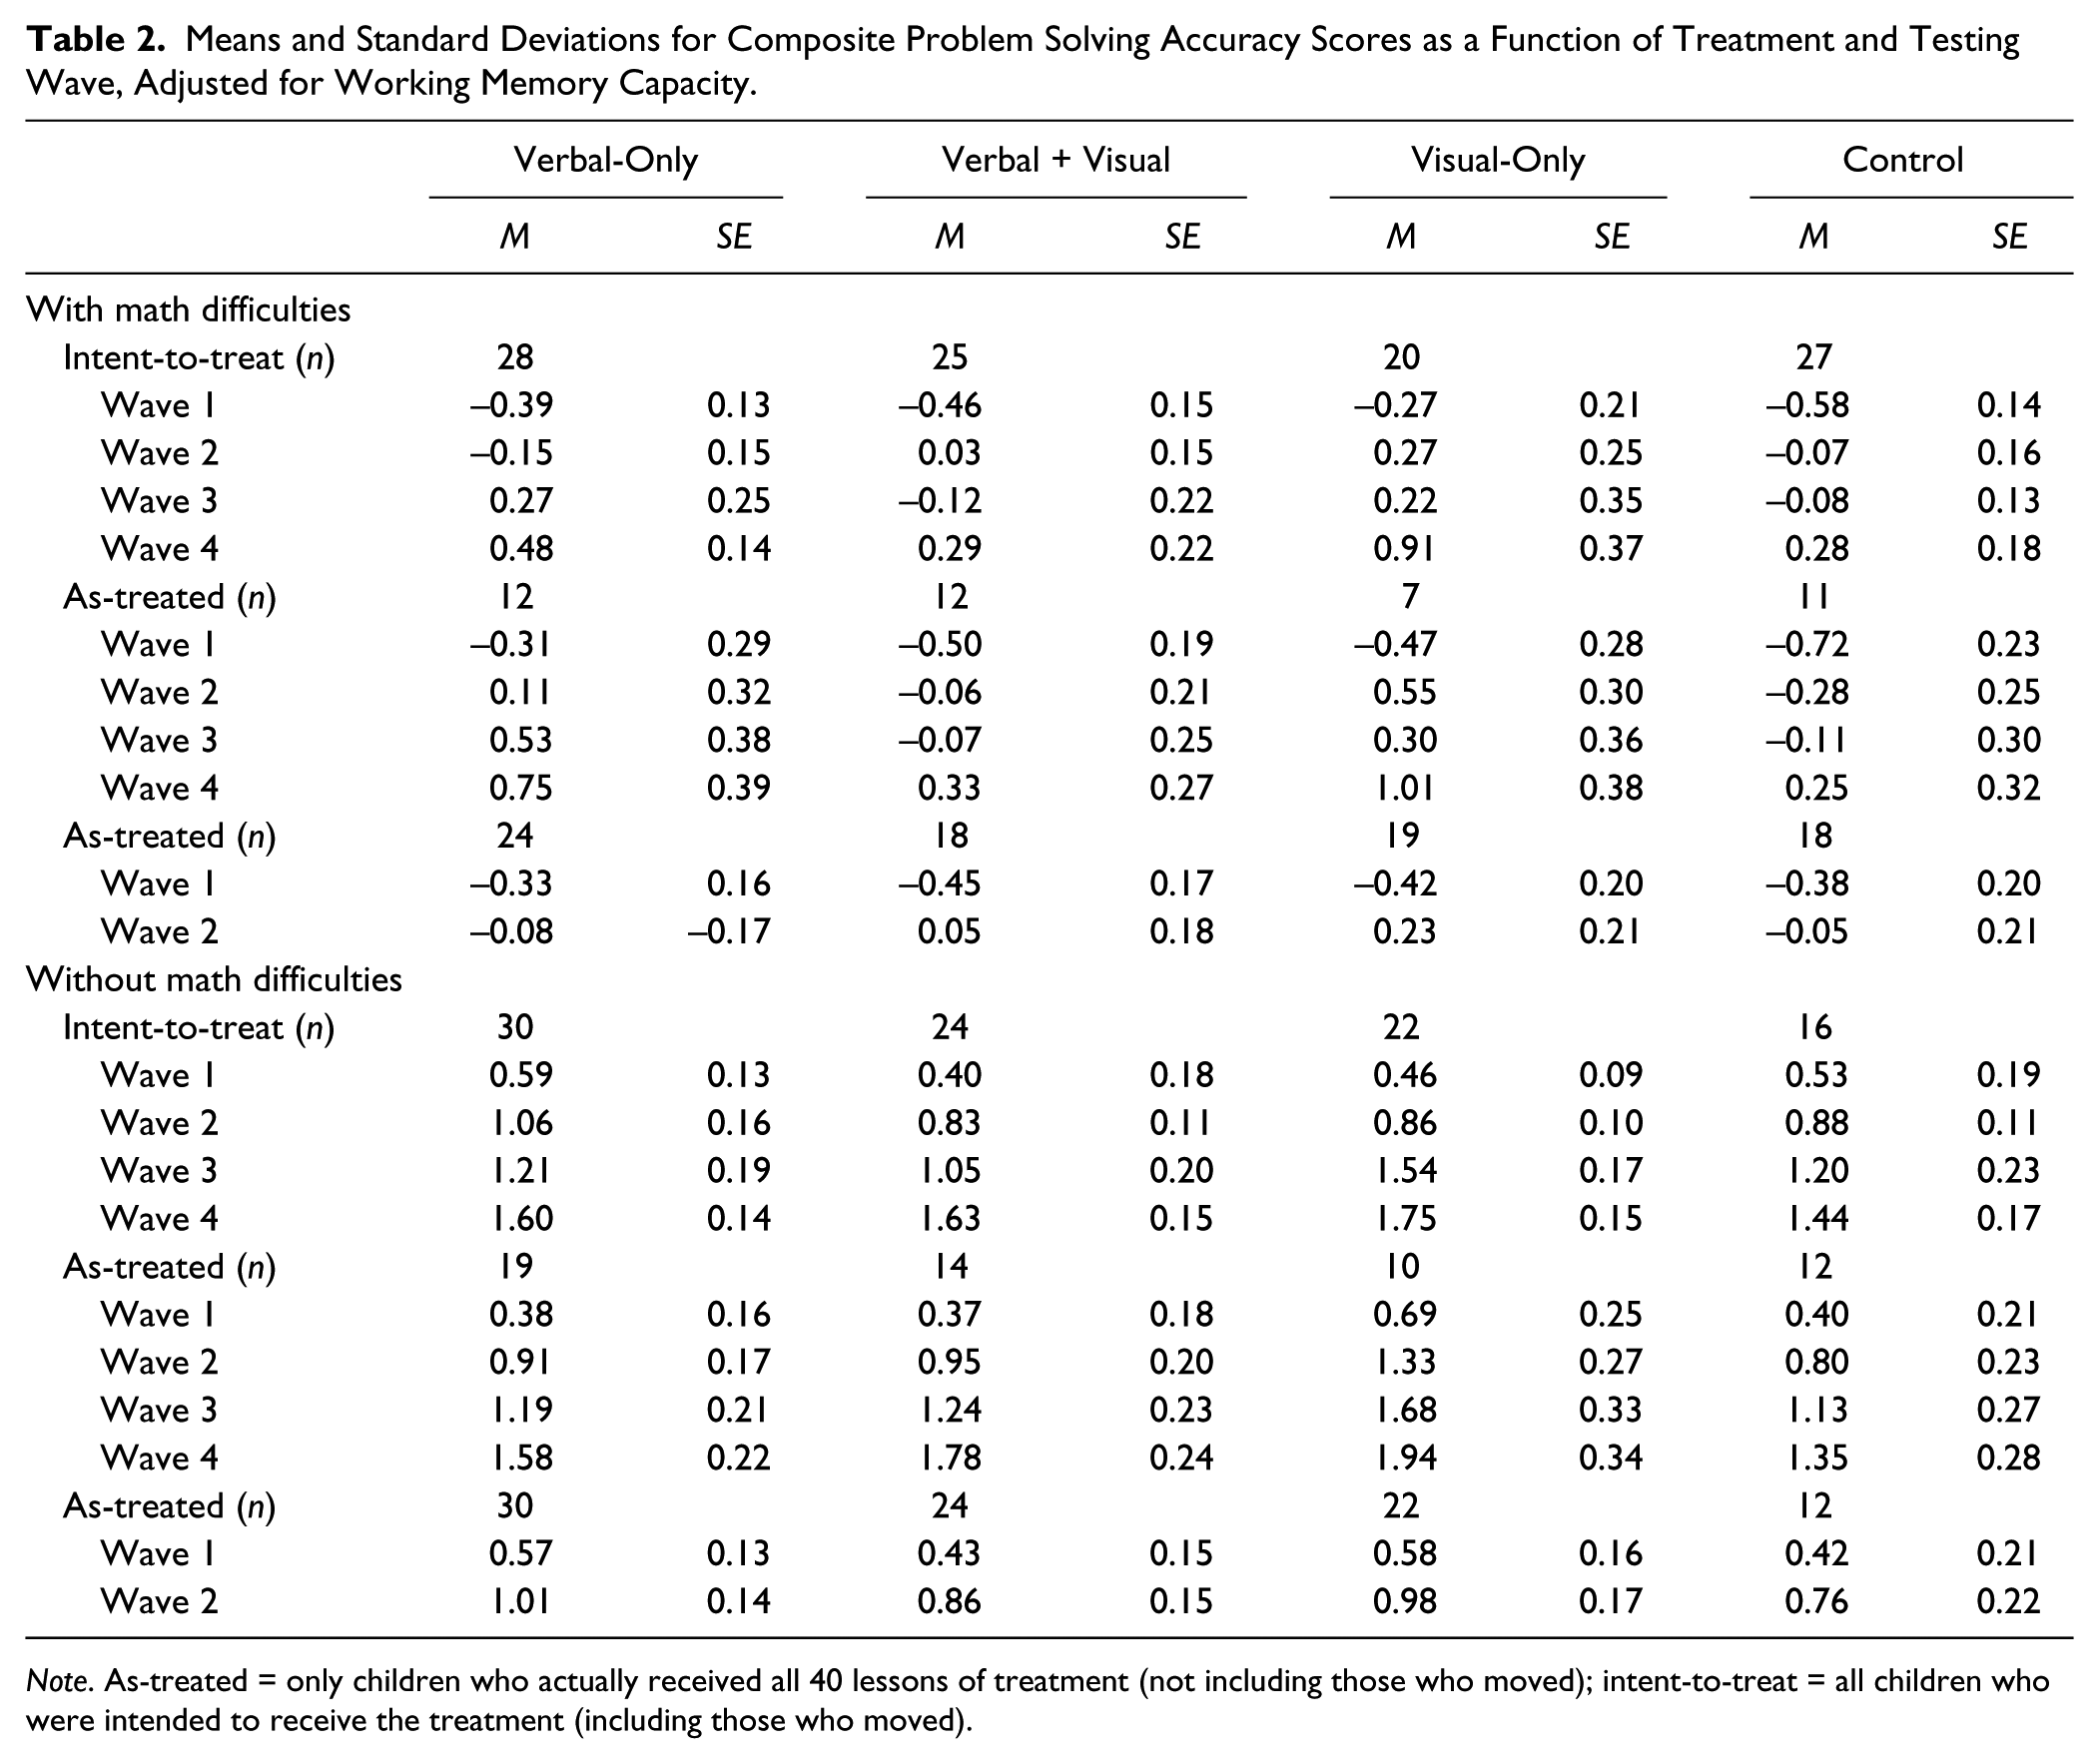
Note. As-treated = only children who actually received all 40 lessons of treatment (not including those who moved); intent-to-treat = all children who were intended to receive the treatment (including those who moved).
Although the participating children were randomly assigned to each of the different strategy conditions within each classroom, a number of other controls were built into the implementation of the intervention. To control for the impact of the graduate student tutors that implemented the interventions, all tutors were randomly rotated across days of the week and across treatment conditions, so that no one intervention group received instruction from the same graduate tutor each time (e.g., “Tutor 1” might give Strategy A in the morning time slot on Monday, but then “Tutor 2” presented the next Strategy A lesson to the same children during that time slot on Wednesday).
Children were tested at four time periods. The first time period (Wave 1) served as a pretest and occurred in late fall of Year 1. The second time period of testing (Wave 2) occurred 2 weeks after the 20 sessions had been completed (spring of Year 1). Children were located after summer vacation in the fall of Year 2 (Wave 3) and administered the same battery of tests again. There was approximately a 3-month break between testing at Time 2 (Wave 2) and Time 3 (Wave 3). Testing at Time 4 (Wave 4) was administered 2 weeks after completing the second round of 20 intervention sessions in spring of Year 2. Children were maintained in the same treatment groupings (groupings created within classrooms during Year 1) in the second year as those used in the first year of the study.
Common instructional conditions
All children in the study participated with their peers in their homerooms on tasks and activities related to the districtwide math school curriculum. All the study’s participants interacted with their peers in their homerooms on tasks and activities related to the districtwide math curriculum. The schoolwide instruction across conditions was the enVisionMATH learning curriculum (Pearson, 2009). The curriculum included visual representations to show how quantities of a word problem were related and general problem solving steps. The general problem solving steps in the teachers’ manuals were to have children (a) understand, (b) plan, (c) solve, and (d) look back. An independent evaluation (Resendez & Azin, 2008) indicated in random trials (teachers assigned randomly to treatment or control condition) that gains emerged in second to fourth grade, following guidelines outlined by the What Works Clearinghouse standards (U.S. Department of Education, Institute of Education Sciences, 2008), with effect sizes relative to control condition in the 0.20 range. A number of the enVisionMATH curriculum’s elements were also utilized in our treatments (e.g., find the keyword). However, in contrast to the school district’s required instruction, our treatment conditions directly focused on specific components of problem solving over consecutive sessions presented in a predetermined order. In addition, the lesson plans for the experimental condition focused directly on the propositional structure of word problems.
Experimental conditions
Each experimental treatment condition (verbal-only, verbal + visual, visual-only) included scripted lessons. Year 1 (testing Waves 1 and 2) and Year 2 (testing Waves 3 and 4) each included 20 scripted lessons administered over 8 weeks (40 lessons over 16 weeks). Each lesson was 30 min in duration and was administered two to three times per week in small groups of four to five children. Lesson administration was done by one of six tutors (doctoral students or certified teachers). Children were presented with individual booklets at the beginning of the lesson, and all responses were recorded in the booklet. Each lesson within the booklet consisted of four phases: warm-up, instruction, guided practice, and independent practice.
The warm-up phase included two parts: calculation of problems that required participants to provide the missing numbers (9 + 2 = x; x + 1 = 6; x - 5 = 1) and a set of puzzles based on problems using geometric shapes. This activity took approximately 3 to 5 min to complete.
The instruction phase lasted approximately 5 min. At the beginning of each lesson, the strategies and/or rule cards were either read to the children (e.g., to find the whole, you need to add the parts) or reviewed. (Across the 20 lessons, 7 rules were presented.) Depending on the treatment condition, children were taught the instructional intervention (verbal-only strategy, visual-only strategy, or verbal strategy + visual strategy). The steps for the verbal-only strategy approach asked children to find the question and underline it, circle the numbers, put a square around the keyword, cross out information not needed, decide on what needs to be done (add/subtract/or both), and solve it. For the visual-only strategy condition children were taught how to use two types of diagrams. The first diagram represented how parts made up a whole. The second type of diagram represented how quantities are compared. The second diagram consisted of two empty boxes, one bigger and the other smaller. Children were asked to fill in the correct numbers representing the quantities in the boxes. An equation with a question mark was presented. The question mark acted as a placeholder for the missing number provided in the box. Finally, for the combined verbal + visual strategy condition, an additional step (diagramming) was added to the six verbal-only strategy steps described above. This step included directing children to fill in the diagram with given numbers and identify the missing numbers in the corresponding slots in the boxes.
Clearly, all strategies include some verbal and visual components, but in a different mix. No doubt, the term visual-only strategies may be a misnomer; however, because these treatments included diagrams (as illustrated in the appendix), we assumed our labeling provided some distinction between the conditions that did not use diagrams. Clearly, all conditions included some aspects of verbal and visual information; however, for separation purposes we defined the conditions with diagrams as emphasizing pictorial visual information.
The third phase, guided practice, lasted 10 min and involved children working on three practice problems. Tutor feedback was provided on the application of steps and strategies to each of these three problems. In this phase, children also reviewed problems from the examples from the instructional phase. The tutor assisted the children with finding the correct operation, identifying the keywords, and providing corrective feedback on the solution.
The fourth phase, independent practice, lasted 10 min of the session and required children to independently answer another set of three word problems without feedback. If the children finished the independent practice tasks before 10 min was over, they were presented with a puzzle to complete. The children’s responses were recorded for each session to assess the application of the intervention and problem solving accuracy.
Sentence load
Word problems for each independent practice session included three parts: question sentences, number sentences, and irrelevant sentences. For each problem in the independent practice session, at least two number sentences were relevant to problem solution and one sentence served as the question sentence. The number of irrelevant sentences, however, gradually increased across the sessions. A sample problem with three irrelevant sentences (used in Lesson 12) was,
There is an ocean fish exhibit at the aquarium. Lots of kids visited it last weekend. The cost of the ticket was $3. There were 20 blue fin tuna. There were also 15 hammerhead sharks. How many fish are there in the exhibit in all?
For Year 1 and Year 2, the number of sentences of each problem across lessons were as follows: Lessons 1 through 7 focused on four sentence-long word problems (4 sentences that included 1 irrelevant sentence), Lessons 8 and 9 focused on five sentence-long word problems (5 sentences that included 2 irrelevant sentences), Lessons 10 through 15 focused on six sentence-long word problems (6 sentences that included 3 irrelevant sentences), Lessons 16 and 17 focused on seven sentence-long word problems (7 sentences that included 4 irrelevant sentences), and Lessons 18 through 20 focused on eight sentence-long word problems (8 sentences that included 5 irrelevant sentences).
Treatment fidelity
Independent evaluations were administered to determine treatment fidelity. During the lesson sessions, tutors were randomly evaluated by independent observers (a postdoctoral student, a doctoral student, or the project director). The observers independently filled out evaluation forms covering all segments of the lesson intervention. Points were recorded on the accuracy of the tutor’s implementation of the instructional sequence based off a rubric. Observations of each tutor occurred for six sessions randomly distributed across instructional sessions. Interrater agreement was calculated on all observation categories. Tutors following each step of strategy implementation (10 observable treatment specific items were coded) and yielded individual scores above 98% (SD = 0.41) across all sequences and conditions.
Tasks and Materials
The battery of group and individually administered tasks is described below. All tasks, except for measures of reading, fluid intelligence, and WMC, were administered across the four testing waves (time periods). All subtests and tasks were administered as per the technical manuals. Presentation orders were counterbalanced within each testing wave and across the four testing waves. Form A and Form B were used and counterbalanced for order where available or created when not available (with only numbers and names changed). The sample reliabilities are reported in Table 1.
In our study, we attempted to focus on those children who had difficulties on word problems given that their reading and calculation skills were in the average range. We also wanted to eliminate the possibility that lower overall ability in the group with MD played a role in outcomes. Thus, children who had fluid intelligence, reading, and calculation abilities in the average range were selected.
Fluid intelligence
Fluid intelligence was assessed with the Colored Progressive Matrices (Raven, 1976). Children were given a booklet with patterns displayed on each page; each pattern revealed a missing piece. After the introduction of the first matrix, children completed the booklets at their own pace. Patterns progressively increased in difficulty. The dependent measure (range = 0–36) was the number of problems solved correctly, which yielded a standardized score (M = 100, SD = 15).
Word problems
Two measures of story problems were administered to assess word problem solving accuracy across the four time periods: KeyMath (Connolly, 1998) and the CMAT (Hresko et al., 2003). Subtests from these measures yielded a scale score (M = 10, SD = 3). In contrast, the TOMA (Brown et al., 1994) was used to separate children into groups with and without MD. The technical manual for these subtests reported adequate reliabilities (>.86) and moderate correlations (rs > .50) with other math standardized tests (e.g., the Stanford Diagnostic Mathematics Test). Raw scores were used as criterion measures to assess treatment effects.
Word recognition
Word recognition was assessed with the Reading subtest of the WRAT (Wilkinson, 1993). The task provided a list of words of increasing difficulty. The dependent measure was the number of words read correctly.
Reading comprehension
Reading comprehension was assessed with the Passage Comprehension subtest from the Test of Reading Comprehension (TORC; Brown et al., 1995). The purpose of this task was to assess the child’s comprehension of topic or subject meaning during reading activities. The dependent measure was the number of questions answered correctly.
Arithmetic computation
The Arithmetic subtests from the WRAT (Wilkinson, 1993) and the WIAT (Psychological Corporation, 1992) were administered. Both subtests required written computation to problems that increased in difficulty. The dependent measure was the number of problems correct, which yielded a standard score (M = 100, SD = 15).
Working memory
Three WM tasks were administered that required children to hold increasingly complex information in memory, while responding to a question about the task. The questions served as distracters to item recall because they reflected the recognition of targeted and closely related nontargeted items. A question was asked for each set of items, and the tasks were discontinued if the question was answered incorrectly or if all items within a set could not be remembered. For this study, two WM tasks were administered (Conceptual Span and Auditory Digit Sequence) that followed this format. A third WM task, referred to as Updating, was also administered. Previous studies (Swanson, 1992, 1995; Swanson, Ashbaker, & Lee, 1996) with different samples established the reliability and the construct validity of these measures with the Daneman and Carpenter (Daneman & Carpenter, 1980; Just & Carpenter, 1992) measure. Previously reported reliability estimates vary from .80 to .95 (Swanson, 1995; Swanson & Beebe-Frankenberger, 2004). A composite score (mean z score) across these three tasks was used as our measure of WMC. The sample reliability for this composite score is reported in Table 1. A brief description is provided below for each of these tasks.
The Conceptual Span task assessed the child’s ability to organize sequences of words into abstract categories (Swanson, 1992; Swanson & Beebe-Frankenberger, 2004). The child was presented a set of words (one every 2 s), asked a discrimination question, and then asked to recall the words that “go together.” For example, a set might include the following words: “shirt, saw, pants, hammer, shoes, nails.” The child was directed to retrieve the words that “go together” (i.e., shirt, pants, and shoes; saw, hammer, and nails). The discrimination question was, “Which word, ‘saw’ or ‘level,’ was said in the list of words?” Thus, the task required participants to transform information encoded serially into categories during the retrieval phase. The range of set difficulty was two categories of two words to five categories of four words. The dependent measure was the highest set recalled correctly (range = 0–8) in which the process question was answered correctly.
Auditory Digit Sequence is a subtest from the Swanson-Cognitive Processing Test (Swanson, 1995) and assessed the child’s ability to remember numerical information embedded in a short sentence (Swanson, 1992; Swanson & Beebe-Frankenberger, 2004). Before stimulus presentation, the child was shown a card depicting four strategies for encoding numerical information to be recalled. The pictures portrayed the strategies of rehearsal, chunking, association, and elaboration. The experimenter described each strategy to the child before administration of targeted items. After all of the strategies were explained, the child was presented numbers in a sentence context. For example, Item 3 states, “Now suppose somebody wanted to have you take them to the supermarket at 8 6 5 1 Elm Street?” The numbers were presented at 2-s intervals, followed by a process question, for example, “What was the name of the street?” Then, the child was asked to select a strategy from an array of four strategies that represented the best approximation of how he or she planned to practice the information for recall. Finally, the examiner prompted the child to recall the numbers from the sentence in order. No further information about the strategies was provided. Children were allowed 30 s to remember the information. Recall difficulty for this task ranged from 3 digits to 14 digits; the dependent measure was the highest set correctly recalled (range = 0–9) in which the process question was answered correctly.
An experimental Updating Task, adapted from Morris and Jones (1990), was also administered (Swanson & Beebe-Frankenberger, 2004). A series of one-digit numbers were presented that vary in set lengths of 3, 5, 7, and 9. No digit appeared twice in the same set. The examiner told the children that the length of each list of numbers might be 3, 5, 7, or 9 digits. Participants were then told that they should recall only the last three numbers presented. Each digit was presented at approximately 1-s intervals. After the last digit was presented the participants were asked to name the last three digits, in order. In contrast to the aforementioned WM measures that involved a dual-task situation where participants answered questions about the task while retaining information (words or numbers), the current task involved the active manipulation of information, such that the order of new information was added to or replaced the order of old information. That is, to recall the last three digits in an unknown (n = 3, 5, 7, 9) series of digits, the order of old information must be kept available (previously presented digits), along with the order of newly presented digits. The dependent measure was the total number of sets correctly repeated (range = 0–16).
Statistical Analysis
Children were drawn from 22 classrooms. Because the data reflected treatments of children nested within classrooms, a mixed ANCOVA model (HLM; Bryk & Raudenbush, 2002; Singer, 1998, 2002) was necessary to analyze treatment effects. The fixed and random effect parameter estimates were obtained using PROC MIXED in SAS 9.3 (SAS Institute, 2010). An autoregression covariance matrix was used to analyze the results because scores in each testing wave were correlated with the previous testing waves. The mixed ANCOVA analysis across the testing waves included as a covariate WMC. To provide an appropriate analysis of potential WMC interaction, three values (levels) of WMC were compared among treatment outcomes. These levels included the mean WMC value for the total sample (referred to as sample average; M = 0, SD = 1), followed by an analysis of low WMC values (WMC = -1.00 z score) and high WMC values (WMC = 1.00 z score). Each of these testing waves compared treatment outcomes across the testing waves adjusted by their WMC value. The advantage of this procedure was that WMC remained as a continuous variable. That is, cell sizes were too small for the children with MD if the sample were divided into high and low WMC groups.
The estimates for problem solving accuracy were based with full-information maximum likelihood, and utilized robust standard errors (Huber–White) to allow for the nonindependence of observations from children nested within teachers. The four testing waves (two in each year) represented the passage of time. Our initial analyses include two random effects: (a) variance related to classroom effects (intercepts) that included the nesting of interventions in Wave 1 and (b) variance related to treatments nested in Wave 3 (second-year classroom). Variance related to the second random effect was not significant and therefore was removed from the mixed ANOVA analysis. The intraclass correlation (ICC) was .08 (τ20 = .09 / Σ σ2 = .99) for problem solving accuracy. We calculated the design effect for Level 2 sampling using the formula N / 1 + (cluster size - 1) (1 - ICC) (Killip, Mahfoud, & Pearce, 2004), applied in this case to the outcome variable as 192 / 1 + (22 - 1) (1 - .08), therefore 192 / 20.32 = 9.44. Although there are different power assumptions (increased ICC), the overall conclusion was that there was a sufficient sample at Level 2 (n = 22 classrooms) for this study.
Because we experienced loss in our sample in Year 2 because children moving out of the schools, a full maximum likelihood (ML) estimation was used to handle missing data (see Peugh & Enders, 2004, for a discussion). The procedure allowed for analysis of an incomplete data set, using data from all participants with at least two data time points, as it derives parameters and estimates in a two-step iterative manner. Therefore the advantage of this estimation was that it provided valid estimates in spite of nonrandomly missing data for our small sample size within cells (for discussion of ML and sample size, see Snijders & Bosker, 1999, pp. 52–53, 175). Thus, in this randomized trial study, our intention-to-treat analysis assumed that our missing data were completely at random. However, Frangakis and Rubin (1999) suggested this kind of analysis may be subject to biased estimates of treatment effects. Thus, to accommodate this issue, a comparison in treatment effects was made between children who were intended to receive treatment (intent-to-treat) and those who completed (as-treated) all 40 sessions across the four testing waves.
Results
Table 2 shows the accuracy scores for the problem solving measures as a function of each testing wave. Composite scores were created for solution accuracy for problem solving accuracy (KeyMath and CMAT). For comparison purposes, all raw scores were converted to z scores. Waves 2, 3, and 4 (testing Times 2, 3, and 4) z scores were based on the mean and standard deviation at Wave 1 (Time 1). As shown in Table 2, the intent-to-treat estimates included all intervention participants as well as estimates across all testing waves. The “as-treated” estimates included either those participants who participated in all interventions sessions across all testing waves in Years 1 and 2 or just those participants who participated in both testing waves in Year 1.
Year 1
Wave 1
Composite scores for problem solving accuracy (KeyMath and CMAT) at Wave 1 for the total sample were compared as a function of treatment conditions. A 2 (ability group: MD vs. NMD) × 4 (treatment) MANOVA (with random effects for classroom) was computed on the composite word problem solving measure. As expected because of selection criteria, the MANOVA was significant for ability group, Λ = .68, F(1, 166) = 78.05, p < .001. However, no significant effects occurred for treatment, Λ = .99, F(3, 166) = 0.14, p = .93, or for the Ability Group × Treatment interaction, Λ = .99, F(3, 166) = 0.31, p = .82.
A MANOVA was also computed for the composite WMC score (Updating, Auditory Digit Sequence, and Conceptual Span) scores. The MANOVA was significant for ability group, Λ = .87, F(1, 161) = 22.88, p < .001, but not for treatment, Λ = .99, F(3, 161) = 0.09, p = .96, or the Ability Group × Treatment interaction, Λ = .99, F(3, 161) = 0.37, p = .77. Thus, because no significant differences related to treatment or the Ability Group × Treatment interactions occurred at Wave 1, Wave 1 was not a covariate in the subsequent analyses.
Sample retention
As noted, sample size was reduced between waves. Thus, we compared the retained (intent-to-treat) and nonretained (as-treated) sample on the criterion measure. A 2 (ability group) × 2 (retained vs. nonretained) × 4 (treatment) MANOVA was computed on problem solving accuracy scores at Wave 1. Although the MANOVA was significant for ability group, Λ = .89, F(1, 161) = 18.56, p < .001, no other significant effects emerged, all ps > .05. Thus, we assume score differences between retained and nonretained children at Wave 1 were random.
Because we experienced some reduction in the sample even at Wave 2, the retained and nonretained sample was again compared, but this time across Waves 1 and 2. A 2 (ability group) × 4 (treatment) × 2 (wave: Wave 1 vs. Wave 2) mixed ANCOVA with repeated measures on the last factor was computed. WMC was the covariate and the random effects were children nested within classrooms. A significant main effect occurred for ability group, F(1, 151) = 51.82, p < .001, testing wave, F(1, 151) = 82.05, p < .001, and the WMC covariate, F(1, 151) = 13.26, p < .0004. A significant effect also occurred for the WMC × Treatment × Ability Group interaction, F(3, 151) = 3.03, p < .03, as well as the WMC × Treatment × Ability Group × Testing Wave interaction, F(3, 151) = 3.21, p = .025. No other significant effect occurred, all ps > .05. The mean scores for these analyses are shown in Table 2.
As shown in Table 2, the general pattern of the results was that children without MD outperformed children with MD and Wave 2 scores were higher than Wave 1. These results were qualified by the significant interactions. As a follow-up to the significant interactions, simple effects at Waves 1 and 2 were computed. For Wave 1, a significant effect occurred for ability group, F(1, 151) = 93.88, p < .05, and the WMC covariate, F(1,151) = 13.02, p < .001. No other significant treatment effects or interactions occurred, all ps > .50. In contrast, a significant effect occurred for the WMC × Treatment × Ability Group interaction, F(4, 151) = 3.66, p = .007, as well as for ability group status, F(1, 151) = 88.75, p < .001, and the WMC covariate F(1, 151) = 9.58, p = .002, for Wave 2 scores.
To provide an appropriate analysis of the unequal slopes in Wave 2 (as reflected in the interaction between WMC × Treatment × Ability Group), the level of WMC was set to 1.00 standard deviation above the mean (z = +1.00) and 1.00 standard deviation (z = -1.00) below the mean scores for the total sample. Figure 1 shows the mean problem solving accuracy scores for each WMC level (low, high, and sample average) as a function of treatment condition. When treatment effects were made conditional on the overall WMC sample average, no significant treatment effects occurred for children with MD, F(3, 141) = 0.56, p = 64, or for children without MD, F(3, 141) = 0.52, p = .67. However, when WMC was set to a low level significant treatment effects occurred for children with MD, F(3, 141) = 3.31, p = .02, but not children not without MD, F(3, 141) = 1.33, p = .26 . Likewise, when treatment effects were made conditional on setting WMC to a high level, treatment effects approached significance for children with MD, F(3, 141) = 2.42, p = .06, but not children without MD, F(3, 141) = 0.71, p = .26. A Tukey test was computed comparing treatments within the MD group. As shown in Figure 1 for children with MD, a significant disadvantage (p < .05) was found for the visual-only condition at the low WMC level (visual-only < verbal-only = verbal + visual = control), but a performance advantage was for the visual-only condition when WMC was set to a high level (visual-only > verbal-only = verbal + visual = control). This latter finding must be qualified because the overall treatment effect for children with MD when WMC was set to a high level was not significant (α = .067).
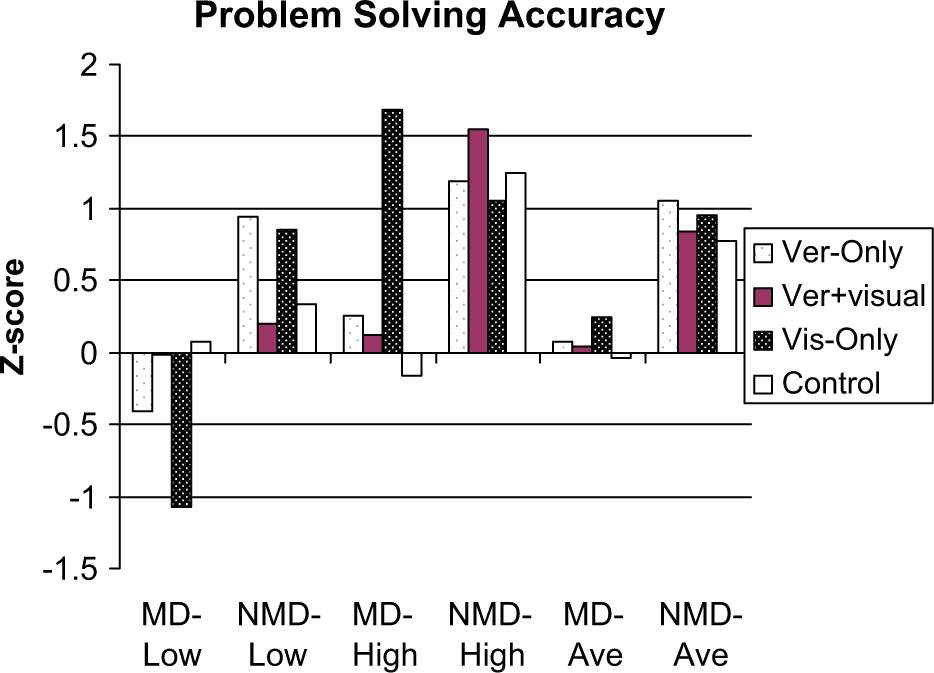
Wave 2 word problem solving accuracy as a function of treatment ability group when set to low WMC, high WMC, and sample average WMC.
Although children without MD in general outperformed children with MD within treatment conditions, no significant ability group differences were found when WMC was set to a low level for the verbal + visual condition, F(1, 141) = 0.27, p = .60, or the control condition, F(1, 141) = 0.23, p = .63. Likewise, when WMC was set to a high level, no significant differences occurred between ability groups within the visual-only condition, F(1, 141) = 1.14, p = .28, or the verbal-only condition, F(1, 141) = 3.02, p = .08.
In summary, the important findings were that treatment effects for children with MD were conditional on the level of WMC. The results suggest some advantages for the visual-only condition relative to the other conditions when WMC was set to a high level, but this finding did not meet a conventional alpha level of significance. Regardless of WMC level, no significant treatment effects occurred for children without MD. Although children without MD clearly out performed children with MD at Wave 1 across all treatment conditions, accuracy scores were statistically comparable between children with and without MD at Wave 2 on isolated treatment conditions.
Year 1 and Year 2 Growth
Intent-to-treat
Table 2 shows the mean estimates for problem solving accuracy for the intent-to-treat analysis across all testing waves. A 2 (ability group) × 4 (treatment) × 4 (testing wave) mixed ANOVA was computed on problem solving accuracy. The covariate in the model was WMC. A significant effect was found for ability group F(1, 447) = 114.73, p < .001, testing wave, F(3, 447) = 273.42, and WMC, F(1, 447) = 24.63, p < .001. As expected children without MD outperformed children with MD (M = 1.06, SE = 0.09 vs. M = 0.04, SE = 0.10), and scores were higher in Wave 4 than in the earlier testing waves (Wave 1 M = 0.03, Wave 2 M = 0.46, Wave 3 M = 0.66, and Wave 4 M = 1.08). There were a number of significant interactions. The two-way interactions were significant for Treatment × Testing Wave, F(9, 447) = 4.72, p < .001, Ability Group × Testing Wave, F(3, 447) = 2.95, p = .03, WMC × Ability Group, F(1, 447) = 5.67, p = .017. The four-way interaction was also significant, WMC × Combine × Testing Wave × Ability Group, F(10, 447) = 30.13, p < .001, as were the three-way interactions for Treatment × Testing Wave × Ability Group, F(9, 447) = 129.87, p < .001, and WM × Treatment × Testing Wave, F(9, 447) = 50.63, p < .001. No other significant effects (ps > .05) occurred.
To simplify the discussion of these interactions, the analysis of treatment effects were made conditional on setting WMC to high and low levels. The differences in mean problem solving scores when setting treatment outcomes to high or low WMC levels are shown in Table 3. Difference scores greater than 1.0 are in bold. As shown in Table 3, positive difference scores in bold (score favored setting WMC to a high level) were more frequent in the visual-only condition for children with MD and for the verbal + visual condition for children without MD when compared to the other conditions.
Accuracy Scores for the Intent-to-Treat Sample as a Function of Treatment, Testing Wave, and Ability Group Condition After Setting Working Memory Capacity to High and Low Levels on Word Problems.
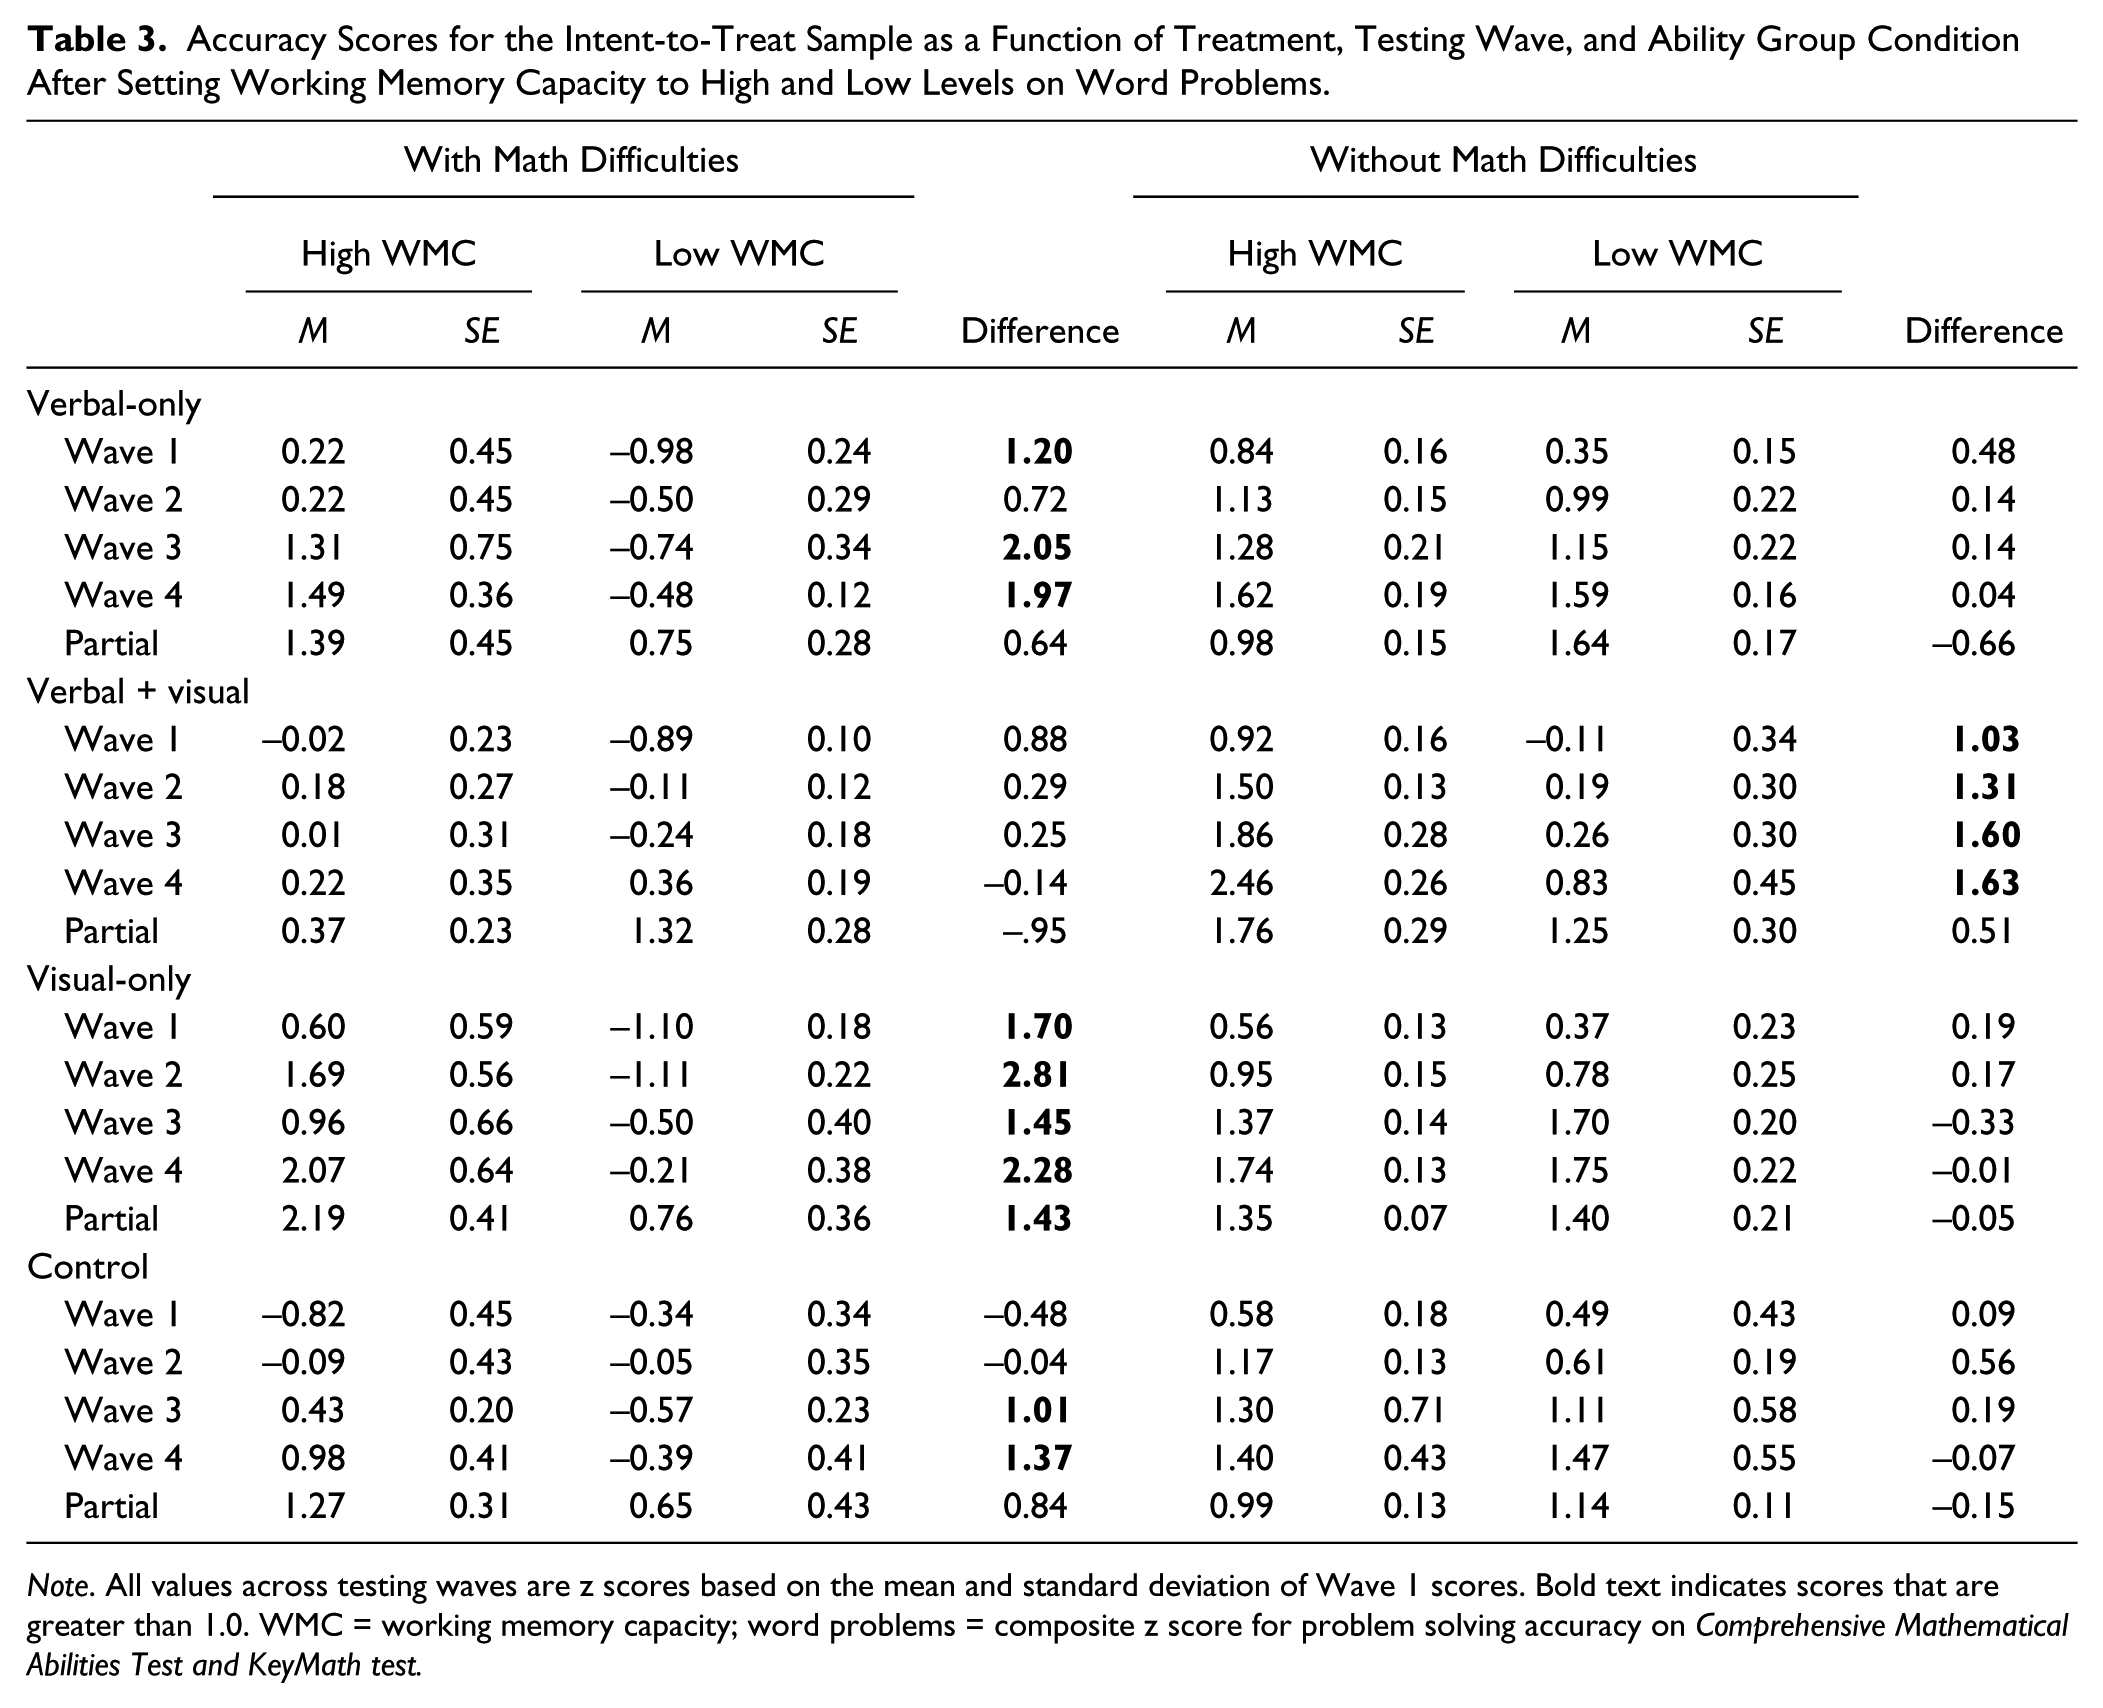
Note. All values across testing waves are z scores based on the mean and standard deviation of Wave 1 scores. Bold text indicates scores that are greater than 1.0. WMC = working memory capacity; word problems = composite z score for problem solving accuracy on Comprehensive Mathematical Abilities Test and KeyMath test.
Figure 2 plots problem solving accuracy performance when WMC was set to a high level, and Figure 3 plots problem solving accuracy performance when WMC was set to a low level. Panel a in both figures shows the problem solving performance of children with MD, and Panel b in both figures shows the problem solving performance of children without MD. As shown in Panel a for Figures 2 and 3, the aforementioned interactions related to testing waves are clearly reflected in children with MD. There were substantial drops in performance from Wave 2 to Wave 3 in accuracy scores as a function of treatment conditions. In contrast, as shown in Panel b, children without MD showed steady increases in performance across the testing waves.
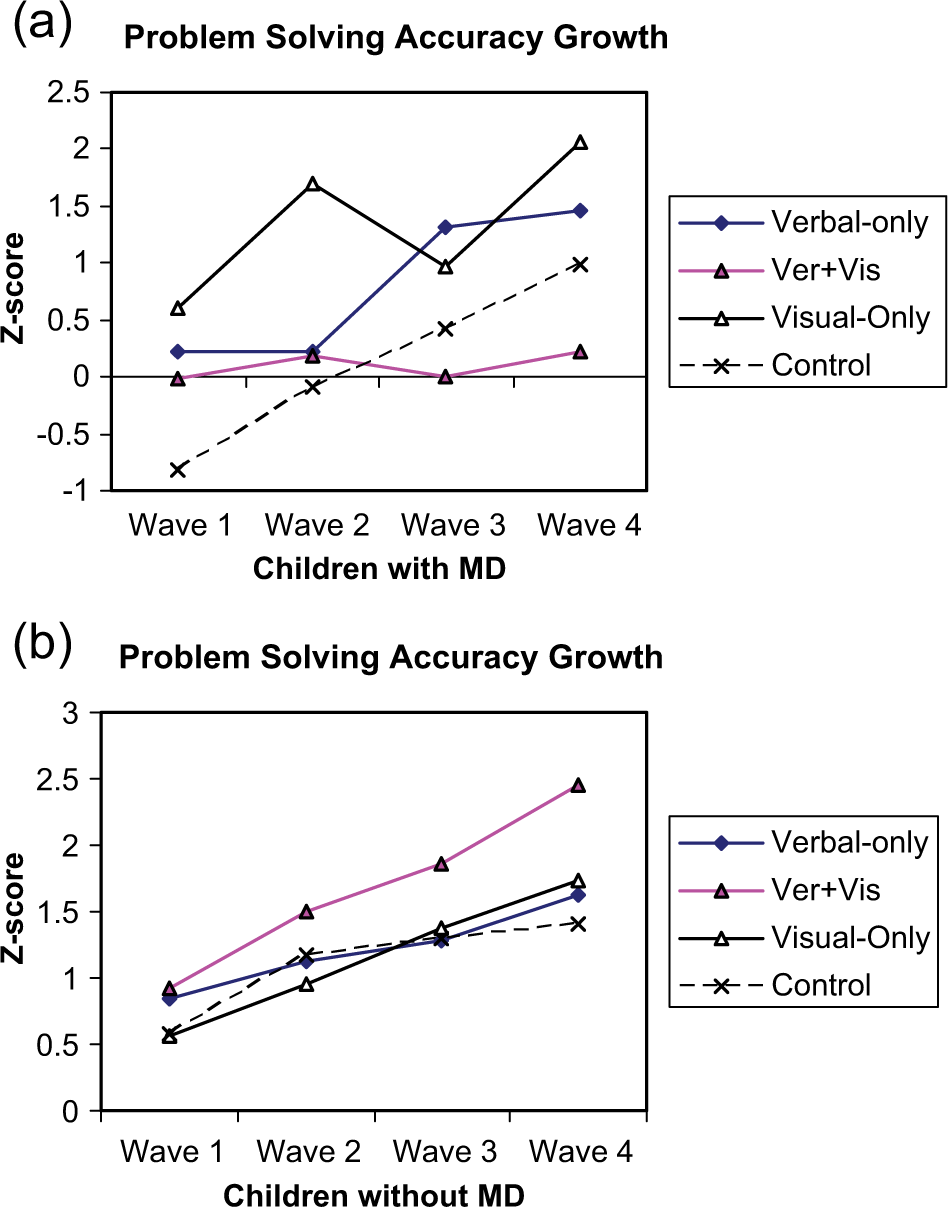
Problem solving accuracy of children conditional on high working memory capacity. (a) Problem solving ability of children with MD conditional on high working memory capacity. (b) Problem solving ability of children without MD conditional on high working memory capacity.

Problem solving accuracy of children conditional on low working memory capacity. (a) Problem solving ability of children with MD conditional on low working memory capacity. (b) Problem solving ability of children without MD conditional on low working memory capacity.
Figures 2 and 3 also show the important outcomes on the last testing wave (Wave 4). Figure 2 (Panel a) shows that children with MD performed better in the visual-only condition relative to the other conditions when WMC was set to a high level. Panel a in Figure 3 also shows better performance for the verbal + visual condition when compared to the other conditions when WMC was set to a low level. In contrast, for children without MD when WMC was set to a high level, an advantage at Wave 4 was found for the verbal + visual condition (see Panel b, Figure 2). When WMC was set to a low level, Panel b in Figure 3 shows that none of the strategy treatment conditions exceeded the control condition.
Recall that the previous analyses at Year 1 and Wave 2 showed no significant advantages in strategy conditions relative to control conditions. Although there was a pattern showing some advantages for children with MD for the visual-only condition when WMC was set to a high level, the results were not significant. In addition, no treatment advantages relative to the control condition were found for children without MD. Thus, as a follow-up, the next set of analyses focused on the treatment effects at Wave 4.
The treatment effects across the eight groups (MD + NMD × four treatment conditions) at Wave 4 were significant when WMC was set to a high level, F(7, 447) = 7.18, p < .001, and low level, F(7, 447) = 70.06, p < .0001. When treatment conditions were made conditional on setting WMC to a high level, a Tukey test indicated a significant (ps < .05) advantage for the visual-only condition for children with MD (visual-only > verbal-only > control > verbal + visual). In addition, a significant advantage occurred for the verbal + visual condition for children without MD when compared to the other conditions (verbal + visual > visual-only = verbal-only = control).
When treatment outcomes were made conditional on setting WMC demands to a low level, a significant (ps < .05) effect in favor of the verbal + visual condition occurred for children with MD (verbal + visual > verbal-only = visual-only = control). None of the strategy conditions exceeded the control condition for children without MD when WMC was set to a low level (visual-only = verbal-only = control > verbal + visual).
Because performance outcomes at Wave 4 may have more to do with Wave 1 performance than WMC, Wave 4 was reanalyzed by adding Wave 1 as a covariate. The partialed scores at Wave 4 are shown in Table 2. A significant treatment effect occurred when WMC was set at the high level, F(7, 446) = 37.62, p < .001, and at the low level, F(7, 446) = 4.07, p < .001. At the high WMC level, a Tukey test again indicated a significant (ps < .05) effect in favor of the visual-only condition for children with MD (visual-only > verbal-only = control > verbal + visual) and an advantage for both the verbal + visual and the visual-only condition for children without MD (verbal + visual = visual-only > verbal-only = control). At the low WMC level, a significant (ps < .05) effect was found for both children with MD (verbal + visual > visual-only = control = verbal-only), but not for children without MD (visual-only = verbal-only = control = verbal + visual). Thus, the results were comparable to the previous analysis not controlling for Wave 1 performance.
In summary, the important findings were that an advantage was found for the visual-only condition for children with MD when WMC was set to a high level. Although some advantages were found for the verbal + visual condition relative to the other conditions for children with MD when WMC was set to a low level, scores at the low level were substantially lower than when set to a high level (see Table 2).
As-treated
Although we found no ostensible bias between retained and not retained students, a 2 (ability group) × 4 (treatment) × 4 (waves) mixed ANCOVA was computed on participants who received the complete treatment regiment. WMC was the covariate in the analysis. A significant effect was found for ability group F(1, 290) = 113.68, p < .001, treatment, F(3, 290) = 2.86, p = .03, testing wave, F(3, 290) = 300.22, p < .001, and WMC, F(1, 290) = 14.67, p < .001. As expected, children without MD outperformed children with MD (M = 1.02, SE = 0.14 vs. M = -0.05, SE = 0.12), and scores were higher in Wave 4 than in the earlier testing waves (Wave 1 M = -0.13, Wave 2 = 0.42, Wave 3 = 0.62, and Wave 4 = 1.01). As in the intent-to-treat analysis, a number of significant interactions emerged. The main effect for treatment shows an advantage for the visual-only condition (M = 0.66, SE = 0.17) when compared to the verbal-only (M = 0.45, SE = 0.16), verbal + visual (M = 0.36, SE = 0.17), and control conditions (M = 0.45, SE = 0.13). These results were qualified by the interactions. The two-way interactions were significant for Treatment × Testing Wave, F(9, 290) = 14.54, p < .001, Ability Group × Testing Wave, F(3, 290) = 3.89, p = .009, and WMC × Ability Group, F(1, 290) = 5.80, p = .017. The four-way interaction was significant, WMC × Combine × Testing Wave × Ability Group, F(10, 290) = 146.92, p < .001, as were the three-way interactions for Treatment × Testing Wave × Ability Group, F(9, 290) = 85.74, p < .001, and WMC × Treatment × Testing Wave, F(9, 290) = 10.87, p < .001. No other significant effect (ps > .05) occurred.
To simplify the analysis of the interactions, a focus was placed on Wave 4 and the treatment outcomes that were made conditional on setting WMC to high and low levels. The Wave 4 scores are shown in Table 4. A significant treatment effect was found at the high WMC level, F(7, 290) = 7.97, p < .001, and low WMC level, F(7, 290) = 75.40, p < .001. At the high WMC level, a Tukey test indicated a significant (ps < .05) effect in favor of the visual-only condition for children with MD (visual-only > verbal-only = control > verbal + visual) and an advantage for the verbal + visual condition for children without MD (verbal + visual > visual-only > verbal-only = control). At the low WMC level, a significant (ps < .05) effect was found for children with MD that favored the verbal + visual condition (verbal + visual > visual-only = control = verbal-only). None of the strategy conditions exceeded the control condition for children without MD when treatment effects were made conditional on setting WMC to the low level (visual-only = control > verbal + visual = verbal-only).
As-Treated Sample for Adjusted Wave 4 Shown for Accuracy (z scores) as a Function of High and Low WMC Groups, Ability Groups, and Treatment Conditions on Word Problems.
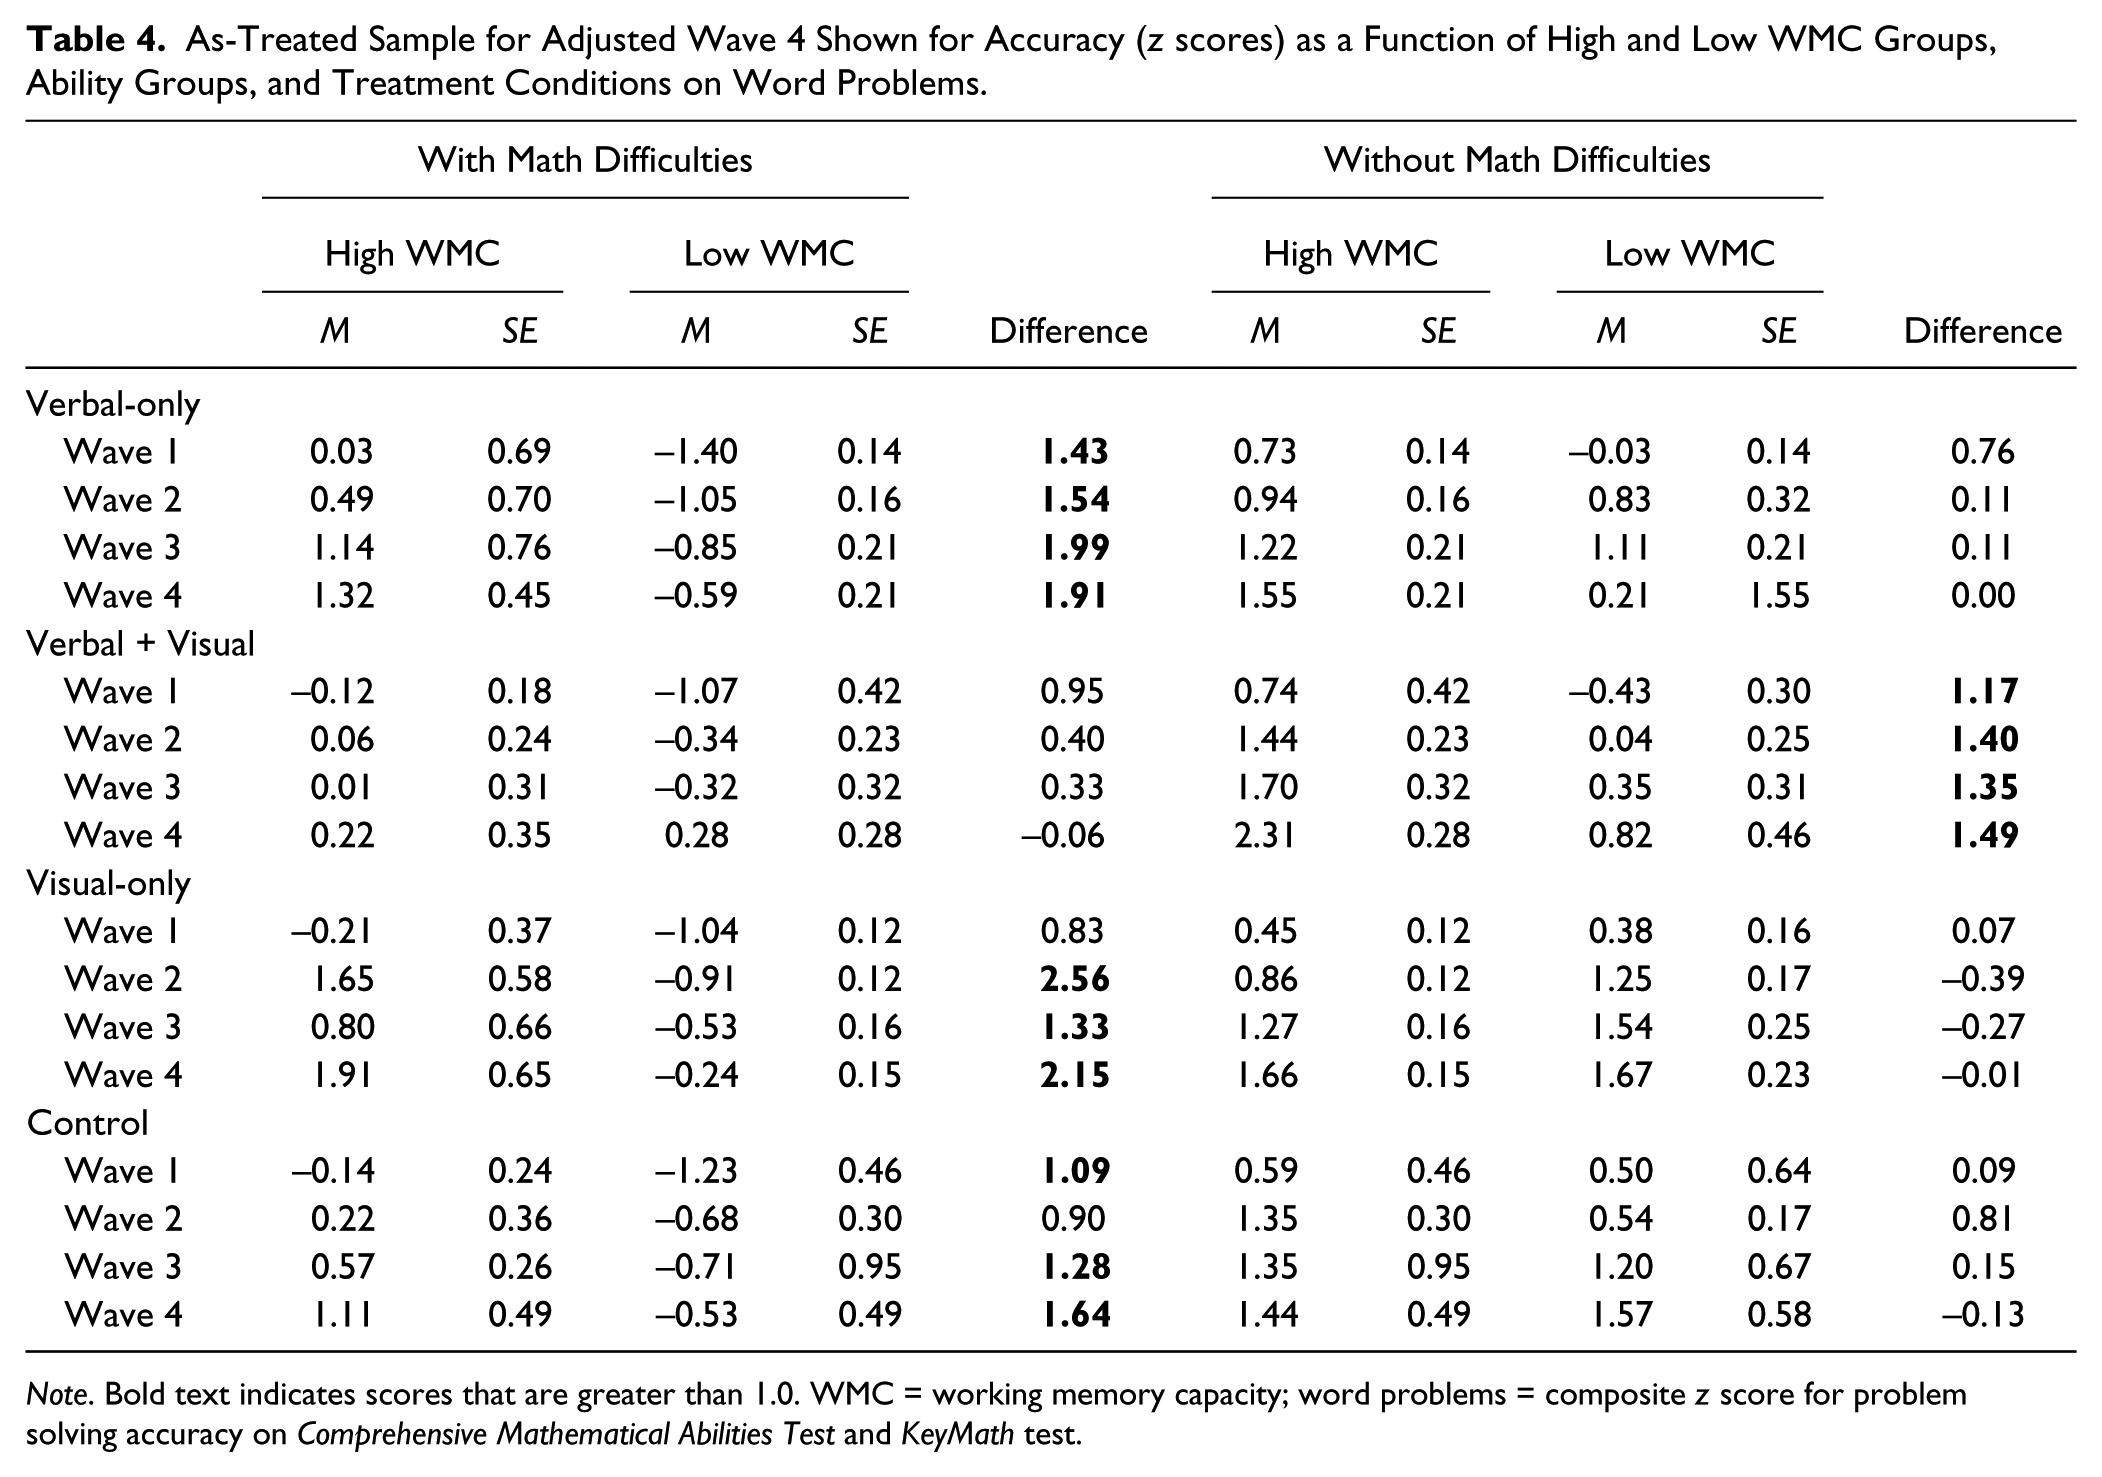
Note. Bold text indicates scores that are greater than 1.0. WMC = working memory capacity; word problems = composite z score for problem solving accuracy on Comprehensive Mathematical Abilities Test and KeyMath test.
The differences in treatment outcomes as a function of setting WMC to high or low levels are shown in Table 4. Again difference scores greater than 1.0 are in bold. Positive difference scores in bold (score in favor of setting WMC to a high level) were frequent in children with MD across all conditions, except the verbal + visual condition. In contrast, positive difference scores were frequent in the verbal + visual condition for children without MD relative to the other conditions. Although children without MD outperformed children with MD within all treatment conditions when WMC was set to a low level, no significant group differences were found when WMC was set to a high level between the two ability groups for the verbal-only condition, F(1, 290) = 0.36, p = .54, the visual-only condition, F < .001, or the control condition, F(1, 290) = 1.94, p = .16.
In summary, regardless of whether the intent-to-treat or as-treated sample was analyzed, a treatment advantage when WMC was set to a high level was found for the visual-only condition relative to the other conditions for children with MD. In contrast, an advantage for the children without MD was found for the verbal + visual condition when compared to the other conditions. The results also showed that the majority of difference scores in Tables 3 and 4 were positive, suggesting increased performance related to strategy conditions was more likely to occur when WMC was set to a high rather than low level.
Discussion
The goal of this study was to investigate whether WMC moderates the effects of strategy training for children who have difficulty solving word problems. Overall, the results indicated in both the intent-to-treat and as-treated analyses that treatment effects were significantly moderated by WMC. In general, treatment outcomes were higher when WMC was set to a high rather than low level. When set to a relatively high WMC level, children with MD performed significantly better under visual-only strategy conditions and children without MD performed better under verbal + visual conditions when compared to control conditions. The results are now discussed in terms of the three questions that directed the study.
1. Do some strategies place greater demands on the WMC in children with MD than others?
The present study clearly showed that WMC was related to problem solving accuracy outcomes. A significant interaction emerged among WMC, strategy conditions, and ability group status, suggesting that certain strategies draw on more WM resources than did others within ability groups. For children with MD, scores were higher for the visual-only condition relative to the control condition when made conditional on setting WMC to a high level. For children without MD, scores were higher for the verbal + visual condition when made conditional on setting WMC to a high level rather than setting to a low level. Overall, the results suggest that the positive effects of strategy conditions relative the control conditions are contingent on setting WMC to a high level. Thus, the benefits of strategy training are most likely to be obtained for children with MD who have a relatively larger WMC than children with a lower WMC. The benefits of strategy instruction are specific to children with relatively high WMC because they have spare WM resources to effectively utilize strategies.
One alternative interpretation to these findings was that because reading, computation, and general fluid intelligence were intact for children with MD, the reliable use of cognitive strategies was related to accessing basic reading and math skills instead of any individual differences in WMC. In contrast to this hypothesis, however, the significant Ability Group × Treatment × WMC interaction suggests that WMC does moderate some of the outcomes. Furthermore, we found no significant treatment differences on measures of fluid intelligence, reading, and calculation skills within the sample with MD. Thus, the results do not support the notion that WMC plays a lesser, secondary role in problem solving outcomes related to treatment conditions.
Another alternative interpretation suggests that a limited-capacity WM system underlies word problem solving difficulties in children with MD, but operates relatively independent of strategy activities. The model is consistent with several theorists who adopt a general resource approach in which individual differences on cognitive and aptitude measures draw on a limited supply of WM resources (e.g., Colom, Abad, Quiroga, Shih, & Flores-Mendoza, 2008). The model assumes that WMC may be related to the level of problem solving performance (children high or low in WMC vary within treatment conditions), but it does not moderate outcomes related to strategy conditions. Although the present study clearly showed that WMC was related to problem solving accuracy outcomes, a significant interaction emerged between WMC and strategy conditions, suggesting that certain strategies draw on more WM resources than others.
Another possible interpretation of the results was that strategy training compensated for individual differences in WMC. This model suggests outcomes related to strategy training interacted with individual differences in WMC, suggesting that strategy training would free up resources for children with relatively weak WMC. Some studies have shown that strategy training helps low span participants allocate WM resources more efficiently when compared to high span participants (e.g., Turley-Ames & Whitfield, 2003). Thus, children with MD, especially those with relatively lower WM span, would benefit more from strategy instruction when compared to the control condition than children without MD (children with high spans). Such was not the case in this study. The results showed that although a significant WMC × Strategy Treatment interaction emerged; the results however were not in the expected direction. Making the treatment effects contingent on setting WMC to a low level did not improve children with MD problem solving performance relative to the control conditions. Thus, the results suggested that no clear compensatory processing occurred for children with low WMC relative to the control conditions.
2. Are some cognitive strategies more effective than others in reducing the performance differences between children with and without MD?
The results at Wave 1 showed that although substantial differences emerged between the two ability groups across all treatment conditions, no significant interaction emerged between ability group and treatment condition. However, across treatment sessions the results suggested that the differences between the two groups were reduced on some treatment conditions in the later testing waves. Specifically, when a focus was placed on the last testing wave, no significant differences emerged between the groups on the visual-only conditions, whereas a huge gap in performance in favor of children without MD occurred during the verbal + visual condition. These null effects for the visual-only condition, of course, must be viewed cautiously because of the potential for a Type II error. In addition, these effects may be related to the fact that strategy conditions for children without MD provided no additional value to their performance relative to the control conditions. More important, children without MD maintained a substantial advantage over children with MD within all treatment conditions when WMC was set to a low level. Thus, although some nonsignificant effects between groups occurred within conditions when WMC was set to a high level, these findings appear more as a function of performance at a high WMC level rather as a specific benefit of treatment conditions.
The results do beg the question though as to why the visual-only condition was helpful to children with MD. The results clearly show that when WMC and initial status at Wave 1 are covariates in the analysis, an advantage was found for the visual based strategy conditions. However, as discussed previously this condition works best for children who meet a certain threshold in WMC. On the assumption that visual memory in children with MD is relatively more intact than verbal memory (Swanson & Beebe-Frankenberger, 2004), the results support our predictions that visual-spatial strategies yield higher accuracy scores when compared to verbal strategy conditions for children with MD. Thus, an obvious question emerges as to why visual-spatial strategies helped some children with MD, more specifically those with relatively high WMC, and not others. Our best explanation is that the use of diagrams is resource demanding. It is also possible that not all children had adequate resources to enact this visual strategy without placing excessive demands on WM. The visual-spatial strategy, however, may have provided a technique that allowed high WMC children to focus on the relevant aspects of the task. Diagramming numbers might have activated the relevant information, while preventing irrelevant information from interfering with problem solving solutions. Taken together, the results suggest that visual diagramming is an effective intervention for children with some MD to increasing solution accuracy. The results fit with several findings on the positive aspects of visual strategies for increasing math performance (e.g., van Garderen & Montague, 2003).
3. Finally, are the effects of WMC on strategy intervention more pronounced on the earlier rather than later treatment phases?
In general, higher accuracy scores occurred in the later testing waves than earlier testing waves. The conditions that yielded the highest outcomes were found when WMC was set to a high level at the later testing points. However, shown in Panel a (for Figures 2 and 3), performance for children with MD was far more variable across testing phases when compared to children without MD. As shown, the pattern for children without MD was more linear than children with MD. The results do not suggest however, that there was a waning of the influence of high WMC in the later testing waves for children with MD. That is, the difference scores for the treated-as-intend analysis for Wave 4 (1.97, –0.14, 2.82, 1.37, for verbal-only, verbal + visual, visual-only, and control condition, respectively) when compared to Wave 1 (1.20, 0.88, 1.70, –0.48, for verbal-only, verbal + visual, visual-only, and control condition, respectively) were smaller only for the verbal + visual for children with MD. A similar pattern occurred for the as-treated analysis when comparing Wave 4 (1.91, –0.06, 2.15, 1.64, for verbal-only, verbal + visual, visual-only, and control condition, respectively) to Wave 1 (1.43, 0.95, 0.83, 1.09, for verbal-only, verbal + visual, visual-only, and control condition, respectively) performance. Our best explanation for the decreasing influence of WMC levels on the verbal + visual condition is that a combination of utilizing both verbal and visual-spatial strategies improved over training sessions. This improvement is reflecting children’s ability to draw on separate verbal and visual-spatial storage capacities, and therefore the combination of utilizing both of these storage systems in this strategy opened up the possibility for more information to be processed and retained without making excessive demands on WMC (Mayer, 2005).
Implications
Our findings have five applications to current research. First, the study may account for why some children benefit from strategy instructions and others do not. We found that a key variable in accounting for the outcomes was WMC. Clearly, WMC would not be the only variable across studies to account for the outcomes; however, the role of WMC in this study appeared to be fairly robust. It may be the case that when children with both computation and/or reading difficulties are included in the analysis that effects would be different. Thus, in spite of the poor outcomes for children with low WMC relative to the control condition, it is important to note that these children had reading and computation scores in the average range.
Second, the results are consistent with studies suggesting that visual-spatial strategies facilitate problem solving for children with MD and may reduce some of the performance gaps with their normal achieving peers. Our findings are interesting in that several studies have suggested that visual-spatial WM (represented by the visual-spatial sketchpad) are closely linked with MD (e.g., Bull, Espy, & Wiebe, 2008). It has been argued that visual-spatial WM plays a key role in some of processing difficulties found in children who experience MD (e.g., Bull, Johnston, & Roy, 1999). However, a meta-analysis synthesizing research on cognitive studies of MD (Swanson & Jerman, 2006) suggests that memory deficits are more apparent in the verbal than visual-spatial WM domain. Our findings suggest, however, that visual strategies rather than verbal strategies were more robust in terms of treatment outcomes and, therefore, are an important route for strategy training. It is possible that visual-spatial memory serves as a mental blackboard to support number representation (McLean & Hitch, 1999) as well as specific associations between visual-spatial memory and encoding in problems presented visually (Kolloffel et al., 2009; Meyer, Salimpoor, Wu, Geary, & Menon, 2010).
A third application relates to the fact we were able to improve problem solving performance on norm-referenced tests. The majority of intervention studies have shown gains on experimental measures and less so on standardized measures (Powell, 2011). Thus, we were able to improve performance substantially on materials related to standardized tests.
Fourth, we found similar patterns in the results when analyzing the intent-to-treat samples in comparison to the as-treated samples. For each of our analyses, two estimates of intervention effects were created. Although intent-to-treat estimates were considered unbiased (e.g., Podock & Abdalla, 1998), estimates of as-treated effect do no account for the full effect of the intervention. The as-treated analysis was assumed to yield estimates that accounted for the full intervention effects, but may produce biases because the random assignment to conditions no longer applied. In both our as-treated and more conservative intent-to-treat analyses, however, problem solving accuracy conditions under high WMC conditions held up a consistent treatment effect for both children with and without MD under even the most stringent criteria. Children with MD performed better under the visual-only condition, and children without MD performed better under the verbal + visual condition when compared to the control condition.
A final application of these findings suggests that different mental resources influenced strategy outcomes. Overall, our research matches some of the predictions found in cognitive load theory (Sweller, 1988, 2005). The central tenet of cognitive load theory is that, to be effective, instruction should be designed in alignment with the learners’ cognitive architecture. Human cognitive architecture is held to consist of a limited-capacity WM. Because information has to pass through WM before it can be consolidated in long-term memory, the limited capacity of WM can be considered the bottleneck for learning. It is not surprising that, given the central tenet of cognitive load theory, a practical application of our findings would be to engineer the instructional control of cognitive load, thus providing the means to optimize problem solving accuracy.
Summary
In summary, the results suggested that solution accuracy for children with MD relative to children without MD improved substantially as a function of visual strategy training. The results also suggested that WMC interacted with treatment outcomes. Children with MD and relatively higher WMC were more likely to benefit from strategy training than those with low WMC when compared to the control condition.
Footnotes
Appendix
Acknowledgements
The authors thank the anonymous reviewers for their critical comments on an earlier version of this article. The authors are indebted to Loren Albeg, Catherine Tung, Dennis Sisco-Taylor, Kenisha Williams, Garett Briney, Kristi Bryant, Debbie Bonacio, Beth-Brussel Horton, Sandra Fenelon, Jacqueline Fonville, Alisha Hasty, Celeste Merino, Michelle Souter, Yiwen Zhu, and Orheta Rice in the data collection and/or task development. Appreciation is given to the Academy for Academic Excellence/ Lewis Center for Educational Research (Corwin and Norton Campuses). Special appreciation is given to Chip Kling, Sandra Briney, and Jan Gustafson-Corea.
Authors’ Note
The associate editor served as the action editor on this article.
Declaration of Conflicting Interests
The author(s) declared no potential conflicts of interest with respect to the research, authorship, and/or publication of this article.
Funding
The author(s) disclosed receipt of the following financial support for the research, authorship, and/or publication of this article: This article is based on a study funded by the U.S. Department of Education, Cognition and Student Learning in Special Education (USDE R324A090002), Institute of Education Sciences, awarded to H. Lee Swanson. The report does not necessarily reflect the views of the U.S. Department of Education or the school district.