



Abstract
Using in-store ambulatory eye-tracking, the authors investigate the extent to which lateral and vertical biases drive consumers’ attention in a grocery store environment. The data set offers a complete picture of both where the shopper is located and the shopper’s field of view and visual fixations during the trip. The authors address two research questions: First, do shoppers have a higher propensity to pay attention to products on their left or right side as they traverse an aisle (i.e., is the right side the “right” side)? Second, do shoppers tend to pay more attention to products at their eye level (i.e., is eye level “buy level”)? The authors utilize the exogenous variations in the direction by which shoppers traverse an aisle to identify lateral bias. The exogenous variation of shoppers’ eye-level positions is used to identify vertical bias. The authors find that shoppers pay more attention to products on their right side when traversing an aisle. Contrary to many practitioners’ belief, eye level is not “buy level”; rather, the product level that has the greatest propensity to capture shoppers’ attention is approximately 14.7 inches below eye level (which is around chest level).
Keywords
Previous research suggests that consumer attention in the grocery store is generally malleable and an important determinant of purchase behavior (Drèze, Hoch, and Purk 1994). Given the adage that “unseen is unsold” (Wastlund, Shams, Otterbring 2018, p. 49), it is important to understand which set of products capture shoppers’ attention during the shopping trip, as attention is an important antecedent to purchase. Thus, practitioners and academic researchers alike are keenly interested in understanding how in-store attention is driven by where products are located in the store, and on which shelf each product is placed, in relation to how shoppers navigate the store environment (Hui, Fader, and Bradlow 2009a). Clearly, such knowledge has important implications for product placement and shelf management decisions (Curhan 1973; Van Nierop, Fok, and Franses 2008).
For a stockkeeping unit (SKU) to capture a shopper’s attention, the shopper must first visit the area of the store where the product is located. Academic researchers have studied shopping paths using advanced tracking devices (Burke and Leykin 2014; Landmark and Sjøbakk 2017; Phua, Page, and Bogomolova 2015; Utsch and Liebig 2012; Zhang et al. 2014) combined with sophisticated statistical modeling methodology (Hui, Fader, and Bradlow 2009a; Hui and Bradlow 2012). For instance, using radio-frequency identification (RFID) tags positioned on shopping carts, Larson, Bradlow, and Fader (2005) classify shopping paths through the store using k-medoid clustering. Similarly, Hui and Bradlow (2012) use Bayesian multiresolution spatial analysis to study shopping paths and conclude that shoppers, on average, only visit about one-third of the store. Seiler and Pinna (2017) analyze RFID-based shopper data through econometric modeling to understand shoppers’ “search effort”; in a similar vein, Seiler and Yao (2017) examine how advertising affects path-to-purchase using shopping path data. Taken together, these studies offer a comprehensive picture of how shoppers navigate the store, enabling retailers to understand which in-store locations have a higher density of shoppers and are thus more valuable (Hui and Bradlow 2012), and provide guidance on how to improve store penetration and coverage (Hui, Inman, et al. 2013).
Going from knowledge about shopping paths to SKU-level attention, however, requires a full understanding of shoppers’ point-of-purchase behaviors and the associated patterns. Even if we can perfectly predict which in-store location a shopper visits during the trip, we still cannot determine which SKU will attract a shopper’s attention at that location. Thus, unless one is willing to make the (untenable) assumption that shoppers pay equal attention to all products within their field of vision, one must understand the role of lateral and vertical biases in driving shoppers’ attention. Specific to the grocery setting, when a shopper traverses an aisle, are they more likely to pay attention to products on the right or left side (a lateral bias)? Further, when the shopper is standing in front of a multilevel product shelf, which shelf level has the greatest propensity to capture shoppers’ attention (a vertical bias)? Obviously, these behavioral patterns/biases have implications for shelf-management decisions. Lateral bias, combined with the knowledge about predominant aisle traversal directions, implies that certain facings of an aisle are more likely than others to attract shoppers’ attention. In contrast, vertical bias indicates that SKUs that are placed at certain heights have greater propensities to attract shoppers’ attention. Thus, some aisles and shelf locations would be more desirable and should command higher slotting fees than others.
Through years of practical experience, retail practitioners have developed certain “accepted wisdoms” regarding shoppers’ lateral and vertical biases. For instance, building on psychological and physiological research on lateral bias (Casasanto 2009; Darling, Cancemi, and Sala 2017; Scharine and McBeath 2002), many practitioners suggest that shoppers typically move toward and reach for products on their right (Underhill 1999); in other words, the right side is the “right side.” This suggests that core product shelving and merchandising should be placed on the shopper’s right (King 2015) so that these items are more likely to be noticed (Groeppel-Klein and Bartmann 2009). In terms of vertical bias, the common advice is that “eye level is buy level” (Gia 2016; Pam 2012); that is, products positioned at eye level are likely to receive more attention and as a result sell better (Ebster and Garaus 2015; Kendall 2014). Therefore, visual displays should be aligned to the eye level of the average shopper (Grothe 2012; Root 2018).
Due to the lack of available ambulatory eye-tracking data, shoppers’ in-store attention at the SKU level has never been directly measured in previous academic studies, and as a result, these prevailing beliefs about shopper attention have never been directly tested in the field. Instead, prior academic research typically uses the downstream sales outcome as the dependent variable (Chung et al. 2007; Drèze, Hoch, and Purk 1994; Van Nierop, Fok, and Franses 2008). The connection between attention and sales is often implicitly assumed but not explicitly measured, as consumer-level eye-tracking data are not available. Our ambulatory eye-tracking data, in contrast, enable us to measure attention directly (through visual fixations). Further, prior literature often does not consider traffic patterns in the store (i.e., the direction by which a shopper traverses an aisle). The “location-tracking” component of our ambulatory eye-tracking data enables us to observe traffic patterns in the store aisles, which provides the key exogenous variation for identification in our model of lateral bias.
Thus, our main goal is to study the extent to which shoppers’ attention is driven by lateral and vertical biases. Specifically, we address the following research questions:
To answer these research questions, we collect a novel data set, using in-store ambulatory eye-tracking devices (Tobii Pro Glasses 2), to obtain a complete picture of how the shopper moves through the store, as well as their visual attention at any given moment. The video information in our data is considerably richer than the field-of-view information collected via head-mounted video cameras (Hui, Huang, et al. 2013) or the shopping-path information collected via RFID (Larson, Bradlow, and Fader 2005). Information from shoppers’ visual fixations enables us to analyze shoppers’ attention at the SKU level, rather than at the category level (Hui, Bradlow, and Fader 2009; Hui, Huang, et al. 2013), thus allowing us to better answer the aforementioned research questions. From the video data, we (manually) annotate all products (at the SKU level) that a shopper has paid attention to (defined in the “Annotation of Video Data” subsection) during the trip, along with shoppers’ paths through the store. Our final data set is composed of 175 shoppers, with a total of 3,066 product “attention incidences” across 109 product categories.
Given our novel path- and eye-tracking data set, we utilize random utility choice models to control for the differences in products to pinpoint the role that lateral and vertical biases play in driving shoppers’ attention. Importantly, the variations in the direction by which shoppers traverse an aisle (“northward” vs. “southward” relative to the floorplan) provide the requisite exogenous variations that allow us to identify the role of lateral bias. Further, we take advantage of the exogenous variations of shoppers’ eye levels while controlling for any product quality differences across shelves by including the conditional purchase conversion rate as a control variable, to test the hypothesis that eye level is “buy level.” Thus, our identification strategy hinges on the assumptions that variations in aisle traversal direction (for lateral bias) and variations in shopper eye levels (for vertical bias) are both plausibly exogenous. Although the latter is driven primarily by variations of shopper heights and therefore is clearly exogenous, we argue that the aisle traversal patterns are also reasonably exogenous given that shoppers typically do not optimize their shopping paths (see Hui, Fader, and Bradlow 2009b).
After calibrating our proposed models on the data set and comparing them with several benchmark models, we obtain the following key results. First, while traversing an aisle, shoppers have a 21% greater propensity to pay attention to product categories located on their right side (which refers to different products depending on whether the shopper is traversing the aisle “northward” or “southward”). Surprisingly, this lateral bias appears to be unrelated to handedness, as both right- and left-handed shoppers exhibit similar right-side bias. Second, contrary to what practitioners commonly believe, we find that eye level is not buy level. Rather, the “ideal point” with the greatest propensity to attract a shopper’s attention is approximately 14.7 inches below a shopper’s eye level. Given that the average shopper’s eye level in our data set is around 62 inches, the optimal product height is about 47 inches (or roughly 4 feet) off the ground, consistent with the findings of Point-of-Purchase Advertising International’s (POPAI 2014) mass merchant study. To put this into managerial perspective, consider a five-level shelf setting where the product heights are 24, 36, 48, 60, and 72 inches, respectively. Compared with the top (72 inch) or bottom (24 inch) shelves, the optimal shelf (48 inches) is expected to generate 16% more attention to a product. Further, vertical bias becomes more pronounced during the latter part of a shopping trip, when a shopper already has many items in their shopping cart. By comparing our results with the current knowledge of retail practitioners as captured through a survey (to be described subsequently), we find that our results differ significantly from their beliefs and thus have the potential to enhance their understanding of the drivers of shopper attention at the point of purchase.
To summarize, the contribution of our research is fourfold. First, we utilize ambulatory eye-tracking devices to study shoppers’ in-store behavior, a significant step forward compared with prior research that uses RFID tags to track shopping paths (Larson, Bradlow, and Fader 2005) or video cameras to record shoppers’ field of vision (Hui, Huang, et al. 2013). The addition of eye-fixation information enables us to directly measure consumer attention at the SKU level. Second, methodologically, we use the exogenous variations in the direction by which shoppers traverse an aisle, obtainable from the shopping path, to identify lateral bias, and the exogenous variations in shoppers’ heights and eye-level positions to identify vertical bias. Third, and substantively, we demonstrate with field data the existence of lateral and vertical biases in shoppers’ attention and provide estimates for the magnitude of these biases. Fourth, and managerially, by combining our findings on lateral and vertical biases with information on the predominant aisle traversal directions and shelf settings, we can derive the attentional value of each shelf location in the store to aid the retailer’s shelf-management decisions.
The remainder of this article is organized as follows. In the next section, we discuss in detail how our eye-tracking data are collected, describe how we annotate the video data, and present important characteristics of our data set. Then, we investigate the extent to which shoppers exhibit lateral bias: whether they have a higher propensity to pay attention to products on their left or right side while traversing an aisle. Following this, we turn our attention to study whether practitioners’ accepted wisdom that “eye level is buy level” is supported empirically. Finally, we conclude with directions for future research.
In-Store Ambulatory Eye-Tracking Data
Data Collection
Our data set is collected from a large grocery store located in a major metropolitan region in the Northeastern United States. The store is approximately 82,000 square feet, almost twice as large as the median U.S. grocery store (42,800 square feet; FMI 2016). The layout of the store is roughly divided into five zones—produce, meat, center-of-store aisles, health and beauty, and checkout area—as shown in Figure 1. Figure 2 displays the approximate in-store locations of the 109 product categories in the store.
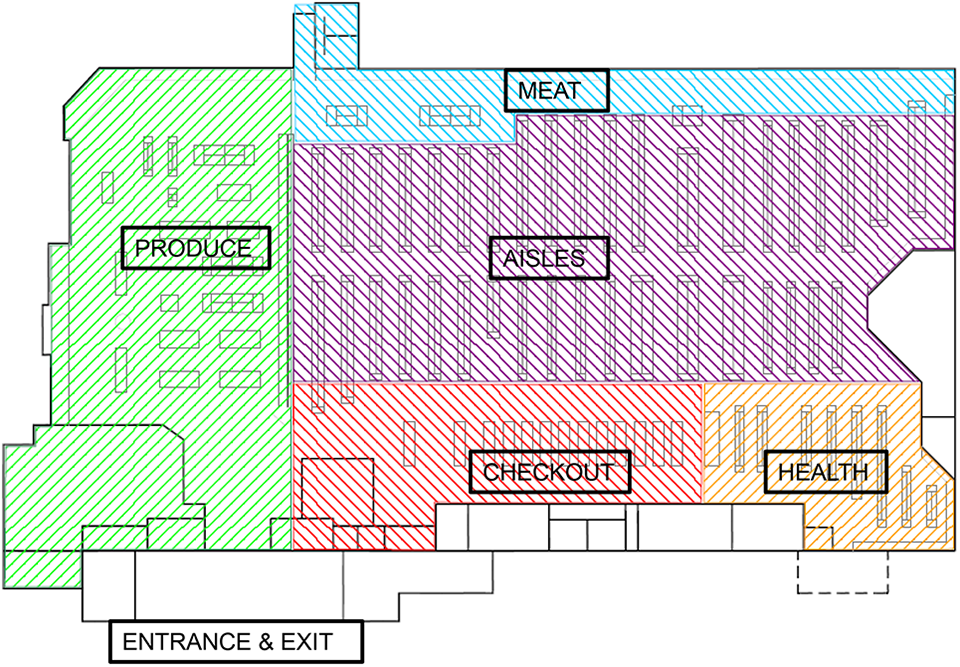
Store layout.

The in-store locations of 109 product categories.
Given that one of our main goals is to understand the role of vertical bias, we performed extensive in-store measurements to record the heights of products on every shelf in the store. Specifically, for each shelf level within each product category, we take a sample of five to ten products and measure the average heights of these products, up to their respective center of gravity (for an illustration, see Figure 3). For instance, for the four-level shelf illustrated in Figure 3, the center-point of the product (wine) is about 4 inches above the shelf edge. Thus, for a bottle of wine placed on the top shelf (where the shelf base height is 53 inches), the product height is shelf base height plus product height (i.e., 53 + 4 = 57 inches). This detailed measurement, though time consuming, enables us to capture product height information as accurately as possible, which is crucial for understanding vertical bias. If shelf height was used as a proxy for product height, it would have introduced an additional source of error given that certain product categories (e.g., milk) are much taller than others (e.g., canned soup).

Measurement of product heights on each shelf.
After completing a thorough in-store audit and measurement procedure, we commenced our study in September 2015. In the six-week period thereafter, a total of 193 shoppers were intercepted at the store’s only entrance (see Figure 1), screened for several criteria (age 18 years or older, shopping alone, and not currently wearing prescription glasses [which would affect the accuracy of eye-tracking measurements]), and invited to participate in a marketing research study. Shoppers who agreed to participate were asked to put on an ambulatory eye-tracking device (Tobii Pro Glasses 2) and proceed to shop as they would normally. At the time of the study, this device was the most advanced and accurate mobile eye-tracking methodology available (see Bulling and Gellersen 2010). As we show in Figure 4, the eye-tracking device comprises two components: (1) a lightweight frame and clear lenses with a video camera embedded in the middle of the frame and two small sensors positioned below the eyes to record eye movements and (2) a separate video recording unit that also houses the battery. Once the shopper begins the shopping trip, the video recorder captures data from the embedded video camera and sensors and continually stores the data in the recording unit.

Ambulatory eye-tracking device (Tobii Pro Glasses 2).
Figure 5 displays four instances in which a shopper pays attention to an SKU, extracted from the recorded shopping videos. As discussed previously, in addition to the shopper’s field of view (Hui, Huang, et al. 2013), our data set captures the shopper’s visual fixations, as shown by the red circles in Figure 5. The shopper is paying attention to Chips Ahoy! Original Chocolate Chip Cookies in the upper-left panel, Bear Naked Chocolate Elation Cereal in the upper-right panel, Nutri-Grain Soft Baked Cereal Bars in the lower-left panel, and Storage Bags (40 quantity) in the lower-right panel. This additional level of richness enables us to determine which SKUs the shopper is paying attention to, as opposed to conducting analysis at the category level (Hui, Bradlow, and Fader 2009; Hui, Huang, et al. 2013).

Shopper attention examples.
After shoppers completed their shopping trips and paid for their purchases, they were asked to fill out an exit survey that collects information on their physical characteristics, including height, weight, handedness, and other demographic information. Given shoppers’ eye-level height is crucial for studying vertical bias, in addition to capturing the self-reported height, we also measured the shoppers’ height using a ruled measure. Finally, each participant was given a $35 gift card, thanked for participating, and dismissed. We excluded several respondents from the sample due to hardware malfunctions, eye-tracking inaccuracies, and/or premature removal of the eye-tracking glasses, yielding a final sample of 175 shoppers.
Annotation of Video Data
For each shopping video, we manually annotate the shopper’s path through the store and record every product “attention incidence” that occurs during the trip using custom video annotation software developed specifically for this project. (Due to space constraints, we provide an overview of the annotation procedure here; more details of the procedure are included in the Technical Appendix.) First, the shopping video is played back in slow motion. As the shopper moves from one location to another, we manually map the shopper’s physical location and direction of movement at each point in time by specifying their (x, y) coordinates on the store’s floorplan, then connect these coordinates to produce an approximate shopping path. Knowledge about the shopping path enables us to determine the direction in which each shopper traverses an aisle, thus providing the requisite variations to study lateral bias. For an example shopping path, see Figure 6, Panel A.
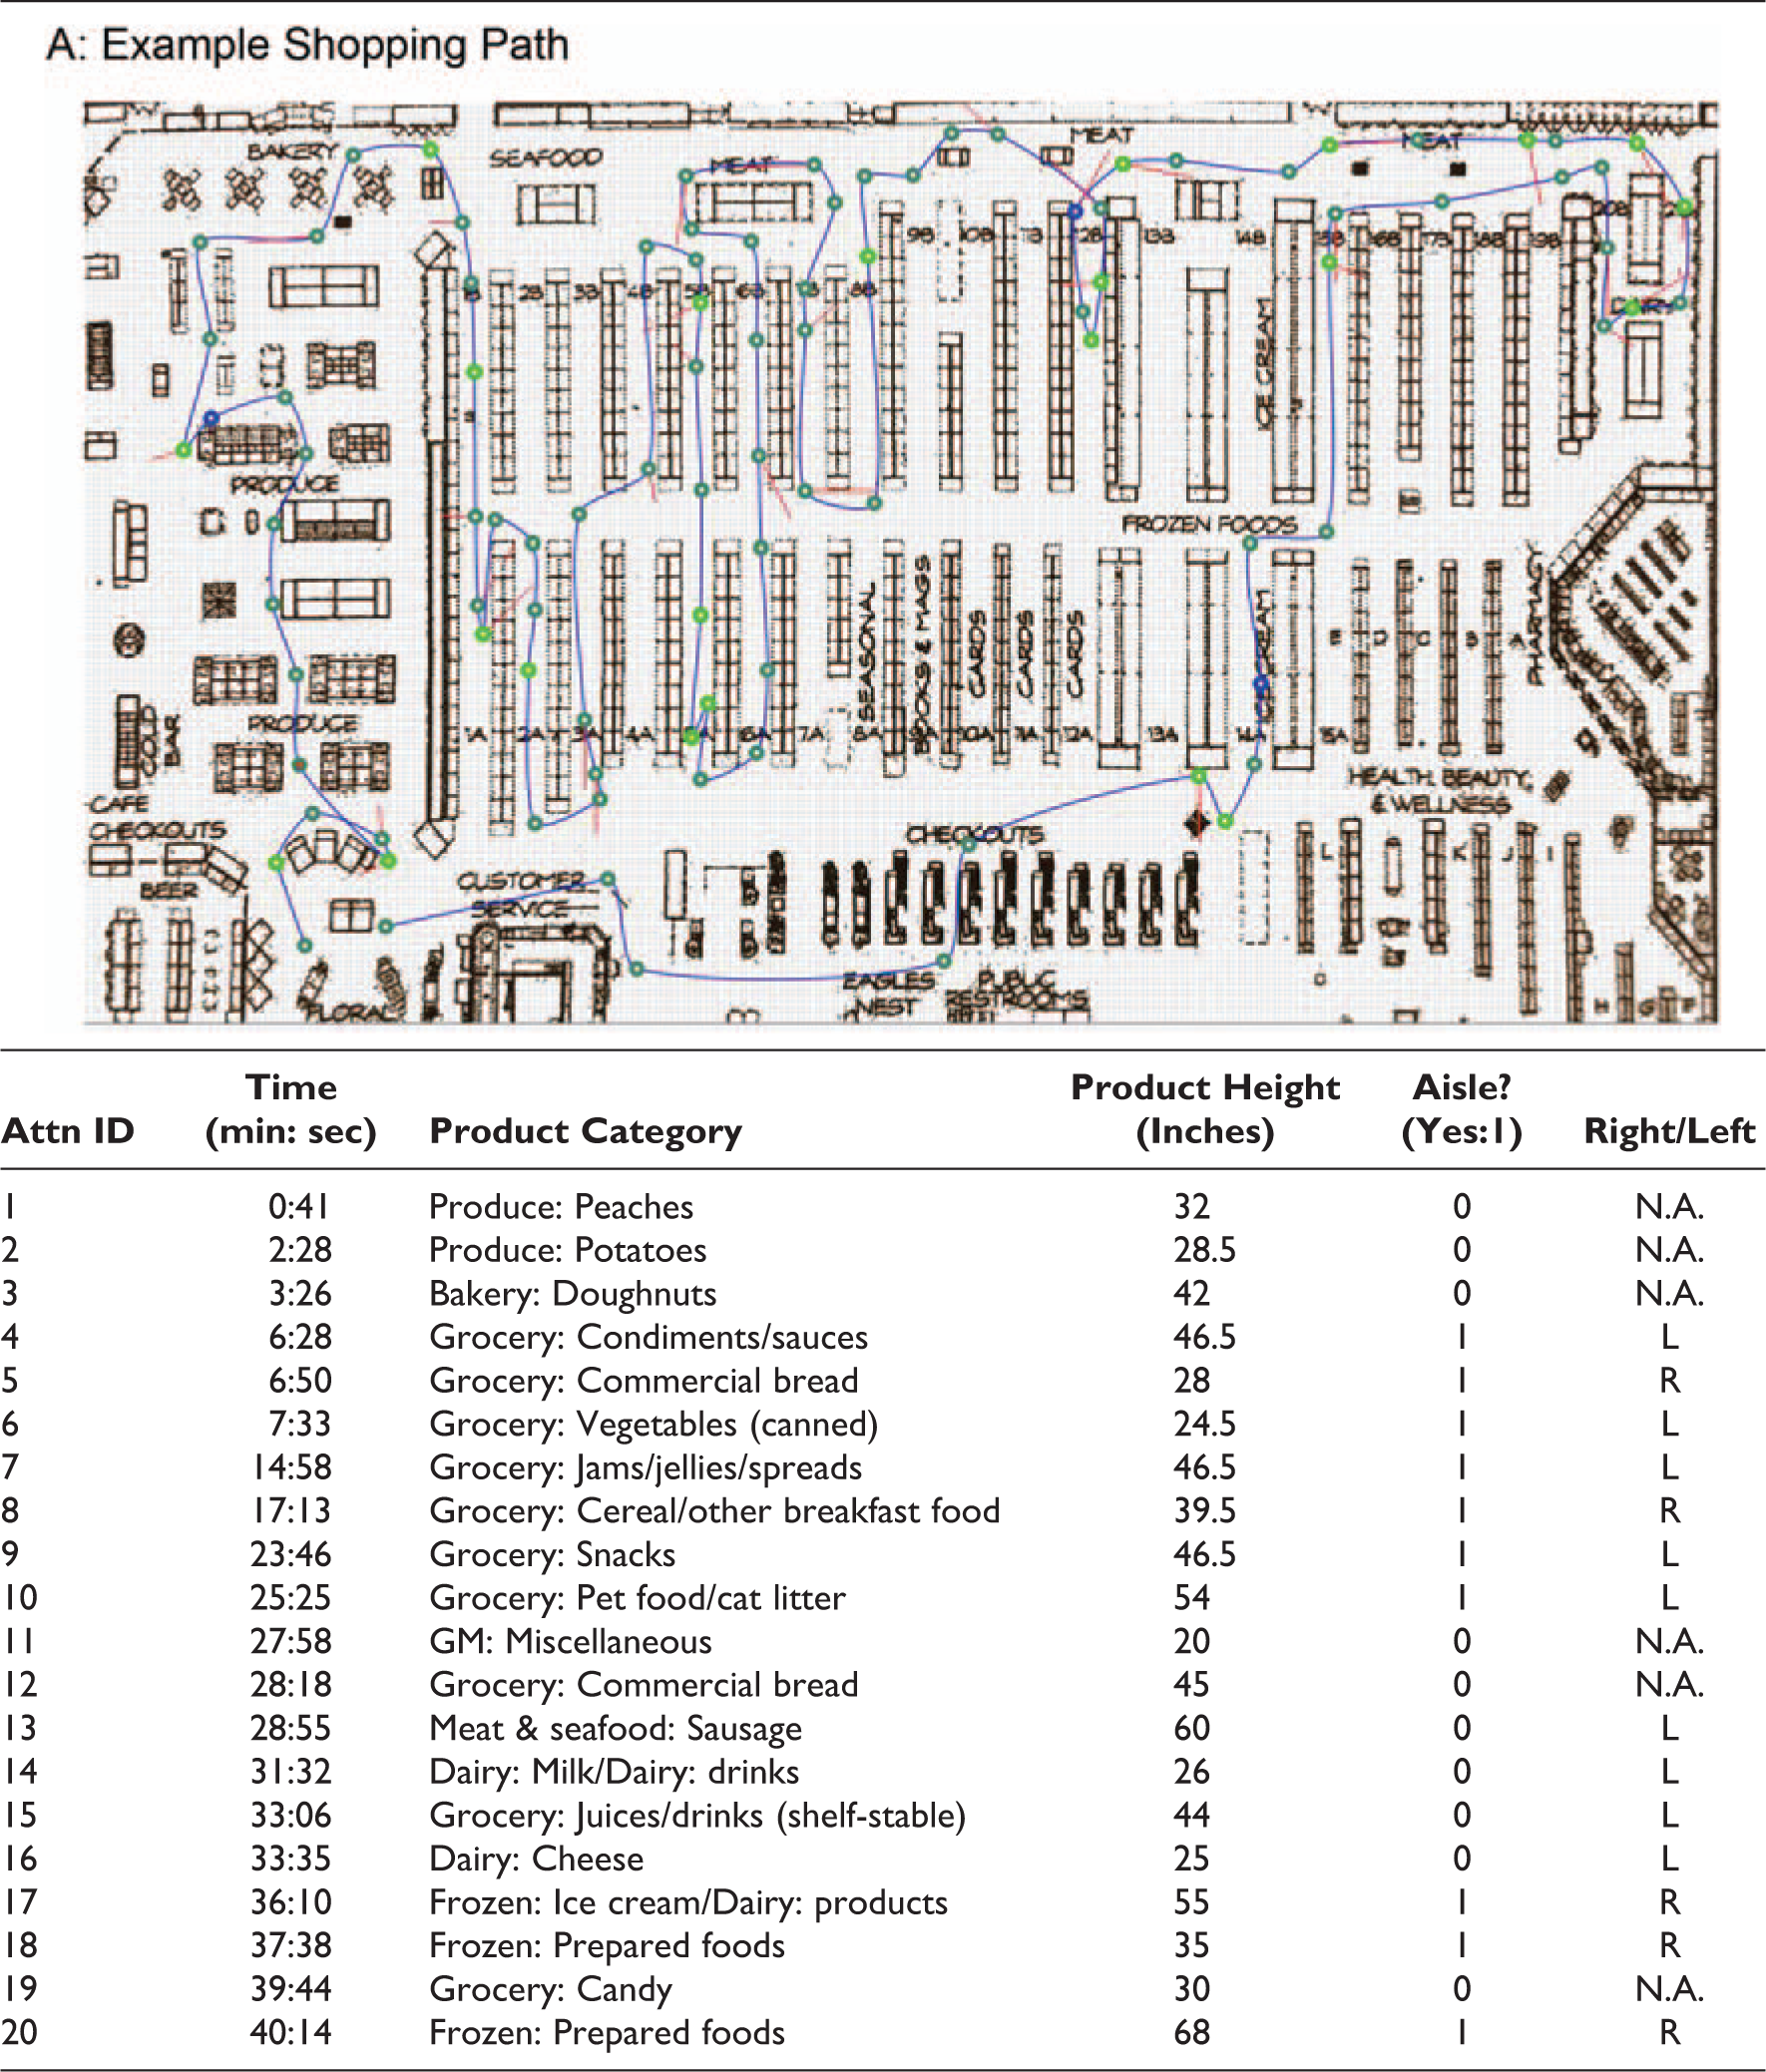
Example annotated shopping trip data for a single shopper.
Next, recall that the main goal of this research is to better understand shoppers’ attention at the SKU level. We note that an “attention incidence” has taken place if a shopper’s movement has slowed or completely stopped and their gaze has stabilized on a certain SKU. 1 This is similar to the procedure used in Hui, Huang, et al. (2013). When an “attention incidence” takes place, we record the following key information: (1) the total attention time; (2) the product category; (3) the specific SKU that the shopper is currently paying attention to; (4) the shelf level where the product is located and, thus, the average height of products (from the ground up) on that shelf level; (5) whether the product is located within an aisle; and if so, (6) whether the shopper is paying attention to a product that is located on their left or right side.
For illustration, Figure 6 shows a complete shopping trip record for a specific shopper in our data set. This shopper spends about 45 minutes in the store and travels 1,913 feet. During the trip, the shopper pays attention to 20 distinct products (as shown in Panel B of Figure 6), 10 of which happen in the center-store region. In five of these incidences, the shopper pays attention to the product category that is located on her right side as she traverses the aisle. Thus, our data set comprises 175 shopping trips similar to the example shown in Figure 6, with a total of 3,066 product attention incidences.
The annotation of the eye-tracking data is extremely labor intensive and time consuming. Even with the assistance of the video annotation software, most of the shopping trip videos must be watched multiple times (in slow motion) to ensure that the annotation is as accurate as possible. The concluding section discusses the possibility of using recent advances in machine learning to facilitate coding for future studies.
Key Features of the Data Set
Table 1 summarizes the collected data. In terms of shopper demographics, the research participants are predominantly female (91%), with a median age of 47 years. Further (not shown in Table 1), the median household size is four people, with median household income between $75,000 and $100,000. Shoppers’ self-reported heights range from 59 to 76 inches, with a median of 64 inches (5 feet, 4 inches), and their eye levels (measured by research assistants in the field) range from 54 inches to 70 inches, with a median eye level of 62 inches. The vast majority of these shoppers are right-handed (89%), which is consistent with the estimated proportion of right-handed people in the general population (roughly 88%–90% in North America; see Holder 1997).
Summary Statistics for the Shopper Tracking Data Set.

In terms of shopping trip characteristics, shoppers in our data set spend an average of 20 minutes in the store, with a mean in-store travel distance of approximately 1,600 feet. This is in line with the in-store travel distance of 1,400 feet reported in Hui, Inman, et al. (2013). The median proportion of store area covered is about 26%, roughly consistent with the store coverage reported in Hui and Bradlow (2012). On average, shoppers pay attention to 35 SKUs during their shopping trips, with a range of 2 to 136 SKUs, and roughly half converting to actual purchases. The average purchase conversion rate, conditional on attention, is 48%, ranging from 15% to 78% across shoppers. As expected, the purchase conversion rates in our data set are generally lower than those reported in Hui, Huang, et al. (2013), because we are looking at product attention at the SKU level rather than at the category level. In terms of total expenditure, shoppers spend an average of approximately $88 in the store.
Lateral Bias: Is the Right Side the “Right” Side?
Background and Literature Review
The general phenomenon of lateral bias has attracted considerable attention from researchers in psychology and physiology (Casasanto 2009; Darling, Cancemi, and Sala 2017; Scharine and McBeath 2002), starting with early psychology studies finding that participants tend to “veer to the right” when walking a straight line blindfolded (Brigden 1935; Szymanski 1913). More recent studies have concluded that people generally have a tendency to turn right. Such lateral bias can be driven by handedness (approximately 88%–90% of Americans are right-handed), driving habit, or ocular dominance (Coren 1999). The large body of evidence pointing to a general right-side bias has led to the common expression that “the right side is the ‘right’ side” (Casasanto 2009, p. 353). Taking a step further, some researchers in psychology (e.g., Casasanto and Chrysikou 2011) observe that idioms in English usually associate “good” with right but not with left; thus, they claim that consumers—most of whom are right-handed—“implicitly associate positive ideas more strongly with their dominant side” (p. 419) and thus generally prefer products presented on their right side.
Empirically, right-side bias has been observed in a diverse range of settings. As early as Robinson (1933), researchers have reported that people have a bias to turn right when entering a building. In a similar vein, the tendency for pedestrians to walk on the right has been extensively documented and discussed in Whyte (1980, 1988). Through a large-scale observational study on museum visitors’ movement and circulation patterns, Bitgood (2006) finds that visitors tend to walk on the right side of a path in a museum and also turn right at the end of the path. Other studies have demonstrated that consumers tend to choose seats to the right of the movie screen when they select their preferred seating location (Harms, Reese, and Elias 2014; Weyers et al. 2006). Such findings hold (though attenuated) even for ambidextrous and left-handed participants (Karev 2000). Similarly, Darling, Cancemi, and Sala (2017) report that consumers have a general preference to select seats on the right of an aircraft cabin.
In the retail industry, most researchers and practitioners believe that shoppers typically exhibit a right-side bias. For instance, Underhill (1999) claims that when shoppers move in retail environments, they “invariably walk toward the right.” He further claims that shoppers generally tend to reach right, as most of them are right-handed. Thus, these observations provide the basis for the usual recommendation that the front right of any store is its “prime real estate” (Underhill 1999). Likewise, Groeppel-Klein and Bartmann (2009) claim that shoppers are more likely to notice products located on their right side and speculate that such bias is driven by the fact that shoppers are predominately right-handed. Similarly, Bitgood et al. (2012) find that most U.S. shoppers walk on the right side of a pathway in shopping malls and suggest that this may be related to driving habits. Overall, most practitioners believe that core product shelving and merchandising should be strategically placed on the right of retail space (King 2015), so that items will be more likely to be noticed by (mostly right-handed) shoppers and, thus, sell better. Quite surprisingly, however, such “accepted wisdom” in the retail industry has never been empirically tested in the academic literature, and the magnitude of such lateral bias, if any, has never been established, even though such magnitude estimates have important implications for retail merchandising practices.
Thus, in this research, we use our ambulatory eye-tracking data set (that directly measures attention) to empirically address the following questions: (1) In the grocery store environment, do shoppers have a higher propensity to pay attention to product categories on their right or left side when traversing an aisle? and (2) If such lateral bias exists, to what extent is it driven by right- or left-handedness? To that end, we discuss the data and present several model-free analyses, and then develop a random utility model to control for product category placement to assess the magnitude of lateral bias.
Data and Model-Free Analysis
To study the extent of lateral bias, we focus on only products in the center-store region (see Figure 1), where the product shelving on shoppers’ left and right sides is comparable. 2 For each incidence, we record the following information. First, we locate the aisle in which the attention incidence takes place (Aisle 1A, 1B, etc.; see Figure 2). Second, from the shopping path, we determine the direction in which the shopper is traversing the aisle. Specifically, we define “northward” and “southward” relative to the store floorplan (as shown in Figure 2), where north is assumed to be pointing “up.” Finally, we record whether the shopper pays attention to a product category that is on their right or left side.
After aggregating across shoppers, we tabulate the number of northward versus southward traversals (whether or not an attention incidence has taken place) for each aisle, thus obtaining a picture of aisle traversal patterns in the store. Figure 7 depicts the predominant patterns. The predominant traffic direction for Aisle 1A (the leftmost bottom aisle in Figure 7) is southward (76%), whereas a northward traversal is more common for Aisle 2A (68%).
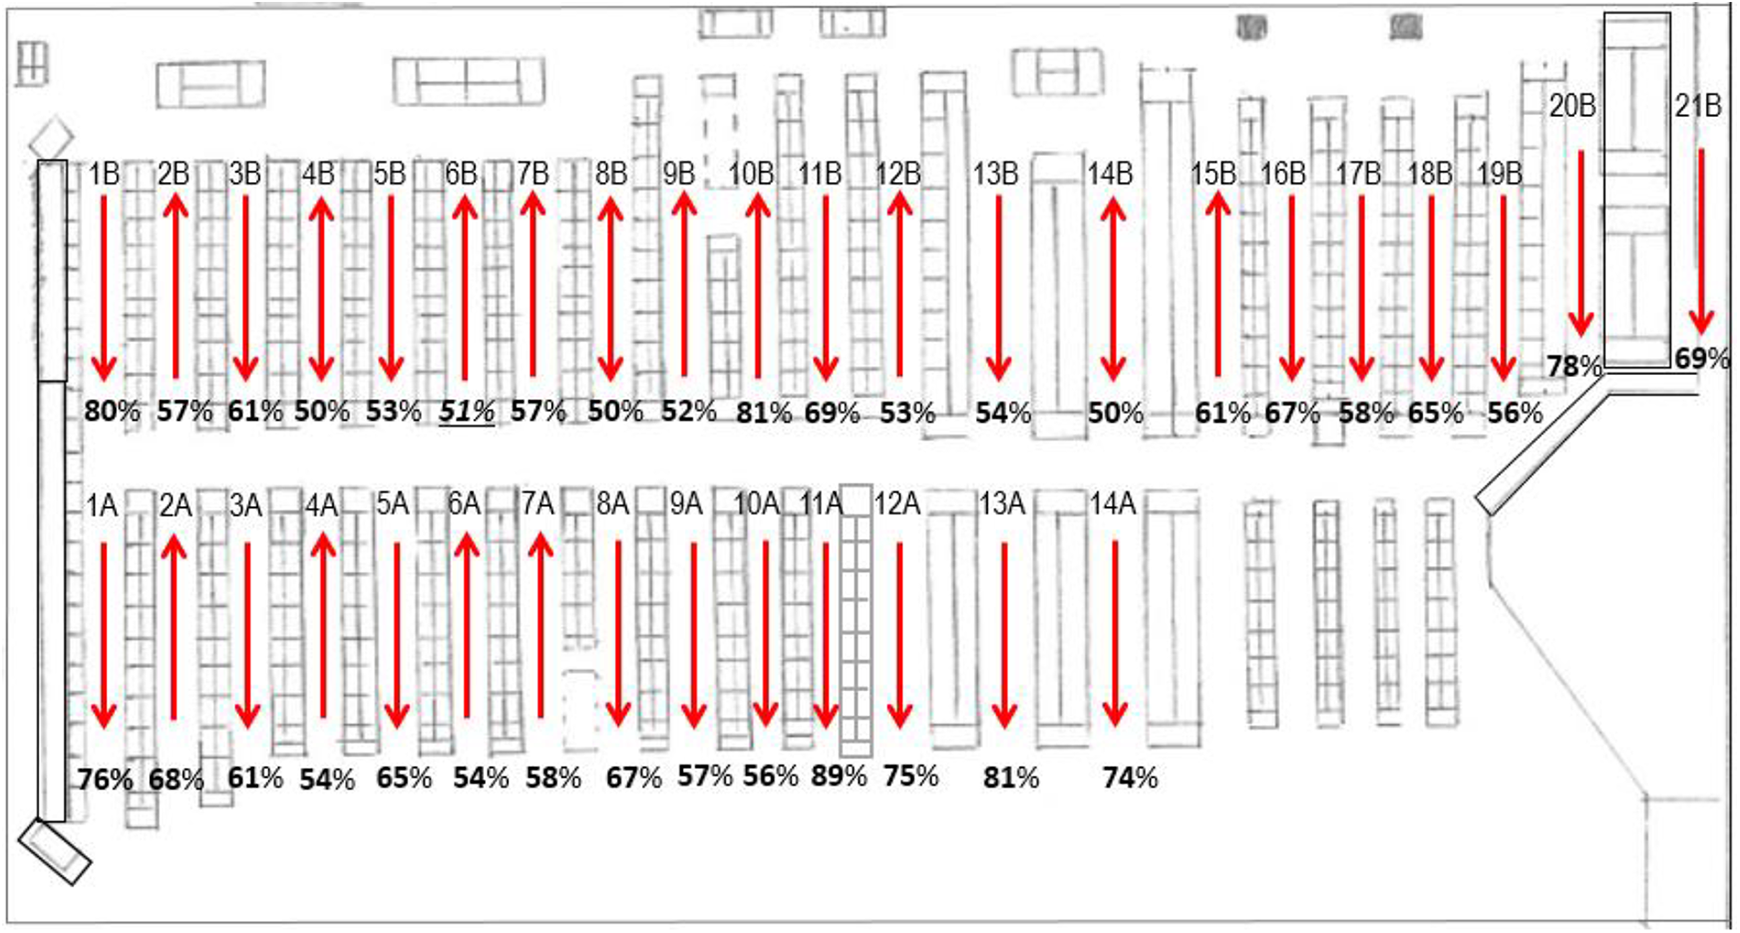
Predominant traffic direction patterns in the store.
Next, we obtain the total number of attention incidences that occurred in each aisle, along with the number of traversals in each direction (“northward” vs. “southward”) before the attention incidence occurs. We also record whether the shopper pays attention to a product on their right or left side; this information is summarized in Table 2. We further break down the data to show (for each aisle) the number of shoppers who pay attention to products on their right side while traversing northward and southward, respectively. As Table 2 shows, overall, shoppers pay attention to product categories on their right side 56% of the time (vs. 44% left); this apparent right-side bias is statistically significant (z = 4.09, p <.001). Further, Table 3 segments the data on the basis of right- and left-handedness. Interestingly, this right-side bias appears to hold for both right- and left-handed shoppers. For both types of shoppers, roughly 56% of the attention incidences take place on the shopper’s right side.
Summary Statistics of the Direction of Aisle Traversal (Northward vs. Southward) When an Attention Incidence Occurs, and Which Direction Is Being Considered (Right vs. Left).

Summary Statistics of Attention Incidence (Right vs. Left) Pattern for Left- and Right-Handed Shoppers.

While these initial summary statistics provide some model-free evidence for the role of right-side lateral bias, one can argue that these patterns are potentially an artifact of retailers’ strategic product placement decisions. Specifically, the data would show a similar pattern if the retailer placed more popular product categories on the right or left side of the aisles depending on the predominant traversal patterns (see Figure 7), so that “core” product categories will tend to be displayed on the right side for most shoppers. In the next subsection, we develop a random utility model to account for this potential alternative explanation by leveraging the plausibly exogenous variations in aisle traversal directions across shoppers.
Model and Results
We develop a random utility model to tease apart shoppers’ lateral bias from retailers’ product placement decisions using the (plausibly) exogenous variations in the direction by which shoppers traverse an aisle. To the extent that shoppers do not strategically choose how to navigate a store so that product categories that are of greater interest would be on the right side, we argue that the directionality of how a shopper traverses a specific aisle (northward vs. southward) during the trip can be treated as exogenous. This assumption about aisle traversal seems reasonable, as prior research indicates that most shoppers do not attempt to “optimize” their shopping paths (Hui, Fader, and Bradlow 2009b); likewise, Hui, Bradlow, and Fader (2009) and Hui and Bradlow (2012) model shopping paths using a stochastic model, where the underlying assumption is that consumers do not strategically plan their paths through the store. Importantly, the assumption that aisle traversal direction is exogenous enables us to separate the role of lateral bias in product attention incidence behavior from retailers’ product placements. Note that for a shopper who traverses Aisle 1A northward, the product category “Salad Dressings” will be on the right, and product category “Commercial Bread” will be on the left (see Figure 2). In contrast, for a shopper who traverses Aisle 1A southward, “Commercial Bread” will instead be on the right and “Salad Dressing” will be on the left. Thus, this provides the requisite exogenous variations enabling us to identify lateral bias effects.
We index shoppers by i, attention incidence by j, and the aisle where the jth attention incidence takes place by k. For a shopper who traverses an aisle k northward, we model their utility for paying attention to products on the east side of the aisle (relative to the floorplan, where north is pointing up) as

where

Thus, it follows that the probability that the shopper would pay attention to products on the east side of the aisle is

Next, consider a shopper who traverses aisle k southward. Similar to Equations 1 –3, we model the shopper’s utility for paying attention to products on the east side of the aisle (which are now on the left side of the shopper, who is moving southward) as

Note that the right-side lateral bias term

The probability that this shopper will pay attention to products on the east side of the aisle is

We combine Equations 3 and 6 to:

where
We estimate the model in Equation 7, a standard fixed-effects logistic regression, using the glm() library in R.
3
Consistent with the model-free analysis presented previously, the estimate for
We benchmark our results against the common beliefs of retail practitioners by conducting a survey among 43 retail professionals with experience in merchandising and shelf placement. Full details of the survey and results are described in Technical Appendix C. We asked these retail professionals (1) whether shoppers generally attend to the right or left side of the aisle and (2) what the magnitude of this bias is. The results of the survey suggest that while the modal response among practitioners correctly points to the existence of a right-side bias (consistent with our findings), they generally overestimate the magnitude of such bias. The average magnitude estimate of managers is 48%, compared with approximately 21% based on our results.
Next, we explore the extent to which the observed right-side lateral bias is driven by right- or left-handedness, as many retail professionals have assumed. Specifically, if lateral bias is driven by handedness, we should expect that left-handed shoppers generally prefer to pay attention to products on their left side, in contrast to right-handed shoppers, who tend to pay attention to products on their right side. Thus, we modify the model in Equation 7 as follows:

where
The resulting estimate of
Given that handedness does not seem to explain the observed right-side lateral bias, what could be a potential ergonomic explanation for this bias? Building on previous research (Scharine and McBeath 2002), we speculate that the right-side lateral bias that shoppers exhibit may be driven instead by ocular dominance (Coren 1999), which refers to a person’s tendency to prefer visual input from one eye to the other (Chaurasia and Mathur 1976). Previous research suggests that visual information originating from the dominant eye is processed by the central nervous system more rapidly than equivalent information originating from the nondominant eye (Coren and Porac 1982). In addition, sensory impressions from the dominant eye appear to be more salient (Porac and Coren 1984). As a result, some research has shown that motor cerebral dominance can potentially be developed secondary to ocular dominance (El-Mallakh, Wyatt, and Looney 1993). Given that approximately two-thirds of the people in the population have right-eye dominance (Porac and Coren 1976; Reiss and Reiss 1997), ocular dominance offers a plausible explanation for our observed right-side lateral bias, and we return to this issue as a direction for future research.
Vertical Bias: Is Eye Level “Buy Level”?
Background and Literature Review
When a shopper stops in front of a shelf fixture and begins to attend to products, they may exhibit “vertical bias”; that is, has a higher propensity to attend to SKUs positioned at specific height(s). Many retail practitioners believe the adage that “eye level is buy level” (Grothe 2012; Kendall 2014); that is, consumers are more likely to notice products that are positioned on shelves level with their eyes (Pam 2012) and give these items more attention than products placed either above or below (Ebster 2015; Ebster and Garaus 2015). As a result, the “eye-level” shelf is considered the most valuable, as it usually generates more sales than other shelves (Ebster and Garaus 2015). This is supported by academic research that shows that eye-level (or higher) shelves are associated with higher sales (Chung et al. 2007; Van Nierop, Fok, and Franses 2008). Thus, many practitioners recommend that retailers position their top-selling or highest-margin products at the shopper’s eye level to maximize “visual impact” (Pam 2012; Root 2018).
What “eye level” means in terms of actual product placement, however, is unclear. The definition varies widely across different practitioner publications and expert recommendations. Given that the average height of women in North America is about 64 inches, the average eye level is roughly 61 inches for female shoppers. However, the “optimal” product height that practitioners recommend (in terms of attracting shoppers’ attention) ranges from “three to five feet” (36–60 inches) in Sorensen (2009, p. 38), “1.2 to 1.5 meters” (47–59 inches) in Gia (2016), “approximately 4–5 ft.” (48–60 inches) in Wright (2012), “about 1.6 meters from the floor” (63 inches) in Usborne (2012), to “1.6 to 1.7 meters” (63–67 inches) in eBay (2014).
The wide variance in the recommended “optimal” height casts doubts about the validity of the saying that “eye level is buy level.” For instance, The Economist (2008) reports that some retailers feel that the optimal spot is higher than eye level. In contrast, Sorensen (2009, p. 84) claims that “the old canard that ‘eye-level is buy-level’ is quite simply untrue,” and states that the “sweet spot is from the waist to the shoulder.” This belief is echoed by Crafer (2015, p. 31), who argues that the term “eye level” should be corrected to “shoulder level.” Similarly, Usborne (2012) claims that consumers naturally look lower than eye level, “somewhere between waist and chest level.” This is also supported by a pilot study reported by POPAI (2014), in which shoppers are found to naturally look down at about 25 degrees below their eye levels. Likewise, Drèze, Hoch, and Purk (1994) find that approximately 6 to 8 inches below eye level is optimal.
To our knowledge, there has yet to be a comprehensive academic field study addressing the enduring question of the optimal product height to attract shoppers’ attention. If it is not eye level, should it be shoulder level, chest level, or waist level? Part of the reason for this research gap is that, until recently, eye-tracking devices that allow for direct measurement of shoppers’ visual attention have been too expensive, unreliable, and cumbersome to deploy in a field setting. Thus, most researchers rely on studying the relationship between product height and actual sales (Chung et al. 2007; Curhan 1973; Drèze, Hoch, and Purk 1994; Van Nierop, Fok, and Franses 2008), which confounds visual attentional effects with product quality, thus introducing endogeneity due to retailers’ strategic product placement decisions. Suppose that a certain retailer strategically positions the highest-quality product (with the highest conversion rate) at the eye-level shelf. Even if there is no vertical bias, one would observe higher sales for products at the eye-level shelf. More recently, using eye tracking in a lab environment, Chandon et al. (2009) report some evidence that shelves near the middle are more likely to be noticed.
Thus, our goal in this article is to empirically address the question, “Is eye level buy level?” using our novel field data set. To tackle the aforementioned endogeneity issue, we leverage the observed exogenous variation in shoppers’ eye levels while controlling for any product quality differences across shelves using their conditional conversion rates. We answer the following research questions: (1) When a shopper engages with a product category, at what heights (relative to the shopper’s eye level) do products attract the most attention?, (2) What is the magnitude of this vertical bias?, and (3) How does such vertical bias, if any, relate to product categories (hedonic vs. utilitarian) and the number of items already purchased? The next section discusses the data and summary statistics pertaining specifically to product heights and shoppers’ eye level and presents several model-free analyses. Then, we develop a random utility model to control for potential differences in product quality across shelf levels to estimate the magnitude of the vertical bias. Following this, we present several robustness checks and a model expansion that examines the moderating effects of hedonicity and the number of items already purchased.
Descriptive and Model-Free Analyses
Regarding the summary data and model-free analyses for the 3,066 SKUs that shoppers paid attention to in our sample, the left panel of Figure 8 shows the histogram of the heights of those products, measured from the ground up to the average center of gravity of products on each shelf. The right panel of Figure 8 displays the same information using a density plot (generated using the density function in R). The vertical line in the density plot is positioned at 62 inches, the median eye-level height of our shopper sample (see Table 1). The median height of SKUs that shoppers paid attention to is about 43 inches, with the peak of the height distribution being in the range of 30 to 52 inches, somewhat lower than eye level. For context, shelf heights for a standard grocery gondola range between 24 inches and 72 inches.

Histogram and density plot of product heights (in inches) of SKUs across 3,066 attention incidences in our data set.
Next, we focus on the offset between the height of SKUs and each shopper’s eye level, which we refer to as “vertical distance” (VD). As an example, for a shopper whose eye level is 58 inches and who is paying attention to a SKU with a height of 45 inches, VD = 45 − 58 = −13 inches. The left and right panels of Figure 9 present the histogram of VD and its corresponding density plot, respectively. The peak of the density appears to be in the range of 10 to 30 inches below eye level. Across all attention incidences in our data set, the median VD is −19, (i.e., approximately 19 inches below eye level).

Histogram and density plot of “vertical distance” (product height minus the shopper’s eye level) across 3,066 attention incidences in our data set.
Taken together, Figures 8 and 9 provide some preliminary evidence that the product height level that attracts the most visual attention seems to be somewhat lower than shoppers’ eye level. To draw a more definitive conclusion, we need to formulate a choice model that takes into account not only a shopper’s eye level and the SKUs that they are paying attention to but also the set of alternatives (in terms of product heights) available in each category and potential differences in the quality or appeal of products positioned at each height level. To that end, we develop a random utility choice model that utilizes the exogenous variations in shoppers’ eye heights to identify the role of vertical bias. Here, we first present some descriptive comparisons of “tall” versus “short” shoppers to demonstrate that differences in eye level influence the heights of products that attract the shoppers’ attention.
We classify shoppers into “tall” and “short” groups through a median split on height and then compare the two groups in terms of the heights of the products that they paid attention to. As the boxplot in Figure 10 shows, the SKUs that the “tall” group paid attention to are higher than those for the “short” group (with median product heights of 44 and 42 inches, respectively). The corresponding two-sample t-test is statistically significant (p < .05), and the same pattern holds after controlling for product categories through fixed effects. Overall, this gives some initial evidence that eye level influences the heights of products that attract a shopper’s attention. Given that the variation of eye level among shoppers is clearly exogenous, this forms the backbone of our identification strategy. Next, we construct a random utility choice model that leverages the exogenous variations of shoppers’ eye level to assess the extent of vertical bias.
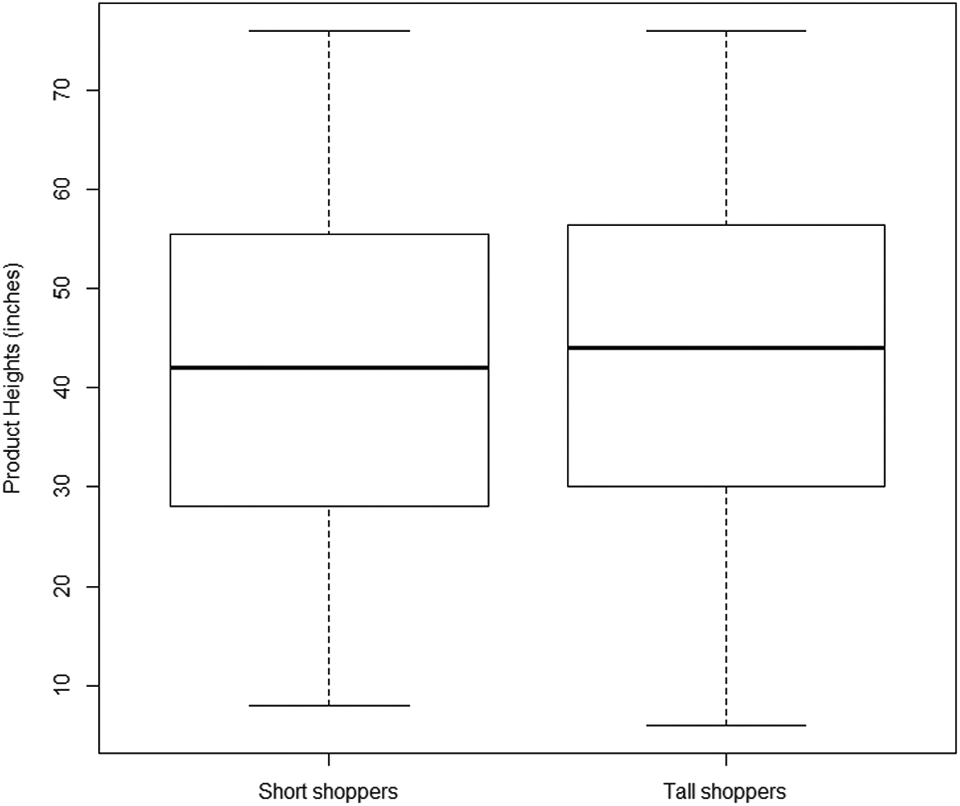
Boxplot comparing “short shoppers” and “tall shoppers” (based on a median split at median eye level of 62 inches).
Model and Findings
We index shopper by i and attention incidence by j. Let

The second term of Equation 9,
We also compare the proposed model in Equation 9 with several benchmark models using a series of likelihood ratio tests. Benchmark Model I represents the hypothesis that eye level is the optimal product height by setting the “offset” parameter

where
We estimate the model parameters using maximum likelihood estimation, by maximizing the corresponding likelihood function from Equation 9 using the optimization function optim() in R. Table 4 presents the estimated parameters for the proposed model and all benchmark models, along with the p-values computed from the corresponding asymptotic standard errors. 6 First, as can be seen in Table 4, the likelihood ratio test prefers the proposed model to Benchmark Model I (eye level is buy level) and Benchmark Model II (no vertical bias), with p = .001 and p = .003 (respectively), indicating support for the specification of the proposed model. Next, comparing the proposed model (where the penalty for looking higher or lower than the ideal point is assumed to be equal) with Benchmark Model III, which allows for asymmetric penalties, we see that the likelihood ratio test results in a p-value of .24, which favors the more parsimonious proposed model.
Parameter Estimates for the Proposed Model and Several Benchmark Models.

*p < .05.
Turning to our model estimates, the estimated parameter for
The magnitude of the vertical bias,
Simulation Results Assuming a Standard Five-Shelf Setting and Products with Equivalent Quality.

We benchmark our estimates against the common knowledge among retail professionals and results from prior academic research. First, as discussed in the “Model and Results” subsection, we conducted a survey among 43 retail professionals (for details, see Technical Appendix C) and asked them to (1) state the optimal vertical product level that attracts the most attention and (2) estimate the impact of moving a product from the bottom (or top) shelf to the optimal shelf, in terms of additional attention that the product now attracts. We find that, compared with our estimates presented here (i.e., the “ideal point” for attracting attention is approximately 14.7 inches below eye level), the vast majority of respondents (88%) overestimate the optimal vertical product level, on average, by about 8 inches. 7 Further, most respondents also significantly overestimate the impact of moving a product from the bottom (or top) shelf to the optimal shelf. The average estimate is +63.9% for bottom to optimal and 47.0% from top to optimal, which is about three to four times that of our results (15%).
Second, we note that the ideal height that we estimated here is substantially lower than the optimal level obtained from the prior academic literature that does not directly measure consumer attention but uses sales as a proxy. Specifically, Van Nierop, Fok, and Franses (2008) claim that higher shelves (eye level or higher) are associated with higher sales; Chung et al. (2007) state that eye-level locations give the most sales; and Drèze, Hoch, and Purk (1994) find that 6 to 8 inches below typical eye level 8 is optimal, which is 7–9 inches higher than the estimates provided here.
Robustness Checks and Model Expansion
We conducted several checks to ensure that our findings are robust to alternative specifications. First, we apply the proposed model in Equation 9 to only those product categories located in the center-of-store aisles, where the shelf fixtures and products are at relatively comparable heights. Our results remain substantially unchanged, with
As an additional robustness check, we relax the assumption that product quality can be inferred from purchase conversion rates by developing a Bayesian random-intercept model (Gelman 2005; Gelman and Hill 2006) that introduces (location × shelf-level)-specific intercept term


We estimate the Bayesian random-intercept model (Equations 11 and 12) by specifying standard, weakly informative prior distributions (Gelman et al. 2003) on all model parameters and sample from the joint posterior distribution of model parameters using a Markov chain Monte Carlo algorithm coded in C++.
10
Our results are consistent with those of our proposed model. The posterior means of
Next, we expand our proposed model (Equation 9) to study how the extent of vertical bias is moderated by category hedonicity and the number of items that the shopper has already purchased up to the time of attention incidence. To that end, two research assistants coded each of the 109 product categories in the store (listed in Figure 2) as either “utilitarian” or “hedonic” products; disagreements were resolved through discussion. This results in the classification of each category as utilitarian or hedonic, as shown by superscripts in the list of product categories in Figure 2. Next, we also code, for each attention incidence, the number of items that the shopper has already purchased up to that point. Then we expand our model in Equation 9 as follows:

where
As before, we estimate the model in Equation 13 using maximum likelihood estimation through the optim function in R. Our model estimate of
Discussion and Conclusion
In this research, to understand consumers’ in-store attention, we collect a novel and rich data set using ambulatory eye-tracking. Compared with previous research, in which eye-tracking is typically conducted in a laboratory environment (Deng et al. 2016; Meißner, Musalem, and Huber 2016; Shi, Wedel, and Pieters 2013), mobile eye tracking provides much richer and more realistic information on how consumers navigate the store and engage with merchandise in a complex and cluttered environment. Further, compared with previous research that relies on RFID and/or video tracking, the eye-tracking data allow us to capture not only the shopper’s path and field of vision but also the visual fixations at the SKU level.
This additional level of resolution and richness of data enable us to study the lateral and vertical attentional biases that customers exhibit while shopping and validate (or disprove) some of the common wisdom circulating in the practitioner community: that the right side is the “right” side (lateral bias) and that “eye level is buy level” (vertical bias). More importantly, we estimate the magnitude of these effects in an actual field context. In terms of lateral bias, our findings suggest that, as shoppers walk down an aisle, they have a 21% higher propensity to pay attention to products that are located on their right side. Surprisingly, this effect appears to hold for both right- and left-handed shoppers (note, however, that only 11% of our sample are left-handed), which leads to our speculation that lateral bias may be driven by ocular dominance (Porac and Coren 1976). In terms of vertical bias, we find that the ideal product height is not at eye level but rather about 15 inches below eye level, or 47 inches high for the average (62-inch eye level) shopper, consistent with findings reported by POPAI (2014). Managerially, for a standard five-level grocery shelf, the optimal shelf (with product height of 48 inches) is expected to generate about 14%–15% more attention compared with the top or bottom shelves, and 7%–8% more attention compared with the shelves that are immediately above or below it. Further, the extent of vertical bias is unrelated to category hedonicity but tends to become more pronounced during the latter part of the shopping trip, when the shopper has collected more items.
In conjunction with the predominant traffic patterns through the store (shown in Figure 7), our findings help retail managers determine which store regions and product shelves are more “valuable” in terms of attracting shoppers’ attention. For example, our results on lateral bias suggest that the east side of Aisle 2A (relative to the floorplan shown in Figure 7) is more valuable than the west side, because it is on the right-hand side for the predominant flow of traffic (68% northward). Further, our results on vertical bias indicate that a shelf positioned at a height of approximately 43 inches (assuming that the product’s center is about 4 inches high) should be close to the “ideal” height for shoppers. Finally, our discovery that vertical bias becomes more pronounced in the later part of a shopping trip implies that the differential between “better” or “worse” shelf positions should be greater for product departments and aisles visited near the end of the shopping trip, when the shopper is close to checking out.
The richness and novelty of the field ambulatory eye-tracking data provide many opportunities to gain additional insights into the drivers of shopper behavior. We conclude by listing several fruitful areas for future research:
1. Exploring visual search patterns: We consider a specific type of lateral bias: whether shoppers tend to pay more attention to product categories on their left or right side as they traverse an aisle. Another interesting research issue is the role of lateral bias within category shopping: that is, does a shopper tend to pay attention to products that are on the left or right side of their field of vision? Many retail practitioners believe that shoppers search the shelves from the left to right, possibly due to their reading habits (Root 2018), though Deng et al. (2016) did not find this pattern in their lab-based eye-tracking study. Our field eye-tracking data, once properly annotated, provide an additional empirical test for this hypothesis, as well as other behavioral hypotheses, such as the “central gaze cascade effect” (e.g., Atalay, Bodur, and Rasolofoarison 2012).
2. Automation and scaling via machine learning: We used a software-assisted manual process to annotate the eye-tracking video. As discussed, this process is extremely labor intensive. On average, a 30-minute eye-tracking video requires about 4 hours to annotate, due to multiple replays in slow motion to correctly identify the visual focal points. In total, we spent over 700 hours annotating the data set of 175 shopping trips. As the technology of computer vision matures (see, e.g., LeCun, Bengio, and Hinton 2015; Stallkamp et al. 2012), future research might employ a completely automated process to annotate the eye-tracking videos, which may help reduce the amount of human coding and annotation that is required and reduce the degree of potential subjectivity in the annotation process.
3. Further understanding of ocular dominance: We hypothesize that the observed lateral bias may be driven by ocular dominance (Porac and Coren 1984). We conduct an additional analysis of our data by further breaking down the aggregate data in Table 2 to the individual shopper level to explore any individual-level heterogeneity. We find that a two-segment latent class model, in which a large segment (71%) prefers the right side and a small segment (29%) prefers the left side, provides a superior fit compared with the single-segment model, which is consistent with our hypothesis that lateral bias is driven by ocular dominance. 13 We are, however, unable to formally test this proposition because ocular dominance is not measured in either the pre- or posttrip survey. In future studies, we would like to measure ocular dominance after the shopping trip using various methods, such as the Miles test (Kommerell et al. 2003), Porta test (Mapp, Ono, and Barbeito 2003), and/or the Dolman method (Linke et al. 2011). If ocular dominance is a significant driver of consumer heterogeneity, a potential managerial implication is that retailers may want to have two separate entrances (one on each side) of the store, so that consumers with different ocular dominance orientations would “self-sort” into different entrances, where their respective dominant paths through the store (e.g., Hui and Bradlow 2012; Larson, Bradlow, and Fader 2005) would be better oriented to suit their specific ocular dominance patterns.
4. Implications of consumer heterogeneity: Beyond ocular dominance, future research could investigate other kinds of consumer heterogeneity and the associated managerial implications. For instance, given that the majority of grocery shoppers are female (Schaeffer 2019), we recommend that grocery layout should in general be optimized for the “prototypical” shopper (female, with a median eye level of 61–62 inches) to maximize sales. However, for specific product categories that are regularly shopped by men (e.g., beer, shaving lotion), the “optimal shelf” may be a few inches higher than other categories. Further, we also encourage future research to study other sources of shopper heterogeneity such as weight, mobility, age, and visual acuity.
Supplemental Material
Supplemental Material, sj-pdf-1-mrj-10.1177_0022243721998375 - Understanding Lateral and Vertical Biases in Consumer Attention: An In-Store Ambulatory Eye-Tracking Study
Supplemental Material, sj-pdf-1-mrj-10.1177_0022243721998375 for Understanding Lateral and Vertical Biases in Consumer Attention: An In-Store Ambulatory Eye-Tracking Study by Ming Chen, Raymond R. Burke, Sam K. Hui and Alex Leykin in Journal of Marketing Research
Footnotes
Associate Editor
V. Kumar
Declaration of Conflicting Interests
The author(s) declared no potential conflicts of interest with respect to the research, authorship, and/or publication of this article.
Funding
The author(s) received no financial support for the research, authorship, and/or publication of this article.

Notes
References
Supplementary Material
Please find the following supplemental material available below.
For Open Access articles published under a Creative Commons License, all supplemental material carries the same license as the article it is associated with.
For non-Open Access articles published, all supplemental material carries a non-exclusive license, and permission requests for re-use of supplemental material or any part of supplemental material shall be sent directly to the copyright owner as specified in the copyright notice associated with the article.
