




Abstract
How will local violent conflict patterns in sub-Saharan Africa evolve until the middle of the 21st century? Africa is recognized as a particularly vulnerable continent to environmental and climate change since a large portion of its population is poor and reliant on rain-fed agriculture. We use a climate-sensitive approach to model sub-Saharan African violence in the past (geolocated to the nearest settlements) and then forecast future violence using sociopolitical factors such as population size and political rights (governance), coupled with temperature anomalies. Our baseline model is calibrated using 1° gridded monthly data from 1980 to 2012 at a finer spatio-temporal resolution than existing conflict forecasts. We present multiple forecasts of violence under alternative climate change scenarios (optimistic and current global trajectories), of political rights scenarios (improvement and decline), and population projections (low and high fertility). We evaluate alternate shared socio-economic pathways (SSPs) by plotting violence forecasts over time and by detailed mapping of recent and future levels of violence by decade. The forecasts indicate that a growing population and rising temperatures will lead to higher levels of violence in sub-Saharan Africa if political rights do not improve. If political rights continue to improve at the same rate as observed over the last three decades, there is reason for optimism that overall levels of violence will hold steady or even decline in Africa, in spite of projected population increases and rising temperatures.
Keywords
Introduction
How will the local patterns of violent conflict in sub-Saharan Africa change through the middle of the 21st century? Africa is recognized as a particularly vulnerable continent to environmental and climate change since a large portion of its population is poor and is reliant on rain-fed agriculture. Our research uses a climate-sensitive approach to model sub-Saharan African violence in the past and then forecasts violence trends using key explanatory variables that have been shown to influence conflict. Forecasting the future is an exercise fraught with uncertainty but valuable when used as a tool to explore the outcomes of plausible political, social and climate scenarios. There is a growing literature on scenario development in the context of environmental decision making (Mahmoud et al., 2009; Steinitz et al., 2003) and climate change (O’Neill et al., 2014), and we adopt this general approach to explore shared socio-economic pathways (SSPs) for violent conflict in sub-Saharan Africa. In particular, we consider future scenarios that vary fertility assumptions, governance trends and climate projections.
Conflict forecasting in the study of environmental change and conflict
Predictions are increasingly used in conflict research and are based on two general motivations. One approach uses predictions (either in- or out-of-sample validation) to assess the influences of independent variables upon an outcome of interest (Ward, Greenhill & Bakke, 2010; O’Loughlin, Linke & Witmer, 2014; O’Loughlin et al., 2012; Wischnath & Buhaug, 2014). Another uses modeling and simulation techniques to forecast observed trends into the future. Interest in this second kind of analysis has been growing in recent years (Hegre et al., 2013, 2016, 2017; Ward et al., 2013; Blair, Blattman & Hartman, 2017; Beger, Dorff & Ward, 2014; O’Brien, 2010; Schneider, Gleditsch & Carey, 2011; Schrodt, Yonamine & Bagozzi, 2013). We are primarily motivated by this second type of forecasting, though initial steps in our research rely on model validation using observed data for recent years.
We forecast conflict using multiple future climate scenarios to address a question of great interest to academic and policy communities: how do climate variability and environmental stress lead to violent conflict? In doing so, we are contributing to a growing body of literature published in Science (Hsiang, Burke & Miguel, 2013), Nature (Hsiang, Meng & Cane, 2011), Proceedings of the National Academy of Sciences (Buhaug, 2010; Burke et al., 2009; O’Loughlin, Linke & Witmer, 2014; O’Loughlin et al., 2012; Schleussner et al., 2016) and Global Environmental Change (Böhmelt et al., 2014; Ide et al., 2014; Linke et al., 2015). Similarly, journals in the fields of political geography (De Juan, 2015), development economics (Maystadt, Calderone & You, 2015), climate studies (Theisen, Gleditsch & Buhaug, 2013), and peace research (Koubi et al., 2012) contain valuable contributions that consider particular social conditions that enable climatological extreme events to affect societal conflict. Robust debate continues about the relative importance of climate factors on conflict with Buhaug et al. (2014) arguing that Hsiang, Burke & Miguel (2013) overreach in their conclusion that deviations from normal temperatures increase the risk of conflict across multiple temporal and spatial scales.
Our contribution to the climate–conflict body of research therefore moves beyond the study of only the past and present. To that end, we consider two specific questions in the context of the climate–conflict literature. First, what will future patterns of conflict look like? Second, what factors are driving those future patterns? None of the research cited above includes substantial engagement with projected climate scenarios though generalized statements have been made. Hsiang, Burke & Miguel (2013: 1235367) argue, for example, ‘because locations throughout the inhabited world are expected to warm two to four standard deviations by 2050, amplified rates of human conflict could represent a large and critical impact of anthropogenic climate change’. But where would we observe such a spike in violence and under what circumstances? Answering these questions is a logical extension of existing research and is a key goal in this study. We quantify expectations about violent conflict patterns in geographically disaggregated predictions for sub-Saharan Africa until 2065.
In modeling and forecasting violence across all of sub-Saharan Africa at a 1° (degree) grid resolution, we explicitly consider the effects of temperature variability, while controlling for temporal reporting bias in the coding of our violent event data. Additionally, we account for a number of key social and political variables that have known associations with violence. The incorporation of these effects into regression analyses has been debated; while some encourage a thorough and dedicated effort to capture the specific geographical contexts and social settings of violence (e.g. Raleigh, Linke & O’Loughlin, 2014), others do not explicitly include these possible influences in statistical estimations even though data are available (e.g. Hsiang, Burke & Miguel, 2013). By including these sociopolitical factors with temperature variability, we are able to evaluate the relative contribution of each.
In this article, we consider especially the role of political settings within which conflicts emerge. There is strong evidence that poor governance within countries – for example, institutions that are discriminatory or exclusionist against certain groups – contributes to the risk of coup attempts, secessionist movements, and scattered terrorist attacks. With this understanding, testing the relationship between rising temperatures and violence should be only one piece of a larger puzzle; identifying if, when, and where temperature fluctuations might lead to conflict in different settings is the key aim. Instead of making a single forecast of conflict into the future based on specific temperature estimates, we extend such an exploration by adding alternative scenarios for social indicators like political regime type. We combine these social indicators following the shared socio-economic pathways (SSPs) concept (Absar & Preston, 2015; O’Neill et al., 2014). By changing the values of the model inputs for the forecasts, we can conceptually ‘experiment’ with the effects of social conditions on conflict risk as a result of the projected changes in global and local temperatures that are expected according to the Intergovernmental Panel on Climate Change (Stocker et al., 2013). In this way, our research directly addresses the question of what underlies the predicted geographical and temporal patterns.
Our theoretical starting point is that the local setting of environmental stress matters for the ability of populations to adapt. We quantify different social settings, or contexts, using projected political regime type and demographic indicators. This research represents a logical extension of prior climate change–conflict scholarship, including Burke et al. (2009) who report a null effect for the level of democracy on the risk of violence. By contrast, our results below indicate that societies and governments can effectively intervene in the face of environmental stress to mitigate conflict risk.
The quality of governance in sub-Saharan Africa, a key variable of interest in this study, is generally poor. Institutions are only partially representative and are fully autocratic in some cases, with perennially curtailed individual political and economic liberties for citizens. There are important implications of these governance restrictions for the resilience and adaptive capacity of communities in the face of climate change. For this reason, political regime type is a centrally important input variable for our five SSPs, detailed below. An environmental disaster, a devastating flood for example, can cause crops to fail, encourage urgent migration into already overpopulated areas, and decimate a national or regional economy. In a case where extreme temperatures affect crop production in only some regions of a country, repressive and autocratic regimes will be unlikely to respond adequately to the needs of affected segments of the population. This is especially true in cases where governments actively discriminate against opposition groups, often determined by ethnic affiliation, a known possibility in the clientelistic and patronage regimes that dominate our study area (Clapham, 1982; Schleussner et al., 2016). The role of governance in ameliorating or worsening resource conflicts has been highlighted since Homer-Dixon’s (1999) book on environmental security.
The premise of our study is that social institutions in a country represent moderating influences that define two pathways toward potential outcomes, one violent and the other comparatively peaceful. Where governments fail to serve the interests of the majority of citizens, social safety nets do not ease the burden of shocks to national political and economic life. Furthermore, in the private and informal arenas of social life, the viability of economic activities and the possibilities for political expressions of grievances are limited, resulting in elevated risks of experiencing conflict (Cederman, Gleditsch & Buhaug, 2013). In contrast to the conflict-prone impacts of ineffective or discriminatory governance, countries with representative and inclusive regimes are likely to have characteristics that enable them to fare comparatively well under adverse environmental, climatological or economic conditions. There may be insurance or government aid for losses incurred by both farmers and pastoralists, for example, and this would help to sustain a household’s livelihood. As a result, it is not necessary for those affected to turn to illegal or risky activities to obtain essential goods. Furthermore, good governance over the longer term can create more resilient communities, reducing the need for government assistance during times of environmental stress.
Our theoretical lens incorporates the possibility for climate and weather variability adaptation, which Adger (2006) defines as a key tool for reducing vulnerability. Dell, Jones & Olken (2014) consider social science investigations of climate change effects to be ‘damage function’ studies where adaptation to environmental stress can occur over both short-term (e.g. a farmer growing a different crop) and long-term (e.g. labor and capital migration) periods. ‘Government institutions and policy, including policies around public goods, innovation, and market integration, may also play important roles in the degree and nature of adaptive responses’ (Dell, Jones & Olken, 2014: 772). We assume that adaptation to adverse conditions will depend on the institutional contexts present in an area. How effectively particular societies adapt to climate change is, of course, uncertain. Burke, Hsiang & Miguel (2015: 608) suggest that in East Africa between 1990 and 2009, adaptation may not have taken place, contributing to more violent conflict. Nevertheless, we believe that it is important to maintain the possibility for adaptation and situate its likelihood into our definitions of social context below.
Without effective management of agricultural production, land access, and the availability of clean water, we expect rapidly growing populations to exacerbate the social stress associated with natural resource scarcity. Our objective is to consider this simple possibility with data characterizing the political circumstances in which people compete for resources. An environmentally deterministic position would disregard our sensitivity to socio-economic context. Parry et al. (2004) stressed that the number of people at risk of hunger in sub-Saharan Africa will rise more rapidly than that for people living in other regions. Provision of food from more productive regions can fill in some of the production deficits in sub-Saharan Africa, but consumption patterns tend to be localized in Africa and accounting for population change at subnational scales is critically important.
To operationalize the climate–conflict nexus, we hypothesize that conflict levels will increase along with rising temperatures if political rights deteriorate and population growth continues to rise. If sub-Saharan Africa’s political rights improve toward democratic levels and population growth moderates, conflict levels will not rise with predicted increased temperatures. We capture these extreme cases and other possible future scenarios in our SSPs. Figure 1 presents our expectations for these relationships. While a single coefficient estimate in our statistical model could return conflict predictions (right side of the figure) based on the values for the extreme climatic conditions (left side), this would be a pathway without explanation for the observed pattern. Our approach instead leverages comparisons between scenarios in the country-level contexts (A and B in the diagram) within which social stress emerges and we attribute the possible transmission of temperature extremes into political conflict as a function of these alternative sociopolitical contexts. An optimistic future scenario of expanding political rights and moderate population growth is captured by Context A in the figure. Context B depicts a more pessimistic scenario where population growth rises rapidly and political rights worsen.
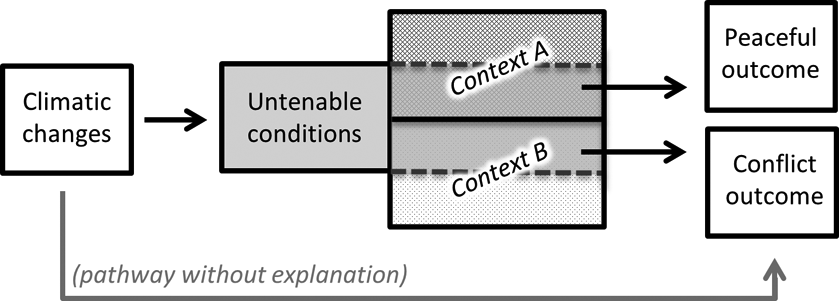
Schematic representation of the hypothesized relationship with sociopolitical contexts A and B as moderating/conditional settings (SSPs) for the effects of extreme climatological shocks
Climate projections for Africa
Sub-Saharan Africa, particularly the Sahel and the Greater Horn of Africa, has experienced large variability in climate on interannual and decadal scales (Lamb & Peppler, 1992) leading to devastating droughts, floods, and famine (Washington et al., 2006). The extremely dry Sahel of the 1970s and 1980s was associated with cooler sea-surface temperatures in the northern tropical Atlantic relative to a warmer southern Atlantic, while southern Africa’s recurrent droughts seem to be associated with changes in the Indian Ocean, which has warmed more than 1° Celsius since 1950 (Hoerling et al., 2006).
The signals of climate change projected for Africa are emerging against this background of variability. For the continent as a whole, the mean temperature has increased since 1960 (Conway, Mould & Bewket, 2004; Kruger & Shongwe, 2004; Malhi & Wright, 2004), with more extreme hot days and nights and fewer extreme cold days and nights in southern and western Africa (New et al., 2006). Based on the reference period 1986–2005, the Intergovernmental Panel on Climate Change (Stocker et al. 2013) projects the continental mean warming trend to continue. Generally, wet areas are likely to get wetter and dry areas drier but some traditionally dry areas, such as East Africa, are projected to get wetter. The projected precipitation change for the coming decades is small compared with the magnitude of the natural internal variability of mean precipitation in Africa (Christensen et al., 2007). The sign of the projected precipitation change in both the near and long-term future has large uncertainties, with Africa and other tropical areas having the highest uncertainties in the local precipitation change (Rowell, 2011); the West African Sahel is noted for having a large spread in model projections (Roehrig et al., 2013). Uncertainties in projected precipitation change are associated with sea surface temperature (SST) changes, atmospheric and land surface processes, and the terrestrial carbon cycle. For example, in mid-century projections, warming of the Indian Ocean is associated with drying in southern Africa due to the corresponding atmospheric ascent over the ocean and subsidence over the land (Hoerling et al., 2006).
Historical and future data
To generate our forecasts of future violence, we compile historical data on factors known to influence the risk of violent conflict, and then limit these to the most important ones (our assessment of variable influences is explained below) that we can project into the future (Table I). Our forecasts do not simply extrapolate from recent data; they use covariates with known influences on conflict risk and then incorporate their future projections into our violence forecasts.
Variables used in estimating the baseline models, validation models, and future forecasts
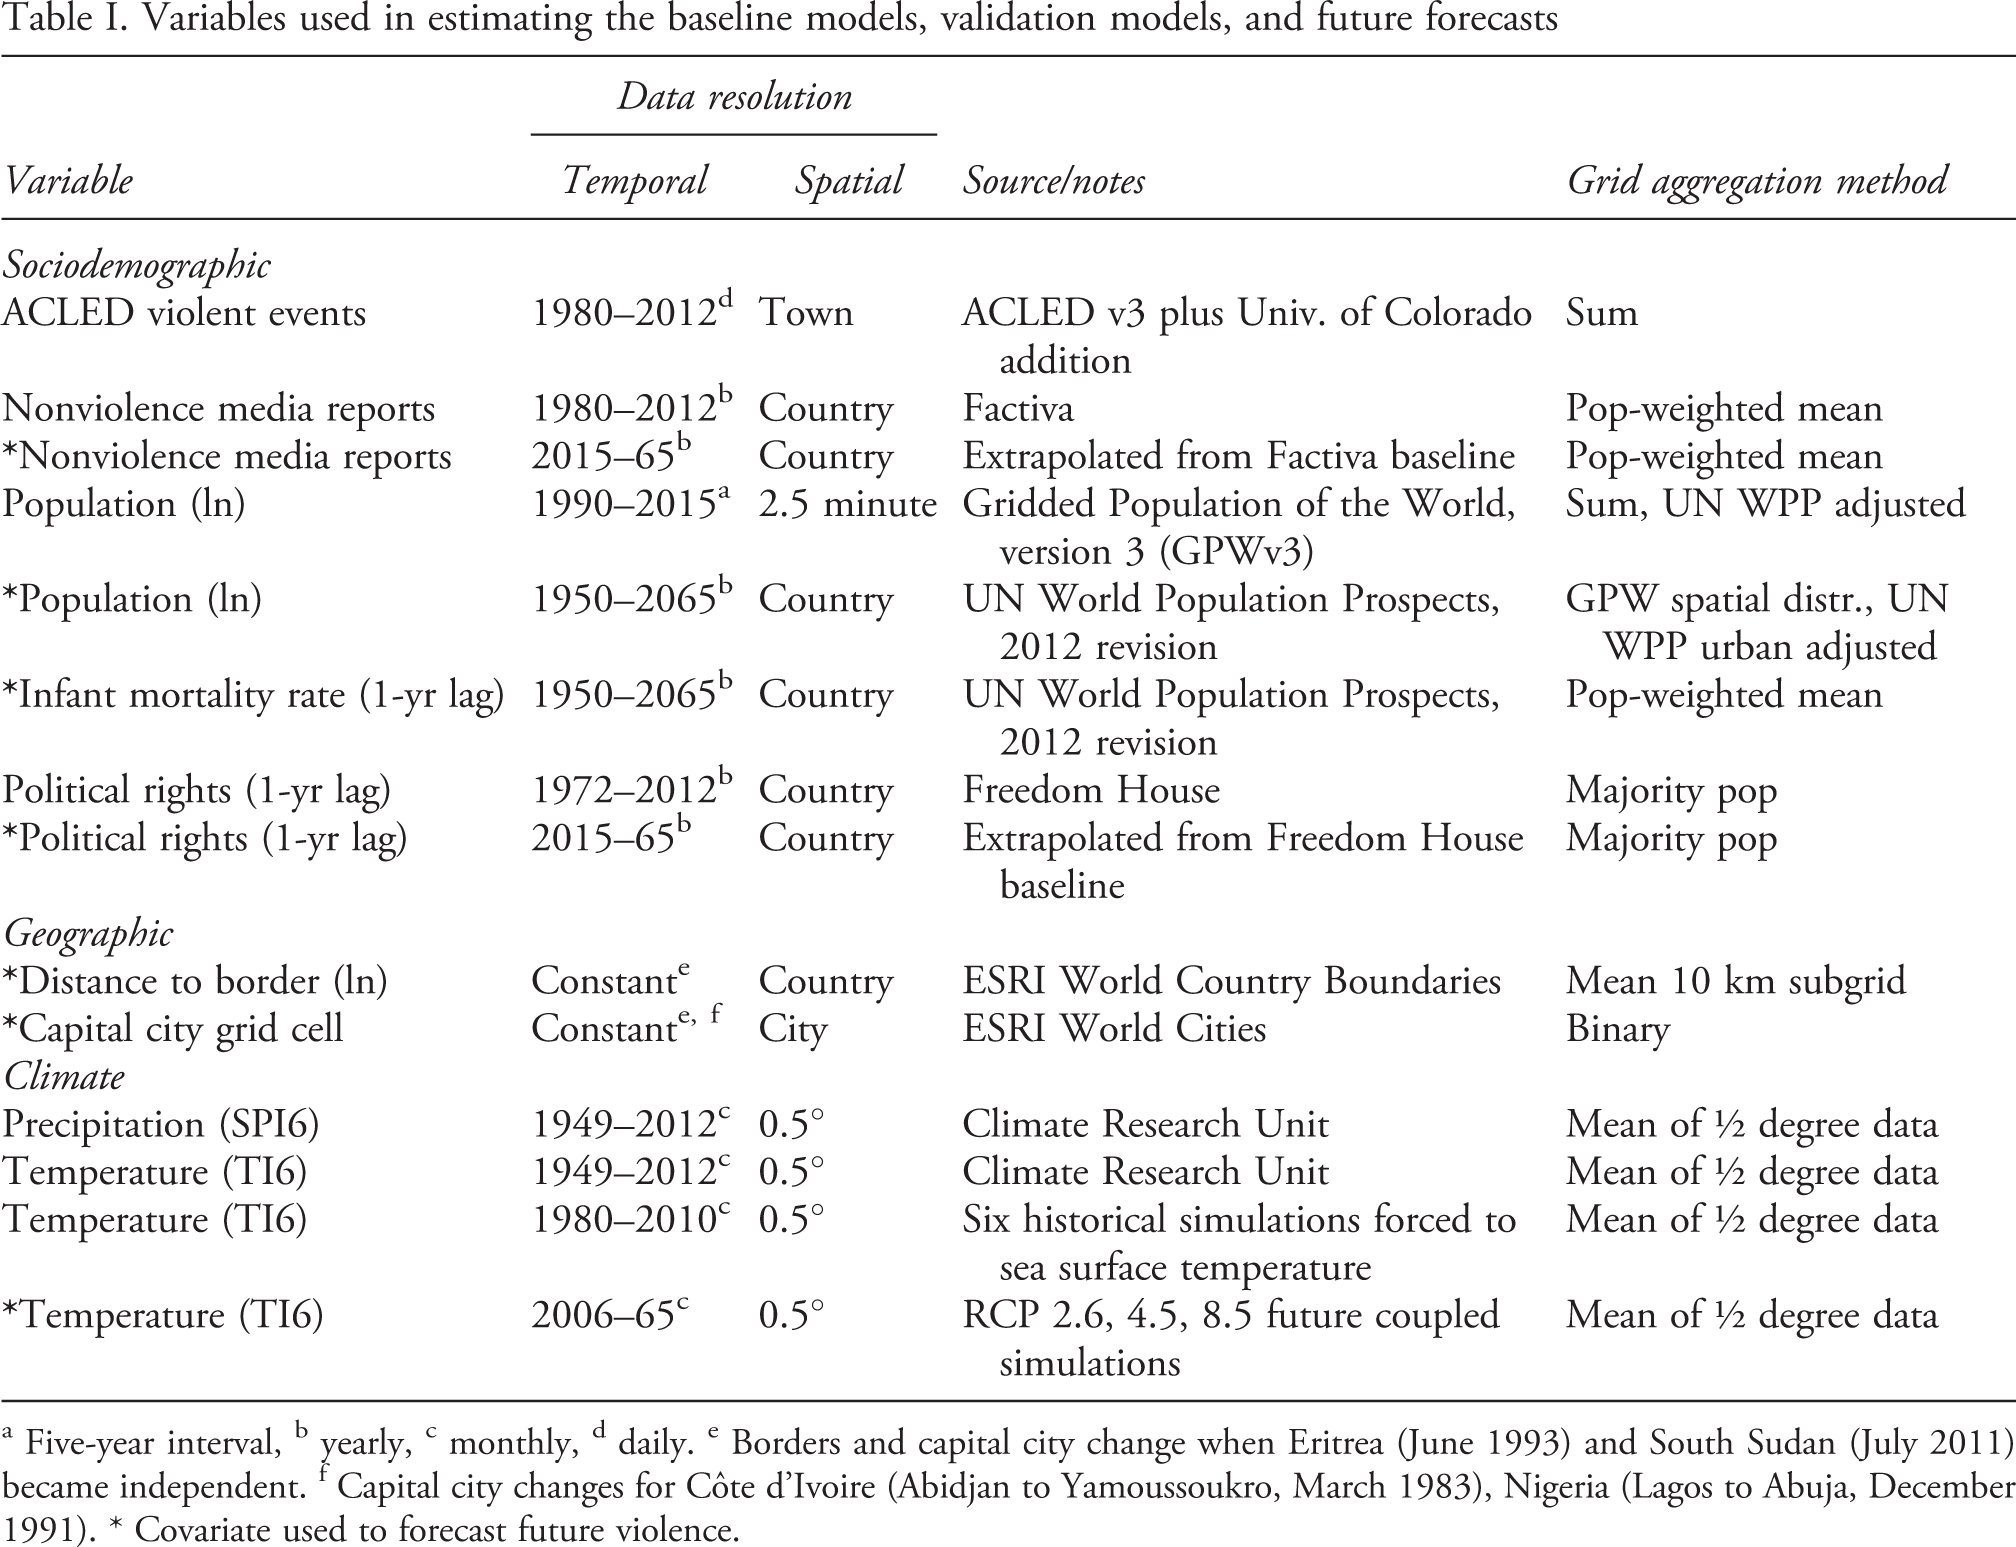
a Five-year interval, b yearly, c monthly, d daily. e Borders and capital city change when Eritrea (June 1993) and South Sudan (July 2011) became independent. f Capital city changes for Côte d’Ivoire (Abidjan to Yamoussoukro, March 1983), Nigeria (Lagos to Abuja, December 1991). * Covariate used to forecast future violence.
Conflict data and media reports
To measure violence, we use an extended version of the Armed Conflict Location and Event Dataset (ACLED), which is based primarily on media reports of violence geolocated to the nearest settlement (Raleigh et al., 2010). These data code for political violence such as riots, protests, violence against civilians, and battles between rebel and government factions with a daily temporal resolution. The published ACLED data begin in 1997, and we have extended them backwards to 1980 using the published codebook and similar procedures.
Since the volume of reported violence is sensitive to the extent and depth of media coverage, we include media reports that exclude violence to control for the increasing volume of reports over time. These nonviolent data are derived from annual Factiva media reports for each country. This is an important component of our model since we need to ensure that we are estimating risk factors for violence over space and time, and not just capturing a technologically driven temporal trend due to the availability of electronic event data after the mid-1990s. We project these media reports into the future by assuming they will continue to increase linearly as they have since about 1995 (see Online appendix, Figures A1 and A2).
Explanatory variables
Our population metric is derived from the Center for International Earth Science Information Network (CIESIN) Gridded Population of the World (GPW), version 3 dataset (Balk & Yetman, 2013). These 2.5-minute resolution data were aggregated to our grid cells and adjusted so that the total country populations matched the United Nations (UN) World Population Prospects (WPP) 2012 report numbers (United Nations, 2014). The WPP data include consistent historical and future country-level population estimates with sub-Saharan Africa population estimates ranging from 2.2, to 2.7, to 3.2 billion in 2065 according to low, medium, and high fertility models, respectively. These latest UN data take into account the upwardly revised fertility rates for Africa (Gerland et al., 2014). By standardizing the spatially disaggregated GPW to the WPP data, we can use WPP forecasts without introducing any discontinuities into the population figures.
For future population data, we use the GPW spatial distribution (2.5-minute resolution) to allocate the UN WPP country-level projections for the low, medium, and high fertility scenarios. The spatial allocation is not uniformly proportional into the future since we modify the estimate to take into account UN WPP urbanization projections, thereby assuring that urban areas grow faster than rural areas and thus receive a greater share of future population growth. Urban population growth is added to current urban areas, and rural population totals are matched to rural grid cells. These fine-resolution allocations are then aggregated to our 1° unit of analysis.
Socio-economic well-being is important because locations in poor areas typically have higher levels of violence. To capture this influence as others have (Theisen, Holtermann & Buhaug, 2012), we use the infant mortality rate (IMR) as a proxy for well-being. In contrast to indices of wealth, IMR is easier to measure and more reliable; therefore, the UN WPP historical and future data do not suffer from many missing values (United Nations, 2014). For future analyses, it may be possible to use night-time lights as a surrogate for local wealth estimates as have Weidmann & Schutte (2017), though the temporal range of the night-time lights data limits their usefulness.
We also include a measure of governance that captures the political rights for each country. These political rights data from Freedom House (7 = least free, 1 = most free) measure the effects of formal political institutions (Freedom House, 2013). Both the IMR and political rights variables are lagged one year to mitigate endogeneity with the outcome measure, conflict events. To estimate governance in the future, we consider three scenarios (see SSP definitions below for combination with other data). In the pessimistic outlook, we assume that African political rights will decline to the levels of the 1980s. In the optimistic scenario, political rights for every country improve (the scores improve towards a value of 1) by following the linear trend for all of sub-Saharan Africa, 1980–2012. Our middle-of-the-road scenario holds political rights constant for each country (Online appendix Figures A3 and A4).
Since borders are areas that frequently experience higher levels of conflict as we have shown in our previous work (O’Loughlin et al., 2012; O’Loughlin, Linke & Witmer, 2014), we include a distance to border metric by calculating the mean distance to international borders for a 10km subgrid, and then aggregate these to our 1° grid. To further examine geographic effects, we add a binary variable for the grid cell that contains the capital city of each country. This factor is especially important for capturing political violence targeting the incumbent regime since capital cities tend to be the sites of major violent protests and rioting, and these events form part of the ACLED data.
Climate data
Historical climate data are derived from the 0.5° monthly Climate Research Unit (CRU) TS3.21 dataset from the University of East Anglia (Harris et al., 2014). The CRU data cover land areas only and include the number of stations used to interpolate each grid value, which allows the reliability of the values to be determined objectively. From these data, we calculate temperature and precipitation anomaly indices by comparing the most recent six months of data with the prior 30-year climatology for those same six months and grid locations. Our use of a running 30-year climatology instead of a fixed climatology allows for the possibility that societies will adapt to changing conditions. For rainfall, this is the Standardized Precipitation Index, SPI6, normalized using an incomplete gamma distribution where values near 0 indicate normal precipitation and –1 indicates that the last six months were one standard deviation drier than usual (McKee, Doesken & Kleist, 1993). The temperature index, TI6, is calculated in a similar manner (though using a standard normal distribution) with positive values indicating hotter than usual temperatures. This normalization process allows us to directly evaluate the effects of precipitation and temperature anomalies across grid cells with different climates.
We use climate models in two ways, to validate our violence model and to project future climate conditions. For both the historical and future climate forecasts, we use simulated climates generated from the Community Earth System Model (CESM; Hurrell et al., 2013). Though there are other climate models that could be used (Burke et al., 2015), CESM uses a wide range of future emissions possibilities that covers the range of future climate scenarios, and is well validated for the present climate. To validate our statistical model of violence, we estimate it using the simulated historical climate data generated by running the atmosphere and land model with monthly mean observed sea surface temperature (SST). This ensures that large-scale climate patterns from surrounding oceans are used to force the model, and for regions where the modes of SST variability are important, this reduces climate variability and variance from historical observations. Land temperatures and the atmospheric hydrologic cycle (including precipitation) are allowed to evolve freely. The benefits can clearly be seen in the temperature anomaly figure where present day (1980–2010) model simulations closely track observed regional SST anomalies (Figure 2). 1 Six different simulations are used: they vary only in an initial round-off level perturbation to the surface pressure field to set the ‘weather’ states on different trajectories. The resulting climate anomalies are similar, and the spread relates to the remaining unforced internal variability in the model.
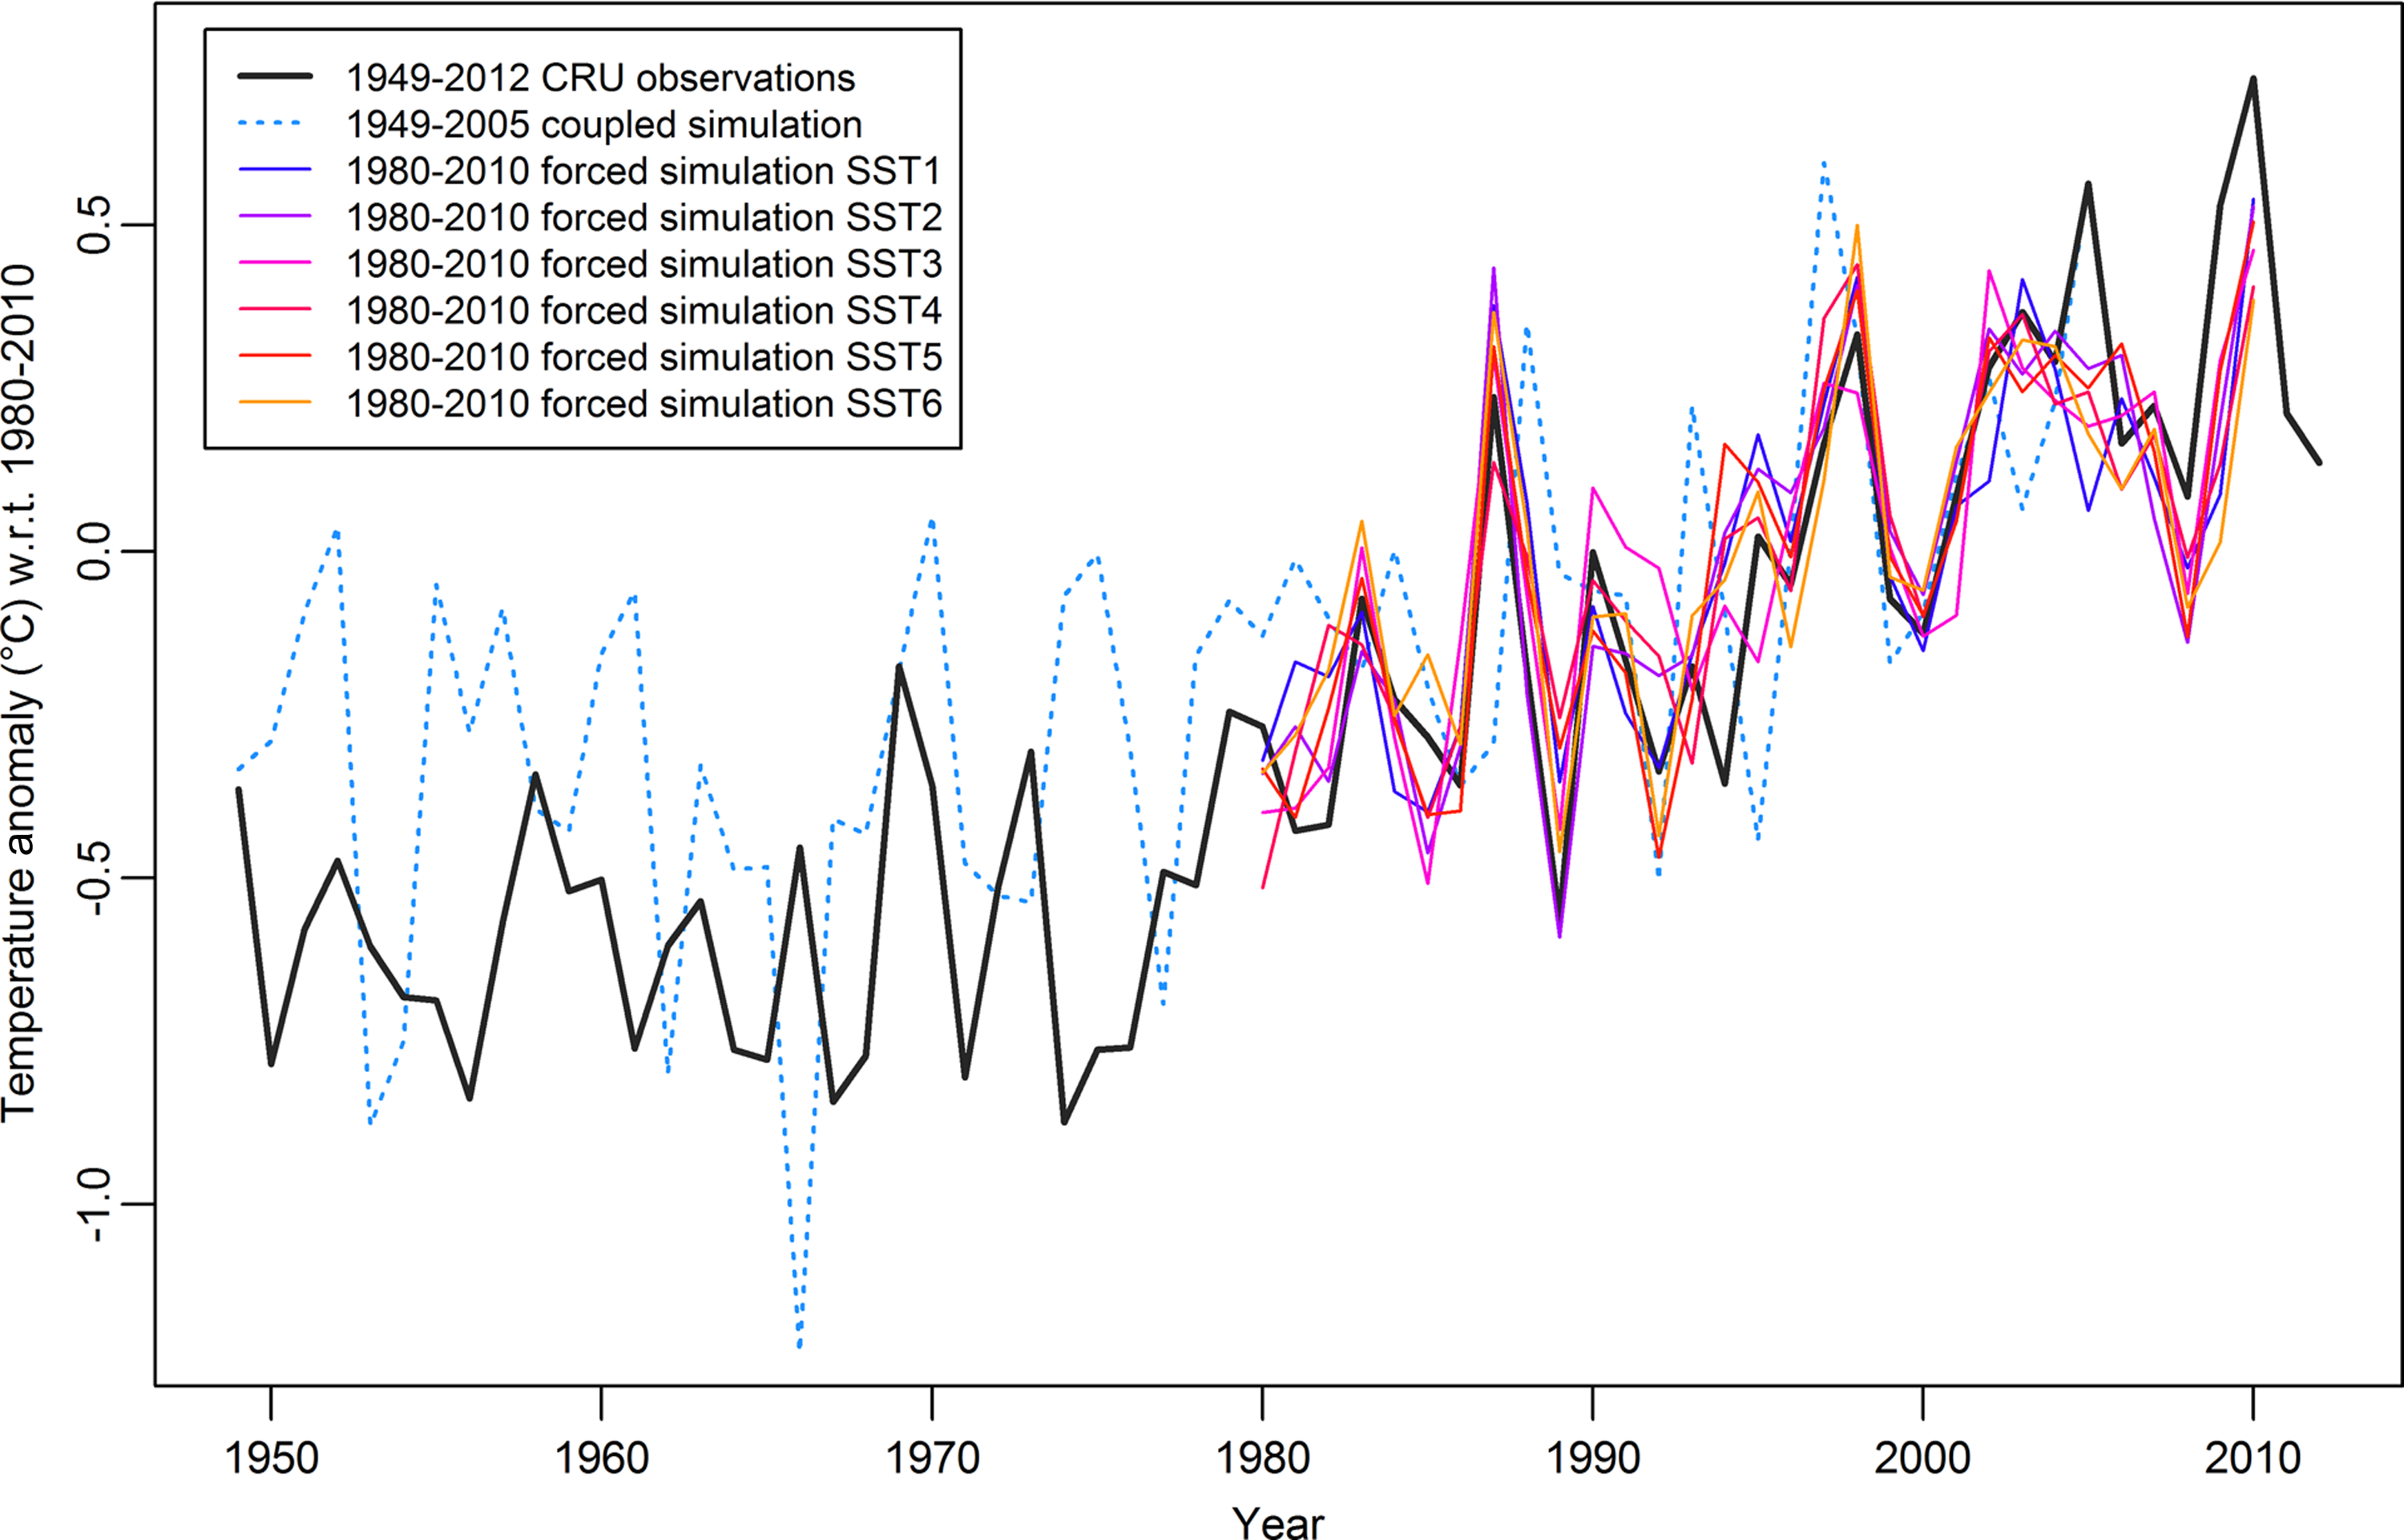
Sub-Saharan Africa historical temperature anomalies 1949–2012 for CRU data, a coupled simulation, and six specified sea surface temperature (SST) simulations
We also run future projections with the CESM. Future simulations are conducted with the simulated atmosphere model coupled to a dynamic ocean model. Simulations use several different anthropogenic emissions scenarios or representative concentration pathways (RCPs) that specify the climate forcings, in particular, CO2 levels (Van Vuuren et al., 2011). In this article, we use a range of scenarios from a ‘high’ or baseline emissions case with 8.5 Wm–2 of radiative forcing by 2100 (RCP8.5), a ‘moderate’ case assuming 4.5 Wm–2 of forcing (RCP4.5), and a ‘low’ emissions case of 2.6 Wm–2 forcing (RCP2.6). The scenarios are based on integrated assessment models that include assumptions about population projections, technology improvements, and possible limits on emissions of greenhouse gases due to national policies. RCP8.5 features a ‘wealthier’ world with higher population growth than the other scenarios, but all three are deemed plausible (Stocker et al., 2013).
Future climate simulations use the fully coupled version of CESM with the three different scenarios (RCP8.5, RCP4.5, and RCP2.6). We extract monthly mean physical climate statistics for the study area from the model outputs and use it as a ‘synthetic’ set of climate data to calculate future precipitation and temperature anomalies for input to the statistical models. As with the historical fixed SST scenarios, multiple simulations with small perturbations between them are used to sample the possible internal variability in the model for each scenario. To maintain internal consistency, future precipitation and temperature anomalies are calculated against a rolling 30-year climatology from a corresponding coupled historical simulation, 1949–2005 (Figure 2). This coupled simulation is forced by greenhouse gases and observed natural forcing such as volcanic eruptions. It will not reproduce the exact timing of internal modes of variability (such as the El Niño–Southern Oscillation) as in the uncoupled simulations with fixed sea surface temperatures.
Baseline models
Our spatiotemporal units of analysis are the 2,062 1° x 1° grid cells overlaid on 42 countries of sub-Saharan Africa for each month (see Figure 5 for their spatial distribution). The 33 years of data yield 816,552 grid-month observations used to calibrate our statistical models. Our approach is to generate estimates for our baseline models, and then use our projected covariates to generate future forecasts. We use a Poisson 2 multilevel model with country-level random effects and log link function of the form:

In-sample predictive power plot for Model 1
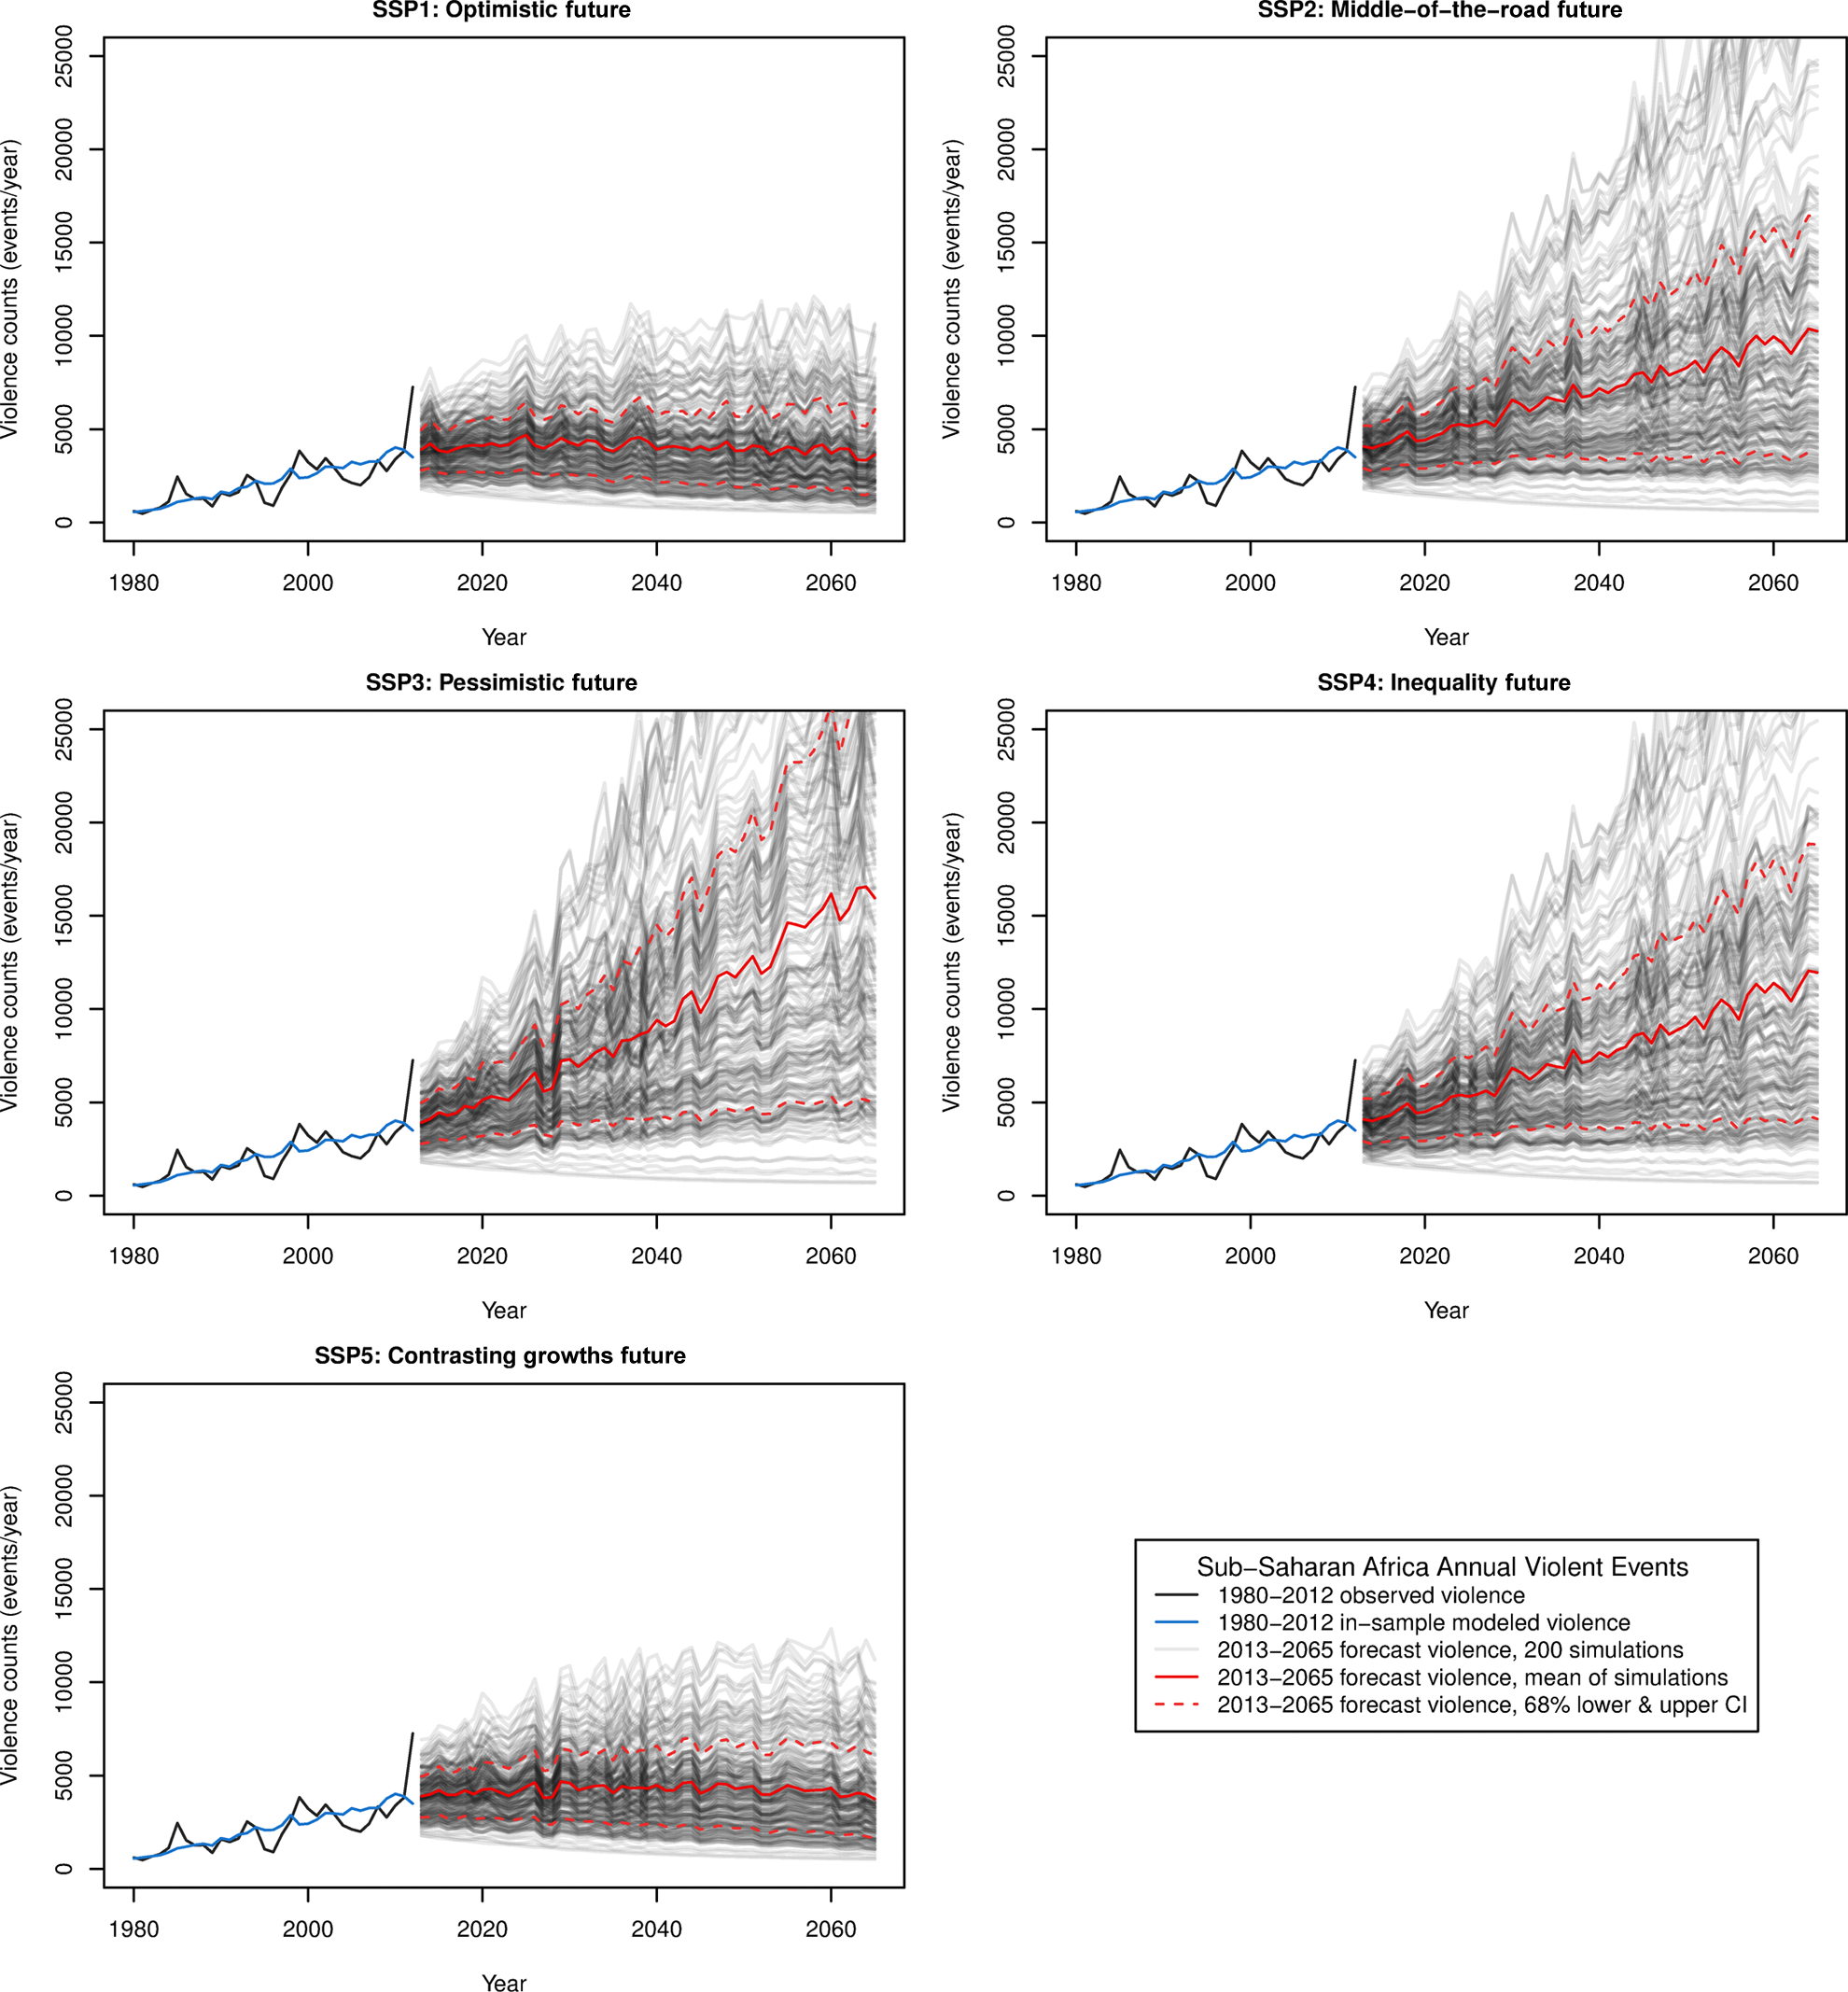
Forecast annual violent event counts for all of sub-Saharan Africa through 2065 for each of the defined shared socio-economic pathways (SSPs)

Observed and forecast violence for SSP2, middle-of-the-road future


where β0c are the country-level intercepts, β1 are the coefficients (fixed part) for the grid-month predictors Xij, and ∊ ij captures the remaining unexplained error. Our motivation for using a multilevel model is to capture the nested structure of the relationship we investigate, allowing spatially disaggregated processes among units of analysis to take place within broader social settings. We also prefer our random effects specification to fixed effects, due to the large number of non-conflict observations that do not contribute to the statistical analysis when using a fixed effects specification (Beck & Katz, 2001).
Since our models have a large number of observations, the usual standard errors are underestimated. Robust clustered standard errors are frequently used to address this situation, but since they are typically not used with multilevel models, we empirically calculate the standard errors from 200 bootstrapped coefficient estimates. Given the multilevel structure of our data, we employ a hierarchical resampling approach that reflects the data generating process as closely as possible (Davison & Hinkley, 1997). In particular, we resample the observed data with replacement for the country level first, then grid cell level, and then monthly level.
Our initial baseline model, Model 1, includes the full suite of sociodemographic, geographic, and climatic predictor variables (Table II). Statistical significance from the bootstrap standard errors indicates that the coefficients for precipitation anomalies, well-being, and distance to border do not differ from 0. Model diagnostics for area under the receiver operator curve (AUC-ROC), the precision-recall curve (AUC-PR), and the Brier score are calculated for our count data by truncating predicted values above 1.
Poisson random effects multilevel models (MLM-RE), 1980–2012
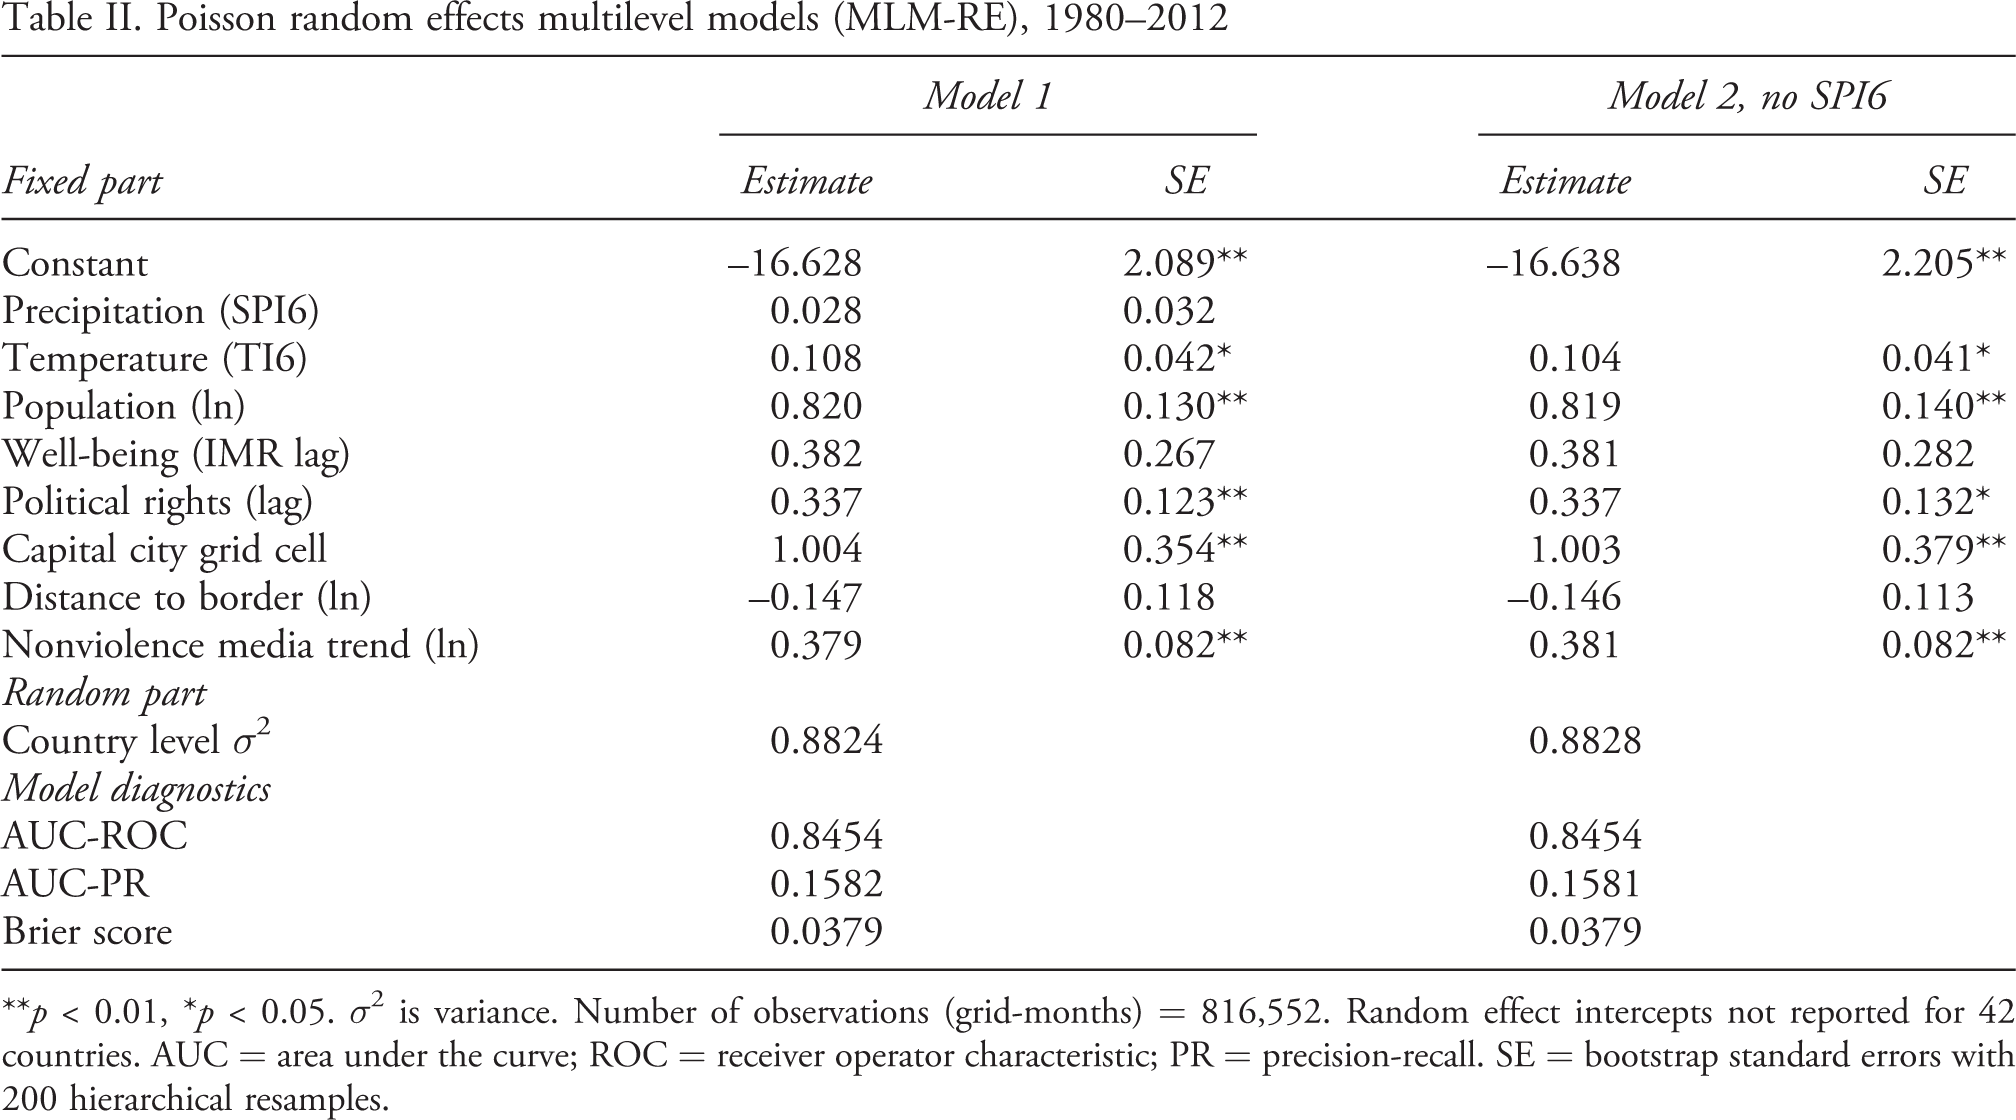
**p < 0.01, *p < 0.05. σ2 is variance. Number of observations (grid-months) = 816,552. Random effect intercepts not reported for 42 countries. AUC = area under the curve; ROC = receiver operator characteristic; PR = precision-recall. SE = bootstrap standard errors with 200 hierarchical resamples.
We explore the contribution of each variable further by plotting the predictive power contribution of each variable as captured by the AUC-ROC against the z value from the bootstrapped standard error (Figure 3). This step provides additional information by which to evaluate the importance of each variable for violent conflict. To avoid introducing excess random noise into our future forecasts, we drop precipitation (SPI6) from Model 1, and re-estimate the coefficients in a trimmed version, Model 2 (Table II). Although this model does not have an explicit precipitation metric, radiative and sensible heat fluxes are products of temperature and guide the local precipitation response over land (Muller & O’Gorman, 2011). Material well-being (IMR) and distance to border are retained since they contribute to the overall predictive power of the model (Figure 3). Our finding for precipitation runs counter to some expectations in the literature (e.g. Miguel, Satyanath & Sergenti, 2004), but there are several possible explanations for the alternative conclusions. Miguel, Satyanath & Sergenti (2004) study civil war at a country level, where a year must count at least 1,000 deaths in confrontations between a government and cohesive rebel organization. Instead, we focus our attention on the kind of low-level deadly violence that is more common in sub-Saharan Africa recently. At a local level, populations often migrate in a time of drought; Miguel, Satyanath & Sergenti (2004) cannot capture these subnational level reactions to precipitation variability.
To increase confidence in our modeling decisions, we estimate a set of alternate models and describe the results in the Online appendix. We change the measure of violence by predicting the ACLED subtypes representing violence against civilians, riots/protests, and battle events (Table A1). In addition to these subtypes, we replace the ACLED dataset by testing the model specification using the Uppsala Conflict Data Program Georeferenced Event Data (UCDP-GED) data (Croicu & Sundberg, 2015; Sundberg & Melander, 2013). Table A2 shows results for this model and for two variants that drop the nonviolence media reports and exchange the political rights metric for a polity score (Polity IV Project, 2014).
We also estimate models with varying drought representations by explicitly combining temperature and precipitation. Table A3 shows these results for a hot and dry measure (a simple difference: TI6–SPI6) and also for a more sophisticated six-month Standardized Precipitation Evapotranspiration Index (SPEI6) that combines the precipitation and temperature record with the latitude for each grid cell. Finally, we present the variants of the main Table II models that calculate the temperature and precipitation anomalies using the long-term climatological record from 1949 to 2012 instead of the 30-year rolling climatologies (Table A4). These results in the Online appendix underline and support our main findings from Table II (full country-level random effects are reported in Table A5 and Figure A5). The Online appendix also presents an out-of-sample model validation (Table A6) and models using the six historical climate simulations (Table A7).
Violence forecasts for sub-Saharan Africa, 2015–65
To forecast violence, we use coefficients from Model 2 estimated from the full duration of observed data, 1981–2012. We focus our results on five future scenarios (Absar & Preston, 2015; O’Neill et al., 2014) that allow population growth, political rights, and climate projections to vary in line with what we might expect for each of the shared socio-economic pathways (SSPs). Explicitly modeling future variation in political rights within the SSPs is reasonable since democratizing trends and reversals in political and civil rights are well documented for sub-Saharan Africa (Lindberg, 2005):
SSP1: ‘Optimistic’ future. This is a best-case scenario where population growth is low and political rights improve. Temperature simulations use RCP2.6. SSP2: ‘Middle-of-the-road’ future. This is a mid-course scenario with medium population growth and constant political rights. Temperature simulations use RCP4.5. SSP3: ‘Pessimistic’ future. This is a worst-case scenario where high population growth is combined with a decline in political rights. Temperature simulations use RCP8.5. SSP4: ‘Inequality’ future. Globally population growth varies but remains high for poorer areas such as sub-Saharan Africa. Political rights remain constant and temperature simulations use RCP4.5. SSP5: ‘Contrasting growths’ future. Low population growth and political rights improvements are combined in this scenario of best social outcomes and worst climate changes (RCP8.5) due to fossil-fueled development.
To forecast violence for each of the scenarios, we use a simulation approach to generate 200 futures. For the fixed part coefficients, we use the 200 bootstrap coefficients used to generate the standard errors of the estimates. Our bootstrap resampling approach means that coefficients for some of the country-level random effects are missing, so we simulate 200 random effect coefficients and pair them with the bootstrap coefficients for the fixed part. Then, for each scenario, we use the specified population and political rights projections, and use climate outputs from two simulations (same RCP), applying 100 simulated coefficients to each.
Though we simulate the intercept values for the country-level random effects in the forecasts, the means for each country remain constant. While this assumption can be justified in terms of risk factors that are generally stable over time (e.g. terrain, soil quality, access to strategic points), it does not capture unobserved country changes such as infrastructure development and other policy initiatives.
Figure 4 shows the results for each of the five scenarios by plotting total annual forecasted violence in sub-Saharan Africa. Based on our assumptions, shared socioeconomic pathways 1–3 show the complete range for forecast violence, from decline in the optimistic scenario, to moderate increases for the middle-of-the-road scenario, to a tripling of violence in the pessimistic case. SSP1 and SSP5 forecast the least amount of violence and are characterized by improving political rights and relatively low population growth. This general downward pattern coincident with improved political rights is a similar result to Hegre et al. (2013), who find a decreasing trend for intrastate civil war in a similar scenario.
Our forecasts also identify conditions under which violence could rise with increasing temperatures and pessimistic sociopolitical futures. SSP3 and SSP4 forecast a dramatic rise (Figure 4) in conflict though 2065 under scenarios where political rights in sub-Saharan Africa remain poor. In our formulation, the only difference between SSP1 and SSP5, and SSP3 and SSP4 are the climate projections. In our model forecasts, future violence is sensitive to changes in political rights and governance, and relatively insensitive to temperature anomalies. This conclusion stands in dramatic contrast to some hyperbolic scenarios about violent social reactions to climate change (White House, 2015).
The advantage of our comparative modeling strategy across SSPs is that it considers the capacity of societies and institutions to manage the stress that can emerge with temperature increases, including droughts and increasing variability in water access. The degree to which people trust in social adaptation and anticipate progress in political rights through the mechanisms of representative governance affects their responses, including conflict options.
The fine spatial (1° grids) and temporal (monthly) detail of our data allow us to map our forecasts. The forecast maps use the estimated (not bootstrap or simulated) model coefficients and the mean temperature anomalies for two simulated future climates (same RCP) to forecast violence. Figure 5 maps total violence for the middle-of-the-road scenario in ten-year periods to minimize interannual variation. As expected, the future spatial distribution reflects recent levels of violence as predicted by population distributions, distance to borders, and locations of capital cities. Country-level influences are also visible (e.g. for Niger), with such responses driven by a country’s political rights.
To examine the numerical distribution of the decadal violence in Figure 5, we use a grouped histogram where each bar tone is associated with a given decade (Figure 6). Note that the event count bin sizes vary to accommodate the skewed distributions. The generally increasing violence forecast with SSP2 (Figure 4) is visible in the histogram, with counts declining for grid cells with fewer than one violent event, and other bar heights generally rising, especially for the most violent grid-months forecast to experience over 150 events. Indeed, much of the increase in total violence is being driven by grid cells that experience high levels of violence. From the 2040s to the 2055s periods, 809 grid cells were forecast to decline in violence (on average –0.7 events), while the remaining 1,253 locations were forecast to increase in violence (on average 9.6 events). This suggests that even under a scenario where overall violence increases, many places (though generally less populated) are expected to experience less violence.
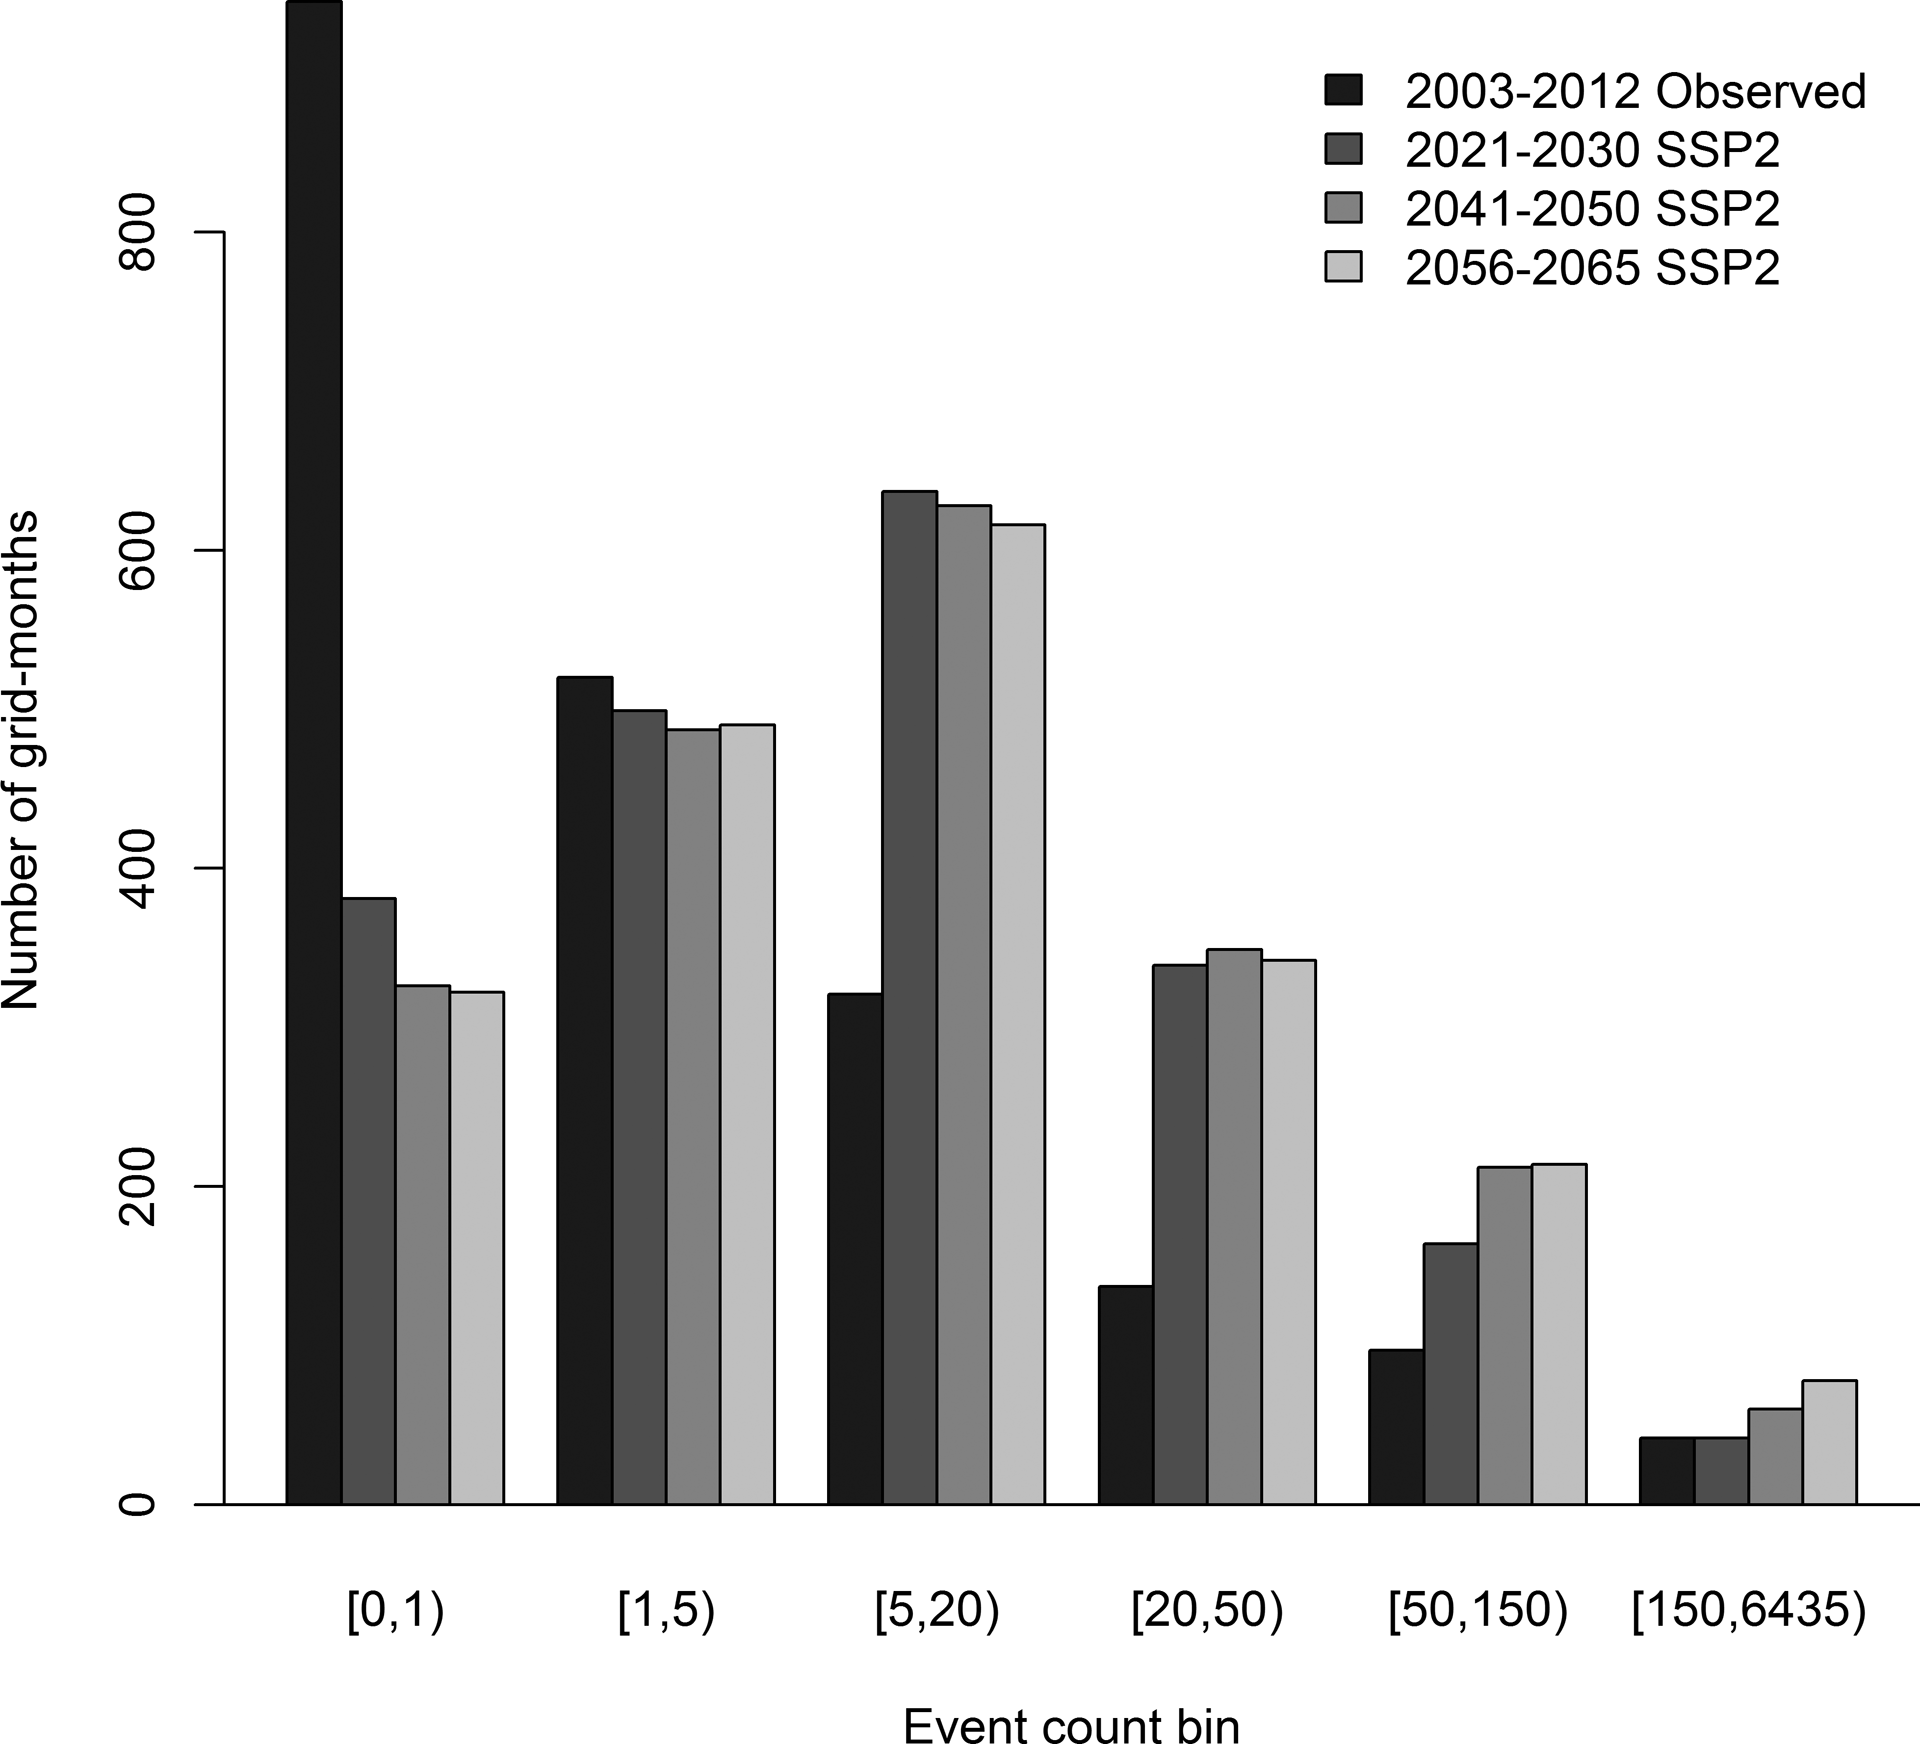
Histogram of violent event counts for the latest observed decade and three future decades as forecast by SSP2, the middle-of-the road scenario
To display more clearly the change from recent conflict levels to forecasted levels, we map the ratio of violence in the 2056–65 decade to the period 2003–12 (Figure 7). Blank grid cells indicate no violence was observed from 2003 to 2012. Increases in violence are forecast for all scenarios in countries such as Sudan, Ethiopia, and Angola, driven in part by continued low political rights and high population growth. For futures marked by improving political rights (SSP1 and SSP5), areas of decreasing violence are clearly visible in South Sudan, Nigeria, and the Ethiopia–Somalia border region. Even for SSP2, despite an overall increasing trend in violence (Figure 4), there are large areas where violence is expected to decrease (northern Mali, South Sudan, northern Kenya, and Namibia). In the most pessimistic scenario, SSP3, almost all areas will experience an increase in conflict, including relatively peaceful countries such as Tanzania. An exception for SSP3 is South Sudan, which is forecast to experience a reduction in violence. This is a result of the large negative coefficient on the South Sudan random effect (Table A5 and Figure A5 in the Online appendix), likely caused by the low number of observations in the dataset for this young country. Comparing SSP3 to SSP1 for West Africa reveals a dramatically more violent future when political rights deteriorate. Such dramatic spatial variation is all too often lost in country-scale analyses.
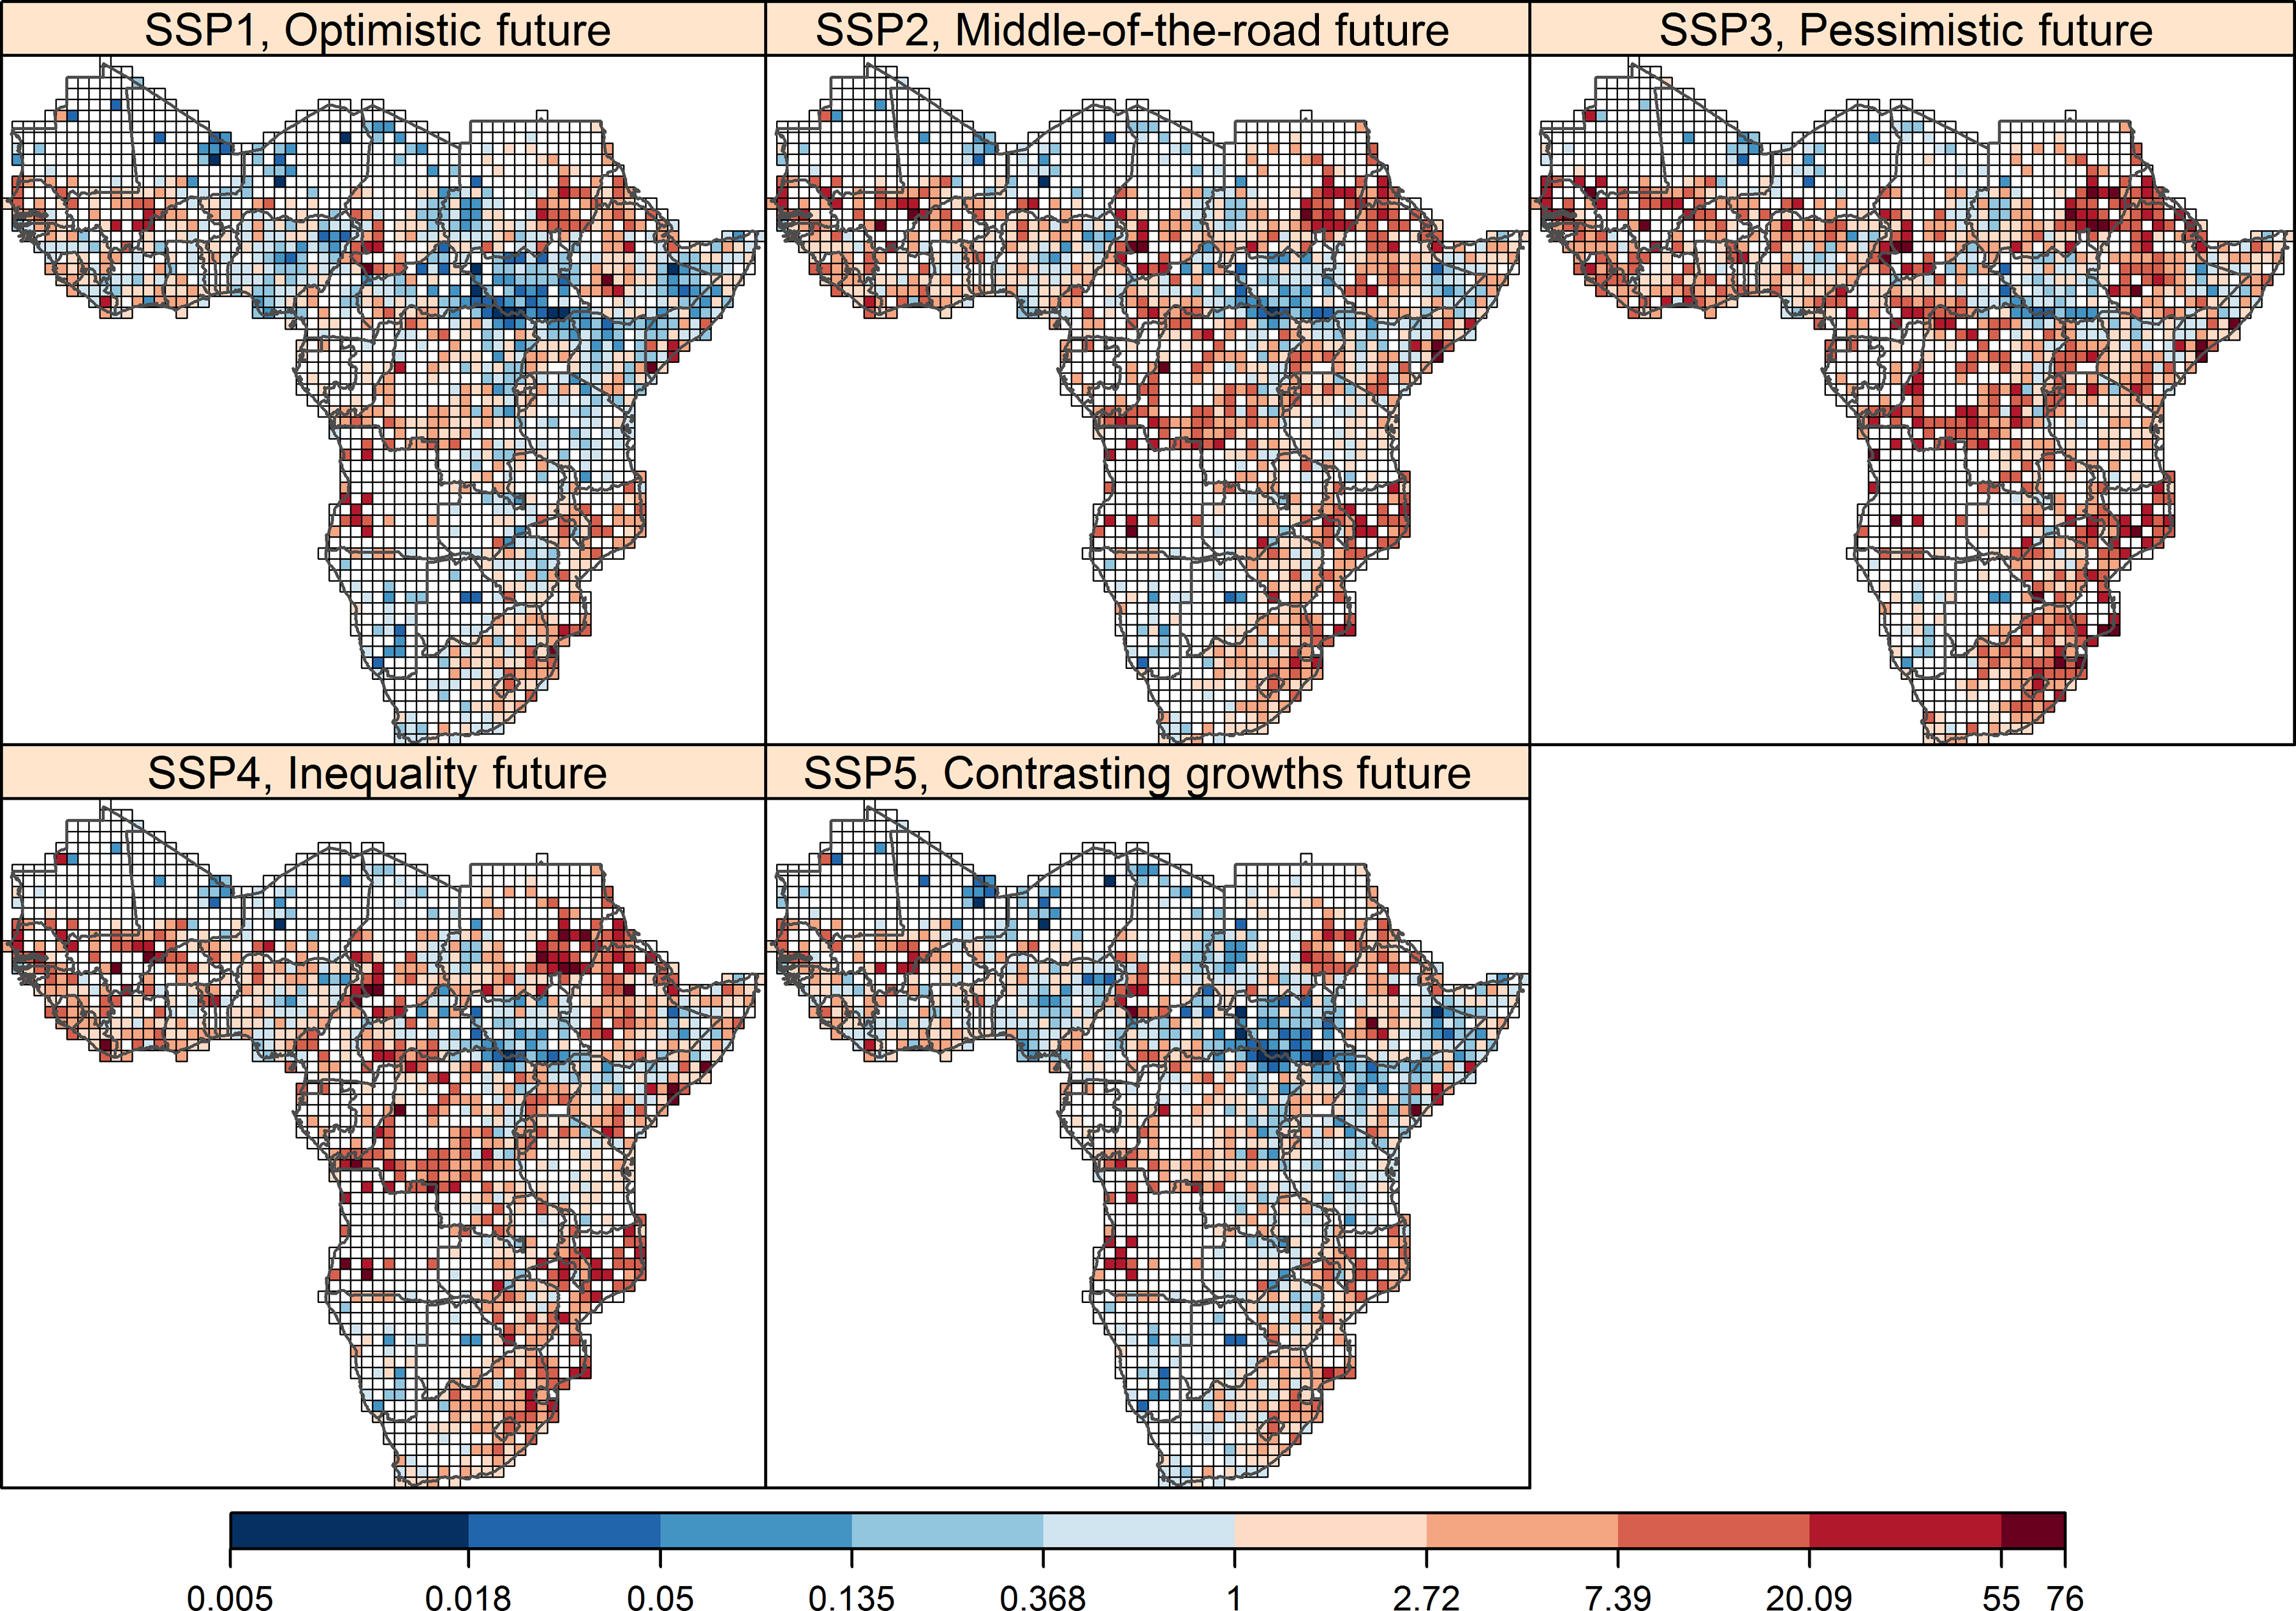
Ratio of 2056–65 forecast to 2003–12 observed violence for each scenario
These SSP-driven forecasts are instructive for comparing plausible alternative futures, but do not allow us to easily isolate the relative contributions from any one factor since most scenarios differ in two or more ways. To isolate the effects of political rights, population, and temperature anomalies, we use SSP1, the optimistic future, as a baseline future and modify it in turn for each of the factors. The three maps in Figure 8 show the differences when governance deteriorates towards autocracy compared to the improving trend of SSP1, when population growth is marked by high fertility compared to the low fertility of SSP1, and when temperatures increase from the RCP 2.6 of SSP1 to the expected higher temperatures of RCP 8.5. These maps show stark differences, with changes in the nature of governance clearly having the greatest impact on future violence levels. Isolating these governance factors also helps to explain the temporal trends (Figure 4) and spatial variation (Figure 7) in forecast violence between the SSPs, with changes in political rights driving much of the projection.
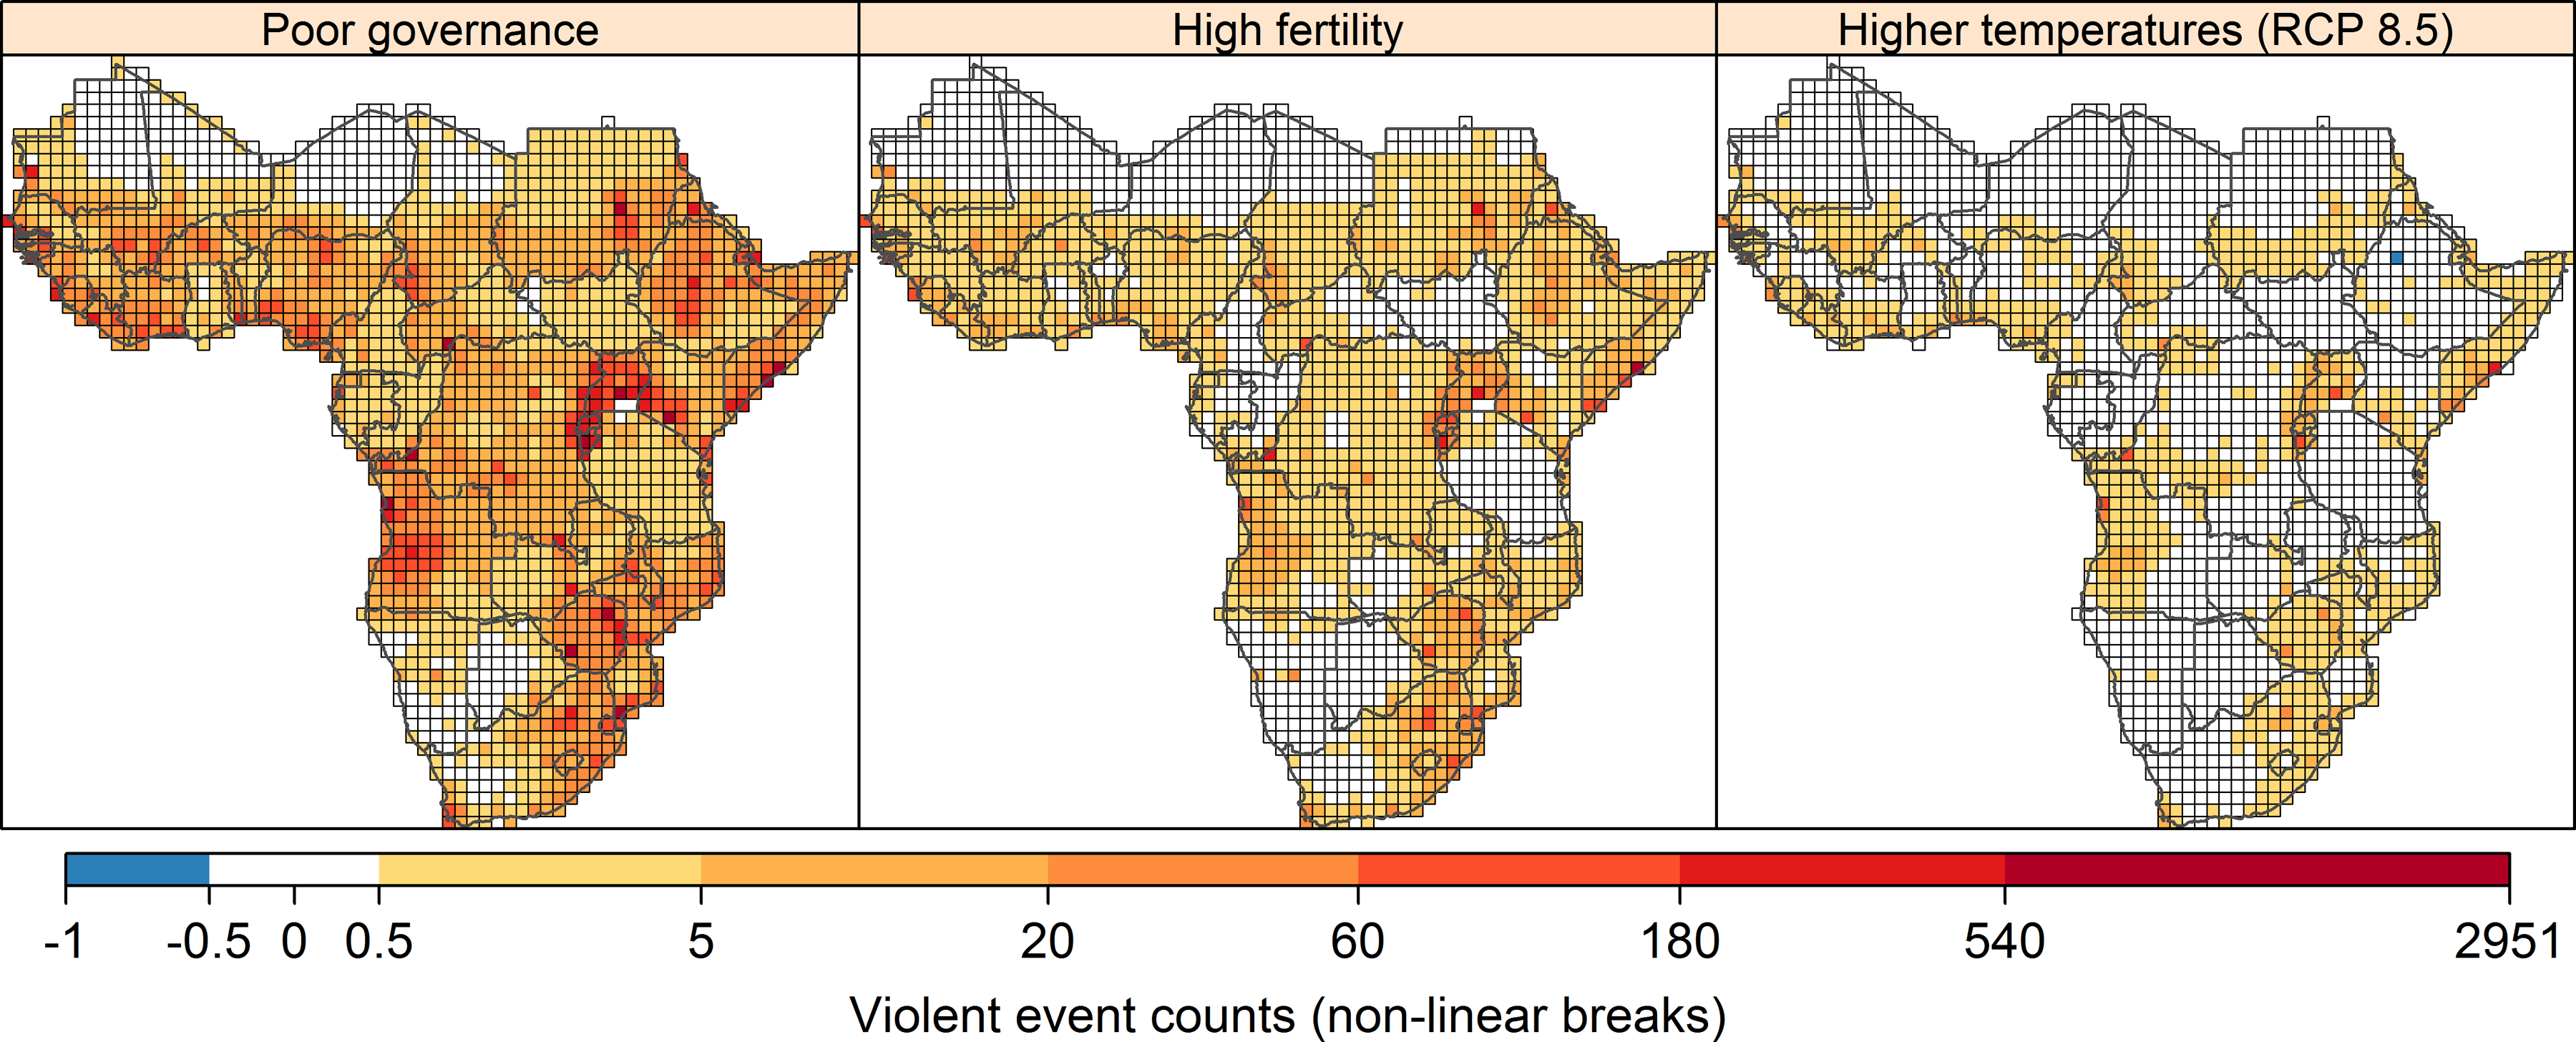
Change in forecast violence for the period 2056–65 using SSP1 as the baseline forecast and comparing against poor governance, high fertility, and higher temperatures
To evaluate the extent to which these differences in forecasts are meaningful, we use a Bayesian estimation method to compare the forecast levels of violence for the same three sets of scenarios shown in Figure 8. Given a set of two input datasets, their means and standard deviations are used to calculate 100,000 credible parameter-value combinations using Markov Chain Monte Carlo (MCMC) simulation (Kruschke, 2013). The resulting posterior distributions can then be used to evaluate if the difference in means of the two input datasets are credibly different, that is, do not overlap with zero. In our case, each input dataset consists of the 200 forecast violence simulations (grey lines in Figure 4). To reduce interannual variation, we calculate the 2056–65 mean for each forecast.
Figure 9 shows that, compared to the baseline optimistic SSP1 scenario, futures marked by poor governance or high fertility will have credibly higher levels of violence, whereas the future with higher temperatures (RCP 8.5) differs little from a future with less warming (RCP 2.6). If we wished to forecast violence to 2100, the temperature effect would likely be more pronounced, as RCP 8.5 projects the latter half of the century to warm significantly (Stocker et al., 2013). See the Online appendix Figure A6 for plots that show which years differ from the baseline SSP1 scenario using this Bayesian technique and an alternate t test.

Posterior distributions of the difference in mean forecast violence for the period 2056–65 using SSP1 as the baseline forecast and comparing against poor governance, high fertility, and higher temperatures. The black bar at the bottom represents the highest density interval (HDI) and shows where 95% of the credible values fall
Conclusions
In this article, we use spatially and temporally disaggregated local violent event data and simulated climatological data based on varying representative concentration pathways (RCPs, as used by Stocker et al., 2013) to forecast future levels of violence under plausible alternative social, demographic, and political scenarios. We find statistically significant relationships between the amount of violent conflict and political rights, population size, and rising temperatures. We find no relationship with precipitation anomalies, but our analysis differs in important ways, especially in the level of disaggregation, from earlier work reporting this association. Our model validation using simulated historical climate data revealed that the temperature relationship is specific to the actual observed data compared to the simulated data that, though they match the overall trend, allow for localized variation across time and space.
For the forecasts of violence, under pessimistic future scenarios of unchanging political rights from current levels (SSP3 and SSP4), rising temperatures and increasing population exacerbate levels of violence. If political rights and governance improve (SSP1 and SSP5), then future levels of conflict are likely to remain stable or even decline, despite increases in temperatures and population. This result should caution against exaggerated claims of a violent future that are based on inappropriate data, incorrect geographic specifications, and an underappreciation of the key role of good governance in the dampening of conflict through a fairer distribution of scarce resources (Homer-Dixon, 1999).
Some research studying the conflict effects of climate change alludes to rising risks of violence coincident with and connected to global warming. In fact, this is a key emphasis where authors assert the practical importance of their research for the general public and policy options. Our article has quantified and formalized the study of these associations with the best available predictions of temperature and precipitation into the future. As others have done for the study of democracy and conflict (Hegre et al., 2013), we extend the study of violent conflict to forecast violence using plausible future sociopolitical scenarios (SSPs). As a contribution to the conflict forecasting literature, to our knowledge, our spatially disaggregated approach is the first of its kind.
In terms of policy implications, the results of our study are sufficiently persuasive to maintain and strengthen efforts aimed at improving political rights, political freedom, and good governance. For decisionmakers, policies aimed at improving governance are likely to be effective in achieving the goal of reduction in violent conflict even if efforts to reduce greenhouse gas emissions are tardy or timid. Our results indicate that one major pathway for human intervention – institutional – can in fact have powerful effects on future levels of conflict given the expected changes in climatological and environmental conditions.
Footnotes
Replication data

Acknowledgements
We thank the students at the University of Colorado, Boulder who coded violent event data for sub-Saharan Africa from 1980 to 1997, prior to ACLED data coverage. The authors thank the editors of this special issue, the participants at the April 2015 ‘Conference on Forecasting and Early Warning of Conflict’ who gave helpful comments on an earlier version of this work, and the anonymous reviewers who provided additional focus to the manuscript.
Funding
This research was supported by grants 0964515, 0964687, and 1329125 from the US National Science Foundation. The National Center for Atmospheric Research is supported by the US National Science Foundation.
Notes
References
Supplementary Material
Please find the following supplemental material available below.
For Open Access articles published under a Creative Commons License, all supplemental material carries the same license as the article it is associated with.
For non-Open Access articles published, all supplemental material carries a non-exclusive license, and permission requests for re-use of supplemental material or any part of supplemental material shall be sent directly to the copyright owner as specified in the copyright notice associated with the article.
