
Abstract
Objectives:
To estimate the effects of three types of responses to intimate partner violence: (1) reporting of crime to the police, (2) arresting the suspect, and (3) receiving services from agencies other than the police that assist victims of crime.
Methods:
We obtained a nationally representative sample of 2,221 victims, using longitudinal records from the area-identified National Crime Victimization Survey from 1996 through 2012. To reduce the threat of nonrandom selection into treatment, we estimated effects using propensity score matched and weighted survival analysis.
Results:
Victims’ probability of repeat victimization is not related to arrest (hazard ratio, 0.87; 95 percent confidence interval [CI], 0.55 to 1.40; p = .57). In contrast, the reporting of crime to the police is associated with a 34 percent reduction in the risk of repeat victimization (hazard ratio, 0.66; 95 percent CI, 0.53 to 0.82; p < .001), and the use of victim services is associated with a 40 percent reduction in the risk of repeat victimization (hazard ratio, 0.60; 95 percent CI, 0.44 to 0.83; p < .01).
Conclusions:
The results support a model in which the deterrent effect of arrest is not substantively important, but police notification and victim-centered services produce important reductions in repeat victimization.
Intimate partner violence (IPV) is a serious problem in the United States. According to the National Crime Victimization Survey (NCVS) and the Supplementary Homicide Reports, IPV accounts for approximately 30 percent of annual violent victimizations against women and 5 percent of annual violent victimizations against men (Bureau of Justice Statistics [BJS] 2015; Lauritsen et al. 2012). Other national surveys, such as the National Violence Against Women Survey and the National Intimate Partner and Sexual Violence Survey, estimate that the lifetime prevalence of IPV is between 25 percent and 35 percent for women and between 8 percent and 28 percent for men (Black et al. 2011; Tjaden and Thoennes 2000).
After years of research and policy debate, there is little agreement about which interventions or combinations of interventions are effective in reducing IPV (e.g., see Dobash and Dobash 2000; Eckhardt et al. 2013; Wathen and MacMillan 2003). In the 1980s and 1990s, criminal justice interventions such as mandatory and proarrest policies were widely implemented and became the most hotly debated aspect of IPV intervention in the United States (Maxwell, Garner, and Fagan 2002). Proponents of arrest view the decision to arrest as necessary to make victims safe (e.g., Hoctor 1997), whereas critics are concerned about the overall effectiveness of arrest for reducing victimizations and the overreliance on this approach to the detriment of the individuals and families involved (e.g., Buzawa and Buzawa 1993; Felson, Ackerman, and Gallagher 2005; Iyengar 2009). In this literature, the most important contributions include the well-known Minneapolis Domestic Violence Experiment (Sherman and Berk 1984) and its replications known as the National Institute of Justice’s Spouse Assault Replication Program (SARP; Maxwell et al. 2002).
In contrast to the arrest studies, there is much less research on the effects of providing support services to victims of IPV. This is unfortunate because IPV was originally brought to public attention largely through the crime victims’ movement in the 1960s and 1970s which established grassroots organizations to provide assistance to victims (Davis, Lurigio, and Skogan 1999). Although much federal, state, and private funding has been devoted to victim services (e.g., see Newmark et al. 2003), a recent literature review commissioned by the National Institute of Justice (Lurigio 2014) found that the lack of data concerning the effectiveness of victim service programs is a serious obstacle to research and evidence-based policy. In addition, studies found that victims and criminal justice agency personnel frequently lack knowledge of available victim services and perceive victim services as a low priority in a system that is designed primarily to deal with offenders (e.g., see Englebrecht 2011; Sims, Yost, and Abbott 2005).
Instead of focusing only on arrest, this study examines whether IPV is less likely to be repeated when it is reported to the police, when the offender is arrested, and when the victim receives services from victim service agencies, for these are all important options that could reduce reoffending. We use a longitudinal file constructed from the NCVS (1996–2012) to identify IPV victims. Because many IPV incidents are not reported to the police, it is important to consider victim services that are not initiated by police contact. Indeed, scholars are increasingly interested in exploring whether victim service resources can be utilized to achieve a more comprehensive response to IPV (e.g., see Dugan, Nagin, and Rosenfeld 1999; Garner and Maxwell 2008; Hovell, Seid, and Liles 2006; Visher et al. 2008; Xie, Lauritsen, and Heimer 2012).
The plan of the article is as follows. The next section reviews the theoretical and empirical literature on the effects of arrest and victim services on IPV and discusses the importance of studying them jointly. The third section describes the data and methodology, and the fourth section presents the results. The fifth section concludes with a discussion of the main findings and contributions of our study. It also discusses limitations of the study and suggests avenues for future research.
Research Background
Police Response to IPV
The response to IPV most often investigated in the United States has been the response of the police (and most importantly arrest), since the police are the most common, most visible agents of the justice system. Sherman and Berk’s (1984) Minneapolis arrest experiment, for example, marked the important transition in police response to IPV from the traditional underenforcement policy (in which offenders of IPV were rarely arrested or prosecuted as vigorously as other violent offenders) to a criminalization policy (in which legal reforms were introduced to increase the certainty and severity of legal responses to IPV). The study required the police to respond to misdemeanor domestic violence calls according to randomly assigned intervention: arresting the offender, separating the couple, or advising the couple. 1 The study found that arrest was more likely than the other interventions to reduce repeat IPV in a six-month follow-up period.
Since the Minneapolis study, 30 years of research on arrest has produced mixed results or qualified conclusions. Some of the studies in the SARP experiments supported the effectiveness of arrest as a response to IPV (e.g., Berk et al. 1992; Pate and Hamilton 1992), but other studies found no effect (e.g., Dunford, Huizinga, and Elliott 1990; Hirschel, Hutchison, and Dean 1992) or an escalation effect where arrest increased the risk of IPV (e.g., Sherman, Schmidt, et al. 1992). There have been multiple efforts at synthesizing the findings of the SARP experiments (e.g., Garner, Fagan, and Maxwell 1995; Sugarman and Boney-McCoy 2000). The most recent one (Maxwell et al. 2002:68) found by pooling data from the SARP experiments that arrest produced a measurable reduction in reoffending, but that the effect size was “modest relative to the size of the relationships between suspect and victim characteristics and failure rates.” Given this effect size, they suggested that while the data showed the utility of arrest, there was a need to explore policy alternatives to arrest as a response to IPV.
Maxwell et al. (2002) are not alone in their call for policy reevaluation. Some scholars continue to support preferential arrest policies if not mandatory arrest policies, suggesting that arrest conveys a strong message that IPV is a serious crime and will not be tolerated (e.g., Benson 2009; Zelcer 2014). Others are more critical of arrest, suggesting that it has high costs and unintended consequences such as that (1) arrest may exacerbate racial bias in the justice system, for minority offenders are disproportionately arrested (e.g., Chesney-Lind 2002), and (2) a widening of the net of arrest may occur when police arrest both parties if it is not clear who was the primary aggressor (e.g., Hirschel et al. 2007). Moreover, some studies suggest that the continuously low rate of prosecution in IPV cases can be another reason why arrest lacks deterrent effect in many cases (e.g., Corsilles 1994). In addition, offender-based policies like mandatory arrest divert resources and attention from victim-based responses that may be effective in reducing risk of IPV (e.g., Erez 2002).
In the arrest literature, Felson et al.’s (2005) study is particularly worth noting because it has substantially expanded our knowledge of the efficacy of arrest as a response to IPV. Their work differed from the experimental literature in two important ways. First, they expanded the population studied from a few large cities like Minneapolis and those in the SARP experiments to a national sample of U.S. residents, which has stronger external validity. Second, they expanded the scope of the study to IPV incidents that were not reported to the police, whereas the arrest experiments examined only incidents reported to the police. This is important because Felson et al. (2005) suggested that the reporting of crime to the police might be a sufficient deterrent in itself without an actual arrest. They reasoned that the social disclosure alone or the mere presence of police officers might force the offender to redefine the violence as a criminal act, or it may cause enough embarrassment, shame, or fear of police arrest to deter violence (also see a similar discussion by Maxwell et al. 2002:71).
Thus, Felson et al. (2005) highlighted the need to examine a broader range of responses to IPV that goes beyond the police’s power to arrest. For instance, if it is true that arrest is only “a minor nuisance” to abusers who are usually out of jail in a short time (Erez 2002), then this small increase in the severity of punishment will not alter behavior. Their study supported this idea because they found a large effect of reporting crime to the police on reducing recidivism (odds ratio [OR] = .53), while the effect size of arrest is smaller (OR = .78) and only “approaches significance (p = .14 for a two-tailed test; .07 with a one-tailed test)” (Felson et al. 2005:580). They argued that these results challenge but “cannot rule out the possibility that arrest has a small deterrent effect” (p. 580).
Felson et al. (2005) were limited by the data available to them. They lacked information on where victims lived, for geographic codes were removed from the public-use NCVS to protect respondent confidentiality. Knowing where a victim lives is often a crucial factor because a person’s location of residence is correlated with a person’s socioeconomic background (measured and unmeasured), and the kind of law enforcement practices and community resources for violence prevention available at a given location. Prior research suggested, for example, that offenders encountered by police in lower status neighborhoods have higher risks of arrest than do offenders in higher status neighborhoods, even when holding constant the influence of crime characteristics and victim preferences for arrest (Smith 1986). Neighborhood racial composition is also related to arrest decisions in such a way that police are more likely to arrest minority suspects in neighborhoods with higher percentages of minorities (Holmes 2000; Smith 1986). These observations together with the findings that neighborhood socioeconomic and demographic characteristics are related to risk of IPV (e.g., Cunradi et al. 2000; Wright and Benson 2011) suggest that when using observational (nonexperimental) data, the omission of these variables would risk bias in estimation of treatment effects of police responses to IPV. The geographic data available in the area-identified NCVS can help overcome this limitation.
In addition, Felson et al. (2005) only considered police responses such as reporting the event and arrest. In practice, scholars frequently call for a greater attention to victim service programs in responding to IPV (e.g., Erez 2002; Newmark et al. 2003), but evidence supporting this practice is rather limited, as our review in the next section shows.
Victim Service Programs
Victim service programs grew significantly in the United States between the 1970s and the 1990s (Office for Victims of Crime [OVC] 1998). In the early 1970s, there were only a few voluntary organizations. By the 1990s, there were more than 10,000 victim service programs nationwide. These programs currently include about 1,900 primary-purpose domestic violence programs located in community-based organizations as well as other victim service programs and units in community organizations, law enforcement agencies, prosecutors’ offices, and correctional agencies (NNEDV 2015; OVC 1998). Surveys of victims show that victims often lack sufficient knowledge of services available (e.g., Brickman 2003; Sims et al. 2005). Among victims who know about services, police referrals are one of the most common sources through which victims learn about services (Skogan, Davis, and Lurigio 1990). Other sources of information include prosecutors’ offices, media, relative or friends, and other victims (Davis et al. 1999).
Theoretically, victim services are expected to increase victim safety because they provide social support and coping resources (Bennett et al. 2004; Eck and Maguire 2006). For example, an increasing body of research relates resources to IPV, showing that lack of personal, social, and community resources increases risk of IPV (e.g., see Bybee and Sullivan 2002; Goodman et al. 2005; Wright and Benson 2011). The research literature identified several major categories of services that are commonly requested by victims: (1) emotional and psychological support, including crisis hotlines, counseling, and support groups; (2) information and advocacy, including telephone referrals, legal assistance, and court advocacy; and (3) concrete or tangible assistance, including medical services, emergency shelter, transportation, childcare, and financial assistance (e.g., see Brickman 2003; Macy et al. 2010; Newmark et al. 2003; Simmons et al. 2011). These services, when they are delivered, should help victims to use community resources more effectively, increase opportunities for independence, and allow for a wider range of options for enhancing safety.
Empirically, however, the benefits of victim service programs in treating IPV are unclear, primarily because services are in many cases offered without funding for data collection and evaluation. Sullivan (2011), for example, summarized barriers faced by domestic violence victim service programs in evaluating service effectiveness, including (1) many victims use services anonymously, which may preclude the collection of evaluation data; (2) surveying victims over time to gather outcome data may endanger their safety; (3) requesting victims to participate in program evaluation may overburden victims who are still in crisis; (4) it might be difficult to determine the timing of outcome assessment, as some victims receive short-term services while others remain service users for longer periods of time; and (5) service agencies may lack resources and time to deal with literacy, language, and other issues to adequately locate a representative sample of service users for program evaluation. These barriers explain why, for many victim service agencies, direct service delivery takes priority over program evaluation.
In spite of apparent barriers, there is some evidence that victim services make a contribution to improving intermediate outcomes such as self-esteem (e.g., Sullivan, Bybee, and Allen 2002), social support (e.g., Tutty, Bidgood, and Rothery 1993), sense of control (e.g., Zweig and Burt 2003), and adoption of safety behaviors (e.g., McFarlane et al. 1998). Compared with these outcome measures, there is a smaller body of research examining the actual reduction or cessation of violence following the use of services. Some of the results are encouraging, such as the work by Sullivan and Bybee (1999) who found that women in the intensive community-based advocacy condition were more than 2 times more likely than women in the comparison group to experience no violence in a two-year follow-up period. Also encouraging are Berk, Newton, and Berk’s (1986) study of shelter stays and Bell and Goodman’s (2001) study of law school advocacy programs, all of which indicated that interventions aimed at victims themselves (not at offenders) may result in reduced violence. These results do not mean that victims are responsible for the continuation of violence, but it is useful to observe that victims can sometimes rely on service programs to increase their safety.
Generalizability (or external validity) has nevertheless been a limiting factor in the service literature because studies have typically obtained their samples through recruiting victims from health-care settings, domestic violence shelters, other service providers, local police, and/or prosecutors’ offices (e.g., see a review by Wathen and MacMillan 2003). These convenience, venue-based samples have their own advantages, but the question remains how well the samples represent the target population. For example, convenience samples provide easier access to the hard-to-reach IPV victims, and as an added advantage, the researchers have more detailed information on the terms of service delivery, especially when they use experimental designs. A disadvantage, however, is that the samples exclude victims who are not connected with these institutional venues. Moreover, in some cases, such as when evaluation of victim services is mandated by funding agencies, some scholars worry that convenience samples might be more vulnerable to sample selection bias for fear that some service programs may modify their user base to maximize their success rate (see discussion by Sullivan 2011). These observations suggest that empirical studies of the effectiveness of victim services in reducing IPV that could be conducted on a broad, nationally representative sample of IPV victims would make a substantial contribution to our understanding of this policy.
In short, our literature review identifies two main issues with existing research on reducing IPV: (1) the results concerning arrest are not as consistent as one would expect if there were a consistent and important effect and (2) there is less systematic research on the effect of victim services, and what research there is has problems with external validity. To address these issues, we used the area-identified NCVS data in our study because of its good external validity and supplementary information on residential locations that increases our ability to estimate treatment effects in observational data. We broadened the focus from one exclusively on police response to include victim services to determine whether they reduce IPV. Given the demonstration of victim needs for support and guidance (NNEDV 2015), we tested the hypothesis that the use of victim services is associated with a lower risk of repeat IPV independent of police interventions.
Data and Methods
Area-identified NCVS Longitudinal Data File (1996–2012)
Our primary data source was the area-identified NCVS from 1996 through 2012. The NCVS is the primary source of information on criminal victimization in the United States (Lynch and Addington 2006). It uses a stratified multistage cluster sample of U.S. residential addresses. The sample units remain in the survey for three years, during which household members aged 12 years and older are interviewed at six-month intervals for a maximum of seven interviews. 2 Violence measured by the NCVS includes rape or sexual assault, robbery, aggravated assault, and simple assault. The survey collects information about victim characteristics, incident details, suspect information, and information on responses to violence and other types of crimes.
The area-identified NCVS differs from the public use NCVS in that the data contain geographic identifiers for the residential locations of respondents down to the census tract level. Using 1996 to 2012 data, we constructed a longitudinal file matching records of the same persons across time using link variables provided by the Census Bureau. The matching was verified for accuracy using information on the respondents’ age, gender, race, and ethnicity. All victims of IPV (defined in our study as violence by current or former spouses, boyfriends, or girlfriends) were qualified for the study except for those whose victimization (i.e., the initial incident) took place in the month of the person’s last interview before rotating out of the survey. These persons were excluded because they contributed no person time for the analysis.
For qualified victims, we used two exclusion rules to select the analysis sample: (1) we excluded 11 percent of victims who had no census tract identifier because they lived in newly constructed houses or in areas where census tracts had not been established by the time of sample selection 3 and (2) we excluded 4 percent of victims with missing variables. 4 Our final sample included 2,221 victims, 449 of whom (20 percent) had a repeat IPV victimization after their first observed IPV incident, and 1,772 of whom (80 percent) experienced no repeat victimization for the time in sample.
Because the NCVS does not link offenders across incidents, we followed Felson et al. (2005), using the offenders’ demographic information and the victims’ report on whether the offender had attacked them before to identify repeat victimization by the same offenders. Any measurement error due to offender mismatch should be minor.
Dependent Variable
The dependent variable was time to repeat IPV victimization. The time origin of the analysis was defined for each victim as the month of their first observed IPV victimization because we were interested in how the responses to this incident affected the victim’s risk for a second victimization. The occurrence of a repeat victimization was a “failure” in survival-analysis terminology, and each victim’s survival time was measured in months from the first incident to a second incident or (when there was no repeat victimization) to the end of the study. 5
Although the coding of survival time was relatively straightforward for the majority of victims, the coding was more complex for victims of “series crimes,” which in the NCVS were crimes in which the victim experienced six or more similar incidents within a six-month period and could not recall details of each incident separately. For these crimes, we compared two coding strategies. First, each incident’s occurrence time was estimated using the month of the start of the reference period plus the average time for each incident to occur (which was calculated as the number of months from the start of the reference period to the last incident, divided by the number of incidents, up to a recommended maximum of 10 incidents per series; Lauritsen et al. 2012). Second, as it was also likely that a series of IPV incidents would happen in quick succession within the same month, we used the month of the last incident to estimate the timing of all of the incidents. Our findings were insensitive to these coding strategies. 6
In the NCVS data, as in all survival data, right censoring occurs when cases remain in the sample for the full study period without a repeat victimization, or when they drop out of the sample (attrition). We examined the patterns of censoring and concluded that the sample attrition of the IPV data was unrelated to the IPV treatments. 7
Treatment Variables
Three responses to the initial victimization (or treatments) were the focus of the study: (1) whether the incident was reported to the police, (2) of the incidents reported to the police, whether the police made an arrest, and (3) whether the victim received help or advice from any office or agency (other than the police) that assisted victims of crime. These variables were coded dichotomously (1 = yes, 0 = no). Our analysis did not distinguish between victim reporting and third-party reporting because the two types of reporting showed similar effects on repeat IPV in preliminary analysis.
For the measure of arrest, the NCVS does not specify who was arrested. The analysis assumes that the party arrested was the offender. We recognize that dual arrest (arresting both the offender and the victim) was also possible, even though the rate of dual arrest is relatively low and many jurisdictions have primary (or predominant) aggressor laws and policies to discourage the practice (Hirschel et al. 2007; Jones and Belknap 1999).
Pretreatment Variables
The study used variables that are related to treatment assignment and/or the outcome of repeat victimization to enhance the comparability of treated and untreated individuals. These are pretreatment variables that have not been affected by the treatment of interest (Imbens 2000). Specifically, for each victim’s first observed incident, we measured the type of crime (rape or sexual assault, robbery, or assault), 8 the seriousness of crime (whether a weapon was present, whether the offender was drinking or on drugs, whether the victim was injured, whether the victim received medical care, and whether the victim used physical force against the offender), and whether the incident occurred at or near home (for examples of other studies that used these variables, see Bachman 1998; Baumer and Lauritsen 2010; Felson et al. 2002).
The victim characteristics included the victim’ age, 9 employment status, years of education, race and ethnicity (White, Hispanic, Black, or other minority), the victim’s gender compared with the offender’s gender, and whether the victim and offender were married 10 (e.g., see Bachman 1998; Hart and Rennison 2003). We emphasized the victim’s own employment status and education because these measures capture the victim’s own ability to earn income and economic independence. Our results did not change in sensitivity analyses when household income and homeownership were included in the models. Using victims’ self-reports, we also included the offenders’ information, including age, race, and prior criminal history (whether the offender had committed a crime or made threats against the victim before).
At the geographic level, we included neighborhood (census tract) conditions, indicators of urbanicity, and mandatory arrest laws that prior research suggests influence police reporting, arrest, and the likelihood of IPV victimization (e.g., see Goudriaan, Lynch, and Nieuwbeerta 2004; Smith 1986; Wright and Benson 2011). Specifically, the index of tract-level socioeconomic disadvantage was the mean of standard scores on poverty rate, unemployment rate, percentage of female-headed households with children, median household income adjusted for inflation (sign reversed), percentage of households with public assistance income, and percentage of population 25 years and over without high school diplomas (the data fit a τ-equivalent model; therefore the Cronbach’s α of 0.91 measures reliability). Racial/ethnic heterogeneity was measured by percent Black, percent Hispanic, percent Asian or Pacific Islander, percent other non-Hispanic minority, and the tract-level racial/ethnic entropy score (Massey and Denton 1988), with a higher score representing higher racial/ethnic diversity. Residential instability was measured by two indicators: percentage of households who had lived in the units for less than 10 years and percentage of vacant units. Population density was the number of tract population per square mile. The urbanicity of residential location was measured by whether the victim lived in a central city, suburb, or rural area. Lastly, we measured whether the state of the victim’s residence had mandatory arrest laws for domestic violence (see Appendix Table A1).
Analytic Plan
To reduce the threat of nonrandom selection into treatment in the NCVS, we estimated the effects of different responses to IPV using propensity score methods in the context of survival analysis. As Rosenbaum and Rubin (1983) explained, propensity score methods have desirable properties compared with conventional regression analysis. In brief, a propensity score refers to a subject’s probability of receiving treatment given observed characteristics. To estimate a propensity score, one specifies a treatment assignment model (the initial design) without examining the outcome data (the outcome analysis). The separation of the initial design and outcome analysis replicates a crucial feature of randomized experiments: “one can design an observational study without access to the outcome data,” which increases the objectivity of the analysis (Rubin 2001:170). The treatment assignment model is modified until a good balance in observed covariates between the treatment and control groups is achieved. One then evaluates the overlap of the propensity score distribution between the treatment and control groups to identify the areas for which inferences about the treatment effects are justified (the region of common support). These analyses corroborate the “strongly ignorable treatment assignment” assumption of causal inferences (Rosenbaum and Rubin 1983:43), whereas in conventional regression analysis, researchers may not be aware of any lack of balance (or overlap) in study covariates between the treatment and control groups, making the comparison misleading. Rosenbaum and Rubin also recommended methods for conducting sensitivity analysis to assess the estimated treatment effect’s sensitivity to unobserved confounders (also see Rosenbaum 2002). These properties of propensity score methods make them an attractive tool for observational studies.
Although propensity score methods have been increasingly used in criminological research (Apel and Sweeten 2010), their use in survival analysis is still a new research area. Monte Carlo simulation studies showed that propensity score matching and weighting perform well for time-to-event analysis, whereas two other commonly used approaches (propensity score subclassification and regression analysis using the propensity score as a covariate) are more prone to estimation biases (Austin 2013; Gayat et al. 2012). Our study thus used propensity score matching and weighting, and the analyses were conducted in five major steps: (1) assessing the need for propensity score analysis by checking the imbalance of study covariates, (2) using the observed covariates and logistic regression to estimate the propensity score and check for common support, (3) choosing a matching or weighting strategy, (4) evaluating the quality of matching and weighting to ensure that the covariates were balanced across treated and control groups, and (5) estimating treatment effects using nonparametric Kaplan–Meier curves and semiparametric Cox proportional hazards models based on matched/weighted samples. 11
Because our data contained neighborhood-level variables beyond the characteristics of victims and offenders, we investigated the extent to which the data were clustered within census tracts to determine whether multilevel modeling was needed for the analyses. We found that in our data, the majority of census tracts (86 percent) had only one IPV victim per tract. Because tract-level clustering was only an issue for a small percentage of cases, we analyzed the data using cluster robust standard errors to account for error correlations. We also compared treatment effects estimated with and without survey weights, as suggested by DuGoff, Schuler, and Stuart (2014).
Results
Figure 1 shows responses to IPV for 2,221 victims in the sample. The three key responses (police notification, arrest, and use of victim services) are indicated by shaded boxes. Sixty-one percent of IPV incidents were reported to the police, of which 344 (26 percent) resulted in arrests. The reporting of incidents to the police was positively related to the receipt of help from victim agencies, with 388 victims (29 percent) in the reported group receiving help from victim agencies, and 112 victims (13 percent) in the unreported group doing so. Altogether, 23 percent of IPV victims received help from victim service agencies. The unshaded boxes provide a more complete view of police actions when called to the scene, showing their efforts for crime investigation.
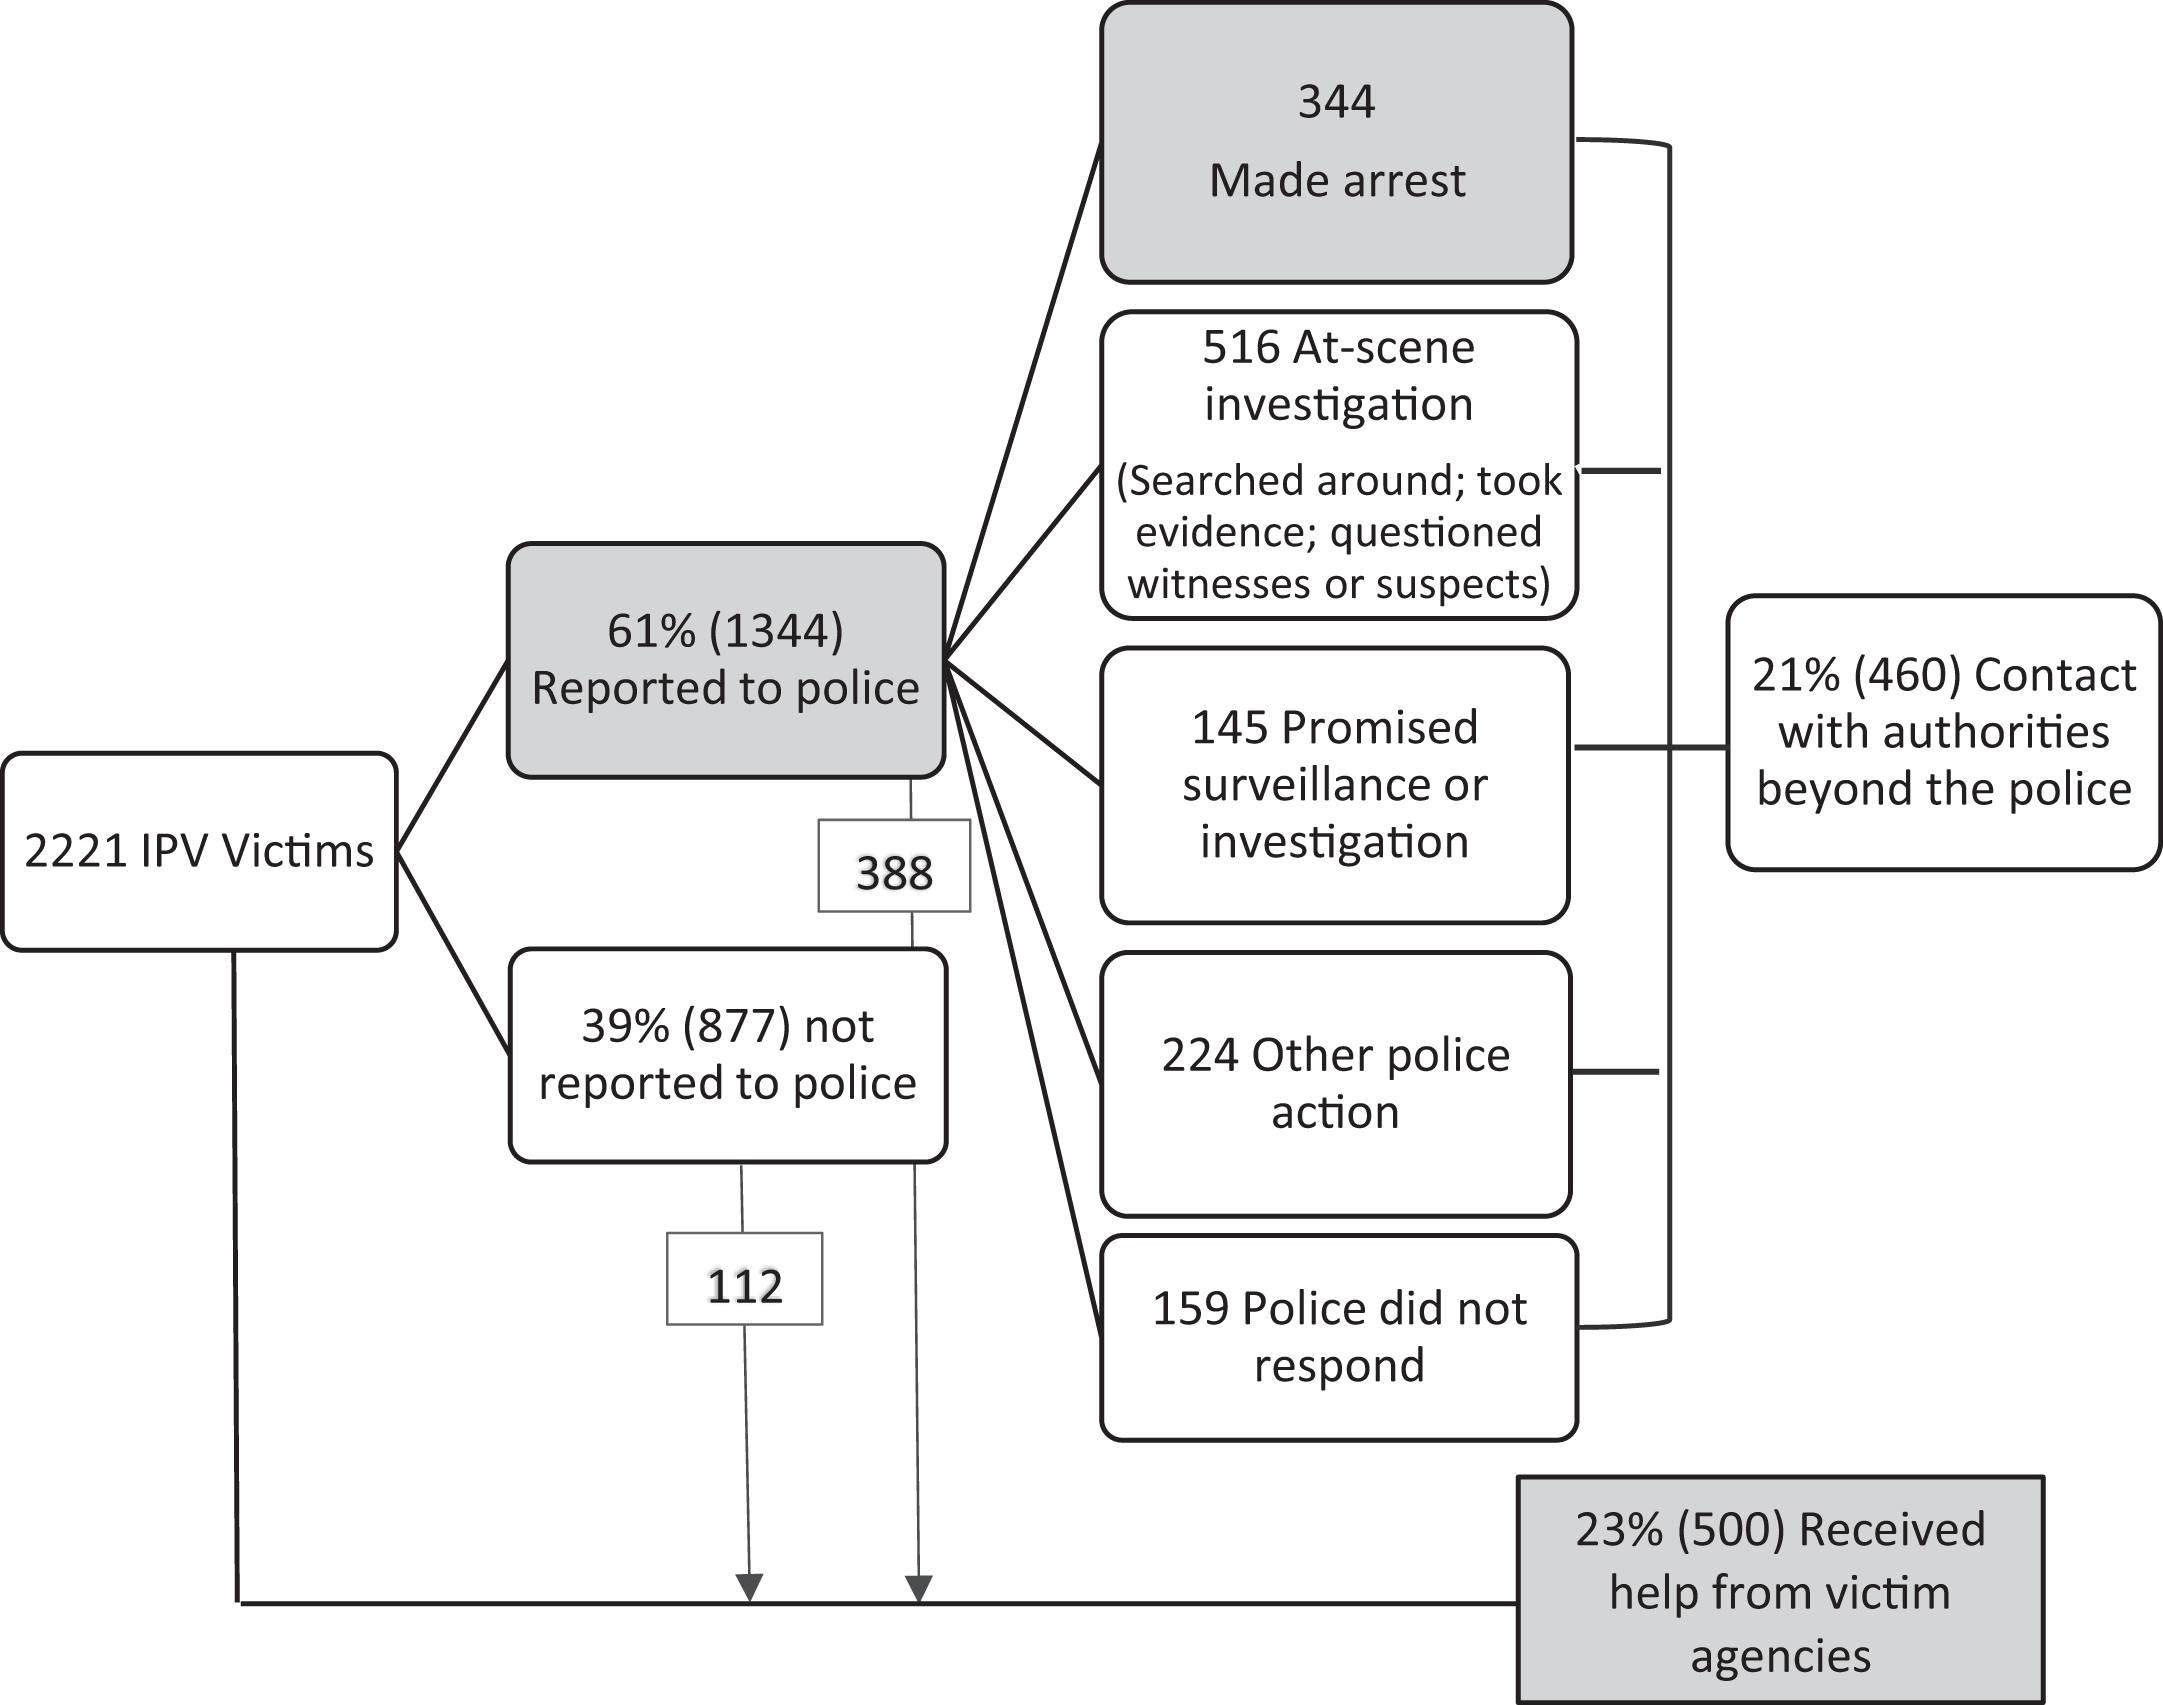
Responses to intimate partner violence by the police and victim service agencies (N = 2,221).
Figure 2 shows the pattern of repeat victimization for this sample of victims using Kaplan–Meier failure curves. It shows that the cumulative probability of repeat victimization within one month was 13 percent (95 percent CI 11–14 percent), two months 15 percent (95 percent CI 14–17 percent), six months 20 percent (95 percent CI 18–22 percent), one year 23 percent (95 percent CI 21–25 percent), and three years 29 percent (95 percent CI 25–33 percent).

Kaplan–Meier failure function for repeat victimization (N = 2,221).
Balance Diagnostics and Propensity Score Estimation
Before estimating treatment effects, we evaluated the balance of covariates before and after propensity score matching and weighting to ensure that the adjustment using propensity scores successfully resulted in group equivalence between treated and untreated individuals on the observed covariates. For brevity, the balance diagnostics are provided in Tables A2–A4 in the Appendix (i.e., one table for each treatment). These analyses support the use of propensity score methods for creating comparable samples of treated and untreated individuals, given that the groups showed varying degrees of imbalance in the original data set with respect to measured characteristics. 12 Moreover, these analyses support the importance of using area-identified data, for we found some large differences in neighborhood characteristics between treated and untreated individuals, such as their differences in neighborhood socioeconomic conditions (Table A2), racial compositions (Tables A2 and A4), and mandatory arrest laws (Table A4), for which the absolute value of the standardized bias statistic was greater than or close to 20.
To remove covariate imbalance, we used logistic regression to estimate the propensity scores. The results show that there is sufficient overlap (or common support) in the estimated propensity scores between treated and control observations for all three treatments, as shown by Figure A1 in the Appendix. The common support region is the region in which the propensity score has positive density for both treated and control groups. In Figure A1a, for example, although the two groups are visibly different (e.g., the treated group has a higher proportion of victims with higher propensity scores for police notification than the controls), the common support region is nearly the entire unit interval. Similarly, Figure A1b and A1c indicates a high degree of common support in the treated and control groups for both arrest and service use. These results suggest that members of treated and control groups are sufficiently similar to each other on the included covariates and that there are sufficient numbers of both treated and untreated victims to make inferences about the treatment effects.
Kaplan–Meier Failure Curves by Treatment
We then examined the differences in failure curves by treatment status, using samples matched (or weighted) by propensity scores as indicated by Figure 3. Although the sample size varied among matched and weighted samples, the conclusions were the same, and therefore we only report the results of matched samples (without replacement) to conserve space. Note that these results represent average treatment effects among those receiving treatment versus no treatment, the comparison group.

Kaplan–Meier failure functions for repeat victimization by treatment. (a) Police notification, (b) police arrest, (c) help from victim agencies.
Overall, Figure 3 illustrates that the treatments are differentially related to risks of repeat IPV. In Figure 3a, the Kaplan–Meier failure curves for reported and unreported cases in the original sample are shown in the top-left panel (the two failure curves are significantly different from one another; Wilcoxon test: p < .001). The difference continued to be significant in the propensity score matched sample, although the gap between the two groups was slightly smaller in the matched sample. The results indicate that victims whose crimes were reported to the police showed lower risks of repeat victimization compared with victims whose crimes were not reported to the police. For example, for victims in the “reported” group, the probability of repeat victimization within six month was 16 percent, compared to 27 percent among the “not reported” group.
Turning to arrest, however, Figure 3b shows that even though we initially observed a statistically significant difference in the failure curves from the original sample, the difference was hardly noticeable in the matched sample. This change was not caused by the reduction in sample size but was due to successful matching on propensity scores. That is, when treated and untreated victims have similar measured baseline characteristics, the data suggest that arrest was not related to risks of repeat victimization.
In contrast, Figure 3c shows that the cumulative probability of repeat victimization was significantly lower for victims who received help from victim agencies than for those who did not. After adjusting for differences in the baseline characteristics of service users and nonservice users, there is a discernable survival advantage associated with using services provided by victim service agencies. For example, for service users, their probability of repeat victimization within six month was 15 percent, compared to 21 percent among nonservice users. In the analysis, note that we used “reported to the police” as a pretreatment variable for receiving help from victim agencies because police notification is a decision typically made following the incidence of crime, predating victims’ interaction with victim agencies. As it is possible that some victims had called the police after interacting with victim agencies, we reanalyzed the data excluding reported to the police as a pretreatment variable for victim service use or even including “receiving help from victim agencies” as a pretreatment variable for police notification. These specifications did not change our conclusions.
Treatment Effects in Cox Proportional Hazards Models
Table 1 presents the results of Cox proportional hazards models for the three responses to IPV. We followed Gayat et al. (2012) and estimated two sets of models for each treatment: models in set 1 (no adjustment) included only the indicator of treatment and models in set 2 (adjusted) added observed covariates. The models were applied to the original samples and the matched and weighted samples, first without and then with survey weights, with all models adjusted for the clustering of the data, as noted in Methods section. This design means that for each treatment, 16 models were used to evaluate the sensitivity of the results to estimation methods. For brevity, Table 1 reports only the hazard ratios for the treatment indicators. A hazard ratio less than 1 indicates a lower risk of repeat IPV for the treated group compared with the controls.
Comparison of Treatment Effects on Repeat Victimization Across Different Propensity Score Methods.

Note. SE = standard error; ATT = average treatment effect for the treated; ATE = average treatment effect in the population.
† p < .10. *p < .05. **p < .01. ***p < .001.
The results in Table 1 support the findings from the Kaplan–Meier analysis. It shows that the results of the propensity score analyses depend little on whether the measured covariates are included in the outcome analyses or not, given that the samples are already well balanced through matching or weighting. Survey weights also have only a minor impact on point estimates of hazard ratios. For instance, according to the “adjusted” model with survey weights using the propensity score-matched samples (see the row of analytic method [6] in Table 1), police notification is associated with a 34 percent reduction in the hazard of repeat IPV (hazard ratio = .66; p < .001), whereas the association with arrest is weaker (hazard ratio = .87, meaning only a 13 percent reduction in the hazard) and not significant (p = .57); the receipt of help from victim agencies was associated with a 40 percent reduction in the hazard of repeat IPV (hazard ratio = .60; p < .01), and the differences in point estimates across propensity score models are small. Overall, the results are not sensitive to any particular estimation strategy in the propensity score analyses. 13 Because of the covariate imbalance in the original data, the regression estimates for arrest are slightly larger than those estimated from propensity score models, but the two methods essentially agree, as both would reject the effect of arrest at the .05 level.
Discussion
This study addresses the effects of responses to IPV on repeat victimization, with an emphasis on victim services in addition to police notification and arrest. It is the first study to include the three responses in a single research design. Using the area-identified NCVS data (1996–2012), we find that on average, after adjusting for observable differences in individual and environmental factors between the treatment and control groups, there is no substantial association between arrest and subsequent violence, but there are strong negative associations between the other two response choices (the reporting of crime to the police and the use of victim services) and subsequent violence.
By comparing arrest with other possible approaches for reducing IPV, this research places the role of arrest in perspective. Unlike some earlier National Institute of Justice-funded experiments conducted in large cities (Sherman and Berk 1984; also see Berk et al. 1992; Pate and Hamilton 1992), arrest does not produce the desired effect of keeping victims safe from further abuse in this more diverse, nationally representative sample. We find that in the NCVS, like in any other observational studies, the groups compared often show different baseline characteristics (like their incident, individual, and neighborhood characteristics) because of lack of randomization. Propensity score analyses are therefore used to reduce bias by making the groups more comparable in terms of observable characteristics. We find that after controlling for the initial baseline differences, the estimated effect of arrest is, on average, near zero.
The effect of arrest may be heterogeneous, and it may depend on factors such as the offenders’ stakes in conformity reflected in their marital and employment status (e.g., see Sherman, Smith, et al. 1992). To address this possibility, in unreported analyses, we repeated the analyses with different subsamples of victims (defined by observable baseline characteristics listed in our study). We found that as far as the observable covariates are concerned, our analyses of subsamples of victims yield no important differences in findings. For example, in the unreported analyses, the estimated effect of arrest did not increase when we restricted the analyses to married victims, victims of a specific race group, central city dwellers (which produced samples that looked more similar to those of the city-based SARP experiments), or to states with mandatory arrest laws. These analyses are tentative because of small sample sizes in some cases and because the NCVS does not measure the offenders’ employment status or other indicators of stakes in conformity (the results are omitted for brevity). Nevertheless, while we cannot draw definitive conclusions from these subsample analyses, the weight of the evidence is consistent with other studies, suggesting that the deterrent effect of arrest is not substantial, particularly with respect to the national average effect (e.g., see Davis and Smith 1995; Felson et al. 2005; Hoyle and Sanders 2000; Maxwell et al. 2002).
Other responses to IPV, in the forms of calling the police and receiving victim services, show stronger associations with a reduction in likelihood of future violence. It may be that, as proposed by Felson et al. (2005), the reporting of IPV to the police (by the victim or a third person) is a deterrent in itself, for it may cause enough shame, stigma, or other practical problems for the batterers to change attitudes or behaviors toward their partners. Alternatively (or concurrently), police intervention may help reshape attitudes and problem-solving ability among victims themselves. For example, the responding officers, even without arrest, may inform victims of their rights, make them more aware of their options, and encourage them to engage in IPV risk assessment and safety planning. These types of activities are often stipulated by police training and response protocols (e.g., see examples of police protocols at http://www.stopvaw.org/police_protocols). Although we cannot evaluate their role in the relationship between police notification and subsequent IPV because the NCVS does not measure such police activities, it is possible that both deterrence and assistance from police officers are components of the mechanism responsible for the reduction in violence.
For nonpolice victim service agencies, the results are most encouraging, indicating that victim services can be used as a risk-reduction strategy or as part of a coordinated community approach to reduce IPV. Victim services are important because the literature has increasingly identified the value of community resources and social support for intimate partner relationships (e.g., Cunradi et al. 2000; Sullivan 2011; Wright and Benson 2011). In line with these ideas, we find in this nationally representative sample that on average, victims who received services from victim service agencies have higher survival probabilities compared to victims who did not.
This study, in short, supports studies that propose that including victim services as a response tactic can help in addressing the problem of IPV (e.g., Bybee and Sullivan 2002; Goodman et al. 2005; Newmark et al. 2003). The result is significant for alerting the public to the importance of victim needs, given the ambivalent attitudes of criminal justice agencies toward victim services (e.g., see discussion by Englebrecht 2011). In the literature of second responder programs, for example, practitioners and prior studies disagree on whether the use of second responders (social workers or victim advocates) is effective for reducing revictimization after a police report of domestic violence (Davis, Weisburd, and Taylor 2008). A program in Richmond, VA, that put emphasis on using second responders to ensure the safety of victims and assess victim service needs reported a reduction in violence (Greenspan et al. 2005), but a program in Miami, FL, that was more passive (in which a second responder from a specialized unit would advise the victims about the appropriate sources of support but would be less active in helping the victims to take advantage of that advice) found no evidence of success (Pate, Hamilton, and Annan 1992). The different populations and delivery of interventions in these studies make it difficult to reconcile the discrepancy among them. Given the limitations of the evidence available, it is important that we develop a national estimate of the overall (or average) effect of victim services on IPV. This estimate is based on all victims, whether or not they reported the incidents to the police, and we used police reporting in matching the treatment groups, so the estimated effect of victim services is independent of calling the police. Because many of the evaluations of the effects of victim services on IPV are done with convenience samples, the national representativeness of the NCVS sample is a particular strength of our investigation, for it enhances the generalizability of the results.
The next step for research on designing victim services is to obtain more complete data on policing and victim service use. The NCVS was originally designed to measure police investigative actions like those listed in Figure 1. It gives less attention to victim assistance and service use, causing information such as victim needs and service delivery processes to be lost, even though such information would be a useful addition to our study of responses to IPV. Currently, the BJS is conducting the NCVS instrument redesign and testing project to modernize the content of the NCVS, including aiming to collect more detailed service use data which would allow greater specificity in future analysis of victim service use. The BJS also is working with the RAND Corporation, the National Opinion Research Center (NORC), and the National Center for Victims of Crime to conduct the National Survey of Victim Service Providers. The survey will produce information about the victims served and the victim-serving providers, and the data could guide future analyses of the associations between multiple types of victim services (e.g., emotional support, information and advocacy, and concrete assistance) and victim safety to allow deeper understanding of victim needs.
Our conclusion, based on the longitudinal analyses of the comparative strengths of the relationships between police notification, arrest, victim services, and repeat IPV, is that although arrest has historically shaped national policy debates and thinking on IPV, a system response that focuses only on arrest is unlikely to have substantial impact. To improve the quality of our responses to IPV, we recommend that more empirical studies be conducted to understand the role and effectiveness of both the police and victim service agencies in providing victim-centered responses, given that we observe that police notification and victim-centered services are associated with a larger reduction in repeat IPV than are arrest-based responses in the national sample.
Footnotes
Appendix
Help from Victim Agencies: Sample Description and Covariate Balance Check.

| Variables | Help: Yes (n = 500) | Help: No (n = 1,714)a | Standardized Difference (Bias) | p Value in Weighted Regression Test for Group Difference | ||||
|---|---|---|---|---|---|---|---|---|
| Mean | (SD) | Mean | (SD) | Original Sample | After PS Matching | ATT Weighting | ATE Weighting | |
| Incident characteristics | ||||||||
| Reported to the police | 0.78 | 0.55 | 48.2 | 1.0 | .90 | .87 | ||
| Rape/sexual assault | 0.09 | 0.07 | 6.9 | 0.7 | .93 | .90 | ||
| Robbery | 0.10 | 0.07 | 9.6 | −1.3 | .96 | .71 | ||
| Weapon present | 0.18 | 0.18 | −0.8 | 4.3 | .82 | .51 | ||
| Offender drinking | 0.39 | 0.34 | 11.4 | 9.2 | .83 | .62 | ||
| Offender on drugs | 0.18 | 0.13 | 14.2 | 1.6 | .99 | .73 | ||
| Victim injury | 0.58 | 0.44 | 28.4 | 2.0 | .80 | .59 | ||
| Victim medical care | 0.31 | 0.14 | 40.8 | 2.6 | .88 | .99 | ||
| Victim use of force | 0.09 | 0.09 | −2.3 | 5.2 | .98 | .88 | ||
| Home/near home | 0.90 | 0.86 | 9.8 | 3.2 | .99 | .99 | ||
| Victim and offender characteristics | ||||||||
| Victim age (in years) | 34.0 | (10.2) | 32.5 | (11.5) | 14.4 | 2.7 | .89 | .91 |
| Victim employed | 0.65 | 0.64 | 3.3 | −6.4 | .96 | .94 | ||
| Victim education (in years) | 12.7 | (2.14) | 12.4 | (2.09) | 15.5 | −4.4 | .84 | .73 |
| Victim Hispanic | 0.10 | 0.10 | −0.4 | −5.1 | .84 | .73 | ||
| Victim Black | 0.14 | 0.16 | −5.5 | −0.6 | .78 | .70 | ||
| Victim other minority | 0.03 | 0.04 | −7.6 | −6.6 | .59 | .19 | ||
| Victim male–offender female | 0.01 | 0.03 | −16.6 | 4.1 | .92 | .89 | ||
| Victim female–offender female | 0.33 | 0.40 | −14.9 | 4.7 | .94 | .45 | ||
| Victim male–offender male | 0.07 | 0.16 | −27.8 | −4.5 | .93 | .65 | ||
| Victim–offender married | 0.02 | 0.04 | −9.8 | 4.5 | .65 | .82 | ||
| Offender age <18 | 0.01 | 0.02 | −11.1 | 2.1 | .93 | .81 | ||
| Offender age 18–29 | 0.18 | 0.21 | −8.1 | 0.0 | .74 | .89 | ||
| Offender Black | 0.09 | 0.07 | 6.7 | 1.6 | .90 | .87 | ||
| Offender other minority | 0.43 | 0.30 | 28.2 | −4.2 | .73 | .97 | ||
| Offender prior crime against victim | 0.70 | 0.61 | 19.2 | −0.4 | .86 | .62 | ||
| Geographic characteristics | ||||||||
| Tract SES disadvantage | −0.03 | (0.80) | 0.01 | (.85) | −5.0 | 6.5 | .87 | .70 |
| Percentage of tenure <10 years | 63.3 | (12.5) | 63.6 | (12.7) | −2.6 | −1.6 | .66 | .73 |
| Percentage of vacant housing units | 9.28 | (7.24) | 9.42 | (7.76) | −1.9 | 4.6 | .82 | .34 |
| Percentage of Black | 12.4 | (21.2) | 15.1 | (23.8) | −12.0 | −0.9 | .90 | .91 |
| Percentage of Hispanic | 11.1 | (16.3) | 11.9 | (17.6) | −4.7 | −1.5 | .95 | .75 |
| Percentage of Asian/Pacific Islander | 3.23 | (5.34) | 3.50 | (6.57) | −4.6 | −1.8 | .52 | .56 |
| Percentage of other minority | 1.62 | (2.70) | 1.46 | (3.06) | 5.6 | 2.4 | .84 | .43 |
| Racial/ethnic entropy score | 0.61 | (0.35) | 0.63 | (0.34) | −6.2 | 1.1 | .84 | .71 |
| Population density | 4,495 | (10,489) | 4,559 | (10,530) | −0.6 | −0.7 | .90 | .45 |
| Central city | 0.32 | 0.37 | −11.0 | −0.4 | .87 | .37 | ||
| Suburb | 0.48 | 0.46 | 4.9 | −4.4 | .90 | .77 | ||
| Mandatory arrest laws | 0.46 | 0.39 | 15.6 | 2.0 | .68 | .71 | ||
Note. N = 2,214. SD = standard deviation; PS = propensity score; ATT = average treatment effect for the treated; ATE = average treatment effect in the population; SES = socioeconomic status.
aSeven victims had missing data on whether receiving help from victim agencies.
Declaration of Conflicting Interests
The author(s) declared no potential conflicts of interest with respect to the research, authorship, and/or publication of this article.
Funding
The author(s) received no financial support for the research, authorship, and/or publication of this article.