
Abstract
Objectives:
Focused deterrence seeks to change the violent behavior of gangs not directly targeted by the intervention by leveraging network ties between groups. This study appraises group-based and place-based methodologies in detecting direct and spillover crime reduction impacts of a focused deterrence strategy implemented in Oakland, California.
Method:
Quasi-experimental designs and panel regression models were used to compare shooting trends for directly treated gangs and census block groups to shooting trends for comparison gangs and block groups that did not directly receive the treatment. The design further analyzed whether vicariously treated gangs and untreated block groups immediately surrounding treated block groups experienced spillover shooting reductions.
Results:
The focused deterrence program generated statistically significant direct reductions in shootings in treated block group areas and by treated gangs relative to shootings in untreated block group areas and by untreated gangs, respectively. Spillover deterrent effects of varying magnitudes were found when shooting trends by vicariously treated gangs and in surrounding block groups were compared to shootings trends in comparison units.
Conclusions:
Group-based evaluation methodologies were better positioned to detect changes in violent gang behaviors after treatment and to shed light on deterrence mechanisms supporting program efficacy. Future focused deterrence studies should be theory driven rather than black box evaluations.
Focused deterrence strategies seek to change offender behavior by understanding underlying crime-producing dynamics and conditions that sustain recurring crime problems and by implementing a blended strategy of law enforcement, community mobilization, and social service actions (Kennedy 1997, 2008). Direct communications of increased enforcement risks and the availability of social service assistance to target groups and individuals are defining characteristics of focused deterrence. The available scientific evidence suggests that focused deterrence programs are effective at controlling gang violence. A recently updated Campbell Collaboration systematic review found that focused deterrence programs were associated with significant crime reduction impacts, with gang and criminally active group violence reduction strategies (GVRS) generating the largest crime reduction effects (Braga, Weisburd, and Turchan 2018). Further, the National Academies’ Committee on Proactive Policing concluded that “evaluations of focused deterrence programs show consistent crime-control impacts in reducing gang violence” (Weisburd and Majmundar 2018:175).
While the available evaluation evidence is generally supportive of deterrence principles, it is difficult to know whether observed gang violence reductions represent a true deterrent impact, a selective incapacitation effect generated by the apprehension and prosecution of targeted chronic offenders, or the influence of some other crime prevention mechanism at work in focused deterrence programs (Braga 2012; Brunson 2015; Corsaro and Engel 2015). In essence, many GVRS program evaluations suffer from construct validity concerns (Meehl and Cronbach 1955) in associating gang violence reductions with the focused deterrence regime established by implemented strategies. There seem to be two methodological shortcomings in most GVRS evaluations seeking to establish deterrent impacts (Braga and Weisburd 2014). First, changes in the violent behavior of treated gangs are often inferred from violence reductions observed at larger areal units such as cities and neighborhoods rather than directly observed at the group unit of analysis, an ecological inference fallacy (Robinson 1950). As such, it is difficult to know whether treated gangs actually modified their violent behaviors as a result of the focused deterrence strategy. Second, the violent behavior of untreated gangs who are socially connected to treated gangs is scarcely examined for evidence of “spillover” deterrent impacts. Establishing the existence of indirect or spillover effects of the GVRS intervention on gun violence represents a more complete test of deterrence theory than finding direct impacts, which include selective incapacitation effects.
The updated Campbell review found that only 2 of the 12 identified GVRS program evaluations conducted supplemental analyses to determine whether the intervention generated spillover violence reductions for untreated gangs that were connected to treated gangs through ongoing rivalries and alliances (Braga et al. 2018). These two program evaluations used different place-based and group-based approaches when measuring spillover deterrent impacts. The Los Angeles Ceasefire GVRS analyzed serious violent crime trends in proximate census block groups with untreated gangs socially tied to treated gangs in targeted block groups, relative to serious violent crime trends in matched untreated block groups (Tita et al. 2004). In contrast, an evaluation of a revitalized Boston Ceasefire GVRS analyzed shootings by and against matched untreated gangs that were socially connected to treated gangs, relative to matched untreated gangs not socially connected to treated gangs (Braga, Apel, and Welsh 2013). Both evaluations reported significant spillover violence reductions generated by the respective GVRS programs.
This study seeks to advance the methodological approaches used to evaluate GVRS programs and to improve our understanding of the deterrence mechanisms supporting the adoption of these violence reduction strategies. Drawing on place- and group-based quasi-experimental evaluation methods pioneered in Los Angeles and Boston, we test the direct and spillover deterrent effects of a GVRS program implemented to control gang–involved gun violence in Oakland, California. In doing so, we consider the degree to which these divergent approaches produce similar findings, and how differing units of analysis (gangs relative to places) may influence existing knowledge on the application of deterrence to control gang violence. This study also contributes to our developing knowledge on the contexts in which focused deterrence can be effective by testing the approach in a very challenging urban environment. Oakland’s murder rate is typically about four to six times the national average, and it has long held the reputation as one of the most dangerous cities in the United States 1 Moreover, police–minority community relations in Oakland have been seriously strained in recent years, 2 making the implementation of an intervention that engages minority community members as key violence prevention partners much more difficult.
Focused Deterrence and “Spillover” Deterrent Effects
The key crime prevention mechanism suggested by deterrence theory is that offenders are discouraged from committing crimes when the perceived costs of criminal acts exceed the perceived benefits (Zimring and Hawkins 1973). There are two distinct types of deterrence considered in crime control policy discussions (Cook 1980). Special deterrence occurs when sanctions are applied to individual offenders to dissuade them from committing subsequent criminal acts. General deterrence focuses on preventing crimes by the general public through the threat that punishment inevitably follows the commission of crimes. The communication of the risks of sanctions to the larger population is essential to achieving crime prevention through general deterrence (Zimring and Hawkins 1973). The larger body of scientific evidence on deterrence considers the crime control gains achieved by modifying the severity, certainty, and celerity of sanctions (Apel and Nagin 2011; Paternoster 1987).
Research suggests that offenders’ perceptions of punishment certainty are critical in generating deterrent effects (Nagin 1998). When crime control strategies achieve large and visible increases in offender perceptions of apprehension risks, the available evaluation evidence demonstrates that reductions in crime and arrests of offenders soon follow (Apel and Nagin 2011). Focused deterrence has been characterized as having this important crime control characteristic through its targeting of very particular criminal offenses perpetrated by a small number of highly active offenders who are exceedingly susceptible to criminal justice sanctions (Durlauf and Nagin 2011). Importantly, focused deterrence programs communicate directly to targeted offenders that their continued criminal behavior will no longer be tolerated and that the criminal justice system will apply a variety of punishments when these behavioral standards are violated. Targeted offenders are educated on new changes in sanction risks through group “call-ins” and individual conversations. New information provided by direct communications, especially through face-to-face meetings with offenders and backed up by swift law enforcement responses when rules have been violated, is important to changing offenders’ perceptions of the risks of committing crimes (Horney and Marshall 1992 ; McGarrell et al. 2006 ; Nagin 1998).
GVRS focused deterrence programs are intended to generate citywide reductions in gang violence by deterring gangs not directly treated by the intervention from continuing their violent behavior. The communication strategy is explicitly designed to create “spillover effects” onto other gangs through their social connections to targeted gangs within the larger city network of conflicts and alliances (Kennedy, Piehl, and Braga 1996). For instance, the seminal Operation Ceasefire working group in Boston marketed enforcement actions, such as the apprehension and prosecution of 23 well-known Intervale gang members, to other Boston gangs as credible examples of the increased apprehension risks generated by the new deterrence regime that was being imposed on violent gangs in the city (Kennedy, Braga, and Piehl 2001). The Indianapolis Violence Reduction Partnership working group included the arrest and prosecution of 15 highly violent Brightwood gang members in their “zero tolerance for violence” message as a tangible warning of the enhanced sanction risks associated with continued violent gun behaviors (McGarrell et al. 2006).
Professor Ronald V. Clarke (1989) first noted the existence of spillover crime prevention benefits in his review of crime opportunity reduction program evaluations, reporting large crime reductions in areas that were not directly targeted by crime prevention measures. In essence, some crime prevention programs generated the reverse of crime displacement (Reppetto 1976)—unintended crime reduction gains. A more recent systematic review of 120 situational crime prevention program evaluations found that crime displacement effects were often not observed and that diffusion effects were more likely to be generated by the evaluated intervention than displacement effects (Guerette and Bowers 2009). Clarke and Weisburd (1994:165) further developed the theoretical and descriptive basis for this phenomenon and coined the term “diffusion of benefits.” They also identified deterrence and discouragement as two key crime prevention mechanisms that support diffusion effects.
When diffusion by deterrence occurs, the potential offender is dissuaded by exaggerated perceptions of apprehension risks. Clarke and Weisburd (1994) suggest that potential offenders overestimate the reach of crime prevention measures and believe that apprehension risks are much greater than the actual risk of detection and arrest. Thus, advertising enhanced apprehension risks to prospective offenders can promote diffusion effects beyond those targeted directly by implemented prevention programs (see, e.g., Poyner 1988). When diffusion by discouragement occurs, potential offenders perceive the amount of effort required to commit the crime as too high, the anticipated reward of successfully completing the crime as too low, or both (Clarke and Weisburd 1994).
GVRS focused deterrence strategies intentionally exploit social ties among gangs and criminally active groups to produce spillover violence reduction impacts. Indeed, this idea is consistent with general deterrence which suggests individuals are dissuaded from committing crimes through their knowledge of punishments experienced by other law violators (Stafford and Warr 1993). General deterrence, however, is imprecisely focused on the communication of punishment threats to the broader population. GVRS programs use call-ins and street conversations to communicate credible punishment threats to vulnerable offenders in targeted gangs as well as their allies and rivals. This approach has been previously described as a form of “meso-deterrence” that operates by making explicit cause-and-effect connections between the behavior of the target population and the behavior of the authorities (Braga et al. 2001:201-2). Knowledge of what happened to targeted gangs is intended to prevent further acts of violence by other gangs in the co-offending network.
Measuring Deterrent Impacts in GVRS Program Evaluations
Existing evaluations of GVRS programs have not been well positioned to establish deterrence as the key prevention mechanism at work in observed gang violence reductions. In most GVRS evaluations, changes in violent gang behavior are inferred from reductions in outcomes reported in treated areas relative to comparison areas in larger geographic units of analysis. In their appraisal of the 1990s Boston Operation Ceasefire program evaluation (Braga et al. 2001), the National Academies’ Panel on Improving Information and Data on Firearms lamented that the analyses of aggregated citywide data did not provide firm evidence that treated Boston gangs modified their violent behaviors after being exposed to the GVRS intervention (Wellford, Pepper, and Petrie 2005). The most recent Campbell review reported that 9 of the 12 GVRS quasi-experiments used cities as the units of analysis; only Chicago, Los Angeles, and Boston (during the 2000s) evaluations used alternative units of analysis (Braga et al. 2018). As such, the bulk of GVRS evaluations are limited in affirming deterrence as the key crime control mechanism without first showing evidence that treated gangs modified their violent behavior after the intervention was applied.
GVRS program evaluations that use gangs as the units of analysis seem better suited to establish changes in violent behavior after exposure to the focused deterrence treatment. The Chicago GVRS evaluation used propensity score matching techniques to analyze shooting outcomes for treated gangs relative to shooting outcomes for comparison gangs; this rigorous quasi-experimental analysis found that treated gangs experienced a 23 percent reduction in overall shooting behavior and a 32 percent reduction in gunshot victimization in the year after treatment relative to matched comparison gangs (Papachristos and Kirk 2015). In their review of the Chicago GVRS evaluation, Gravel and Tita (2015) suggested that the analysis was convincing in establishing changes in violent behavior by directly treated gangs but did little to establish that these behavioral changes were due to deterrence rather than incapacitation. The direct treatment of gangs involves the removal of persistently violent gang members during the application of the intervention, and these actions necessarily confound deterrence with incapacitation effects. They recommended that future GVRS evaluations should explicitly analyze spillover deterrent impacts on shooting behaviors for untreated gangs that are socially connected to treated gangs. Two GVRS evaluations have attempted to do so using varying methodologies.
An evaluation of a reconstituted Boston Ceasefire GVRS program implemented during the mid-2000s was explicitly designed to estimate direct and spillover impacts on gang-involved gun violence. A quasi-experimental evaluation used propensity scores to match treated Boston gangs with untreated Boston gangs who were not connected to the treated gangs through rivalries or alliances (Braga, Hureau, and Papachristos 2014). The results of differences-in-differences (DID) estimators in growth curve regression models indicated that total shootings involving matched treated gangs were reduced by 31 percent, relative to total shootings involving matched comparison gangs, during the 2006 through 2010 study period. In a companion paper that used similar methods, Braga et al. (2013) found that the Boston Ceasefire strategy also created spillover deterrent effects onto other gangs that were socially connected to targeted gangs through rivalries and alliances. Total shootings involving these “vicariously treated” gangs decreased by 24 percent relative to total shootings involving matched comparison gangs.
The Los Angeles Ceasefire GVRS intervention targeted two rival gangs operating out of the same area (Hollenbeck; see Tita et al. 2004). Violent crimes, gang crimes, and gun crimes were substantially reduced among the two gangs over a six-month pre–post period in treated census block groups relative to comparison census block groups matched through propensity score models, demonstrating direct deterrent effects. The evaluation also noted slightly larger reductions in these crimes evident among four nontargeted, rival gangs in surrounding census block groups during the same time period, providing evidence of spillover effects. Tita and his colleagues (2004) suggested that these diffusion effects may have been generated by diminished conflicts between the targeted gangs and their social-connected rivals.
Despite the differing group-based and place-based methodologies, the Boston and Los Angeles GVRS evaluations produced complementary findings: significant direct effects on serious violence by treated gangs and spillover deterrence impacts on violence by untreated gangs connected to treated gangs through rivalries and alliances. While census block groups represent more precise geographies when compared to cities, violent crime outcomes are still aggregated to larger areal units and most likely count violent incidents that do not involve treated and untreated gangs. As a result, these small spatial units may not adequately detect direct and spillover changes in violent gang behaviors associated with the GVRS treatment. As such, the place-based approach should be paired with a group-based approach to provide a sufficiently powerful test of deterrence theory in the application of focused deterrence programs. We use both group-based and place-based methodologies to evaluate direct and spillover effects of a GVRS strategy implemented to control gang violence in Oakland. The application of these complementary methodologies in the same city allows us to triangulate possible deterrence impacts through differing lenses and to gain further insights on the robustness of place-based evaluations of GVRS interventions that target group behaviors.
Oakland Ceasefire
The City of Oakland, California, has long suffered from high levels of serious violence. In 2012, Oakland engaged the California Partnership for Safe Communities (CPSC) to help design and implement a focused deterrence program to reduce serious gun violence. The CPSC collaborated with the Oakland Police Department (OPD) on ongoing problem analysis research to understand the underlying nature of gun violence in Oakland. The Oakland Ceasefire program closely followed the key elements of a focused deterrence GVRS (see Kennedy 2006): A gang audit was used to identify specific gangs and their rivalries and alliances with other gangs (Kennedy, Braga, and Piehl 1997; Papachristos and Kirk 2015), and social network analysis was used to target specific gangs and think strategically about the diffusion of the deterrence message to socially connected gangs (Gravel and Tita 2015). Like in other jurisdictions (Braga, Kennedy, and Tita 2002), the applied research exercise suggested that the bulk of gun homicides and nonfatal shootings were highly concentrated among a small number of criminally active individuals who were involved in violent conflicts among street gangs. For instance, gang members represented less than 1 percent of the city’s population but were involved in nearly two thirds of gun homicides between January 2012 and June 2013.
Beyond analytic support, the CPSC remained a key partner in the implementation of GVRS by working with the OPD to ensure fidelity to core prevention principles, execution of program activities as intended, and robust collaborations with community and social service partners. The OPD led an interagency Ceasefire enforcement group comprised of federal law enforcement agencies (e.g., U.S. Attorney’s Office, Federal Bureau of Investigation, and Bureau of Alcohol, Tobacco, Firearms and Explosives) and state and county criminal justice agencies (e.g., California Department of Justice, California Department of Corrections and Rehabilitation, Alameda County Sheriff’s Office, Alameda County Prosecutor’s Office, and Alameda County Probation Department). The OPD enforcement actions were coordinated through Ceasefire units (five centralized units of eight officers each) and its gang investigations unit (eight plainclothes officers and detectives). The broader Oakland Ceasefire Partnership included the Mayor’s Office; social service agencies led by the Human Services Department, including case managers, hospital responders, and street outreach workers; and community leaders from local organizations, including The Brotherhood of Elders, Make Oakland Better Now, and Oakland Community Organizations (a faith-based community organization).
The Oakland Mayor’s Office institutionalized the Ceasefire GVRS program by establishing a directive designating that the initiative would be managed through weekly shooting reviews, biweekly coordination meetings, and bimonthly performance appraisals. Shooting reviews examined citywide shootings and violence dynamics by specific gangs to direct Ceasefire enforcement resources in efforts to prevent future incidents (see Braga, Hureau, and Grossman 2014). Biweekly coordination meetings convened managers of several outreach and intervention providers, together with OPD officials, to identify and affirm Ceasefire priorities and to ensure follow-through with actions and outreach directed toward targeted gang members. Bimonthly performance review meetings included the Mayor’s Office, OPD, local service agency heads, and community partners to examine recent key activities and programmatic outcomes to foster transparency and trust as well as mutual accountability for the effective use of resources.
The Ceasefire GVRS intervention was triggered when specific gangs engaged in serious gun violence. The OPD and enforcement partners developed special enforcement strategies that were customized to the criminal justice vulnerabilities of targeted gangs. These enforcement actions were matched with a parallel effort to direct social services and the moral voices of communities negatively affected by serious gun violence driven by targeted gangs. The Ceasefire partnership communicated directly and repeatedly with the targeted gangs to inform them that shootings would no longer be tolerated and continued gun violence would receive special enforcement attention, to describe the kinds of increased enforcement and sanctions that would be focused on them, and to offer services and opportunities to gang members who wanted to halt their violent behavior. These messages were disseminated to targeted gangs through “custom notifications” to individual gang members in street settings or at their homes, as well as during group “call-ins,” invited or directed (via probation or parole supervision) face-to-face meetings with law enforcement, social service providers, and representatives from the community. Importantly, the Oakland Ceasefire Partnership leveraged the structure of gang networks by communicating not only with the targeted group but also their rivals and allies to make sure that they understood the violence prevention regime that was being implemented.
The full Ceasefire GVRS was first implemented in February 2013 with the completion of an OPD—California Department of Justice wiretap investigation that led to the arrest of eight violent members of the Case Boys gang who were suspected of 19 shootings (including four gun homicides) in 2012. This enforcement action was followed up by communications and social service provisions as described above. Between 2013 and 2017, GVRS interventions were directly applied 19 times to 15 unique Oakland street gangs. Four gangs that received the treatment in 2013 escalated violent behavior in later years and received a second dosage of treatment. The strategic enforcement actions connected to Ceasefire call-ins resulted in the arrests of 161 gang members (mean = 8.5 arrests, range = 4–31 arrests per operation). The 19 call-ins were attended by 288 gang members and supplemented by individual communications with an additional 755 gang members. The Human Services Department recorded receiving 269 individuals as Ceasefire referrals for job training, life coaching, and education services. Social network analyses used in the CPSC problem analysis research revealed that an additional 13 gangs were connected to the 15 targeted groups via rivalries and alliances and therefore received vicarious treatment through GVRS communications.
Evaluation Design
We use nonrandomized, quasi-experimental designs to compare shooting trends for Oakland gangs and census block groups that experienced GVRS treatment to shooting trends for comparison Oakland gangs and census block groups, respectively, that did not directly receive the GVRS treatment (Shadish, Cook, and Campbell 2002). The place impact (block group) evaluation was also designed to test whether untreated block groups immediately surrounding matched treated block groups experienced spatial shooting displacement or diffusion of crime control benefits impacts relative to untreated block groups surrounding matched untreated block groups. The group impact evaluation was likewise designed to consider the main program effects on the shooting behaviors of directly treated gangs and whether there were any spillover program effects on the shooting behaviors of vicariously treated gangs relative to untreated gangs.
The Oakland Ceasefire program was explicitly designed to ensure that knowledge of GVRS actions would diffuse to non-GVRS rivals and allies and therefore influence these gangs’ own shooting behaviors. The inclusion of census block groups that were immediately adjacent to treated block groups and non-GVRS gangs that were socially connected to GVRS gangs in the comparison groups would violate the “stable unit treatment value assumption” (SUTVA). As suggested by Rubin (1990), SUTVA requires that an outcome observation on one unit should be unaffected by the particular assignment of treatments to the other units. To safeguard against interference between units, our quasi-experimental designs considered the adjacent census block groups and vicariously treated gangs that were known to have a rivalry or an alliance with a GVRS gang.
Data and Units of Analysis
Serious gun violence was measured by using computerized records of OPD official reports of Homicide by Firearm (CA Penal Code 187 [A]) and Assault with a Firearm on Person (CA Penal Code 245 [A][2]) incidents between January 1, 2010, and December 31, 2017. Oakland experienced a total of n = 4,174 fatal and nonfatal shooting victimizations during the study period. Figure 1 presents the yearly counts of fatal and nonfatal shooting victimizations. Total Oakland shooting victimizations peaked at 710 in 2011 (93 fatal victims and 617 nonfatal victims) and decreased by 52.1 percent to a low of 340 in 2017 (63 fatal victims and 277 nonfatal victims).
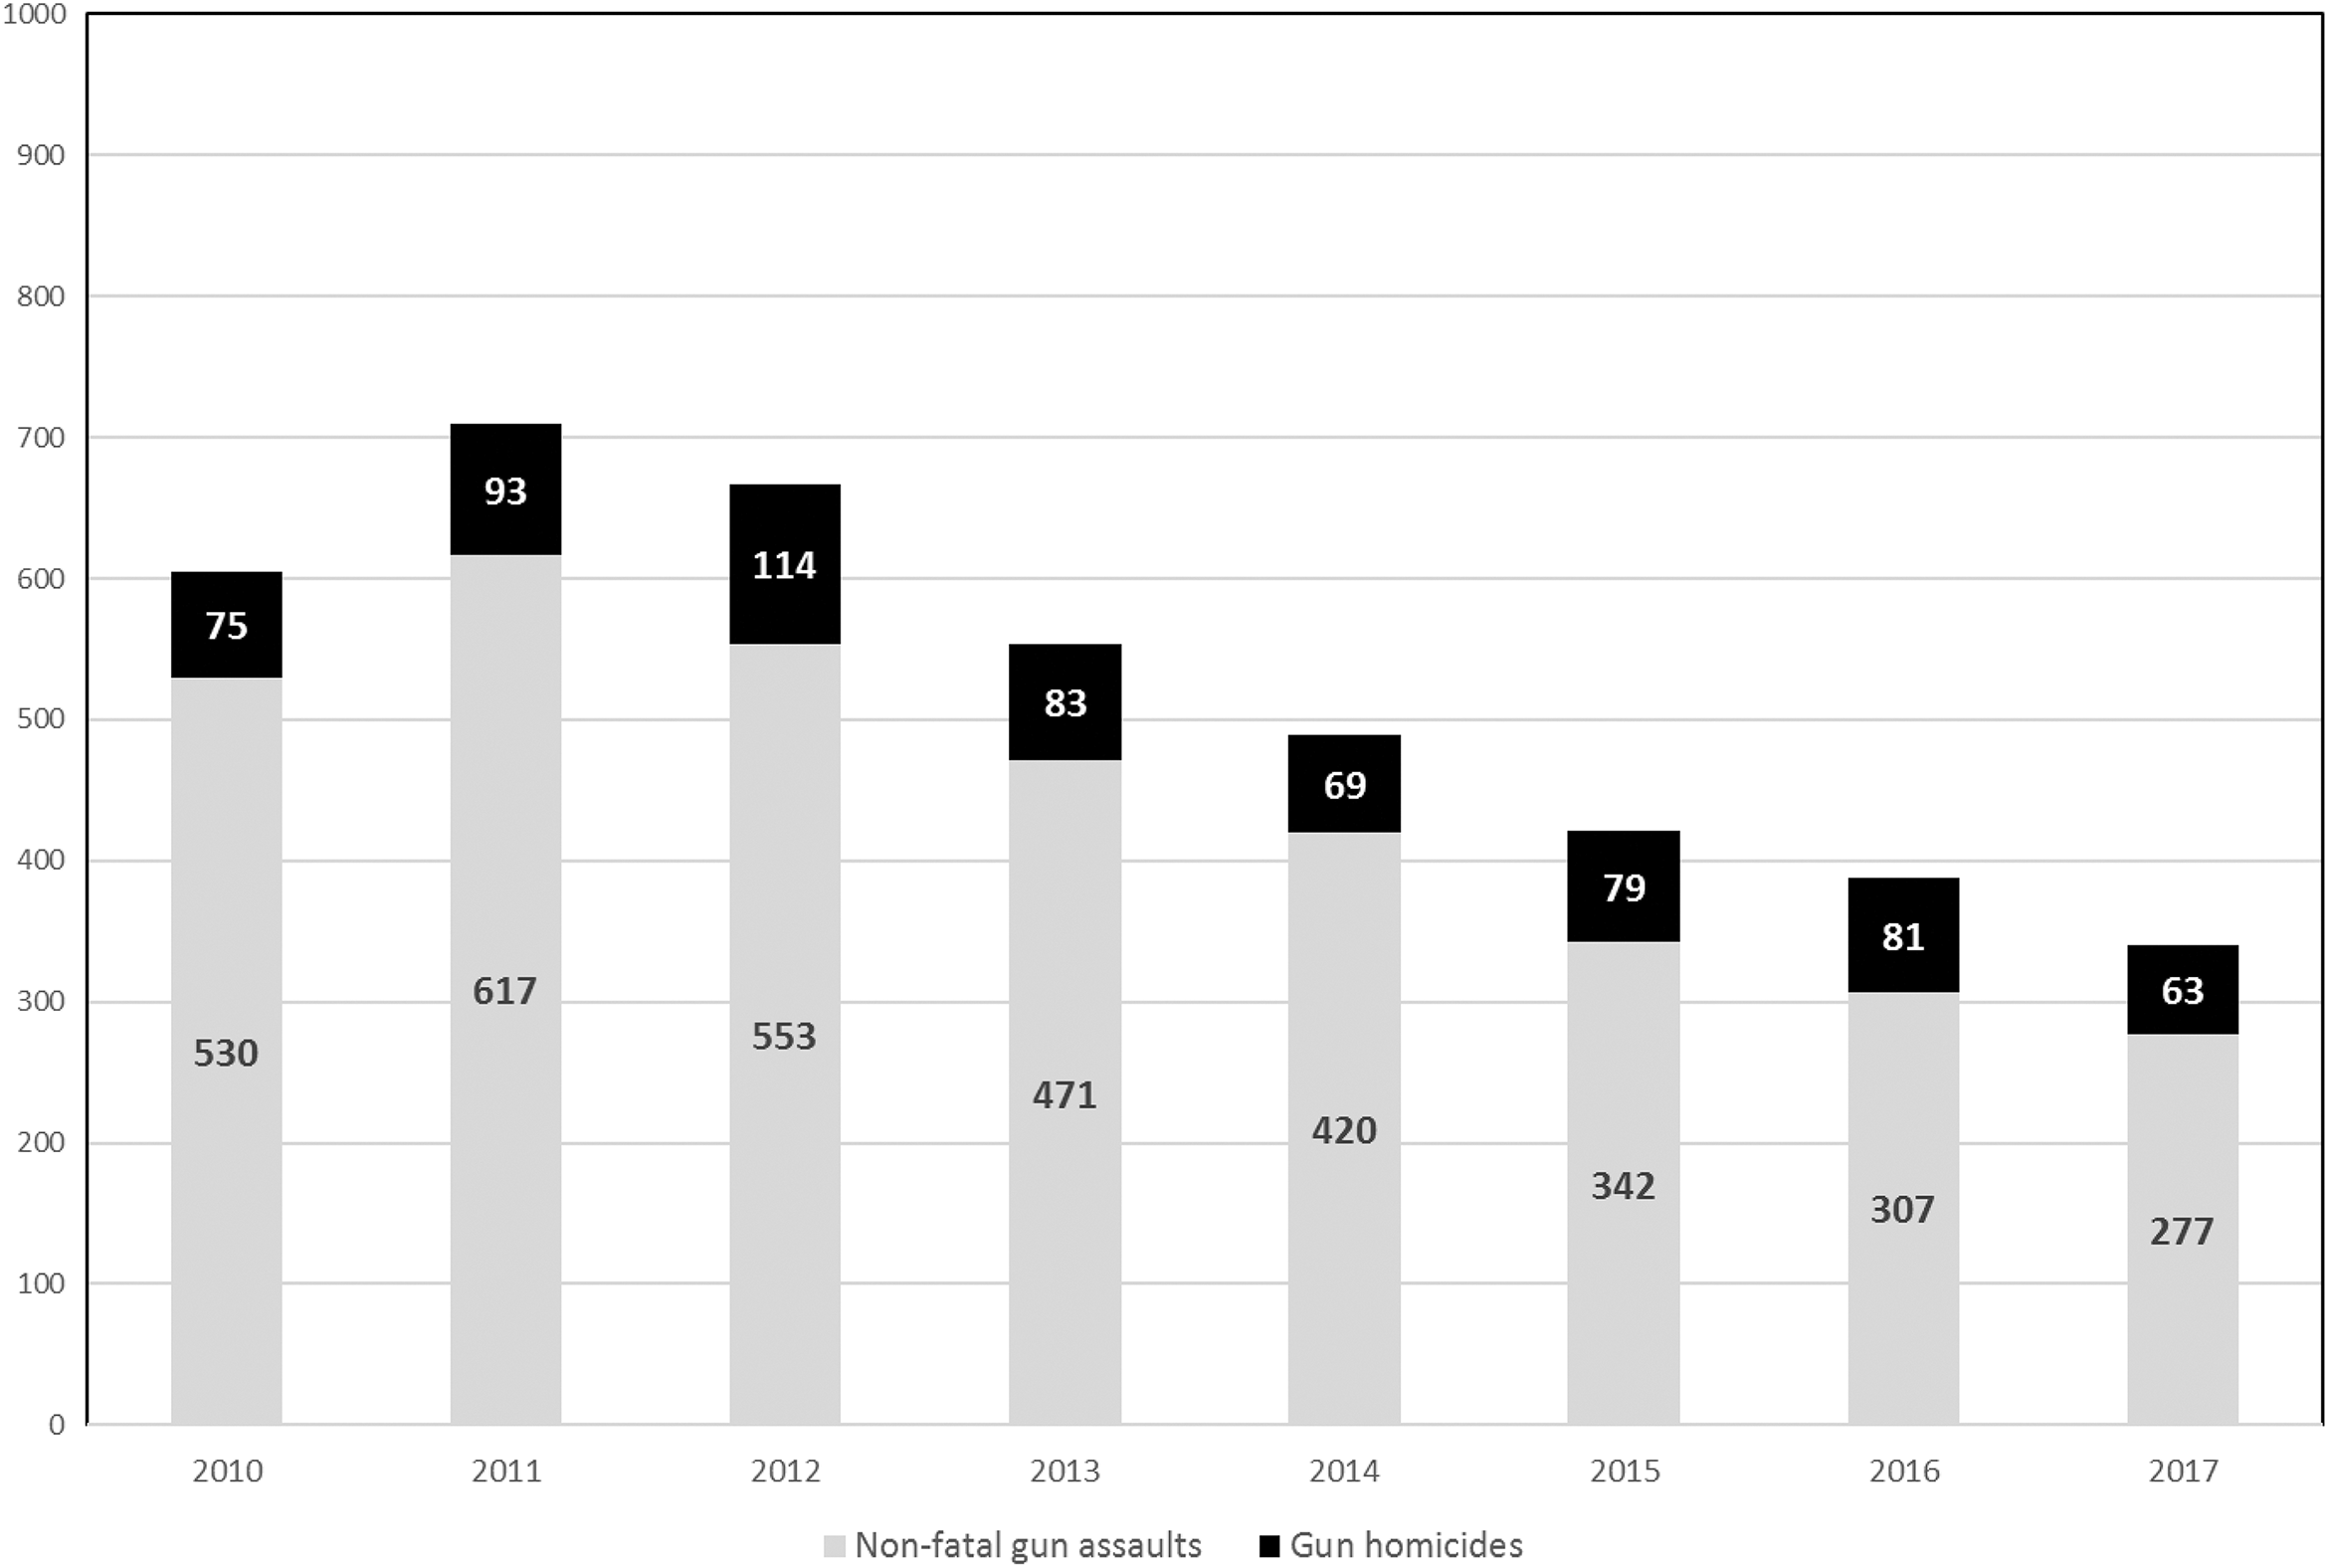
Oakland fatal and nonfatal shootings, 2010–2017.
The CPSC provided us with OPD problem analysis data that included detailed historical information on the number of members, turf locations, rivalries, and alliances for each Oakland gang during the study period. 3 We used block groups as the spatial units of analysis because block groups represent the most granular spatial level connected to gangs that were directly treated by the GVRS intervention. 4 Gang turf boundaries were translated from a physical map with drawn-on boundaries from the CPSC to a digital map in ArcGIS [version 10.6.1] where polygons were created to designate gang turf boundaries. Gang turf locations were then connected to census block group geography from the 2016 U.S. census. This process identified block groups (n = 374) that contained geographical space within the city of Oakland, of which one half (n = 187) contained at least one gang. OPD shooting data included event addresses, which were geocoded to longitude/latitude coordinates and assigned to block groups. 5
Gang involvement in fatal and nonfatal shooting victimizations between 2010 and 2017 was determined through the use of “crime incident reviews” (see Klofas and Hipple 2006). To facilitate the design and implementation of Ceasefire GVRS, the OPD convened a series of shooting review meetings attended by experienced homicide detectives, gang unit officers, and crime analysts. The meeting participants shared their qualitative insights on circumstances of the shooting event, the relationships between victims and suspects, and details on the gangs (if any) involved in the shooting. For this evaluation, all shooting data were also subjected to a retrospective review by well-informed detectives and gang officers to ensure that prior attributions on gang involvement remained accurate as additional intelligence was acquired over time. A total of n = 2,021 (48.4 percent of 4,174) fatal and nonfatal shootings involved gang members as victims, offenders, or both. The shooting review data suggested that distinct gangs (n = 76) were involved in more than one shooting incident between 2010 and 2017. 6
Official crime incident data suffer from well-known limitations such as citizens not reporting all crimes to the police and police decision-making on whether a reported event should be recorded as a crime incident (Black 1970). Police-reported data on gang activity and violence, however, have been found to be valid and reliable indicators of gang violence. For instance, Decker and Pyrooz (2010) reviewed police reports of gang homicides in large U.S. cities and found that these data had consistent internal reliability, strong construct validity, and robust external validity. Police departments with gang units, such as OPD, were noted to generate more reliable and valid indicators of gang violence relative to police departments without such units (Katz, Webb, and Schaefer 2000).
Figure 2 presents the yearly count of fatal and nonfatal shooting incidents that did and did not involve gang members between 2010 and 2017. Both gang-member-involved and non-gang-member-involved shooting incidents decreased markedly during the study time period. However, the decrease in gang-member-involved shootings was steeper than the decrease in non-gang-member-involved shootings after the Ceasefire GVRS was implemented in 2013. The yearly mean number of gang-member-involved shootings decreased by 43.2 percent from 346.0 during the preintervention years (2010–2012) to 196.6 during the intervention years (2013–2017). By comparison, the yearly mean number of non-gang-member-involved shootings decreased by only 23.2 percent from 314.7 during the preintervention years (2010–2012) to 241.8 during the intervention years (2013–2017).
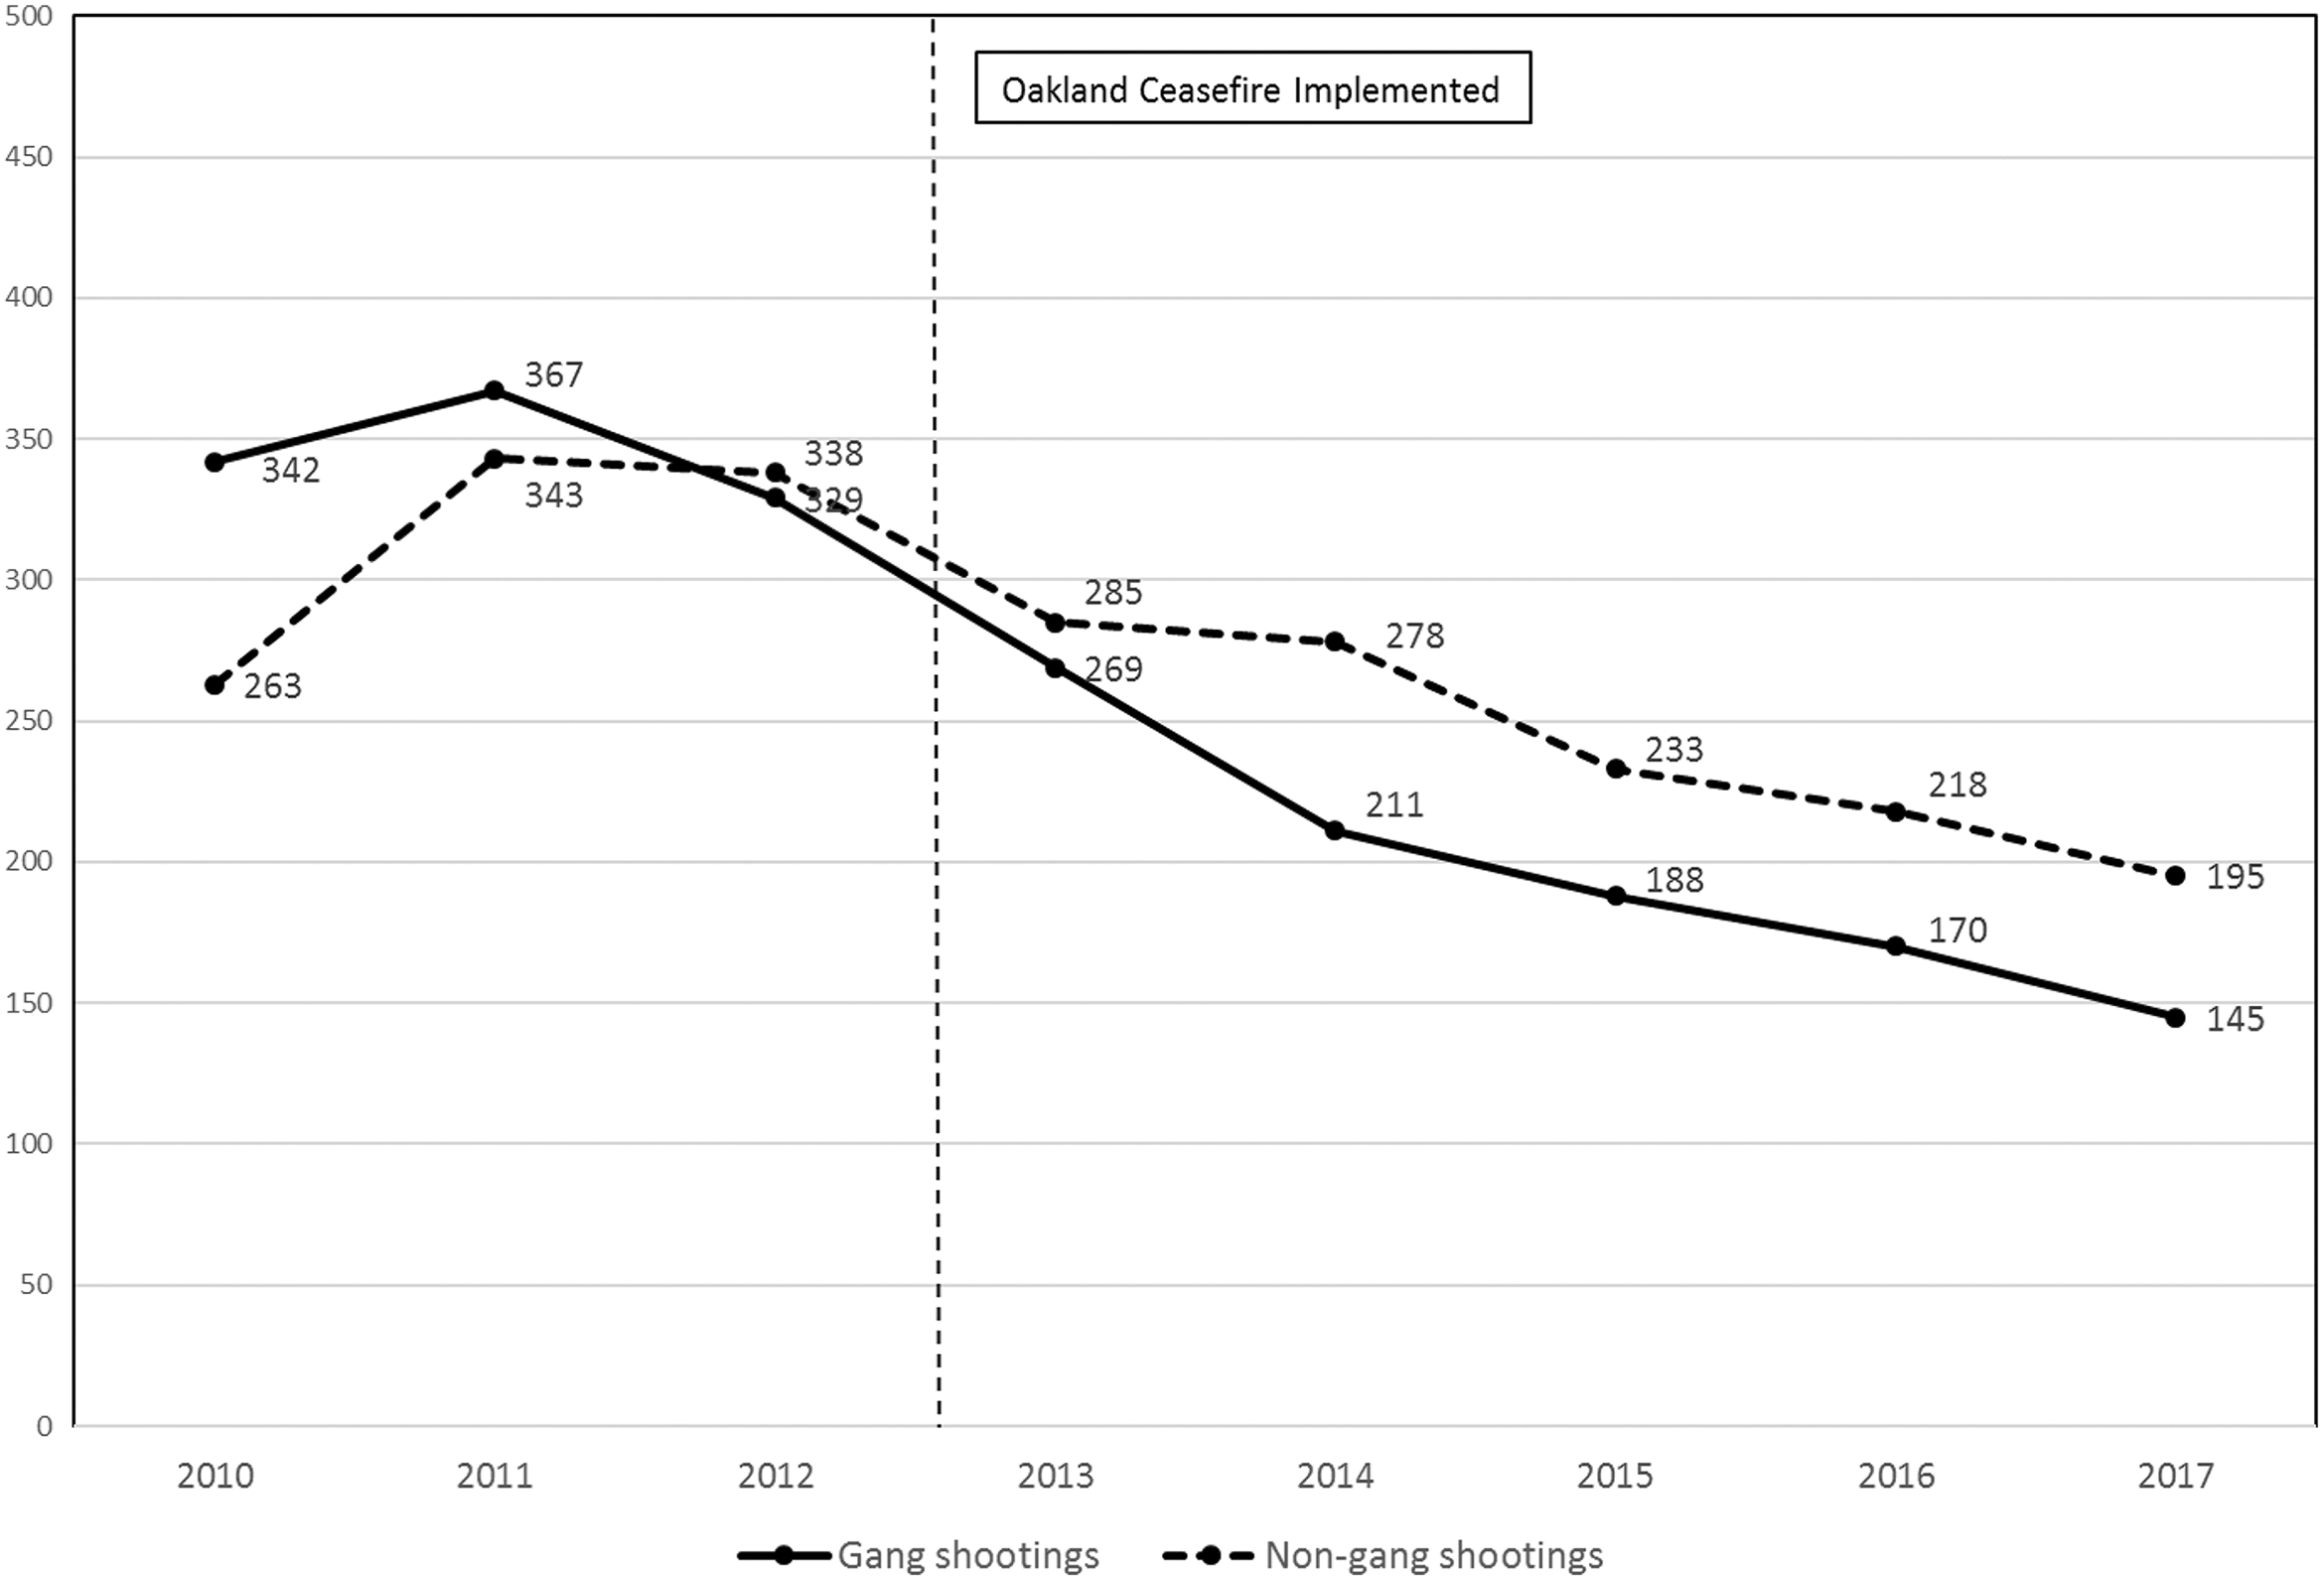
Oakland gang-member-involved and non-gang-member-involved shootings, 2010–2017.
Quarterly counts of shootings by and against particular Oakland gangs between 2010 and 2017 were the units of analysis in our group impact evaluations. To provide more stable estimates of the impacts of GVRS on shootings and homicides across Oakland block groups, the units of analysis in our place impact evaluation were annual counts of fatal and nonfatal shootings in Oakland block groups—or block group years—between 2010 and 2017. Approximately 83.4 percent (n = 311) of Oakland’s block groups had at least one shooting between 2010 and 2017.
Place Impact Evaluation Design
In the place impact evaluation, treated block groups contained at least one gang that received the GVRS intervention during the study period (n = 93; 24.9 percent). Block groups with more than one gang were considered “treated” from the month of intervention with the first gang. A block group was considered untreated if it did not intersect with gang turf or if it included gang turf but none of the gangs within the block group were treated. Additionally, to estimate spatial displacement and diffusion effects, we excluded all untreated Oakland block groups that were geographically adjacent to the GVRS block groups from consideration as comparison groups in our quasi-experimental evaluation. 7 This process resulted in block groups (n = 189) that were not spatially connected to the GVRS block groups (n = 93) as possible comparison groups.
Stata 15 statistical software was used to execute PSMATCH2 propensity score matching routines (Leuven and Sianesi 2003) to develop matched treatment and comparison block groups from the GVRS and untreated block groups (n = 282). Propensity score matching routines summarize relevant pretreatment characteristics of each block group into a single-index variable—the propensity score—and then match block groups in the comparison pool to GVRS block groups on values of the propensity score (Rosenbaum and Rubin 1985). Radius matching with a caliper = .01 was selected from the diverse pool of propensity score matching techniques (Apel and Sweeten 2010). After the maximum propensity score caliper is established, this algorithm matches all untreated units within the given radius of a treated units (Caliendo and Kopeinig 2005
; Dehejia and Wahba 2002). The propensity score matching routine included the following characteristics:
Number of total shootings in each block group in 2010 (pre-GVRS).
Number of total shootings in each block group in 2011 (pre-GVRS).
Number of total shootings in each block group in 2012 (pre-GVRS). The GVRS intervention was more likely to be applied to block groups that experienced persistently high yearly counts of shootings. To ensure similar levels of gun violence over the preintervention time period, three covariates measuring the yearly number of shootings in eligible Oakland block groups were included in the propensity score model.
Number of unique gangs in each block group during the study period. Gangs engaged in serious gun violence are targeted for GVRS attention. Gangs located in close spatial proximity, especially when their turfs are adjacent, are more likely to be involved in violent conflicts (Tita and Greenbaum 2009; Tita and Radil 2011).
8
Concentrated disadvantage. Research reveals that the degree of concentrated social disadvantage in a neighborhood is strongly correlated with the concentration of violent crime (Morenoff, Sampson, and Raudenbush 2001) and gang crime in these areas (Papachristos and Kirk 2006
; Rosenfeld, Bray, and Egley 1999). An index measuring concentrated social disadvantage was calculated by standardizing and summing the following block group–level variables from the 2016 U.S. Census’s American Community Survey (ACS): the proportion of families below the poverty level, proportion of households receiving public assistance, proportion of female-headed households with children, and proportion of the population unemployed.
9
Racial and ethnic heterogeneity. A measure of racial and ethnic heterogeneity was constructed from the 2016 ACS using Blau’s (1977) index by summing the squared proportion of the population in each racial/ethnic group and then subtracting this summation from 1.
10
Gentrification. Using information from the ACS, we calculated whether or not (1 = yes, 0 = no) the percent increase in educational attainment, median income, and home value in each of Oakland’s census tracts from 2010 to 2016 was greater than the average percent increase in these attributes across the city of Oakland as a whole.
11
Census tracts with a larger percent increase than the city of Oakland for any two of these three indicators were considered gentrified. Block groups were then assigned the gentrification value of the broader census tract.
The propensity score matching routine results are presented in Table 1. This includes the prematching and postmatching means for the 47 matched GVRS block groups and the 95 matched comparison block groups, t-tests and p values, and standardized bias statistics showing the average difference as a percentage of the mean standard deviation between the groups (Rosenbaum and Rubin 1985). 12 Table 1 confirms that the matched sample created balanced treatment and comparison groups as all p values are higher than .05 and the bias statistics are generally less than 20.0 (Austin, Grootendorst, and Anderson 2007). The propensity score matching routine indicated that the 47 matched GVRS block groups and the 95 matched comparison block groups were in the common support region, ensuring that block groups with the same values of covariates have the same probability of being treated and untreated (Heckman, LaLonde, and Smith 1999).
Balancing Treatment and Comparison Block Groups through Propensity Score Matching.

Note: N = 142 (47 treated block groups, 95 comparison block groups). Results based on radius matching propensity score model (caliper = .01).
The annual change in shootings for treatment and comparison block groups over the eight-year observation period (2010–2017) was analyzed using a multilevel count regression model. 13 Individual growth curve models using longitudinal, hierarchical negative binomial models were developed to predict within-unit variation at level 1 (repeated measures in block groups across time) and between-unit variation at level 2 (across block groups). Thus, we analyze the overall trend in shootings for each block group during the study period, while allowing for variation in starting levels of shootings and homicides as well as varying rates of change during the study period (Gelman 2005 ; Singer and Willet 2003).
Our baseline analysis compares the 93 GVRS block groups to all 281 untreated block groups that were not geographically adjacent to GVRS block groups. Our model is specified as:

where the annual counts of shootings over the eight-year study period served as our primary outcome measure (Yij ). To estimate the effect of the Oakland GVRS treatment, we created binary dummy variables indicating whether a block group was in the treatment group (1) or in the comparison group (0; GVRS) and whether the year was preintervention (0) for 2010–2012 or during the intervention period (1) for 2013–2017 (Period). A DID estimator (Impact) was created by interacting the GVRS and Period dummy variables (see, e.g., Card and Krueger 1994). The DID estimator provides estimates of the effects of the GVRS intervention on the treatment block groups relative to the comparison block groups. Secular linear and nonlinear annual trends in the dependent variable were estimated through the inclusion of variables measuring the simple linear additive progression for each year over the course of the eight-year observation period (Trend) and its square (Trend 2 ).
In the second stage of analysis, we compare the 47 matched GVRS block groups to the 95 matched control block groups. To accomplish this, we estimate the growth curve regression model specified above for the matched treatment and control block groups but include the inverse probability of treatment weighted (IPTW) propensity score value (IPTW = 1/propensity score) for each of the treatment and comparison block groups. The IPTW covariate controls for observable differences between the block groups in the treatment and comparison groups, given the variables used to estimate the propensity score (Imbens and Wooldredge 2009).
In the third stage of analysis, we investigate the possibility for spillover or displacement effects. Using ArcGIS mapping software, we created a matrix of block group adjacency where a tie occurs if any side of an unmatched, untreated block group polygon touches at least one side of a matched, treated block group or a matched, comparison block group. 14 A total of 26 unmatched, untreated block groups bordered only matched, treated block groups and serve as our treatment buffer block groups; and 83 unmatched, untreated block groups bordered only matched, comparison block groups and serve as our control buffer block groups. We then estimated the growth curve regression model specified above for the treatment buffer block groups and the control buffer block groups. Stata 15 statistical software was used to calculate the maximum likelihood estimate of the parameters estimates via the XTNBREG command. 15 For ease of interpretation, incidence rate ratios (i.e., exponentiated coefficients) were used to express the parameter estimates.
Group Impact Evaluation Design
Figure 3 illustrates how social network analysis concepts were used to determine directly treated and vicariously treated gangs in one highly violent and densely connected clique of Oakland gangs. In this sociogram, there were six gangs that directly received the Oakland GVRS Ceasefire treatment and nine socially connected gangs that received vicarious treatment during the study period. As described above, the Oakland GVRS intervention was directly applied to 15 gangs (19.7 percent of 76 Oakland gangs active during the study period) and vicariously applied to 13 gangs (17.1 percent of 76) that were socially connected to the directly treated GVRS gangs through rivalries and alliances. Forty-eight gangs (63.2 percent of 76) that did not experience direct or vicarious treatment were available to serve as untreated comparison gangs.
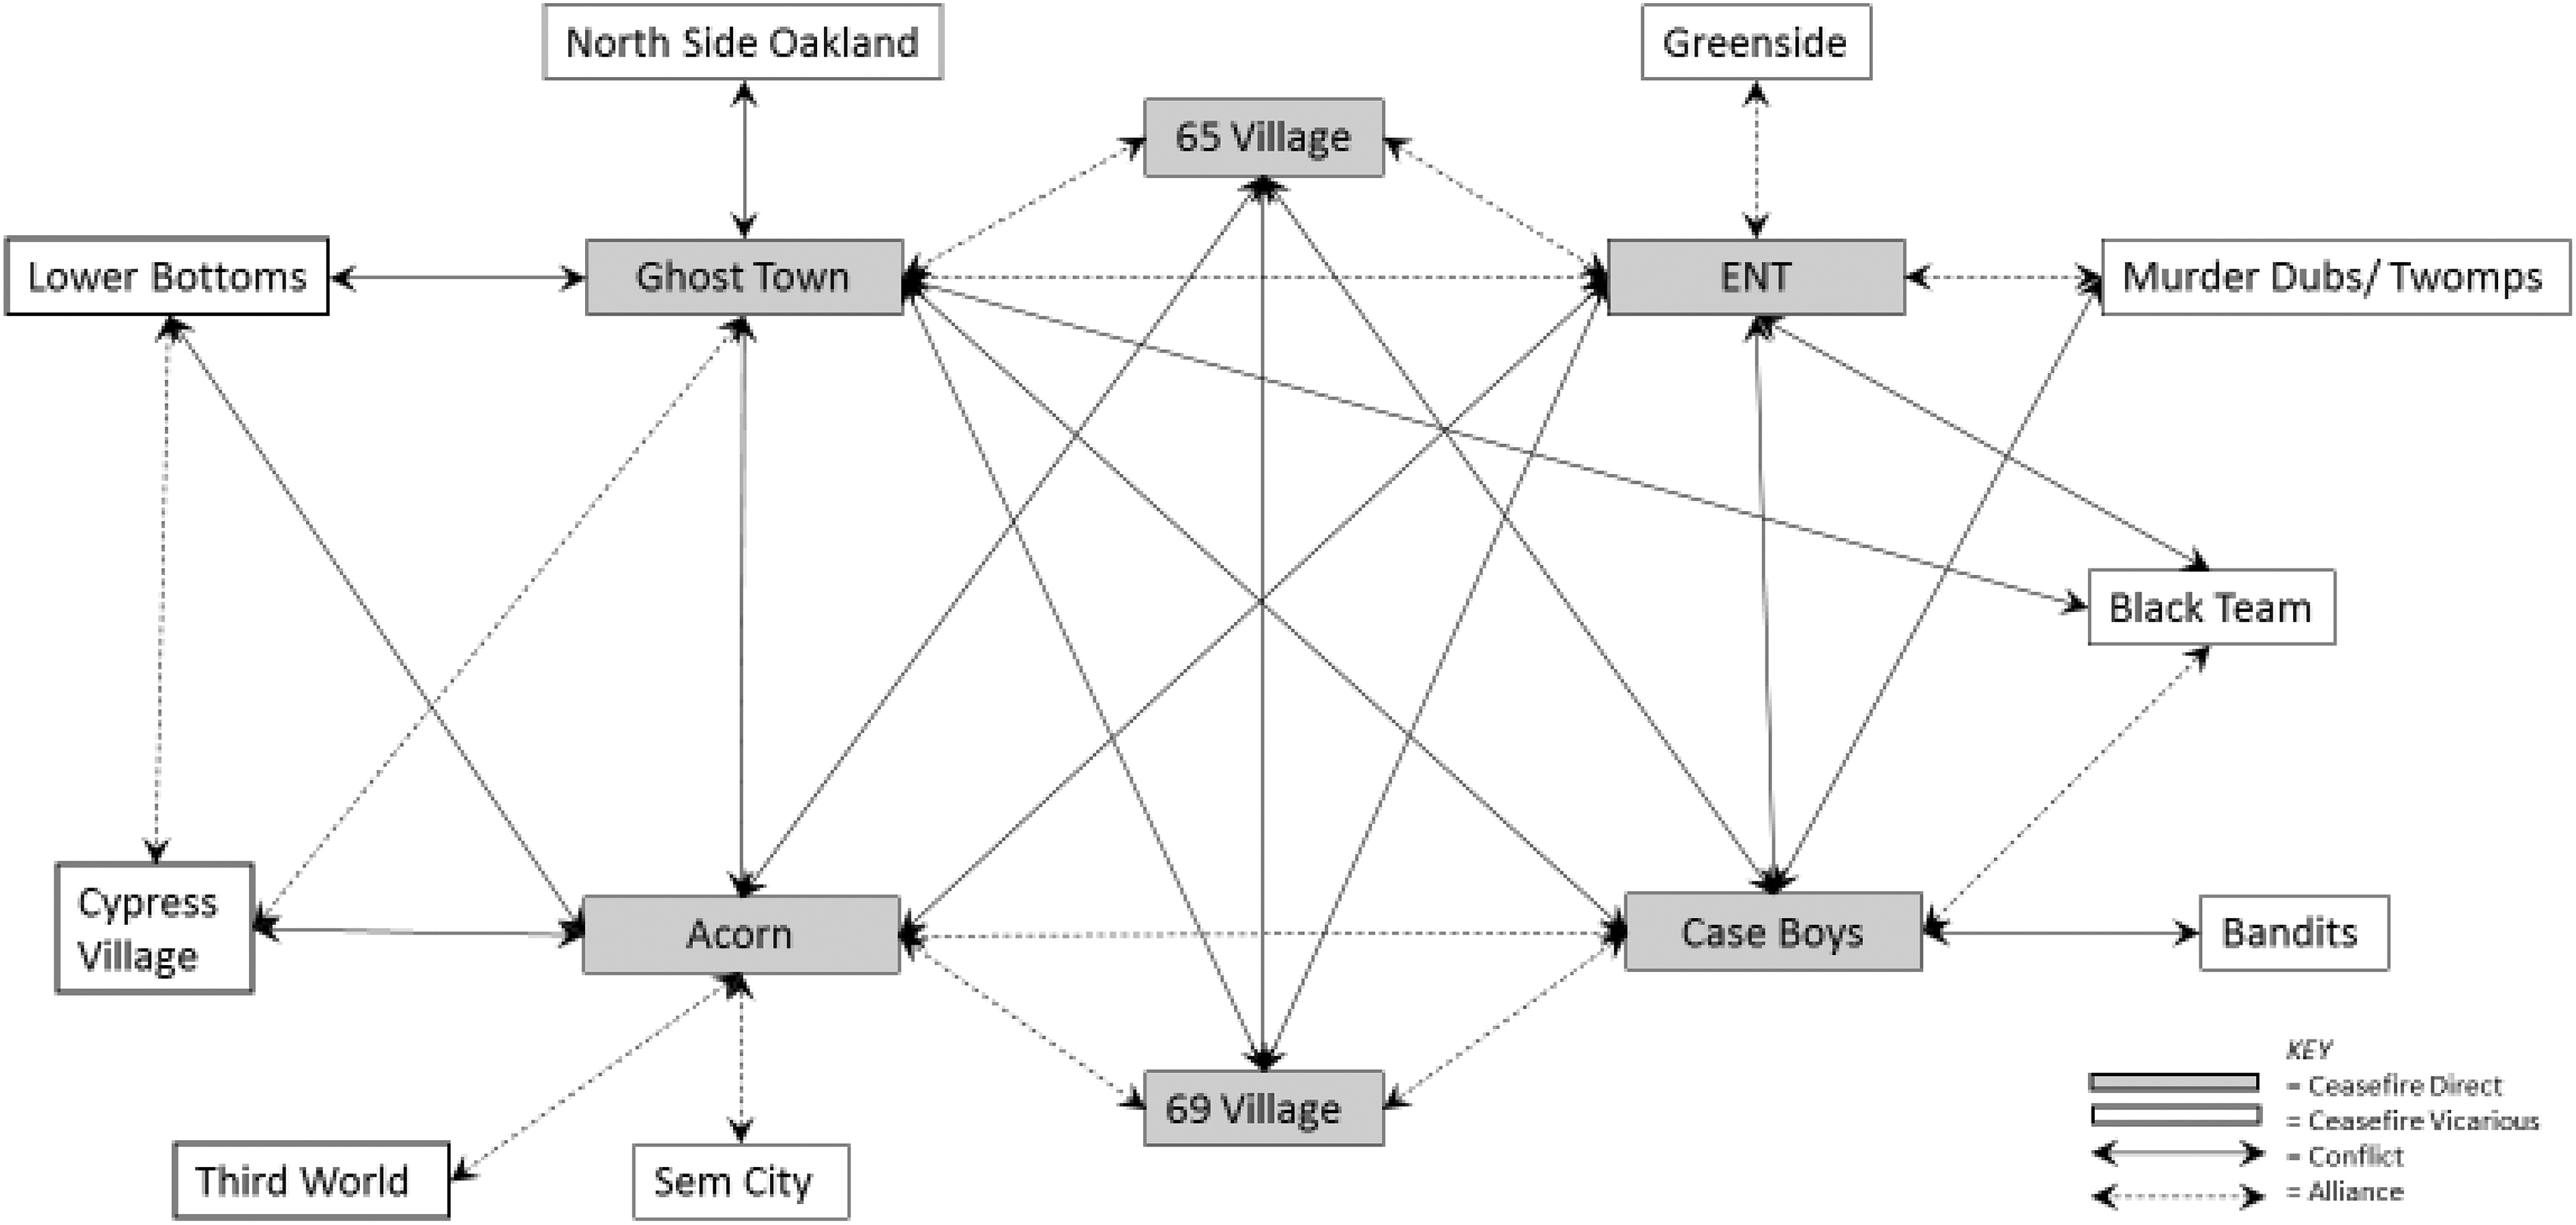
Direct and vicarious ceasefire treatment applied to Oakland gangs.
The PSMATCH2 radius matching (caliper = .01) routine was used to develop matched comparison and treatment groups from the 48 untreated gangs and the 28 directly treated and vicariously treated Oakland GVRS gangs. The following seven characteristics were used in the propensity score matching routine:
1. Mean number of total shootings committed by each gang between 2010 and 2012 (pre-GVRS)
Research suggests that ongoing conflicts among street gangs are characterized by retaliatory cycles of violence (Decker 1996 ; Hughes and Short 2005 ; Papachristos 2009). Oakland gangs that generate persistently high levels of gun violence over time are more likely to attract law enforcement attention.
2. Adjacency to another gang’s turf
Gang violence tends to occur in areas with adjacent gang turfs (Papachristos 2009; Tita and Greenbaum 2009; Tita and Radil 2011). Oakland gangs with turf boundaries that intersect with another gangs’ turf boundaries may be at elevated risk of involvement in serious gun violence. 16
3. Gang longevity
Long-standing Oakland gangs will tend to have persistent rivalries with other gangs and have more extensive histories of death and injuries of members as result of ongoing retaliations by their enemies. As such, gang longevity could increase the likelihood of shootings by and against these groups over the course of the intervention. 17
4. Number of rivalries with other gangs
Retaliation and retribution characterize outbreaks of gang violence (Decker 1996 ; Hughes and Short 2005 ; Papachristos 2009). Oakland gangs with larger number of rivalries with other gangs may have been at increased risk of experiencing gun violence if latent disputes with their rivals became active during the study period.
5. Number of alliances with other gangs
Allied gangs sometimes aid each other in violent disputes with their rivals (e.g., see Levitt and Venkatesh 2000). Gangs with increased number of alliances with other gangs may have been at higher risk of involvement in serious gun violence when their allies became involved in active violent disputes.
6. Gang located in housing project
Relative to urban areas without public housing developments, housing project areas tend to be associated with higher levels of gang homicide (Smith 2014).
7. The concentration of social disadvantage in each gang turf area
To ensure that treated and untreated gangs were selected from similar neighborhoods, the concentrated social disadvantage index metric was calculated for the block group(s) surrounding gang turfs.
The propensity score matching routine revealed that 13 matched directly treated gangs, 9 matched vicariously treated gangs, and 36 matched comparison gangs were in the common support region (Table 2). In the matched sample, all p values are higher than .05, and all bias statistics are less than 20.0. This confirmed that we achieved balanced matched treatment and matched comparison groups.
Balancing Treatment and Comparison Gangs through Propensity Score Matching.
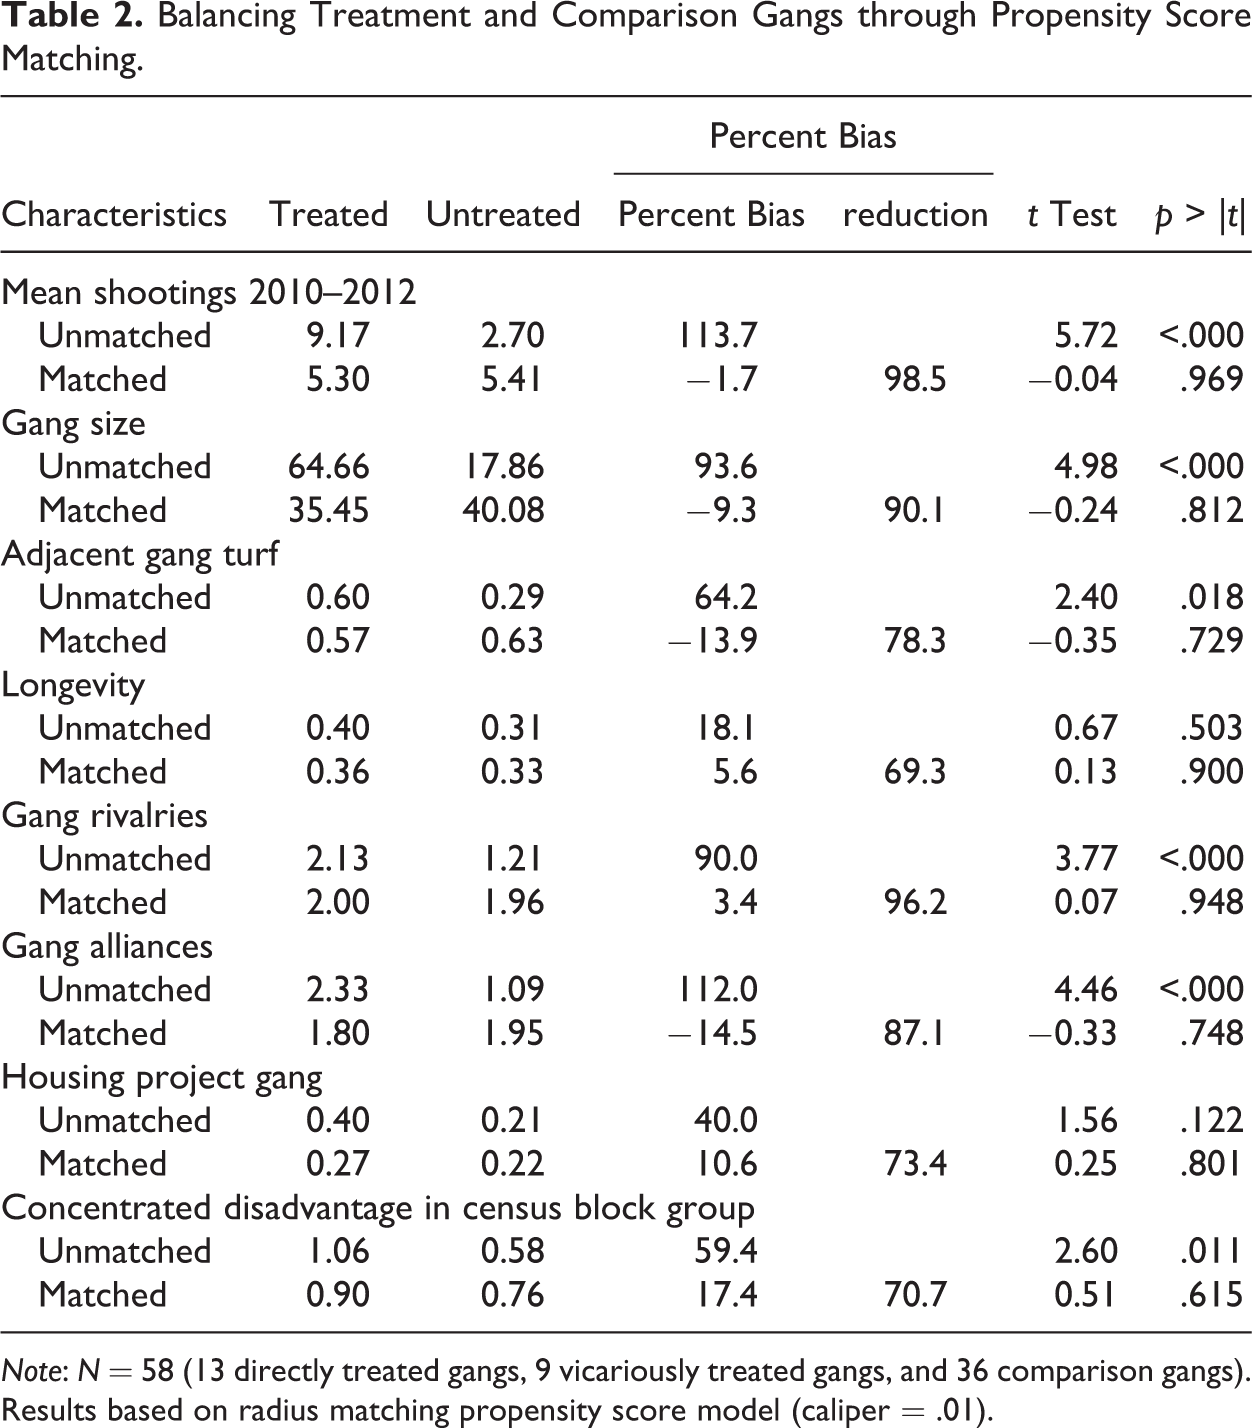
Note: N = 58 (13 directly treated gangs, 9 vicariously treated gangs, and 36 comparison gangs). Results based on radius matching propensity score model (caliper = .01).
Growth curve negative binomial regression models were used to analyze the quarterly change in gang-involved shootings for treatment and comparison gangs over the eight-year observation period (2010–2017, n = 32 quarters, outcome variable Yit ). 18 Two separate DID estimators were used to measure the impact of the Oakland GVRS focused deterrence strategy on total shootings involving directly treated gangs (n = 15) and vicariously treated gangs (n = 13) relative to total shootings involving all other nontargeted gangs in Oakland (n = 48). As such, our initial growth curve regression model was as follows:

The GVRS covariate identified whether a gang was directly targeted by the Ceasefire focused deterrence program (1) or not (0). The Connected regressor indicated whether a gang was socially connected as an ally or rival to a gang that was subjected to the GVRS strategy (1) or not (0). Oakland gangs that were neither the direct nor indirect targets of the GVRS program served as the reference category for these two dummy variables. Period indicated whether the quarter was during the postintervention period (1) or during the preintervention period (0). The DID estimates of the direct and indirect Oakland GVRS effects were represented by the coefficients β4 and β5, respectively.
The impact of the GVRS intervention on gang-involved gun violence was further appraised using a more conservative approach that compared total shooting trends for matched treated gangs (n = 13 directly treated and n = 9 vicariously treated) relative to total shooting trends for matched untreated gangs (n = 36). This model included the inverse-weighted propensity score values for each matched gang as a covariate. In addition to our total shooting analyses, we analyzed changes in the quarterly counts of victim gang-involved shootings and the quarterly counts of suspect gang-involved shootings. As with the place impact analyses, XTNBREG was used to estimate the group impact model coefficients.
Results
Place Impact Evaluation Results
Model 1 in Table 3 presents the results of the growth curve regression models for the raw DID analysis comparing the 93 GVRS block groups to the 281 untreated block groups that were not geographically adjacent to the treated block groups. Controlling for the other covariates, the Oakland Ceasefire GVRS intervention was associated with a statistically significant 22 percent reduction (p < .01) in yearly total shootings. Additionally, the GVRS dummy variable was statistically significant (p < .01), indicating that there were more shootings in the treated block groups, relative to the untreated block groups, and the significant Trend (p < .01) and Trend 2 (p < .01) variables indicate secular linear and nonlinear annual trends in the dependent variable. 19
Difference-in-differences Estimates of GVRS Impacts on Total Shootings in Oakland Block Groups: Growth Curve Regression Models, 2010–2017.
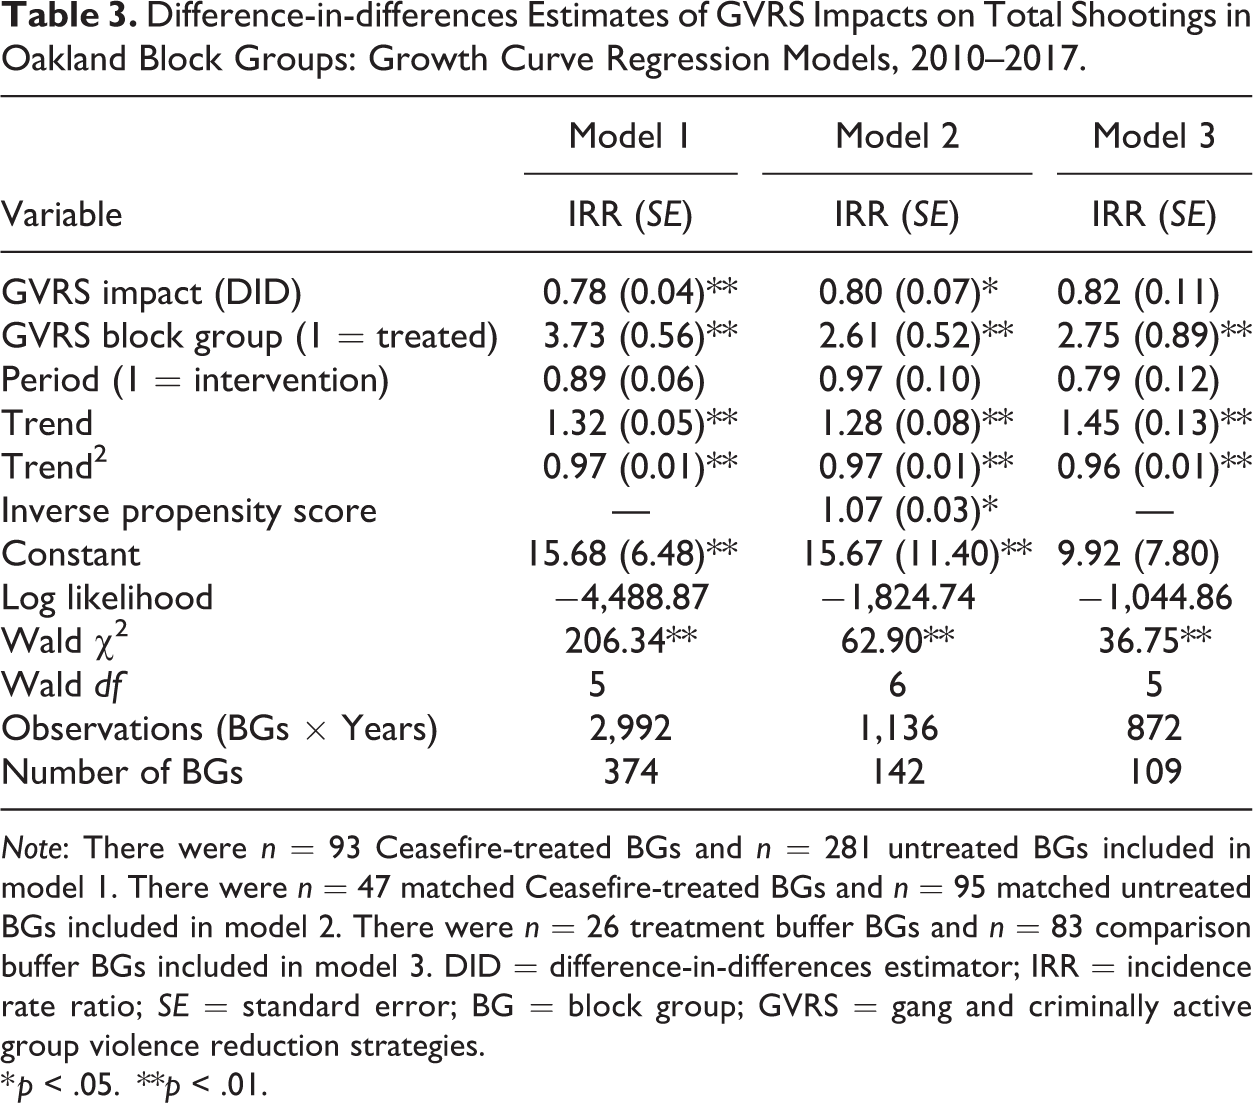
Note: There were n = 93 Ceasefire-treated BGs and n = 281 untreated BGs included in model 1. There were n = 47 matched Ceasefire-treated BGs and n = 95 matched untreated BGs included in model 2. There were n = 26 treatment buffer BGs and n = 83 comparison buffer BGs included in model 3. DID = difference-in-differences estimator; IRR = incidence rate ratio; SE = standard error; BG = block group; GVRS = gang and criminally active group violence reduction strategies.
* p < .05.
**p < .01.
Model 2 in Table 3 shows the results of the growth curve regression model comparing the 47 matched GVRS block groups to the 95 matched comparison block groups. Controlling for the other covariates, the GVRS intervention was associated with a statistically significant 20 percent reduction (p < .05) in yearly total shootings. Additionally, the incidence rate ratio for the GVRS dummy variable was attenuated from model 1, indicating that gap between shootings in the treated and untreated block groups was reduced by the matching routines. 20
Model 3 in Table 3 presents the results from the analysis of immediate spatial diffusion and displacement effects. A growth curve regression model comparing the 26 treatment buffer block groups to the 83 comparison buffer groups generated a DID estimator of .82 (p > .05), indicating that the treatment buffer block groups experienced a nonsignificant 18 percent reduction in yearly total shootings relative to the control buffer block groups. This finding suggests that there were not displacement effects, with the DID estimate favoring a nonsignificant diffusion of benefits of the GVRS intervention.
We note two complexities involved in the block group analysis. First, block groups may intersect with the turf of more than one gang, and treated block groups may contain a mixture of treated and untreated gangs. The propensity score matching routines included the number of unique gangs in the block group as a covariate, but this does not negate the possibility of contaminated results from a mixture of treated and untreated gangs in treated areas, as well as different numbers of gangs across block groups. Indeed, approximately 12 percent of the untreated block groups (n = 33/281) contained more than one gang, while almost three quarters of the treated block groups (n = 25/93) contained more than one gang, most of which (63/68 = 92.7 percent) also contained an untreated gang. To address this concern, we conducted several sensitivity analyses (before and after the matching routines). The results indicated (1) that the treated block groups containing only treated gangs and the treated block groups containing a mixture of treated and untreated gangs had comparable decreases in yearly total shootings over time and (2) that both of these groups had significant reductions in yearly shootings, relative to the untreated block groups. 21 These results provide credence to our analytic strategy of considering any block group with at least one treated gang in it similarly, regardless of whether or not the block group also had an untreated gang in it.
Second, we explore the possibility that untreated gangs in our untreated block groups could have been connected to treated gangs, thereby resulting in vicariously treated block groups. Indeed, we can consider 17 of the 95 matched, untreated block groups (17.9 percent) in our analysis to be vicariously treated based on gang structure and gang relationships. Specifically, we can consider an untreated block group as vicariously treated if it (1) contained an untreated gang that had at least one treated subgang, an untreated gang that was a subgang of a larger treated gang, or an untreated subgang that was connected to treated subgang through a larger untreated gang and (2) contained an untreated gang that had a conflict or alliance with a treated gang or an untreated subgang of a larger untreated gang that had a conflict or alliance with a treated gang. A growth curve regression model comparing the 17 matched, vicariously treated block groups to the 78 matched, untreated (and not vicariously treated) block groups generated a DID estimator of .95 (p > .05), indicating that the matched, vicariously treated block groups experienced a nonsignificant 5 percent reduction in yearly total shootings relative to the matched, untreated (and not vicariously treated) block groups. This finding suggests that there was a nonsignificant diffusion of benefits of the Ceasefire GVRS intervention to vicariously treated block groups.
Group Impact Evaluation Results
Model 1 in Table 4 presents the results of our growth curve regression models estimating GVRS impacts on total shootings by directly treated and vicariously treated gangs as compared to total shootings by all untreated Oakland gangs. The DID estimators suggest the GVRS focused deterrence strategy was associated with a statistically significant 33 percent reduction (p < .01) in quarterly total gang-involved shootings for the directly treated gangs and a statistically significant 24 percent reduction (p < .05) in quarterly total gang-involved shootings for the vicariously treated gangs relative to the comparison gangs, holding the other variables constant. It is important to note here that both the directly treated and the vicariously treated GVRS gangs had more total shootings when compared to total shootings involving untreated gangs over the course of the study period. The statistically matched treated and untreated Oakland gangs were balanced on this important outcome and, as such, provide a more conservative estimate of GVRS impacts.
Difference-in-differences Estimates of GVRS Impacts on Oakland Gang-involved Shootings: Growth Curve Regression Models, 2010–2017.
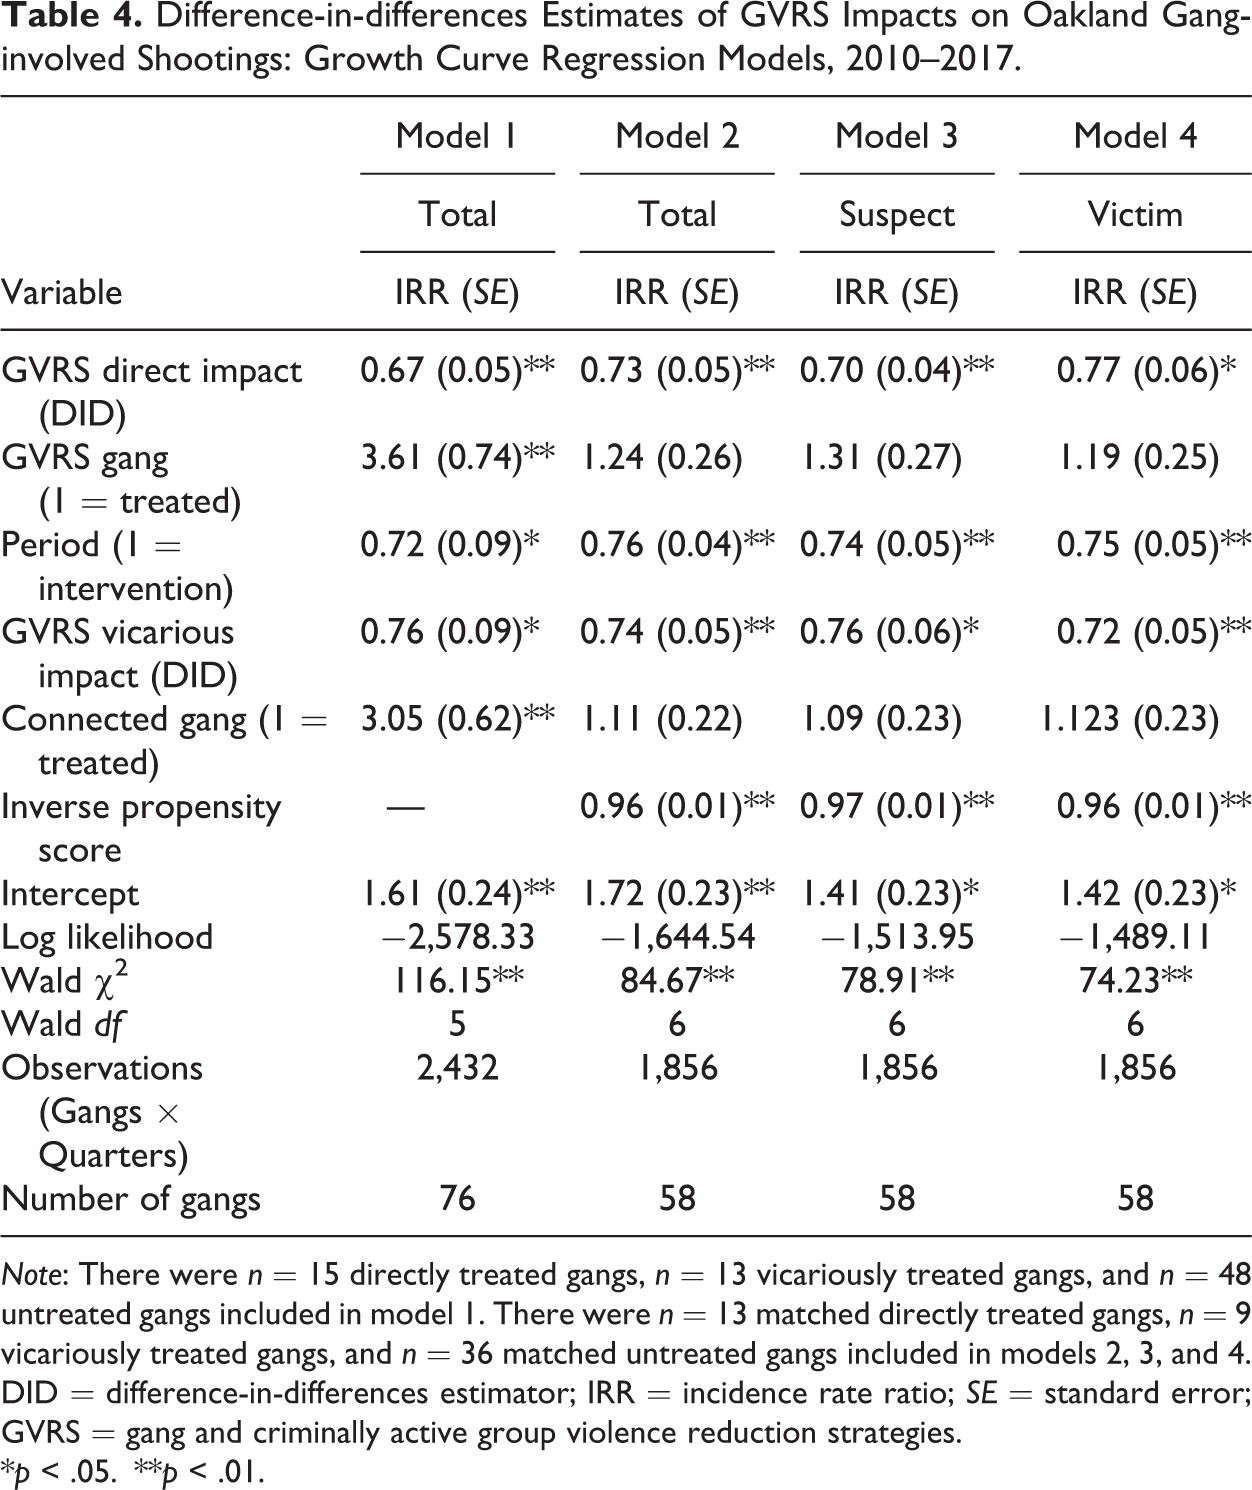
Note: There were n = 15 directly treated gangs, n = 13 vicariously treated gangs, and n = 48 untreated gangs included in model 1. There were n = 13 matched directly treated gangs, n = 9 vicariously treated gangs, and n = 36 matched untreated gangs included in models 2, 3, and 4. DID = difference-in-differences estimator; IRR = incidence rate ratio; SE = standard error; GVRS = gang and criminally active group violence reduction strategies.
*p < .05.
**p < .01.
The results of the growth curve regression models estimating the impacts of the GVRS on gun violence outcomes for matched directly treated and vicariously treated gangs relative to gun violence outcomes for matched untreated gangs are also reported in Table 4. 22 The direct impact DID estimators revealed that the GVRS intervention was associated with a statistically significant 26 percent reduction (p < .01, model 2) in quarterly total gang-involved shootings and a statistically significant 30 percent reduction (p < .01, model 3) in quarterly suspect gang-involved shootings for the matched directly treated gangs relative to the matched comparison gangs, holding the other predictor variables constant. The GVRS intervention was also associated with a 23 percent reduction in quarterly shooting victimizations for the matched directly treated gangs when compared to the matched untreated gangs (p < .05, model 4). For all four models, the postintervention covariates revealed statistically significant reductions in gang-involved shootings controlling for the other covariates. This suggests that gang shootings in Oakland were generally declining during the postintervention period beyond any focused GVRS intervention.
The indirect impact DID estimators also revealed that the GVRS focused deterrence program was associated with a statistically significant 26 percent reduction in quarterly total gang-involved shootings (p < .01, model 2), a 24 percent reduction in quarterly suspect gang-involved shootings (p < .05, model 3), and a 28 percent reduction in quarterly victim gang-involved shootings (p < .01, model 4) for the matched vicariously treated gangs relative to the matched comparison gangs. As confirmed by the nonstatistically significant GVRS dummy variables in models 2, 3, and 4, the matched groups were comparable on the three gang-involved gun violence outcome measures. What is more, Oakland gangs associated with higher levels of gun violence were included in the matched quasi-experimental analysis as suggested by the significant negative associations between the inverse-weighted propensity score values and the three gang-involved shooting outcome variables (p < .01).
Conclusion
These results confirm that GVRS strategies can be effective in reducing gang violence in very challenging urban environments such as Oakland, a city that has long suffered tragically high homicide rates. The Oakland Ceasefire GVRS generated statistically significant direct reductions in shootings in treated block group areas and by treated gangs relative to shootings in untreated block group areas and by untreated gangs, respectively. The place- and group-based analyses of deterrent spillover effects yielded complementary results that diverged in magnitude and significance. The census block groups immediately surrounding treated block groups experienced a nonsignificant reduction in shootings relative to census block groups immediately surrounding untreated block groups. Vicariously treated gangs that were socially connected to treated gangs through rivalries and alliances experienced a statistically significant reduction in shootings relative to untreated comparison gangs.
We suspect that these divergent magnitudes in spillover impacts may be linked to the varying dosage strength of the deterrence intervention as applied to the differing units of analysis. That is, untreated gangs that are connected to gangs directly experiencing intense enforcement attention are more likely to notice the elevated scrutiny by virtue of the social connection and the supporting message warning them against shooting rivals. But, adjacent areas are likely to contain a mix of socially connected gangs, not socially connected gangs, and other nongang gun offenders. This mix of potential shooters within geographic areas may have varying levels of knowledge regarding surrounding areas and, as such, may have very different perceptions of the risks associated with perpetrating gun violence. In essence, gang networks are a smaller part of much larger neighborhood networks of violence (Papachristos, Hureau, and Braga 2013). As such, there are other conflicts and networks in target and surrounding geographic areas that are outside the conflict networks targeted by GRVS.
Future studies should move away from using aggregate place-based units of analysis when evaluating the impacts of GVRS strategies on treated gangs and the individuals who comprise these groups. In this study, place-based analyses estimated smaller direct treatment impacts and would not have detected the statistically significant diffusion of crime control benefits to the census block groups adjacent to directly treated block groups. While useful in establishing broad effects of focused deterrence, aggregate place-based analyses are neither well positioned to measure specific behavioral changes after treatment nor to shed light on the crime control mechanisms driving any observed behavior modifications. The existing evaluation literature is already convincing in establishing the broad positive impacts of focused deterrence on crime (Weisburd and Majmundar 2018). The most pressing research needs are in realm of increased theory-driven program evaluations rather than continued black box evaluations.
The next generation of focused deterrence program evaluations needs to be explicitly designed to continue distinguishing the specific effects generated by the varied crime control mechanisms applied in these strategies by associating specific program activities with behavioral changes by treated groups and the individuals who comprise them. Crime prevention scholars have suggested that other crime control mechanisms may be at work in focused deterrence strategies, including community mobilization, procedural justice, and situation prevention (Braga 2012; Brunson 2015; Corsaro and Engel 2015). It is plausible that the same treatment applied to targeted gangs might impact different individuals within a gang in varying ways. An analysis comparing posttreatment patterns of gunshot victimization of individuals who received various parts of a focused deterrence program—the call-in, enforcement action, and/or social services—would be very useful in determining “dosage” effects and associating particular crime control mechanisms with those outcomes.
Our group-based evaluation findings suggest that deterrence rather than incapacitation serves as the primary crime control mechanism in GVRS focused deterrence programs. It remains possible that the incapacitation of a nontrivial proportion of targeted gang members could also reduce shootings by rival gangs through the removal of potential rivals and/or initiators of violent conflicts. Future focused deterrence evaluations should consider applying individual-level social network analyses to determine the possible existence of these more-refined incapacitation effects. Nevertheless, jurisdictions interested in implementing GVRS programs to address gang violence problems should ensure that an effective deterrence program, supported by direct outreach, is established rather than rely solely on the arrest and prosecution of gang members. Maximizing community engagement and procedural justice components of GVRS program could be particularly important in Oakland and other cities with historically poor police–community relations. While further research is necessary to understand how these other crime control orientations are best integrated into a deterrence schema, such mechanisms could help to reduce the unintended harms associated with excessive arrest and prosecution strategies in disadvantaged minority neighborhoods (Braga 2016). Theory-driven programs evaluation will be critical in making these important refinements to focused deterrence program policy and practice.
Footnotes
Declaration of Conflicting Interests
The author(s) declared no potential conflicts of interest with respect to the research, authorship, and/or publication of this article.
Funding
The author(s) disclosed receipt of the following financial support for the research, authorship, and/or publication of this article: This study is funded by City of Oakland (Resolution No. 86312).