



Abstract
This study explored the effects of a web-based decision support system (Tutorial) for writing standards-based Individualized Education Programs (IEPs). A total of 35 teachers and 154 students participated across two academic years. Participants were assigned to one of three intervention groups based on level of Tutorial access: Full, Partial, or Comparison. Direct effects of the intervention on procedural and substantive elements of IEPs revealed that, although all groups had initial IEPs of similar quality, the Full Intervention group’s post-Tutorial IEPs had a significantly higher proportion of substantive items rated as adequate than did the IEPs of other groups. The intervention’s indirect effects were examined using student scores on the State Reading Assessment. The Full Intervention group demonstrated a higher rate of reading score gain than the other two groups during the academic year in which the IEP prepared with access to the Tutorial was implemented. Implications for educational practices and future research directions are discussed.
For over three decades, the Individualized Education Program (IEP) process and document have been the cornerstones of special education programs and services for students with disabilities under the Individuals With Disabilities Education Act (IDEA). In the current standards-based educational environment, IEP teams are faced with the dual-purpose task of (a) meeting the group-oriented, standards-referenced requirements of No Child Left Behind Act (NCLB) and (b) providing a free appropriate individualized education for students with disabilities(Shriner & DeStefano, 2007). Researchers have delineated the conditions under which IEPs are likely to benefit students with disabilities in this environment, including (a) increased collaboration of general and special educators in goal construction (McLaughlin, Nolet, Rhim, & Henderson, 1999) and (b) communication and actions to support high expectations for student achievement in IEPs aligned with standards (Thompson, Thurlow, Quenemoen, Esler, & Whetstone, 2001).
The construction of IEPs that are standards-based has been noted as an ongoing challenge to the field. Most IEPs continue to suffer from a lack of quality, especially in the degree to which they articulate best practices to meet individual needs (Espin, Deno, & Albayrak-Kaymak, 1998; Huefner, 2000; Yell, Shriner, & Katsiyannis, 2006). Furthermore, educators sometimes equate having “more” of the standards in annual IEP goals with “better” instruction and curricular access (Ahearn, 2006; Browder, Karvonen, Davis, Fallin, & Courtade-Little, 2005), which is a fallacy.
Procedural and Substantive Requirements of IEPs
The requirements that form the framework for IEP development are both procedural and substantive (Bateman & Linden, 2006; Drasgow, Yell, & Robinson, 2001). Procedural requirements are those directives that compel schools to follow the strictures of the law when developing an IEP; they exist to assure that a child’s right to a Free Appropriate Public Education (FAPE) is not impeded. Procedural requirements, while important, are becoming secondary to substantive requirements, which should result in meaningful educational benefit (Yell, 2012). Although the law does not include a list of these substantive elements, dispute resolutions and case law identify multiple substantive errors in IEP development. IEP teams often have the most difficulty with substantive requirements for (a) developing annual, measurable goals and (b) assuring that students’ progress can be monitored through well-articulated goals and objectives (Bateman & Linden, 2006; Christle & Yell, 2010; Yell et al., 2008). In addition, failure to individualize the IEP to meet a student’s unique needs by relying on stock generation of IEPs and annual goals has been a longstanding substantive problem (Bateman & Linden, 2006; Christle & Yell, 2010; Shriner & Smith, 2001; Smith, 1990; Smith & Kortering, 1996).
Researchers examining substantive IEP quality have concluded that most IEPs fall short in terms of quality and utility (e.g., Espin et al., 1998; Etscheidt, 2006; Hunt & Farron-Davis, 1992; Thompson et al., 2001). Recent research has found that the majority of annual goals were not measurable or lacked measurement criteria entirely, objectives did not relate to their corresponding goals, and there was little or no connection to the state academic expectations (Boavida, Aguiar, McWilliam, & Pimentel, 2010; Ruble, McGrew, Dalrymple, & Jung, 2010). Although not addressing standards-based IEPs directly, Pretti-Frontczak and Bricker (2000) provided specific training components for IEP team members focusing on early childhood goals and objectives and found that the focused training resulted in statistically significant improvement for all indicators related to goal construction and more than 90% of indicators for objectives.
The federally funded IEP Quality Project (Shriner, Trach, & Yell, 2006) focused on developing a web-based tutorial to support IEP team decision making on general curricular access for academic content and goal prioritization in relation to standards.
We developed the IEP Quality Tutorial, a web-based decision-making support system, with tools and content based on research of best practices for providing meaningful access to the general curriculum. The Tutorial’s conceptual model focuses on improving the overall quality of the IEP document and builds on the foundational work of other researchers (e.g., Bateman & Linden, 2006; Holbrook, 2007; Lignugaris-Kraft, Marchand-Martella, Martella, 2001; Smith, 1990). Decision supports for Tutorial users emphasize data-driven decisions and prioritization and individualization of instructional choices within a standards-based environment. Recognizing that standards are not all equally important, the IEP Tutorial incorporates decision supports for general curriculum prioritization (e.g., Ainsworth, 2003) to target areas for which annual goals will be needed and thus where to invest available instructional minutes.
The Tutorial includes the following components:(a) Help Topics that offer evidenced-based information, guidance, and examples for nearly every area of the IEP; (b) Toolbox Resources that include downloadable reference charts and planning sheets for educators, students, and parents to use in IEP Development and that encourage communication among IEP team members both before and during the IEP writing process; (c) Goal Assistants (Academic, Functional, and Transition) that help IEP teams with decisions about how to best prioritize State Learning and Social/Emotional Standards for an individual student based on his or her needs and supports the writing process for annual, measurable goals and short-term objectives that contain conditions, observable and measurable behaviors, and criteria for mastery; (d) Case Student Scenarios for four fictionalized students with diverse learning and behavioral needs and illustrations of all components of a high-quality IEP for each student; and (e) a Resource Library with evidence based, best practice references to books, journals, and websites that could assist teams during IEP development, as well as a library of forms that can be used to collect and track data on student behaviors.
The present study focuses on the impact of the resources (e.g., Goal Assistants) that support the construction of goals and objectives based on students’ prioritized needs for specially designed instruction of academic skills. We were interested in the effects of teachers’ access to the Tutorial on substantive elements of the IEP and of teachers’ use of the IEPs crafted with the Tutorial on student academic outcomes. Specific research questions were the following:
Research Question 1: To what extent do differing levels of access to, and use of, a web-based Tutorial and decision-making tool improve the quality of IEPs with respect to annual, measurable goals and short-term objectives that are standards based?
Research Question 2: What is the indirect effect of the IEP development/implementation link on student outcomes?
Method
Participants
Special education teachers in a midwestern state who had primary responsibility for IEP preparation and implementation served as participants. Districts and schools were representative of the geographic and socioeconomic characteristics of the state, with urban, suburban, and rural schools included in the study. Initial contacts with district administrators were made to obtain permission to contact teachers directly. After reviewing a recruitment letter containing an overview of the Tutorial intervention and criteria for participation, teachers could volunteer to be participants if they were responsible for the instruction of students who (a) were enrolled in Grades 2 through 8 at the outset of the study to ensure that they would be taking the general state assessment, (b) had not made adequate yearly progress in reading, and (c) were current students for whom the teacher would be implementing the IEP in the following school year. The first two criteria were used because the intervention under development focuses on improving IEPs that are in place for students with primary academic challenges. The final criterion was in place to allow for “same teacher–same student” examination of student outcomes in the year of IEP implementation. As a result of these procedures, 35 teachers from eight schools in a midwestern state served as participants. All teachers (31 females, 4 males; 92% White, 8% African American) were certified in special education and taught students in Grades 3 through 8. Years of teaching experience ranged from 2 to 31 (M = 12.70, SD = 9.16), and all teachers taught reading, English/language arts, and mathematics. Student demographics are shown in Table 1. Of these students (63% female, 37% male), most had a primary service category of learning disability (60%), were White (58%), and were in Grades 3 through 8 (95%). Since students were followed for two school years, the mean age of the pre-Tutorial group was 11 years 8 months, and the mean age of the post-Tutorial group was 12 years8 months.
Percentages of Students by Demographic Categories.
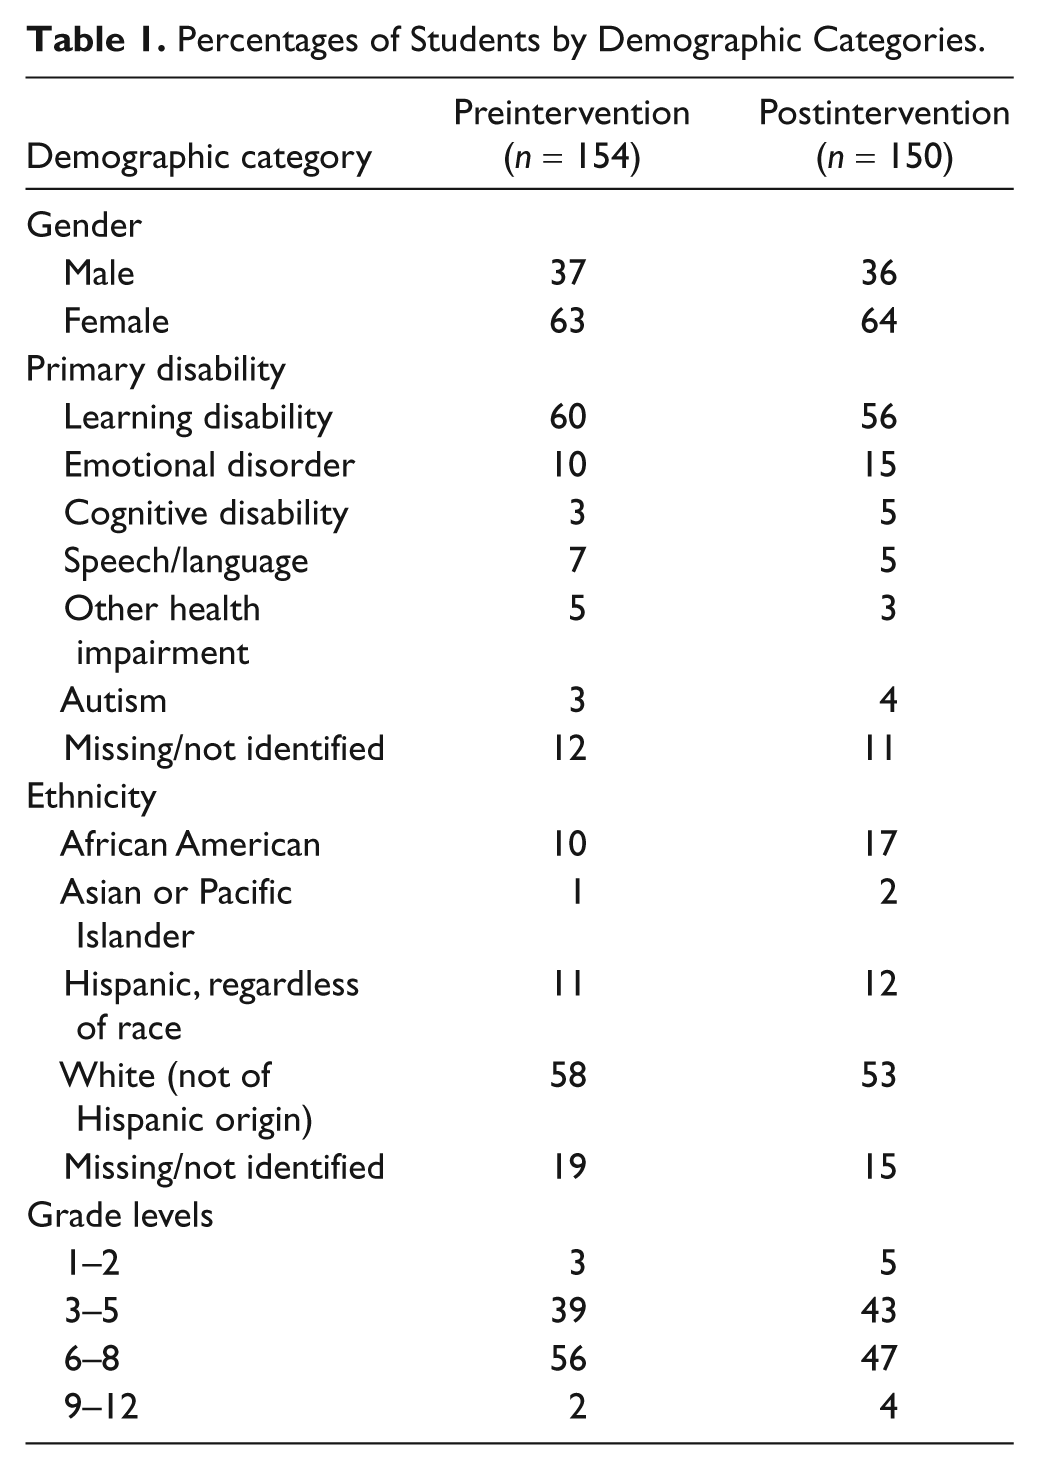
For analyses of IEP quality, teachers provided from three to six IEPs (M = 4.43, SD = 1.92) before and after use of the Tutorial. When student–teacher pairs were not maintained due to student mobility and caseload changes (especially at the middle school level), teachers were asked to substitute IEPs for students similar to the original student. Overall, a 72% same teacher–same student match across years was maintained. These changes accounted for the slightly differing numbers of pre–post IEPs that were used for comparisons of teachers’ change in constructing standards-based IEPs.
Implementation fidelity data suitable for technology adoption evaluations (see Mills & Ragan, 2000) were used post hoc to classify participants as members of Tutorial usage groups. Three raters independently coded (a) individual usage data extracted from user logs and (b) specific user feedback from the postintervention survey. Unanimous agreement of teacher assignment to groups was reached after one coding on all but two participants. These two were assigned to groups after a discussion among the raters. The two intervention groups were (a) Partial Intervention Use (n = 12; M years experience = 9.42,SD = 5.35; all female; these teachers provided 65 pre-Tutorial and 61 post-Tutorial IEPs) and (b) Full Intervention Use (n = 13; M years experience = 18.94, SD = 9.98;12 female, 1 male; these teachers provided 66 pre-Tutorial and 60 post-Tutorial IEPs). These two teacher groups were trained on Tutorial features at the beginning of the study and had access to the website and the Tutorial intervention. After training, Partial Intervention teachers accessed the Tutorial only sporadically and did not make use of most of the available tools and resources; Full Intervention teachers accessed the Tutorial routinely and frequently, and used most of the Tutorial components. The Comparison group teachers (n = 10; M years experience = 8.5, SD = 7.60;7 female, 3 male), with no access to the Tutorial intervention, supplied IEPs (38 pre Tutorial; 34 post Tutorial) for students meeting the same criteria.
Procedures
In early 2009, project staff provided on-site trainings (3 hr) on the use of the Tutorial. All participants were supplied with a Tutorial training manual with step-by-step guidance through the Tutorial process and content use, and access to email and phone numbers that allowed them to ask questions and communicate with project staff during and after training. Teachers were sent periodic emails with Tutorial updates and guidance toward high-priority Tutorial content. All users accessed the Tutorial within 10 days of training and accessed it to varying degrees throughout the remainder of the school year, during which all IEP documents were completed. Elapsed time between training and writing of individual student IEPs varied widely. Final login dates for users from the Partial Intervention and Full Intervention groups were similar (within 1 week), indicating that the time period of use did not vary by group.
Measures
Research-specific scales
The IEP Quality Indicator Scale for Goals/Objectives (IQUIS–Goals/Objectives; Yell et al., 2008) was developed for this project. The scale focuses on the impact of the Tutorial on improvement in writing annual goals and objectives. No other scale was found that would evaluate evidence of the use of best practice (substantive) statements for goal and objective construction. IQUIS–Goals/Objectives has 12 items, each corresponding to a quality (substantive) indicator (see first column of Table 2) and allows for each goal or objective statement to be scored individually. Each item is scored “1” if the statement meets requirements and “0” if the statement fails requirements. Validation for the IQUIS–Goals/Objectives consists of (a) review of existing literature and scales for IEP evaluation (see Yell et al., 2008) and (b) content analysis by a panel of national consultants with expertise in IEP development. Expert panelists provided two rounds of feedback and recommendations for scale revision and item scoring criteria. Interrater agreement and kappa statistics were calculated for a set of criterion IEPs to establish initial reliability thresholds. A randomly selected sample of 20% of IEPs (pre- and post Tutorial) was scored by trained graduate students; final agreement was in the substantial range for both goals (agreement = .98; κ = .96) and objectives (agreement = .94; κ = .81).
Pre–Post Tutorial Within-Group Comparisons of Proportions of Items Rated as Adequate Using IEP Quality Indicator Scale for Goals/Objectives.
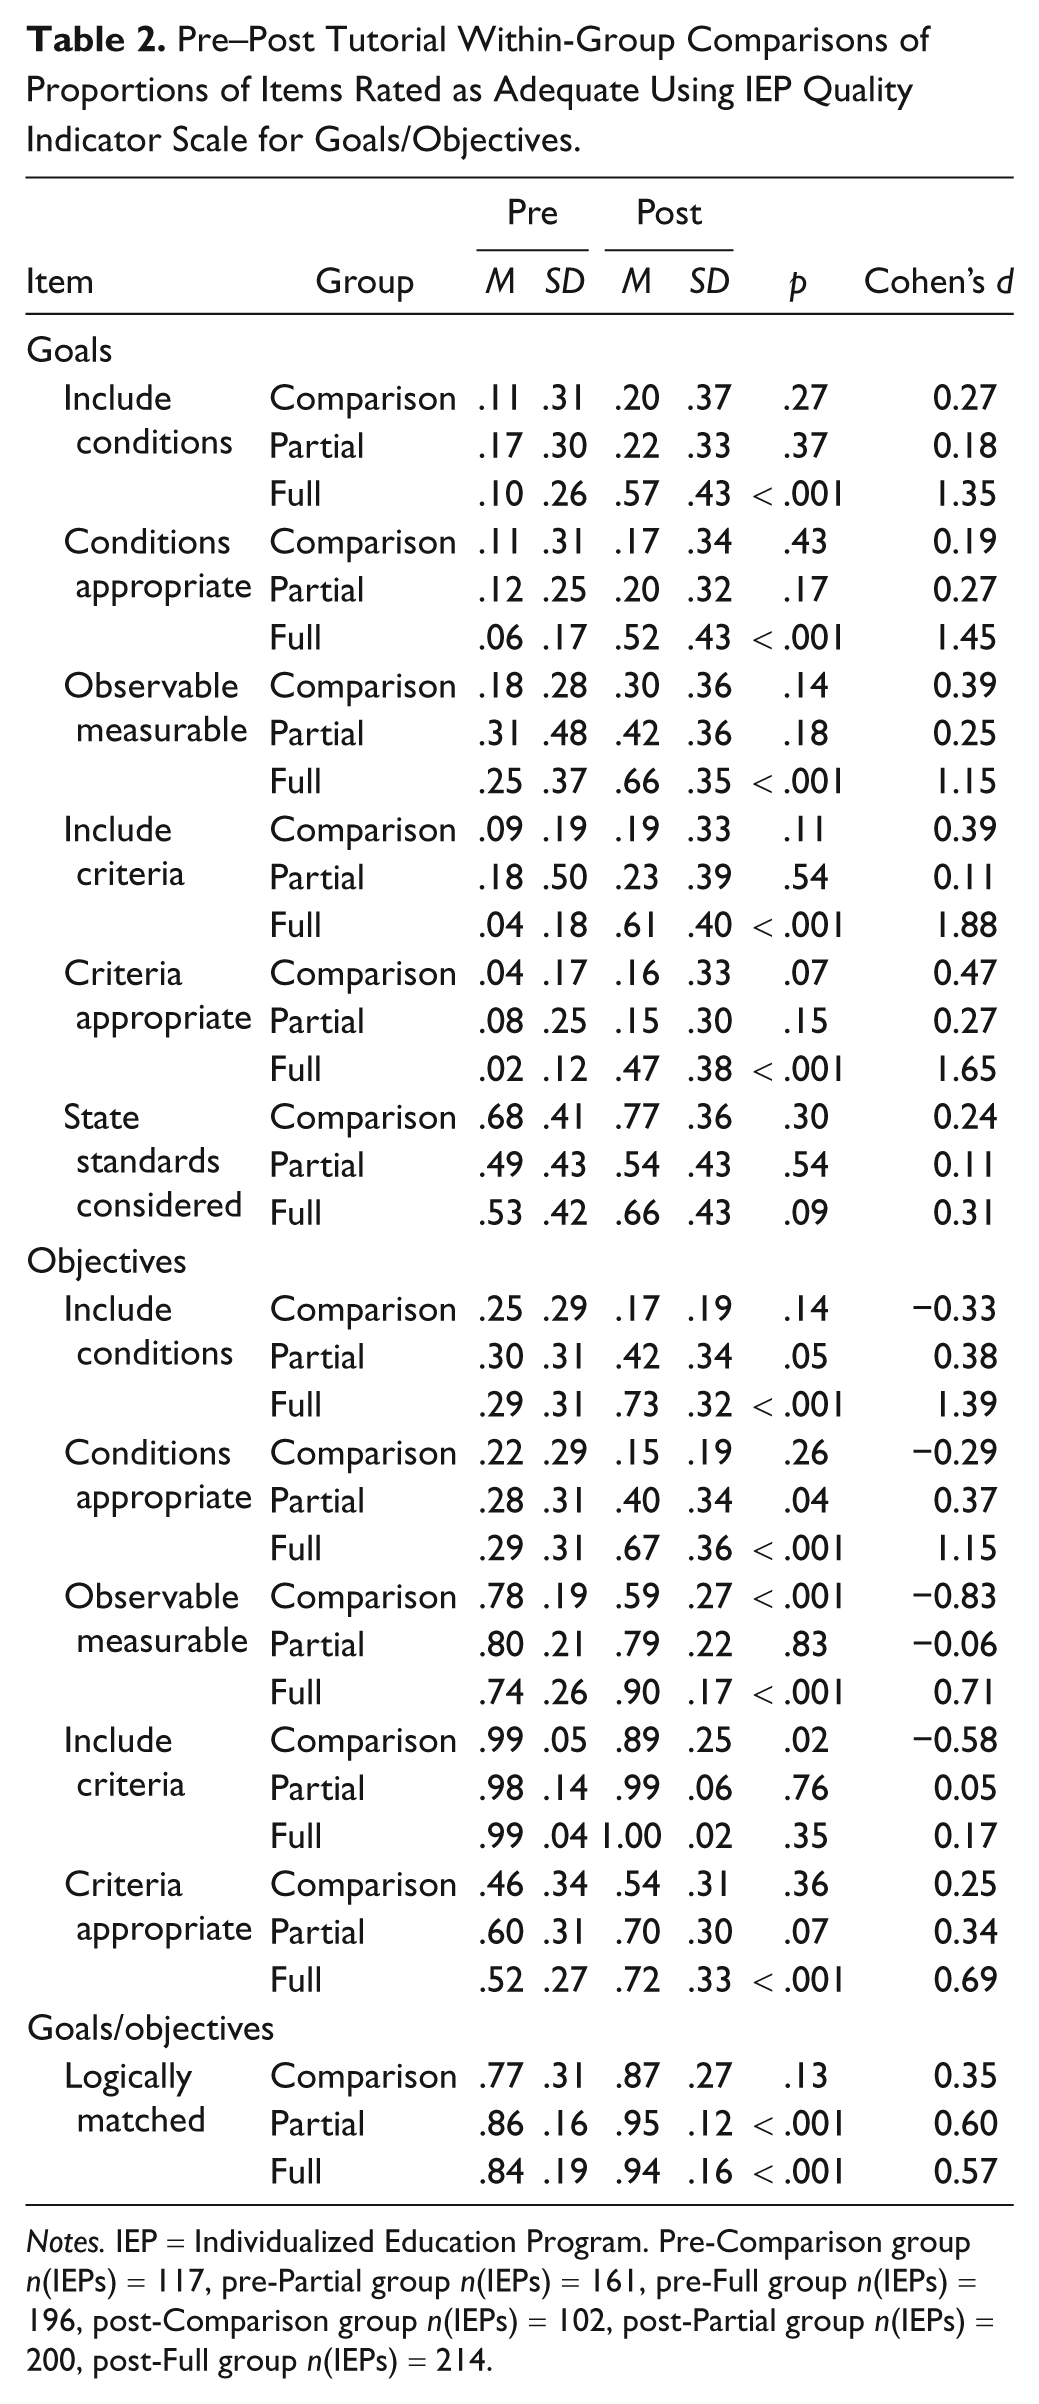
Notes. IEP = Individualized Education Program. Pre-Comparison group n(IEPs) = 117, pre-Partial group n(IEPs) = 161, pre-Full group n(IEPs) = 196, post-Comparison group n(IEPs) = 102, post-Partial group n(IEPs) = 200, post-Full group n(IEPs) = 214.
State reading assessment
Scores on the State Reading Assessment based on state academic content standards were used as an indicator of indirect effects of the Tutorial. The assessment has a vertical scale that allows comparisons for both groups and individual students from one grade to the next. All grade-level tests have reliability values above .90. To address variability in standard deviations typical of state assessments from grade to grade, the state supplied observed and anticipated score gains to help describe differing grade-to-grade expectations (cf. Kolen & Brennan, 2004). Across the grades in this study, the typical grade-to-grade growth on the State Reading Assessment was 11.89 scale score points.
Data Analysis
IEP quality
For the 154 pre-Tutorial IEPs, 464 goals were scored using the IQUIS–Goals/Objectives (Comparison: n = 117, M = 3.28, SD = 1.41; Partial: n = 161, M = 2.93, SD = 1.42; Full: n = 196, M = 2.97, SD = 1.39), with more than 93% written for academic content areas of reading, English/language arts, and mathematics, and the rest in related areas such as study skills and learning strategies. For the 150 post-Tutorial IEPs, 516 goals were scored (Comparison: n = 102, M = 2.91, SD = 1.27; Partial: n = 200, M = 3.28, SD = 1.29; Full: n = 214, M = 3.52, SD = 2.35), with 91% written for academic content areas. We used a MANOVA model as an overall test followed by univariate analyses consistent within the overall model to determine whether statistical significance among groups existed. For the multiple post hoc comparisons (groups by items), a conservative approach (i.e., Bonferroni with adjusted α = .001) was used. Finally, effect sizes were calculated to examine the magnitude of the treatment effect.
Student outcomes
A two-level latent growth curve model (Duncan, 2006) was used to evaluate student outcomes, including only students (n = 100) with a reading test score at each point in time, and for whom the IEP documentation indicated a teacher–student match across academic years (i.e., pre–post intervention). The data on students’ scores at each time point (2008, 2009, 2010) had a hierarchical structure; the students’ scores at each point in time for the State Reading Assessment (Level 1) were nested within each student (Level 2), and students were nested within teachers at Time 1 (Level 3). To determine the impact of this nesting on the data, we calculated intraclass correlation coefficients (ICC). Our ICC values suggested that there was a fair amount of clustering at the student level (ρ = .39) but limited clustering at the teacher level (ρ = .05). Based on these ICCs, we constructed a two-level latent growth curve model using SAS PROC MIXED.
Results
Tables 2 and 3 show the individual item statistics with significance levels and effect sizes noted for the within-group pre–post Tutorial changes and for pairwise group comparisons of the post-Tutorial item data. An initial MANOVA across items yielded significant effects for Treatment Group, Wilks’s Lambda = .74, F(24, 600) = 4.133, p < .001,
Post-Tutorial Between-Group Comparisons of Differences of Proportions of Items Rated as Adequate.
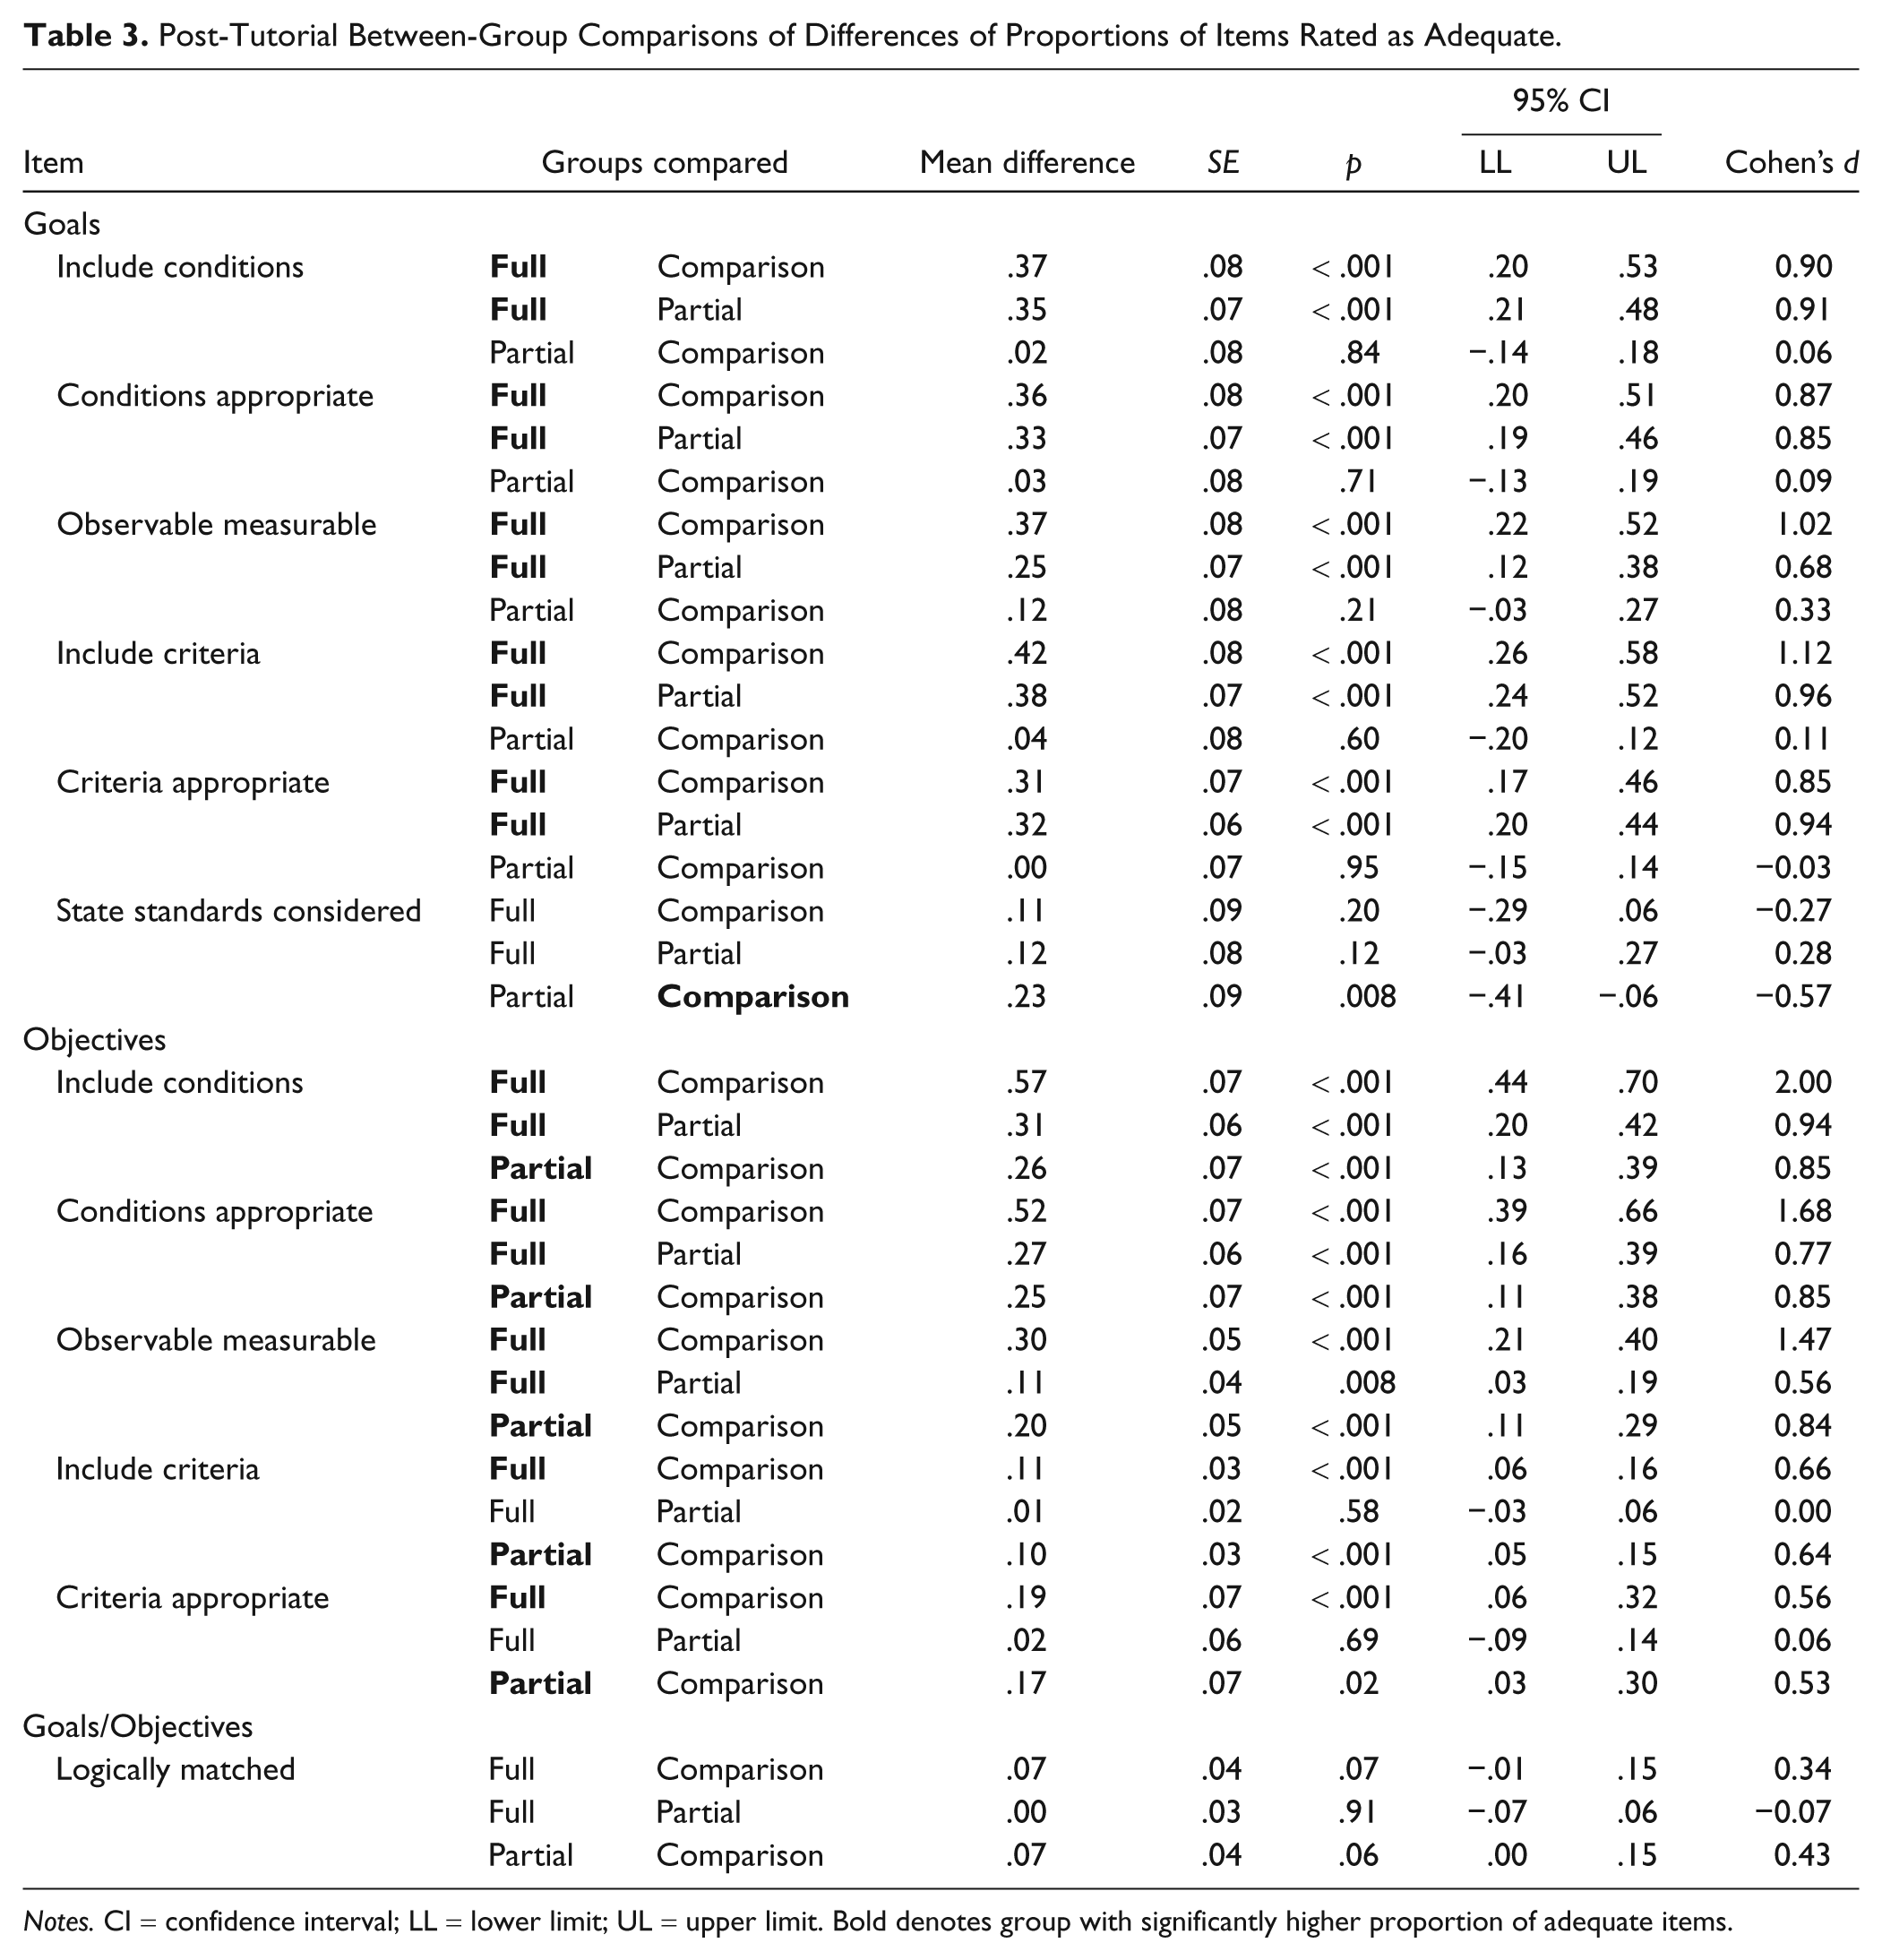
Notes. CI = confidence interval; LL = lower limit; UL = upper limit. Bold denotes group with significantly higher proportion of adequate items.
Within-Group Effects
The percentages of each substantive item rated as adequate on the IQUIS–Goals/Objectives are shown for within-group comparisons in Table 2. The pre-Tutorial data for each of the three groups show that, most often, fewer than 20% of the items (range = 2%–68%) for goals were judged as adequate. The exception was the item “standards were referenced for each goal,” for which most of the goals were found to be adequate. Although some positive changes in the ratings were noted post Tutorial for each group, significant, within-group change was limited to the Full Intervention group for items related to goals, while this same group was found to have very low ratings on most items at the study outset. Post-Tutorial improvements in ratings were indicative of positive change on five of six items. Percentage point gains ranged from 13% (standards were referenced) to 57% (goal includes criterion for acceptable performance) across goals items. The observed effect sizes for the Full Intervention group generally indicated that more than one standard deviation separated the pre–post Tutorial means.
Across all groups, items for objectives were rated as adequate more frequently than items for goals. For example, before use of the Tutorial, ratings of the measurability of behaviors found in annual goal statements (about 25% of all goals) were lower than the complementary ratings of behaviors found in short-term objectives (about 77% of all objectives). Tutorial influence on the quality of objectives was more variable with some postintervention item ratings of quality actually declining. The results indicated positive changes for the Full Intervention group on five of six items for objectives. The significant negative change for the Comparison group for the item “objective is stated in observable, measurable terms” shows a drop of almost 20 percentage points from pre–post Tutorial. This group also dropped by 10 percentage points on the item “objective includes a criterion.”
Between-Group Effects
Examination of the between-group pairwise comparisons revealed that there were no significant differences between intervention groups for pre-Tutorial IEP quality on the IQUIS–Goals/Objectives scale items. Table 3 shows the post-Tutorial comparisons of the percentages of items rated as adequate. The IEPs of the Full Intervention group were found to have a significantly higher percentage of items rated as adequate for five of the six substantive (quality) item ratings for annual goals compared with those from both the Comparison and Partial Intervention Use groups. Looking specifically at the Full versus Partial group comparisons, the mean differences of percentages for the five items of significance ranged from 25% (goal has observable, measurable behavior) to 42% (goal include a criterion). The observed effect sizes for both the Full versus Comparison group contrast and the Full versus Partial group contrast generally indicated that slightly less than one standard deviation separated the respective post-Tutorial means, favoring the Full Intervention group. No post-Tutorial differences between the Comparison and Partial Intervention groups were noted for annual goals.
Pairwise comparisons for post-Tutorial item data related to the quality of short-term objectives also favored the Full Intervention and Partial Intervention groups over the Comparison group. Partial Intervention/Comparison group contrasts on five of the six items for short-term objectives were significant, with differences in the percentages of items rated as adequate ranging from 10% (objective includes a criterion) to 26% (objective includes a condition). For both items related to the conditions statement within an objective, and for the item for inclusion of an observable, measurable behavior, the separation of the mean differences in percentages of items rated as adequate for the Full Intervention/Comparison group contrasts were large enough to yield effect sizes on the order of 1.5 or more standard deviations.
Student Outcomes
The latent growth curve model considered that students’ state reading scores at each point (Level 1) were nested within student (Level 2). Thus, for the comparisons of interest, the ICC suggested significant clustering for mean test scores at each point (intercept; ρ = .93) and that a fair degree of clustering existed for the gain score change(ρ = .17). For the overall model, there was a significant fixed effect for time of IEP, F(2, 196) = 302.81, p < .001, treatment group, F(1, 96) = 11.86, p < .001, and time of IEP by treatment group, F(2, 196) = 70.37, p < .001. Parameter estimates are included in Table 4, and plots of group data are displayed in Figure 1. Follow-up tests were run to decompose these differences.
Parameter Estimates From Overall Model for State Reading Assessment Scores.
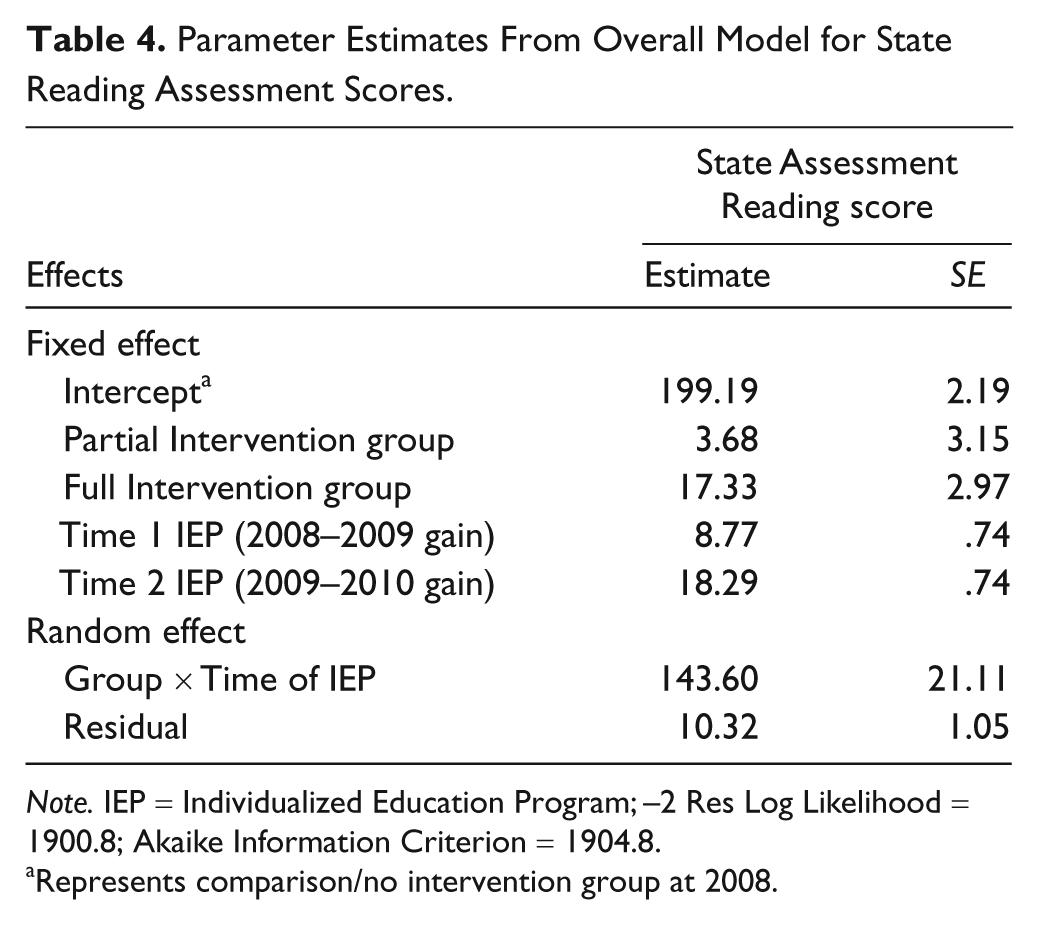
Note. IEP = Individualized Education Program; –2 Res Log Likelihood = 1900.8; Akaike Information Criterion = 1904.8.
Represents comparison/no intervention group at 2008.
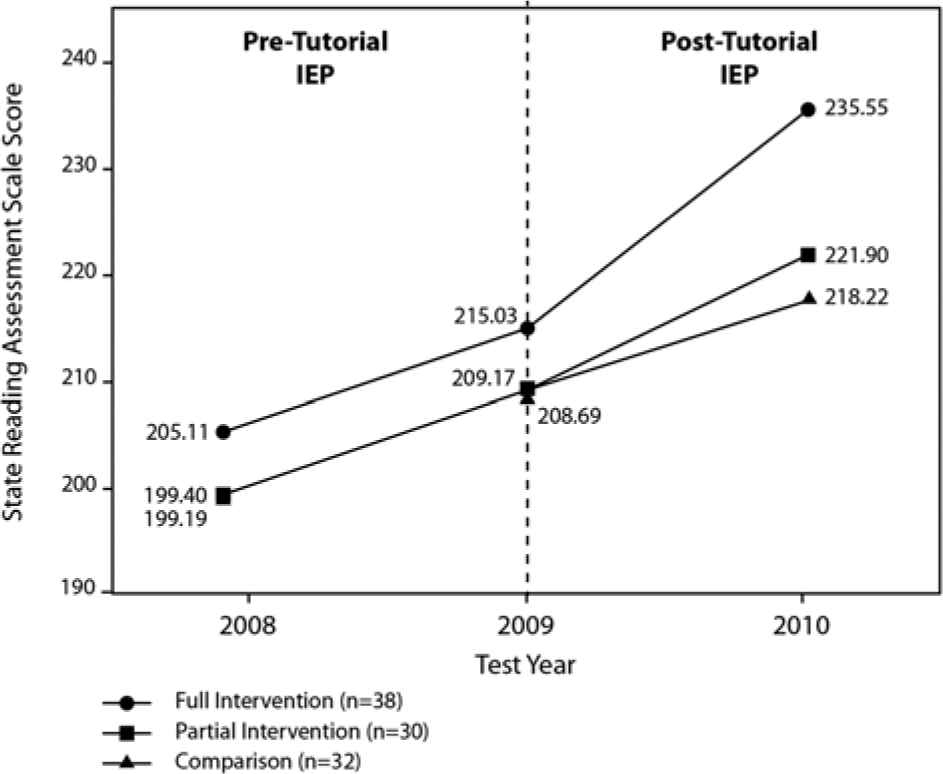
Mean State Assessment Reading scale scores for students by teacher groups. Left side of graph corresponds to gain in scale score points for the academic year in which pre-Tutorial IEP was implemented. Right side of graph corresponds to gain in scale score points for the academic year in which post-Tutorial IEP was implemented.
For the overall between-group effect, individual contrasts of mean scale scores showed the only significant difference to be between the Full Intervention group and the Comparison group means (p = .048) prior to the Tutorial. Thus, although students of teachers in the Full Intervention group had slightly higher reading scores than both the Partial Intervention (5.7 points) and Comparison (5.9 points) groups at the outset of the study, only the Full/Comparison contrast was statistically significant. Paired contrasts of the post-Tutorial reading scores indicated significant differences between Full Intervention and Comparison groups (p < .001) and between Full Intervention and Partial Intervention groups (p < .001). The finding of no significant differences between Partial Intervention and Comparison is important because it was found across all 3 years. Finally, although no mean scale score differences between the two groups existed during the pre-Tutorial period, the Full Intervention group had a mean score (M = 235.55, SD = 15.85) that was significantly higher than the Partial Intervention group (M = 221.90, SD = 14.33) during the post-Tutorial year.
Gain scores from pre-Tutorial to post-Tutorial also were examined as a measure of rate of change. During the pre-Tutorial academic year, students of teachers in all groups had similar rates of gain on the State Reading Assessment, suggesting comparable experiences. A significant fixed effect was observed for both within- and between-group effects. Within-group contrasts revealed significant (p < .001) increase of gains for the Full Intervention group and the Partial Intervention group for the post-Tutorial IEP year (Full: M = 20.53, SD = 5.42, p < .001, effect size [ES] = 2.05; Partial: M = 12.73, SD = 4.03, p = .012, ES = 0.52) compared with gains in the pre-Tutorial year (Full: M = 9.92, SD = 2.48; Partial: M = 9.77, SD = 4.15). The gain scores for the Comparison group were nearly identical for each academic year (pre: M = 9.50, SD = 3.03; post: M = 9.53, SD = 2.57); no significant difference (p = .97) was observed. Between-groups contrasts showed that there were no statistical differences of gain scores among groups during the pre-Tutorial period but that the differences in gain scores for all group pairings during the post-Tutorial period were significant (Full vs. Comparison, p < .001, ES = 2.58; Full vs. Partial, p < .001, ES = 1.63; Partial vs. Comparison, p < .001, ES = 0.94).
Mediating Factor Information
Pages viewed within the Tutorial and user feedback about the features and resources of the website were used to gauge direct intervention impact, as well as to inform ongoing development. These data also were used to identify Full Intervention and Partial Intervention groups. The most frequently accessed Tutorial features (in descending order) by the Full Intervention participants were Goal Assistants, Toolbox Resources (including planning forms), Help Topics, and Document Samples. Least accessed features included Links to the State Board of Education and the Glossary.
Interviews and self-reports of changes in decision making and instructional approaches were viewed as indirect gauges of Tutorial effects. Full Intervention group teachers reported the impact of the post-Tutorial IEP on their instruction as including (a) instructional planning that was better related to annual goals, (b) better ideas for monitoring of goal-related progress, and (c) for those teachers who worked with general education counterparts, increased “leverage” to emphasize the importance of IEP implementation across settings.
Discussion
This study adds to the recent literature base on issues of IEP quality focused on IEPs for younger children (e.g., Boavida, Aguiar, McWilliam, & Pimentel, 2010; Ruble et al., 2010) and those of transition age (e.g., Finn & Kohler, 2009) by involving teachers and their students in Grades 3 to 8. By gathering initial data to address Pretti-Frontczak and Bricker’s (2000) assertion that “quality goals and objectives result in more effective intervention, which, in turn, produce better child outcomes” (p. 101), the findings we report here are an incremental addition to the research base on standards-based IEPs.
We provided IEP teams with a web-based decision support (Tutorial) for creating standards-based IEPs. We examined both the direct effects of Tutorial access and use on the quality of IEPs written by study participants and the indirect effects on student outcomes of the implementation of IEPs that were prepared post-Tutorial. Despite having some of the lowest quality IEP ratings prior to the intervention, teachers in the Full Intervention group made significant, positive improvement on most quality ratings. These data suggest that, at least for this sample, teachers who (a) accessed a majority of features found in the Tutorial, (b) made consistent use of the resources provided, and (c) used the Goal Assistant tools routinely showed significant improvement on the substantive elements of the IEP goals they crafted. The observed improvement on the item for “observable, measurable behavior” within annual goals by the Full Intervention group (from 25% to 66%) is encouraging. However, there is room for improvement for goal preparation, especially with respect to the specification of (a) target behaviors that can be observed and measured and (b) criteria for performance that accurately match the target behavior, a finding consistent with prior research (e.g., Boavida et al., 2010; Yell & Drasgow, 2000). Still, the Full Intervention group fared better on this item than both the Partial Intervention or Comparison group teachers who wrote fewer than 16% of their post-Tutorial goals with an appropriate criterion-behavior match. The beneficial effects of this intervention targeted goal and objective articulation—the element of IEPs thought to be related most directly to instructional decisions in a standards-based environment (Christle & Yell, 2010; Holbrook, 2007). There is still work to be done to remediate the prevailing opinion that IEPs are generally of poor overall quality (e.g., Boavida et al., 2010).
The indirect association of improvement in the substantive elements of Full Intervention students’ standards-based IEPs and their subsequent achievement gains—compared with those of other groups and to the typical grade-to-grade gain for students statewide—is promising and among the more intriguing of these preliminary findings. The significant amount of variance accounted for by the effect of Group × Time-of-IEP represents the nesting of test scores within students and is an important consideration. The implications of this error—which is associated with the time in which an IEP is implemented for a particular student—are complex given that (a) the three scores (2008, 2009, and 2010) for each student surround two academic years of instruction and (b) there is typically a 5- to 6-month lag between the time students take the state assessment and the reporting of those assessment results. Students included in this analysis were those for whom the “IEP developer–IEP implementer” relationship across the academic years of this study was indicated on the IEP. In examining the state assessment data that were obtained for the 2010 test, however, this relationship may not have been maintained for the full academic year (i.e., implementation year) for 12 of the students of Full Intervention teachers, as a change in teacher was indicated on the test report. As a group, these 12 students scored only slightly lower on the State Reading Assessment (M = 234.1, SD = 14.43) than did the students (n = 26) for whom the relationship was preserved (M = 236.2, SD = 15.73). For now, however, we can say only that the mean reading score of students who were the “recipients” of the Tutorial-assisted IEPs as a group was higher (M = 235.55,SD = 15.85) than those of students in the Partial Intervention (M = 221.90, SD = 14.33) and Comparison (M = 218.22, SD = 9.37) groups.
Limitations
We present these data as preliminary indicators of the Tutorial’s promise as it is further developed, and readers should interpret the findings of this study with all limitations in mind. First, because we did not control the IEP instruction/outcomes progression, the number and nature of intervening (mediating) variables that may have influenced the Tutorial’s effects on teacher and student outcomes is uncertain. Although we are optimistic that the observed positive effects of the Tutorial on student outcomes are indicative of the promise of the intervention at this stage of development, this limitation requires that all outcomes—both direct (IEP quality changes) and indirect (observed achievement scores)—be interpreted judiciously.
Second, the participant intervention and comparison group composition are known limiting factors. Full Intervention and Partial Intervention group participants were assigned post hoc based on the fidelity data and criteria reported in the “Method” section. In addition, teachers in the Comparison group were from the same districts as those in the Intervention groups, which makes it is possible that teachers in the Comparison group had access to IEPs constructed by Intervention group teachers or talked about the Intervention group teachers’ involvement with the Tutorial. However, the absence of changes in Comparison group IEP quality rating or student outcomes data suggests that no contamination occurred.
On average, the teachers in the Full Intervention group had twice the number of years of experience in teaching than teachers in the Partial and Comparison groups. Although other characteristics of the study participants (e.g., geographic and demographic representativeness, variability of school settings, and programmatic offerings) were similar, the potential impact of this difference must be acknowledged. Given that the Full Intervention teachers had the lowest quality IEP ratings prior to the intervention, they did have the most “room to grow” with respect to the substantive elements of their IEPs. Multiple alternative explanations for the observed positive change may exist. For example, these teachers may have taken the intervention more seriously than other participants, as evidenced by their usage patterns and variety of resources of the Tutorial they accessed. It is possible that their years of experience may have allowed them to focus on this intervention more thoroughly than on other aspects of their teaching (e.g., classroom and instructional management). In this same regard, the extent to which the Full Intervention group was more likely to follow through with prioritized instructional goals and the manner in which they did so is not fully known. As a group, their subsequent instructional options indicated their intent to take a proactive approach; however other explanations are possible.
Third, we addressed only teacher-focused use of the Tutorial; we did not gather information about the construction, communication, or collaborative processes that the IEP encompasses. The data collection, aggregation, and analysis for teacher outcomes used the IEP as a permanent product, and we considered the data as independent at the student level, as did Boavida et al. (2008). In contrast to their findings, however, in which they expressed concern about reduced variability of their data due to a potential teacher effect, data presented here showed no such constraints of observed variance.
Finally, we examined only the content match of IEP goals/objectives with standards for this study. As opposed to other researchers interested in standards, particularly alternate achievement standards (e.g., Browder et al. 2005; Karvonen & Huynh, 2007), we did not evaluate the cognitive demand match (e.g., recall, application, etc.) of standards and goals/objectives. The decision to prioritize content over cognitive demand in this early study was based on the feedback of expert panelists and item trials in the IQUIS–Goals/Objectives scale development. In multiple instances, seemingly well-matched goals and standards revealed very little about the substantive value of the annual goal itself. For example, both a standard and a goal in mathematics may match in terms of cognitive demand because they state that the student should “apply” a principle. The specific expectation, however, is still unclear, as it is unknown what observable, measurable behavior must be demonstrated for the student to achieve the standard or meet the goal. Thus, for this initial effort, we chose to emphasize the content and replicability of the goals and objectives, as did the authors of recent studies for different populations such as children with autism (e.g., Ruble et al., 2010) and preschoolers (e.g., Boavida et al., 2010).
Future Research and Conclusion
In its current iteration, the Tutorial intervention supports IEP teams in the use of multiple data elements to guide the specially designed instructional priorities documented in the IEP. Future research and development efforts must include (a) needed content changes to address IEP development in the context of the Common Core State Standards (CCSS), (b) identification of user patterns indicative of intervention fidelity, and (c) closer inspection of possible mediating factors, with specific attention on the extent to which the Tutorial-supported IEP is operationalized and its impact on instructional decisions and student performance. The present version of the Tutorial and its decision supports were designed with the benefit of the state’s established academic learning standards (first published in 1997), their accompanying benchmarks for student learning, and the assessment paradigm in operation. By contrast, the CCSS were published in 2010, and little guidance or experience for their use exists. The implication for next steps in this research is to evaluate both the guidance included for IEP teams to consider in prioritization of important learning goals and the actual content delivery of the next Tutorial.
The very nature of the Tutorial intervention as a web-based resource that is accessible to users on demand is both a strength and a threat to fidelity measures. On the positive side, the intervention content and proper training in the use of the intervention can be highly controlled. Also, because an “interventionist” is not required, variance in how the intervention is delivered is eliminated. However, the exact “amount” of the intervention received is determined by the participant, rather than the interventionist, and the usefulness of in-person observations of participant use of the intervention is minimized. Both factors are potential fidelity threats (Eaton, Doorenbos, Schmitz, Carpenter, & McGregor, 2011). Although it is neither feasible nor desirable for each user to be observed during each use of a web-based intervention, the technology available to quantify patterns of use by participants has improved greatly since this research was initiated. As a proxy for such measures, future investigations might use data collection strategies such as Google Analytics© and Drupal modules to yield user data that may help differentiate impact by an individual participant’s pattern of use.
Future research on the impact on instructional decisions and student performance as a function of the IEP’s implementation can be augmented by incorporating routine teacher process measures (e.g., classroom practice surveys/reports) and student-specific progress measures of high-priority annual goals. The use of both measures that are closely aligned with the specific target behavior and that are indicative of generalized performance can illuminate the range of indirect intervention effects (Gersten et al., 2005).
The IEP as a process and document endures as the focus of special education services for all students with disabilities. Since the original Education for All Handicapped Children Act (1975) was passed, the field has seen numerous standards and reform initiatives, with many stemming from the perceived need to change the educational system.Currently, adoption of the CCSS for mathematics and English/language arts (CCSS Initiative [CCSSI], 2010) by 44 states is a driving force for most standards-based efforts. Yet this initiative, as have others before, includes a cautionary statement: “It is beyond the scope of the Standards to define how [they are] appropriate for . . . students with special needs” (CCSSI, 2010, p. 6).
Thus, it remains the teachers and other IEP team members who must figure out how to build an individualized program of services for their students within the framework of a standards-based accountability system. The Tutorial is a collection of resources and tools for use by IEP teams seeking guidance and for prioritizing how they will address standards and make better use of the available instructional time. It assists with larger planning issues and the allocation of instructional time with respect to their students’ needs for the year encompassed by the IEP but does not inform the daily teaching plans or instructional approaches that might be used. In discussing the merits and limitations of curriculum-based measurement (CBM) practices, Deno (1997, 2003) advised the field that decisions of what methods or strategies might be used in addressing programmatic changes that may be indicated by a student’s data are necessarily defined by the teacher’s detailed knowledge of student characteristics, and by their own choices for allocating instructional time, presenting academic material, and engaging students. The research and development effort on the Tutorial reported here is an example of the current array of supports for educators engaged in this process. We hope they are complementary to established and valid practices such as CBM that are essential elements of meeting the substantive requirements of IDEA (Crockett & Yell, 2008). Striving for that level of utility increases the chances that even if the desired “target” for standards-based initiatives is changed, both general educators and special educators are given the tools necessary to provide all students with meaningful opportunities to achieve to their highest potential.
Footnotes
Acknowledgements
The authors wish to thank Dr. Martha Thurlow, Director, National Center on Educational Outcomes–University of Minnesota, for her generous assistance with the revision of this article.
Authors’ Note
Chad A. Rose is now at Sam Houston State University, Huntsville, TX, USA.
Declaration of Conflicting Interests
The author(s) declared no potential conflicts of interest with respect to the research, authorship, and/or publication of this article.
Funding
The author(s) disclosed receipt of the following financial support for the research, authorship, and/or publication of this article: The research reported here was supported, in part, by grants from the U.S. Department of Education, Institute of Education Sciences (R324J060002), and the Illinois State Board of Education (Part B, Discretionary Programs) awarded to the first author. Opinions expressed herein do not necessarily reflect those of the U.S. Department of Education, the Institute, or the Illinois State Board of Education.