
Abstract
Although federal law now mandates age-appropriate transition assessment as a key component of high-quality transition planning, little research exists to guide educators on what they might learn when undertaking this process. In this study, the authors examined teacher and parent assessments of the transition-related strengths and needs of 134 youth with severe intellectual and developmental disabilities who were eligible for the state’s alternate assessment. The perspectives of teachers and parents regarding the transition-related strengths and needs of particular students often diverged in key ways. Students with severe disabilities were perceived as having a range of transition-related strengths across the nine transition domains. Although a number of transition-related needs were identified by teachers, the transition profiles of individual students within this sample were quite heterogeneous. The authors offer recommendations for strengthening the transition assessment and planning process by incorporating multiple perspectives, and present important directions for future research on transition assessment.
Keywords
On the brink of adulthood, most youth aspire to pursue a range of personally important experiences, relationships, and outcomes in the years after high school. Although youth with severe intellectual and developmental disabilities share many, if not all, of these same aspirations for their futures (Wagner, Newman, Cameto, Garza, & Levine, 2005), having a significant disability continues to be a powerful predictor of the degree to which desired outcomes will materialize in early adulthood (Carter, Austin, & Trainor, 2012; Grigal, Hart, & Migliore, 2011). For most young people with severe disabilities, valued outcomes in the areas of employment, postsecondary education, community participation, social relationships, and health remain unattained or fleeting. Formal transition services and supports were initially advocated (Will, 1984) and subsequently mandated (Individuals With Disabilities Education Act, 1990) as a means of reversing the disappointing outcomes experienced by youth and young adults with disabilities. A constellation of coordinated and carefully designed programming during the final years of public schooling is now recommended for preparing youth to transition seamlessly to adulthood (Kohler & Field, 2003; National Collaborative on Workforce and Disability for Youth, 2009). Furthermore, recent systematic reviews confirm that an array of transition practices have some indication of promise or evidence of effectiveness (Alwell & Cobb, 2009; Test, Fowler, et al., 2009; Test, Mazotti, et al., 2009).
To individually tailor these services and supports, age-appropriate transition assessment is mandated as a means of identifying which educational practices are most essential for a particular student with a disability. Specifically, the Individuals With Disabilities Education Improvement Act (IDEA) of 2004 highlighted the role of assessment within effective transition planning by requiring the individualized education programs (IEPs) of youth to include “appropriate measurable postsecondary goals based on age-appropriate transition assessments related to training, education, employment, and, where appropriate, independent living skills” (§300.320(b)). Indeed, it is now widely acknowledged that meaningful assessment should serve as a cornerstone for the design and delivery of transition services (Neubert, 2012; Wehman, 2011).
One essential element of high-quality transition assessment and planning involves integrating the perspectives of multiple individuals who know a student well and/or who are familiar with the expectations of current or future environments in which a student participates or will participate (Carter, Trainor, Sun, & Owens, 2009; Karan, DonAroma, Bruder, & Roberts, 2010; Sitlington & Clark, 2007). Proponents advocate this approach because the scope of transition planning is typically broader than other educational planning endeavors, addressing multiple transition domains (e.g., academics, vocational, interpersonal relationships, health), contexts (e.g., classrooms, workplaces, residential placements), time points (in school and postschool), and support systems (e.g., schools, adult agencies, families, community supports). Individual transition planning team members often have different vantage points from which to observe a student, each may hold distinct expectations about the transition domains that are important to address for a student, and/or each may compile different information about a student’s competence and support needs. Such multi-informant approaches may be particularly important when conducting planning for students who have complex communication challenges and may encounter difficulties articulating their own goals, interests, strengths, and support needs. Thus, the reliance on multiple proxy informants may be heightened when transition planning focuses on students with severe disabilities.
Special educators are typically key—and sometimes the dominant—contributors to the transition planning process, drawing upon information learned through their work with the student over time (Shogren & Plotner, 2012; Wagner, Newman, Cameto, Javitz, & Valdes, 2012). However, parents and other family members also have invaluable perspectives to share within the transition assessment and planning framework (Neece, Kraemer, Blacher, & Ferguson, 2009; Powers, Geenen, & Powers, 2009). For example, family members may have unique opportunities to observe strengths or needs in contexts that are different from school settings. Family members may also share opinions about transition domains in which services and support needs are not anticipated or which they consider not to be appropriate.
Yet, few studies have explored the degree to which families and school staff are likely to hold similar perspectives on the strengths and needs of individual youth with severe disabilities, and none have explored views regarding the appropriateness of particular transition planning domains. Carter, Owens, Trainor, Sun, and Swedeen (2009) examined the self-determination prospects of high school students with severe disabilities from the perspectives of teachers and parents. Teachers evaluated the self-determination capacities of youth more favorably than parents, but both aligned in their views of the opportunities youth had to engage in self-determined behavior at school and home. In their study of students ages 4 to 18, Tasse and Lecavalier (2000) found that although parents and teachers generally aligned in their ratings of some social and behavioral measures, parents rated three types of problem behaviors as more challenging than did teachers. Similarly, Lecavalier, Leone, and Wiltz (2006) found that parents and teachers did not always agree in their views of the presence and severity of the challenging behaviors of children with intellectual disabilities ages 4 to 18. Given the narrow focus of these studies on a single educational domain and the paucity of studies addressing multirespondent transition assessments, additional research is needed to more closely explore the alignment among parents and teachers within transition planning efforts.
A second critical aspect of high-quality transition assessment is that it should inform planning teams about the needs and strengths of individual students (Carter, Trainor, et al., 2009; Neubert, 2012). IDEA specifically states that transition services must be “based on the individual child’s needs, taking into account the child’s strengths, preferences, and interests” (34 CFR 300.43(a), italics added). This emphasis on strengths-based assessment approaches affirms that strengths coexist alongside needs in every person, including persons with severe disabilities (Thompson, Wehmeyer, & Hughes, 2010). Yet, relatively few studies have focused on capturing the strengths and capacities of people with severe disabilities, particularly during adolescence and the transition to adulthood (Dykens, 2006; Shogren, Wehmeyer, Buchanan, & Lopez, 2006). Although disability categorical labels are used to indicate the basis of students’ need for extensive supports across multiple domains, it is also likely that individual strengths are evident alongside individual needs. In identifying these strengths and needs, transition assessment and planning should be comprehensive, addressing multiple dimensions of the lives of students with disabilities (Roberts, 2010; Wehman, 2011). Although the IDEA (2004) transition mandates specifically reference the domains of training, education, employment, independent living skills, and community participation, other areas (e.g., self-determination, interpersonal relationships, health) may be equally relevant to transition planning efforts. In fact, broad-based transition planning efforts are needed to adequately consider and plan for the range of contexts in which these students are expecting (and expected) to participate after high school. However, relatively little is known about the extent to which students’ transition planning needs are likely to be limited to relatively few areas (e.g., employment and interpersonal relationships) or span across many of these transition domains. Prior studies addressing the transition needs of students with disabilities have each focused narrowly on a limited number of domains, such as recreation/leisure (Kreiner & Flexer, 2009), employment (Turner, Unkefer, Cichy, Peper, & Juang, 2011), social competence (e.g., Tasse & Lecavalier, 2000), or self-determination (Carter, Owens, et al., 2009). Additional research is needed that examines multiple transition domains within the same sample of students. Third, the purpose of transition assessment and planning is to inform individualized programming (Cobb & Alwell, 2009). One critique of transition programming, however, is that students may be fit into existing programs rather than building programming around the needs of individual students (Hughes & Carter, 2011). Although students with severe disabilities are perhaps among the most heterogeneous groups of students in secondary schools, their school programs may be strikingly similar in scope and design. If students with severe disabilities indeed tend to have unique transition profiles, it follows that transition education should be individually tailored to address those individualized needs. However, prior studies have not explored the nature of these profiles among adolescents with severe disabilities.
Despite the explicitness of the most recent IDEA transition mandates, empirical guidance regarding what planning teams might encounter when implementing transition assessment processes is sparse. We examined teacher and parent assessments of the transition-related strengths and needs of 134 youth with severe intellectual and developmental disabilities who were eligible for the alternate assessment. The following research questions guided our analyses.
Method
Participants
Participants were the parents and teachers of high school students with intellectual and developmental disabilities. We asked these adult respondents to complete a widely used transition assessment (i.e., Transition Planning Inventory) for 134 focus students with severe disabilities. The focus students were selected because they received special education services under a primary disability category of intellectual disability or autism, were enrolled in high school, participated in a broader federally funded study focused on promoting employment for adolescents, and were eligible for the alternate assessment in their state.
The average age of students was 18.3 years (SD = 1.8 years, range = 14–22) and the slight majority (50.7%) was male. Most participants (86.6%) were European American, 11.2% were African American, and 2.1% were other race/ethnicities (i.e., Asian American, Native American). Youth were identified by teachers and in school records as having an intellectual disability (82.1%), autism (1.5%), or both an intellectual disability and autism (16.4%). Students were served across grade levels, including 19.4% who were in 9th grade, 12.7% who were in 10th grade, 26.1% who were in 11th grade, 28.4% who were in 12th grade, and 13.4% who received services in community-based, 18 to 21 programs. More than one quarter of students (26.9%) were eligible for free or reduced-price meals, 67.9% of students were not eligible, and information was not available for the remaining 5.2% of students.
Transition assessments for the 134 students were completed by 61 different special educators (i.e., some teachers had more than one participating student on their caseload). Among the teachers for whom demographic information was available, 95.1% reported having regular teaching licensure, 45.9% had a master’s degrees and 1.6% had a doctoral degree, 82.5% were female, and all were European American. Among the 90 parents who returned completed transition assessments, 18.9% reported having completed a graduate degree, 15.6% completed a bachelor’s degree, 23.3% reported having attended some college, and 35.6% reported receiving a high school degree or GED. About four fifths (82.0%) reported that either they or their spouse was currently employed outside the home.
Schools
Students attended 26 high schools located within 22 rural, suburban, and urban school districts in a large Midwestern state. Student enrollment at each of the high schools averaged 1,342 (SD = 663). About half (46.2%) of these schools enrolled between 1,000 and 2,000 students, whereas 30.8% enrolled fewer than 1,000 students and 23.1% enrolled more than 2,000 students. Average race/ethnicity of students across schools ranged from 0.3% to 66.8% African American (M = 7.5%), 0% to 5.3% American Indian (M = 0.9%), 0% to 13.3% Asian American (M = 3.9%), 14.1% to 98.3% European American (M = 81.58%), and 0.6% to 22.2% Hispanic (M = 6.15%). The percentage of students receiving special education services in each school ranged from 7.6% to 57.0% (M = 15.2%) and those eligible for free/reduced-price meals ranged from 1.2% to 74.1% (M = 21.78%). Diversity and affluence were not evenly distributed across schools. The 7 schools with the highest percentage of minority students (greater than one third of the total student population) were concentrated in 3 urban school districts. These schools also tended to have higher rates of students eligible for free/reduced-price meals (27.0%–74.1%).
Transition Planning Inventory
The Transition Planning Inventory (TPI; Clark & Patton, 1997/2006) is a widely used, 46-item assessment tool used to obtain information about students’ transition-related knowledge, behavior, and skills from the perspectives of school staff, family members, and/or students themselves. The 46 items on the TPI are clustered within nine transition domains: employment (5 items), further education/training (5 items), daily living (6 items), leisure activities (3 items), community participation (6 items), health (6 items), self-determination (5 items), communication (4 items), and interpersonal relationships (6 items). For example, items from the self-determination domain include recognizes and accepts own strengths and limitations, expresses feelings and ideas to others appropriately, and sets personal goals. Items from the community participation domain include knows his or her basic legal rights, participates as an active citizen, and knows how to use a variety of services and resources successfully. For each item, raters are asked to assess the focus student’s current level of competence using a 6-point Likert-type scale (0 = strongly disagree, 5 = strongly agree). Two additional response options also are available. If raters have insufficient knowledge to assess a student’s level of competence, they can select don’t know. If raters consider an item to be an inappropriate area of planning for the focus student, they can select not appropriate.
Both parent and teacher versions of the TPI also include sections requesting student demographic information (e.g., age, gender, grade, name) and information about anticipated postschool plans related to employment, postsecondary education or training, and living arrangements. Although all versions of the TPI address the same planning areas and domains, it is important to note that some of the corresponding items are worded slightly differently. For example, the school version item from the interpersonal relationships domain states “Displays appropriate social behavior in a variety of settings”; on the home version it is written as, “Can say and do the right thing wherever he/she is.” The school version item from the employment domain states, “Recognizes and accepts own strengths and limitations”; on the home version it is written as, “Knows and accepts own strengths and limitations.”
Evidence of the validity and reliability of the TPI has been reported in several sources (Clark & Patton, 1997; Rehfeldt, 2006; Smith, 1995). Psychometric properties were established on a sample of 329 school-based personnel, 227 parents, and 288 students across 10 states. Internal consistency for individual domains (measured by Cronbach’s α) ranged from .83 to .94 for teachers and from .79 to .92 for parents. Test–retest reliability coefficients ranged from .87 to .98 for teachers and from .76 to .91 for parents (Clark & Patton, 1997). During initial development, a pool of 250 items was drawn from an examination of state transition guidelines, as well as a review of the professional literature. A panel of faculty experts and practitioners evaluated initial drafts of the instruments to suggest revisions in wording, structure, and item inclusion, as well as to assess the social validity of the overall instrument.
We conducted reliability analyses with our own sample by calculating Cronbach’s alpha for each TPI domain separately for educators and parents. Alphas averaged .88 for educators (range = .84–.92) and .82 for parents (range = .58–.90). We also conducted exploratory factor analyses on the data provided by teachers, which showed a unidimensional structure for each of the nine domains addressed in the inventory. The variance explained by each of the factors ranged from 57.2% to 81.0% (M = 69.3%), suggesting that the items for each domain shared a substantial amount of common variance.
Procedures
Participants were recruited as part of a larger study focused on the employment and community experiences of adolescents with disabilities. After obtaining human subjects and district approvals to conduct the study in 34 high schools, we identified project liaisons in each school to assist with participant recruitment. These liaisons were asked to randomly select students with intellectual disabilities proportional to the total enrollment of the school. In addition, liaisons were asked to invite all students with severe disabilities (i.e., we oversampled students eligible for the state’s alternate assessment). Permission forms were mailed home to parents and guardians of identified youth and returned directly to the school liaisons, who then shared with us the names of students for whom permission had been obtained.
During the spring semester, we distributed assessment packets containing the TPI and three other instruments to special educators who worked with and knew each participating youth. These teachers completed the TPI independently at a time and location convenient to them. Parent versions of the TPI scale were mailed to the students’ homes and completed forms were returned directly to us. Although some students also completed the TPI, the paper-and-pencil assessment was not considered to be appropriate for most students; thus, youth perspectives are not addressed in our analyses. We told the teachers and parents that we would give them a summary profile based on the information gathered using the TPI that could be used as part of the student’s transition planning. We obtained TPIs from all 61 teachers (100%) and 90 parents (67.2%).
Data Analysis
We conducted a series of analyses to address our research questions. First, we calculated descriptive statistics to summarize teachers’ ratings for the 134 students with severe disabilities. We summarized domain-level scores by calculating the mean score for each domain across each group. We made this decision to retain reference to the original 6-point scale on which each item was initially rated to ease interpretation of our findings. We analyzed responses of not appropriate and don’t know separately by calculating the percentage of items receiving these ratings within each transition domain.
Second, we explored the individual transition-related profiles for students with severe disabilities based on all available teachers’ ratings. For each student, we categorized scores on individual domains as reflecting primarily strengths, needs, or somewhere in between. We categorized domains as reflecting primarily strengths if the teacher scored the majority of items in a given domain with a rating of 4 or 5. Similarly, we categorized domains as reflecting needs if teachers scored the majority of a given domain with a rating of 0 or 1. For domains reflecting neither clear strengths nor needs, a score of 2 or 3, we categorized the domain as equivocal. This interpretation of scores is generally consistent with the guidance given in the TPI manual (Clark & Patton, 1997), although the developers suggested a dichotomy of high (i.e., 3, 4, or 5) versus low (i.e., 0, 1, and 2). We developed a profile for each student consisting of a list of domains considered to be strengths, needs, and equivocal for that student. We then compared profile patterns across all youth with severe disabilities in the study.
Finally, we compared the assessments of teachers and parents for the 90 students with severe disabilities (67.2%) for whom both completed assessments were available. A summary of parent and teacher ratings for this subsample is provided in Table 1. To explore the degree to which teacher and parent ratings were aligned at both the item and domain level, we compared yoked teacher and parent ratings for individual students. We considered parent and teacher ratings to be in alignment if the ratings were identical (e.g., 1 and 1, not appropriate and not appropriate) or if numerical ratings were within one point (e.g., 2 and 3, 5 and 4). When parent and teacher ratings did not align, we categorized the specific nature of those differences (e.g., one person provided a numerical rating and another reported not appropriate or don’t know). We calculated percentages of both overall alignment and domain-level alignment across the entire group of students with severe disabilities.
Parent and Teacher Ratings for Students With Severe Disabilities by Transition Domain.
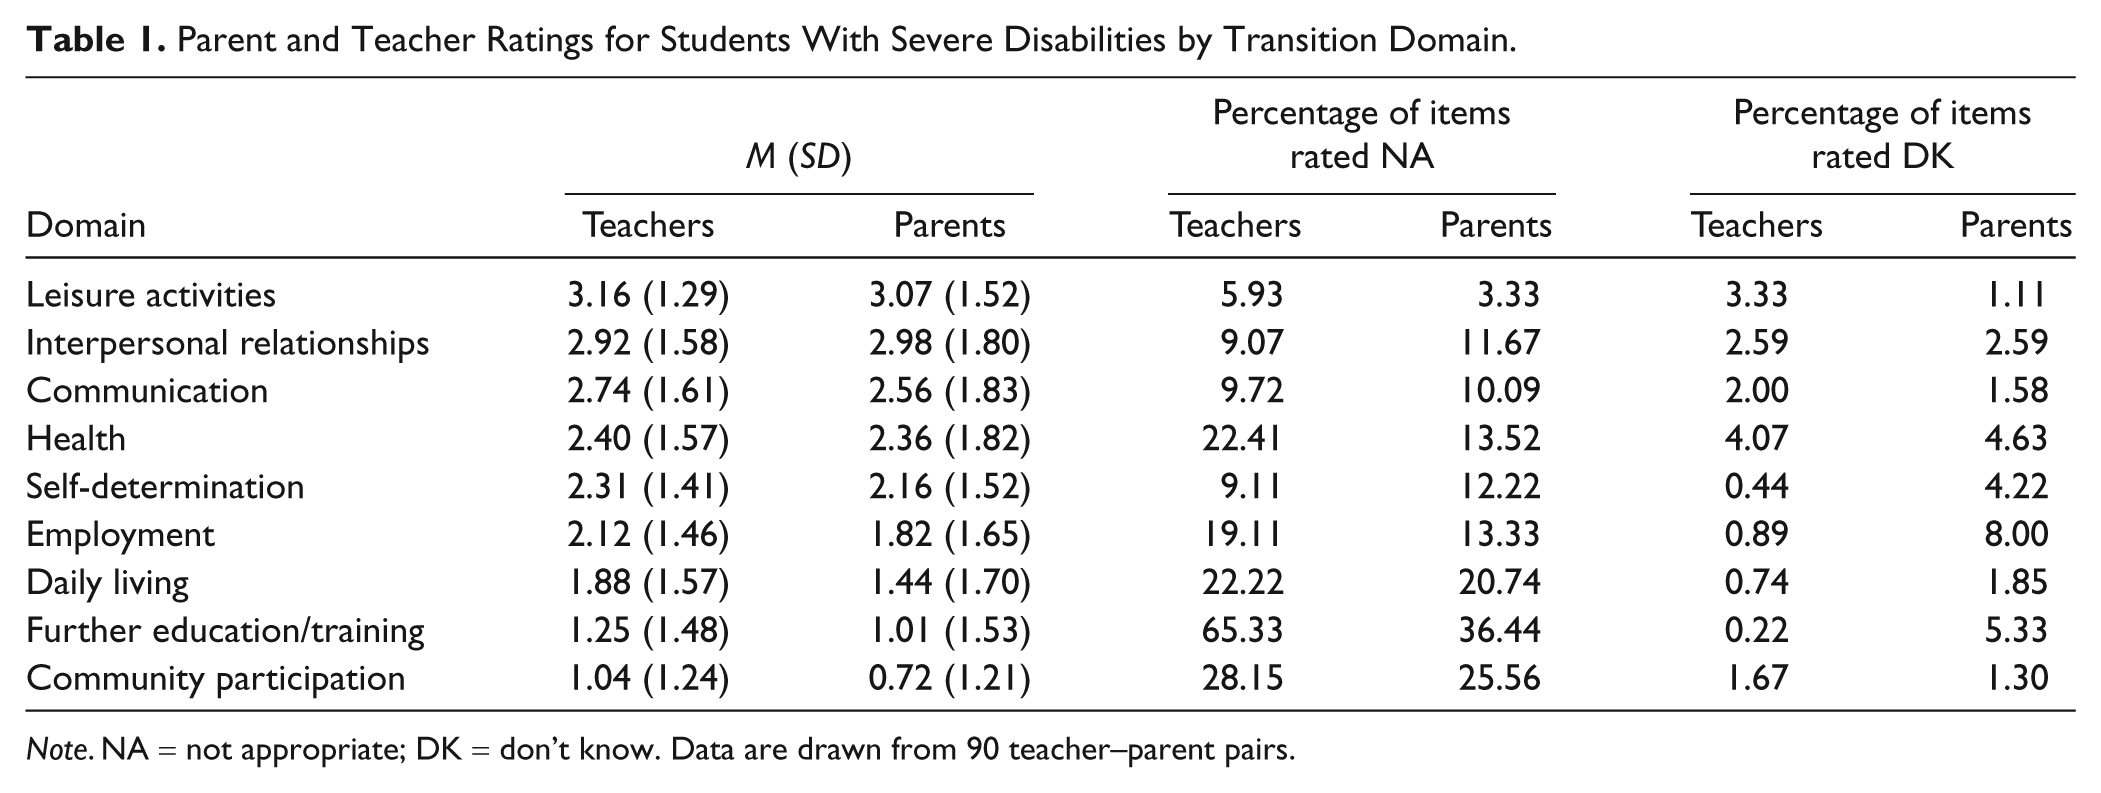
Note. NA = not appropriate; DK = don’t know. Data are drawn from 90 teacher–parent pairs.
Results
How Do Teachers View the Transition-Related Strengths and Needs of Students With Severe Disabilities?
As shown in Table 2, teachers tended to rate students with severe disabilities most highly on the domains of leisure activities (M = 3.44), interpersonal relationships (M = 3.01), and communication (M = 2.94). Community participation (M = 2.03) and further education/training (M = 1.90) received the lowest ratings. The variance in numerical ratings was similar across domains (SD range = 1.10–1.31).
Teacher Ratings by Transition Domain (N = 134).
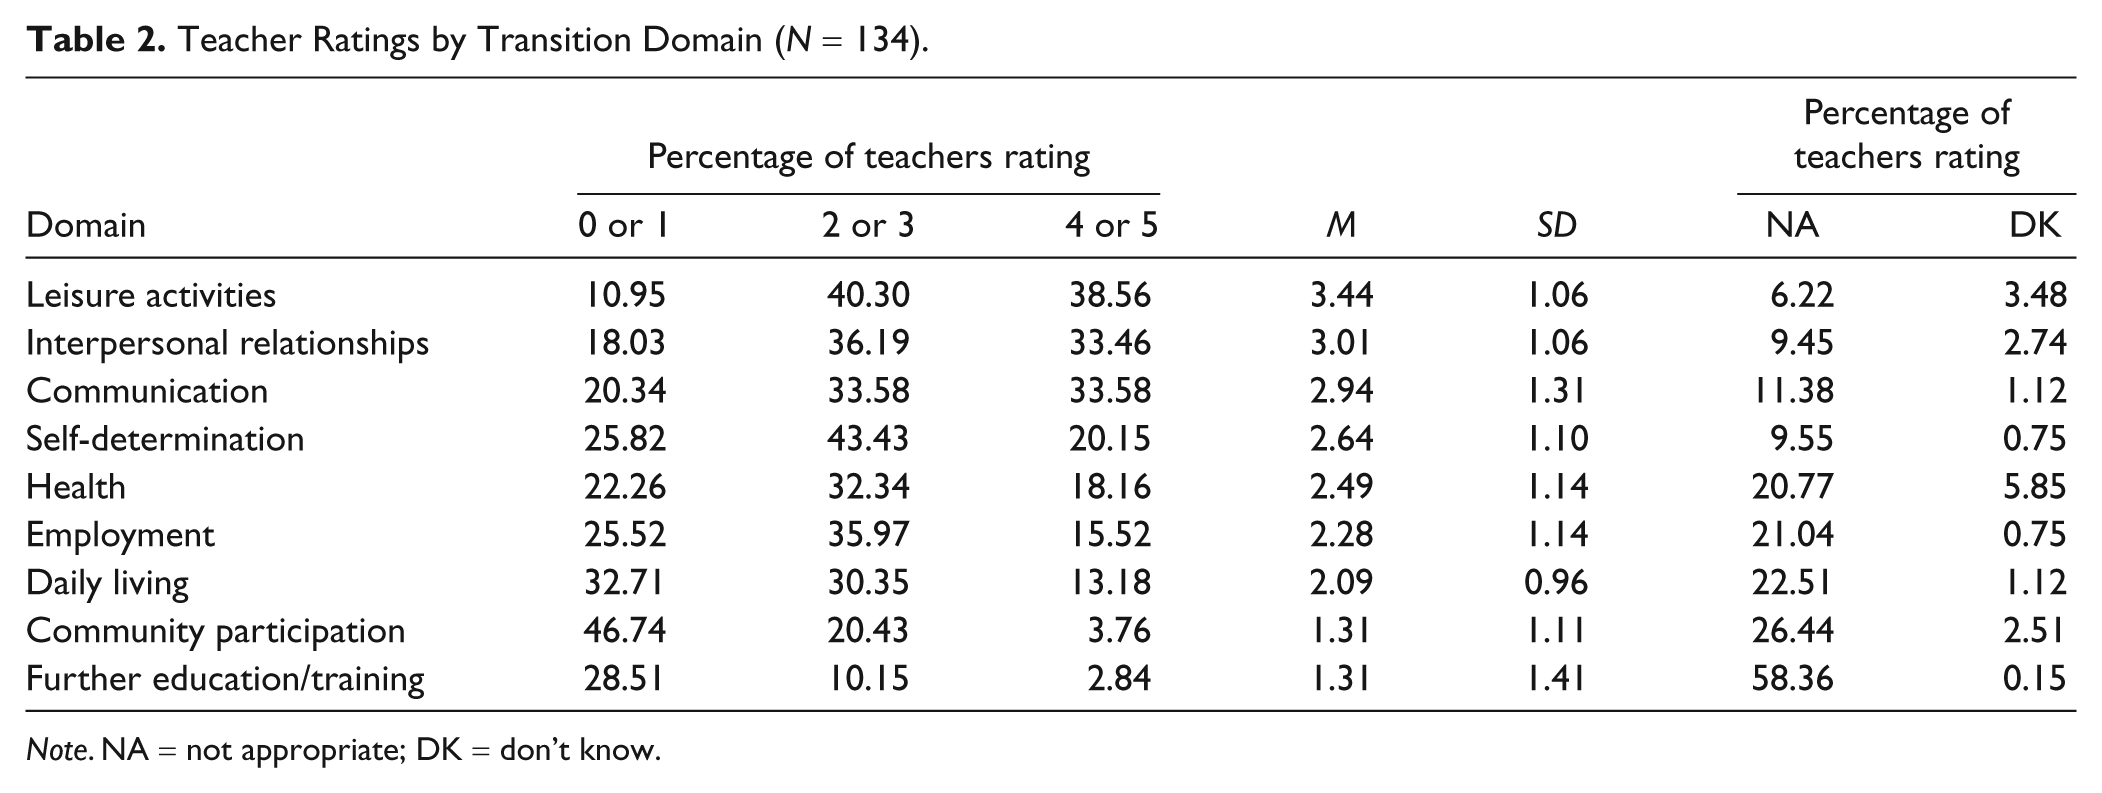
Note. NA = not appropriate; DK = don’t know.
Teachers tended to score more individual items as not appropriate in the domains of further education/training (58.36% of items), community participation (26.44%), daily living (22.51%), employment (21.04%), and health (20.77%). The individual items most often rated as not appropriate were each from the domain of further education and training: “knows how to gain entry into GED Program” (77.68%), “knows how to gain entry into college or university” (74.44%), and “knows how to gain entry into vocational/technical school” (68.89%). Teachers assigned the highest proportion of don’t know ratings to items in the domains of health (5.85%), leisure activities (3.48%), and community participation (2.51%). The individual items most often rated as don’t know were from the health domain—“makes informed choices regarding sexual behavior” (13.3%) and “knows how reproductive system works” (5.6%)—and the leisure activities domain—“uses setting that provide various types of entertainment” (6.7%).
To What Extent Do Individual Transition Profiles Vary for Students With Severe Disabilities?
Individual transition-related profiles of students with severe disabilities based on teacher ratings (N = 134) were created by categorizing each domain as primarily reflecting strengths (majority of items scored as 4 or 5), primarily reflecting needs (majority of items scores as a 1 or 2), or equivocal ratings (neither majority strengths or weaknesses) for each individual student. For example, a student might be determined to have needs in the domains of employment, further education/training, and daily living; strengths in the areas of leisure activities, communication, and interpersonal relationships; and equivocal ratings in the domains of health, community participation, and self-determination. We found that 107 of the 134 (79.85%) students with severe disabilities had unique profiles that did not match the profile of any other student in our sample. The most common shared profile—reflected among just 9.0% of students—included no clear strengths or weaknesses, but only equivocal ratings. No other single profile accounted for more than 4% of the group. None of the students had all nine domains categorized as areas of need, suggesting that no student was viewed entirely in terms of weaknesses. Moreover, the majority of students (67.91%) had at least one domain categorized as reflecting primarily strengths. The number of students for which each domain was categorized as a strength, weakness, or equivocal is summarized in Figure 1.
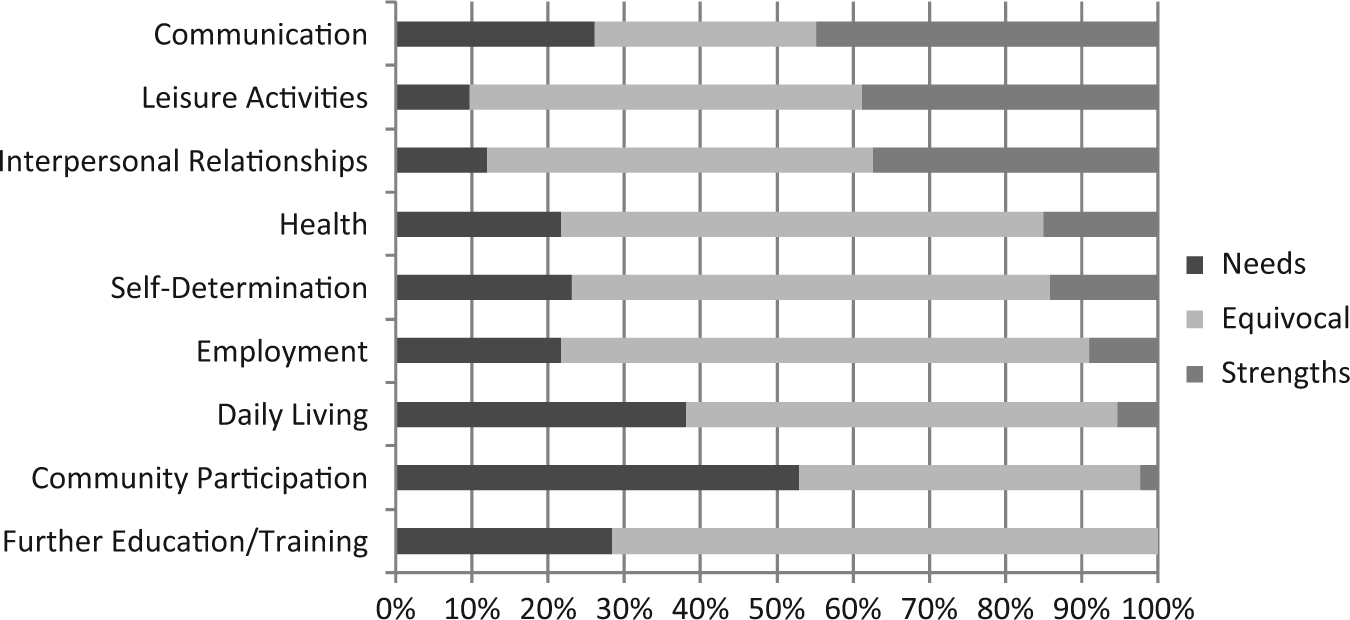
Percentage of students for whom ratings on individual domains reflected primarily strengths (majority ratings of 4 or 5), needs (majority ratings of 0 or 1), or equivocal ratings.
To What Extent Do Parents and Teachers Share Similar Perspectives of the Transition-Related Strengths and Needs of Students With Severe Disabilities?
We calculated percentage of close alignment between teacher and parent ratings for all 46 individual items, with close alignment defined as either an identical response agreement or a numerical rating differing only by one point on the scale. We made 4,140 item comparisons (i.e., 90 participants × 46 items rated by teacher and parent). Overall, teachers and parents provided similar ratings on less than half (48.0%) of all rated items. There were two primary indicators for divergence in ratings. First, teachers and parents provided numerical ratings that differed by more than 1 point on 24.3% of items. Second, on 21.6% of items, one respondent provided a numerical rating, whereas the other marked not appropriate. Other differences included one respondent providing a numerical rating and the other marking don’t know (3.7% of items), one respondent marking don’t know and the other marking not appropriate (1.2% of items), or one of the respondents leaving an item blank (1.3% of items). Categories of alignment and divergence are displayed in Table 3 at the level of each of the nine transition domains.
Percentage Agreement and Nonagreement Between Teacher and Parent Ratings by Domain.
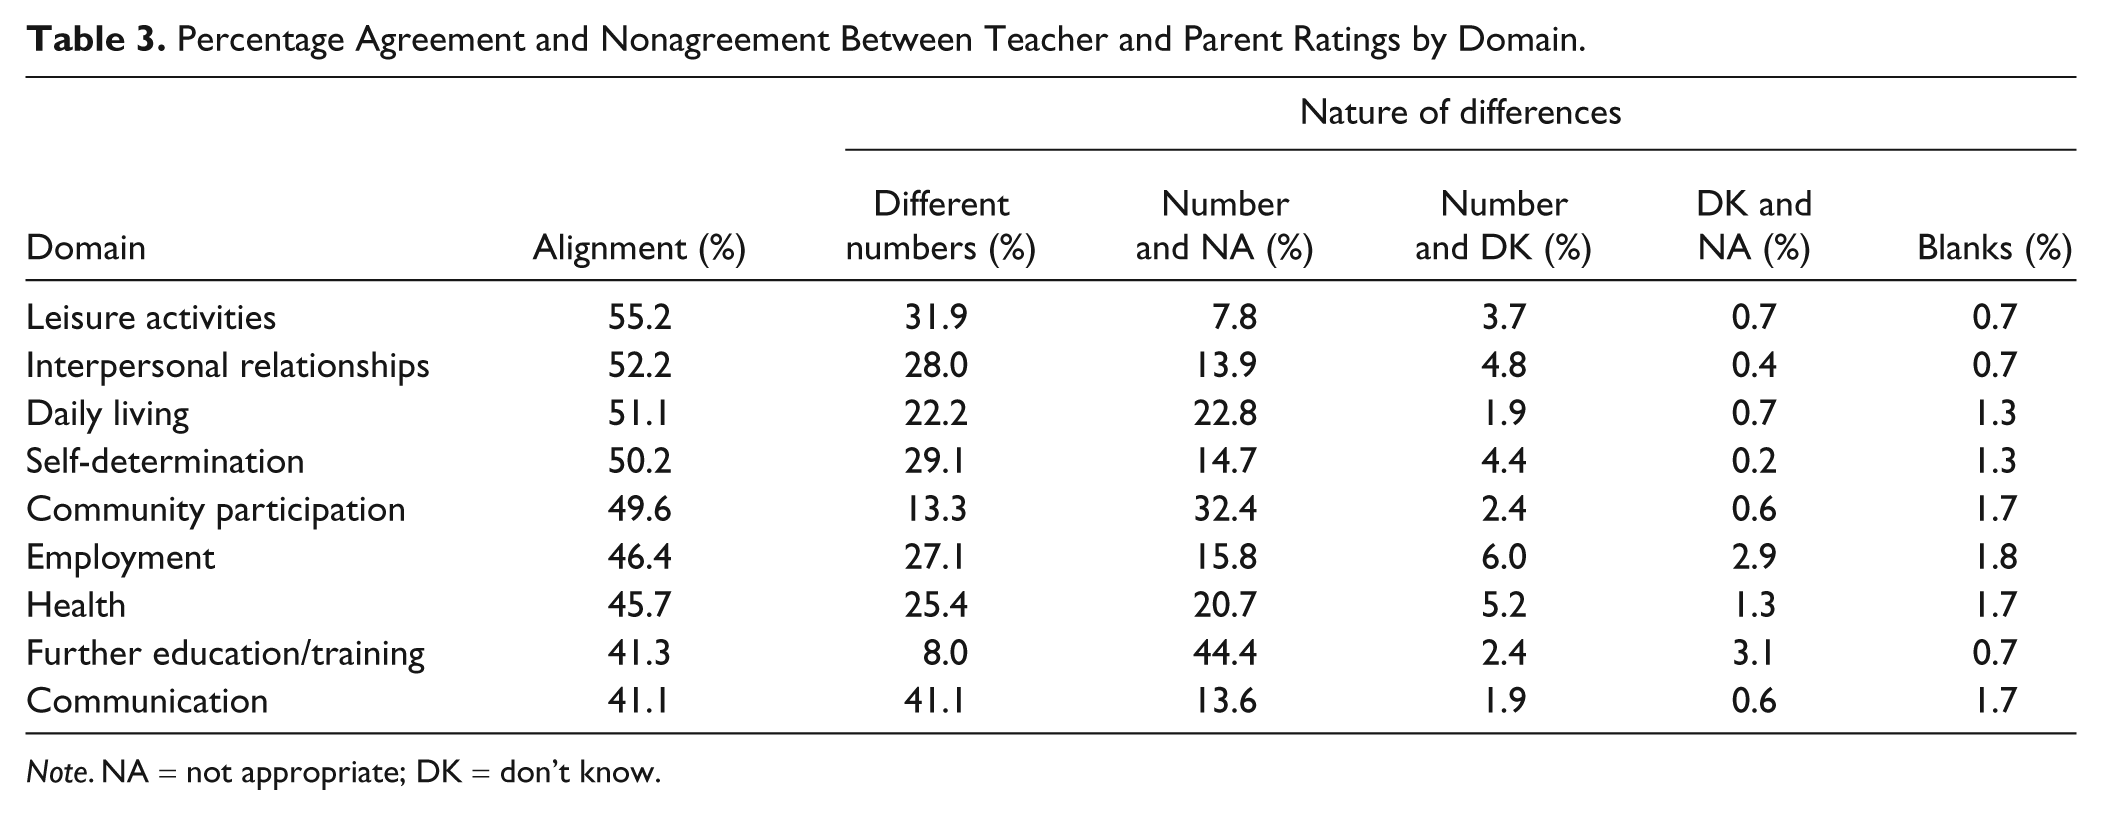
Note. NA = not appropriate; DK = don’t know.
When two substantially different numerical ratings were provided, the items for which those ratings most often differed included “Establishes and maintains close and/or casual friendships in a variety of settings” (46.7%; interpersonal relationships domain), “Has needed reading skills for acquiring information from written materials—may include tactile systems or other assistive technology/services” (45.6%; communication domain), and “Has needed writing skills—may include Braille systems and alternative/augmentative communication” (43.3%, communication domain). For other types of differences in ratings, the items for which differences were most often found included “Can succeed in an appropriate postsecondary program” (63.3%; further education/training domain), “Knows how to gain entry into an appropriate vocational/technical school” (55.6%; further education/training domain), and “Knows how to gain entry into an appropriate vocational/technical school” (50.0%, further education/training domain).
Discussion
Understanding the individual strengths and needs of young people with severe disabilities is an essential aspect of high-quality transition planning. The results of this study document a range of transition-related strengths reflected among students with severe disabilities. Although students with severe disabilities were reported to have prominent transition-related needs in several areas, there was also considerable variability in the transition profiles of individual students in our sample. Perhaps most intriguing, we found the perspectives of teachers and parents on the transition-related strengths and needs of particular students often diverged from one another for a variety of reasons. Collectively, these findings have a number of direct implications for the design and delivery of effective transition education.
First, students with severe disabilities clearly have strengths that can be both drawn on and deepened through the planning process. For example, many students in our sample were reported to have strengths in leisure activities, interpersonal relationships, and communication domains. This is an important finding, as participation in recreational leisure activities is associated with well-being (McGuire & McDonnell, 2008), effective communication skills are highly valued by community employers (Ju, Zhang, & Pacha, 2012), and social relationships contribute to a high quality of life (Carter, 2011). Incorporating strength-based assessment approaches within transition planning can enable team members to leverage existing strengths to further improve students’ participation and outcomes (Epstein, Rudolph, & Epstein, 2000).
Second, our findings further reinforce the importance of incorporating meaningful assessment within the transition planning process because students with severe disabilities—like all adolescents—clearly possess unique amalgamations of strengths and needs. In the present study, the transition profiles of individual students were very heterogeneous when compared with other students with severe disabilities in this sample. Our findings suggest it would be quite unusual for two students with severe disabilities to have identical transition-related profiles. The tremendous diversity of individual transition-related profiles for students with disabilities affirms mandates to assess students frequently to determine individual needs and create truly individualized transition plans. Moreover, providing transition programming to students solely on the basis of having a “severe disability” would be inappropriate and inadequate. Findings from this study reaffirm strong empirical support for previous recommendations for individualized programming (Karan et al., 2010; Neubert, 2011; Sitlington & Clark, 2007).
Third, it is important to assess the transition-related strengths and needs of students with severe disabilities from multiple perspectives because a single informant would likely provide an incomplete perspective. Although there was some convergence between teacher and parent perspectives on individual item ratings, the more prominent theme was one of divergence with 52% of all items receiving different ratings. Moreover, overall alignment may have been even lower had complete parent data been obtained for the remaining one third of the sample. Other studies have highlighted differences among parent and educator perspectives within the transition planning process for students with high-incidence disabilities (Carter, Trainor, et al., 2009; Hogansen, Powers, Geenen, Gil-Kashiwabara, & Powers, 2008) or on other assessment measures for students with severe disabilities (Murray, Ruble, Willis, & Molloy, 2009; Voelker, Shore, Hakim-Larson, & Bruner, 1997). Our findings demonstrate that parental perspectives bring new information to a transition profile that would not have been obtained by relying solely on educators’ perceptions and assessments.
Several possible factors might contribute to why teachers and parents may have scored items on the TPI in different ways. First, teachers and parents may be drawing from different sources of information given their unique vantage points. For example, although teachers may assess a student’s communication skills and interpersonal relationships based entirely on interactions with school staff or other students with disabilities, parents can be considering interactions with family members, community members, or family friends. Future researchers could explore these possibilities further by querying informants about the variety of factors that contributed to their own rating decisions. Second, teachers and parents may also assign ratings based on different points of reference. For example, although a parent might compare a student’s skills with those of a typically developing sibling or their own expectations for adolescents, a special education teacher might anchor ratings to the performance of other students with disabilities. Third, differences in the exact wording of items on the TPI school and home forms may also contribute, in part, to differences in ratings. For example, the item with the highest level of disagreement is worded “Can do well in a program after high school that meets his/her needs” on the home form and “Can succeed in an appropriate postsecondary program” on the school form. The substitution of the word postsecondary in the school version may lead a teacher to think specifically about educational placements (such as a college or training programming), whereas the parent may be considering a much broader array of programs (e.g., recreational programs, day programs). Another item with high disagreement states the student “Makes friends in different kinds of settings” on the home form, but that the student “Establishes and maintains close and/or casual friendships” on the school version. In this particular case, the behavior being rated (i.e., making friends vs. establishing and maintaining close relationships) may be qualitatively different. Fourth, transition teachers might have knowledge about the expectations and demands of postsecondary educational, workplace, and community settings that parents might not share (and vice versa). Although ratings based on any of these differences could be readily navigated during discussions at or prior to planning meetings, future transition assessment developers should consider carefully the strengths and drawbacks of using alternate wording on multirespondent assessments.
As an enduring source of support in the lives of young people with severe disabilities, parents may be highly invested in a successful transition to adulthood (Blacher, 2001; Kim & Turnbull, 2004) and often report desiring greater involvement in the transition process (Geenen, Powers, & Lopez-Vasquez, 2001). Thus, soliciting their views about their child’s strengths and needs is a natural avenue for engaging these stakeholders more fully. Any identified differences in parent–teacher perspectives should lead to focused discussion among stakeholders and, potentially, drive decisions about additional informal or formal assessments that might be carried out (Clark & Patton, 2006). However, without gathering multiple perspectives in the assessment process, opportunities for deeper discussions and subsequent assessments may be lost. Although our study focused narrowly on parent–teacher congruence, soliciting additional perspectives—such as information from youth themselves, employers, paraprofessionals, or other family members (e.g., siblings)—is likely to bring even richer information to inform the transition planning process. Thus, future research is needed to explore the ways in which expanding the number of assessment informants both deepens and challenges such planning decisions.
Fourth, transition planning may be enhanced by holding high expectations for students with severe disabilities. We were surprised by the number of items rated as not appropriate by teachers. In fact, every single item on the TPI was rated not appropriate by teachers for at least three students. The frequency of not appropriate ratings ranged from 3% to 68% across individual items. In most cases, likely explanations for high percentages of not appropriate ratings are straightforward. For example, an item might not align with a student’s goals (e.g., “Knows how to gain entry into a GED program” was rated not appropriate for 77.78% of students). Items also might not be considered relevant because of where the student lives (e.g., “Uses local transportation systems when needed” was rated not appropriate for 36.67% of students). It may also be that teachers scored items as NA because they believed parents or advocates intended to take responsibility for certain transition-related tasks and did not expect involvement from the school (e.g., “Knows how to locate a place to live in the community” and “Knows how to obtain financial assistance from specific state/federal agencies” were rated as not appropriate for 36.67% and 30.00% of students, respectively).
For other items, the reasons for ratings of not appropriate were less clear (e.g., “Gets along well with family members,” “Has needed speaking skills—may include sign language or alternative/augmentative communication,” “Performs various indoor leisure activities”). Perhaps teachers marked items as not appropriate when a skill had already been thoroughly assessed and was being addressed in existing intervention plans. It is also possible that some teachers may perceive that basic social, communication, and recreational skills are not attainable goals for some students with severe disabilities. An alternate possibility is that teachers may simply have considered inappropriate any item not closely aligning with students’ postschool transition goals. Regardless of the underlying reason, this prominent finding warrants closer examination in future research, as it is well documented that teacher expectations can strongly influence student outcomes (Carter et al., 2010; Harris & Rosenthal, 1985).
Limitations and Recommendations for Future Research
Future research is needed to address several limitations associated with this study. First, our study focused on transition-related information obtained through a single assessment tool. Although the TPI is reported to be widely used (Morningstar & Liss, 2008), it remains unclear whether the general findings and response patterns documented in this study would be found when using other transition assessment approaches. No such studies have yet been conducted. Moreover, recommended transition planning practices stipulate that assessment information should be obtained from multiple sources, usually a combination of both direct and indirect assessments, and should be obtained at multiple points over time. Future research should examine the extent to which our findings are robust across other tools and approaches, particularly as we speak to the importance of multiple perspectives. We see a particular need to incorporate more direct observation elements into existing transition assessment tools. Second, although we prepared summaries of the TPI assessment findings for school teams, we did not study the ways in which those findings were actually utilized within the planning process. It is unclear whether or how knowledge of these assessment findings shaped the discussions that ensued at each student’s next transition meeting. Nor do we know whether and how differences in parent and teacher ratings were navigated. An enduring research need is to more closely examine the link between assessment and planning.
Third, our study explored findings from a single—and likely first—administration of the TPI in participating schools. However, transition assessment should be an ongoing process. It is unclear whether teacher–parent convergence increases over time or after discussion of the initial findings. It is also unclear whether awareness of students’ strengths and needs become more apparent as youth access more transition experiences, instruction, and supports. Fourth, we did not explore the link between assessment findings and student outcomes. Little is known about whether and how the information gathered on tools like the TPI predict, shape, or reorient the postschool outcomes of any youth. Understanding better the linkages between transition processes and outcomes remains an important element of improving the quality and impact of transition services for youth with severe disabilities.
Conclusion
The transition assessment and planning process is in need of more focused research attention, particularly for youth who are considered to have severe disabilities. Although the extant literature has addressed the perspectives and expectations of parents, youth, and teachers regarding the transition of youth with high-incidence disabilities (e.g., Geenen, Powers, & Lopez-Vasquez, 2005; Trainor, Carter, Swedeen, Cole, & Smith, 2011), much more work is needed to address ways to meaningfully include all stakeholders in the assessment process for youth with severe disabilities. Our findings should strengthen calls to weave their perspectives more tightly into the assessment and planning process.
Footnotes
Acknowledgements
The authors thank Beth Swedeen, Ye Sun, David Riddler, Nicole Ditchman, Tracy McLeod, and Laura Owens for their contributions to this project.
Authors’ Note
The opinions expressed are those of the authors and do not represent views of the U.S. Department of Education.
Declaration of Conflicting Interests
The author(s) declared no potential conflicts of interest with respect to the research, authorship, and/or publication of this article.
Funding
The author(s) disclosed receipt of the following financial support for the research, authorship, and/or publication of this article: The research reported here was supported by the Institute of Education Sciences, U.S. Department of Education, through Grant R324S060023.