
Abstract
In the current educational climate, teachers are required to find methods to give all students, including students with mild intellectual disability, access to the general education curriculum. The purpose of this study was to investigate the combined effects of the concrete−semiconcrete−abstract instructional sequence and model-based problem solving to teach area and volume to sixth-grade students with mild intellectual disability. The researchers in this study utilized a multiple probe design, a variation of the multiple baseline design, to establish the functional relationship between the intervention and students’ performance on area and volume problems. The participants solved a high percentage of the sixth-grade-level problems addressed on the criterion tests, but success with more complex problems will be necessary for proficiency at grade level with the Common Core Standards for Mathematics.
Keywords
All students, including students with disabilities, are facing rising expectations for performance in mathematics due to educational policies and laws (Reardon, Arshan, Atteberry, & Kurlaender, 2010; Woodward, 2004). Equity principles outlined by the National Council of Teachers of Mathematics (NCTM, 2000) stressed higher expectations for students with disabilities and appropriate support to help these students meet these higher expectations. The reauthorization of the Individuals With Disabilities Education Act (United States Department of Education, 2004) aligned the special education law with No Child Left Behind (2002) to coordinate students with disabilities being granted access to the general education curriculum and taking state assessments with students without disabilities in Grades 3 through 8 (Turnbull, Huerta, & Stowe, 2006). Expectations are also rising for students at the high school level where all students are required to pass exit exams and high school algebra and geometry courses (in some states) to earn a high school diploma; students who do not pass these tests or courses may receive a certificate of attendance rather than a high school diploma (Center on Education Policy, 2010; Reardon et al., 2010; Teuscher, Dingman, Nevels, & Reys, 2008).
Students With Mild Intellectual Disability and Mathematics
Even though the rising expectations are similar for all students, compared with students without disabilities, students with intellectual disability face significant challenges in academics (NCLB, 2002; Sabornie, Cullinan, Osborne, & Brock, 2005). The difficulties facing students with mild intellectual disability (MID) are not nearly as significant as those experienced by students with moderate or severe intellectual disabilities (MacMillan, Siperstein, & Gresham, 1996). However, students with MID are likely to experience slow academic growth, exhibit low performance in many academic areas, have difficulties with problem solving and abstract reasoning (e.g., drawing conclusions, making generalizations, representing concepts symbolically, etc.), and experience deficits in working memory (MacMillan et al., 1996; Sabornie et al., 2005; Schuchardt, Gebhardt, & Mäehler, 2010).
Despite these difficulties, in some research studies, students with MID have succeeded in challenging areas of mathematics such as using meta-cognition to make sound mathematical decisions to solve word problems and creating their own strategies for solving arithmetic problems (Baroody, 1996; Erez & Peled, 2001; Huffman, Fletcher, Bray, & Grupe, 2004; Neef, Nelles, Iwata, & Page, 2003). However, there is a need for research conducted with students with MID in more mathematical content areas such as geometry and measurement (Hord & Bouck, 2012). According to the National Mathematics Advisory Panel (2008) and NCTM (2000), geometry and measurement are foundational mathematics content areas that are essential for preparing students to learn algebraic or geometric concepts at the high school level (e.g., learning about area and volume in middle school builds a foundation for learning about Cavalieri’s principle in high school geometry) and for development of mathematics needed for life-skills and occupational settings (see Common Core Standards; Council of Chief State School Officers and National Governors Association [CCSSO and NGA], 2010).
The concepts of area and volume can be difficult for all students, including high achieving students, who may experience difficulty in fully understanding the connections between formulas and the mathematical relationships within area and volume problems (Boaler & Humphreys, 2005). For success with area problems and understanding of the concept of area, students need to understand the concept of length, how iterations of rows of squares (which can be represented as length or width) can be used to determine area, and, in general, know how and why the formulas for area of various shapes can be applied to solving area problems (Battista, 2004; NCTM, 2000). Without an understanding of the rationale behind the formulas, students may mechanically (and sometimes incorrectly) apply rules or formulas to area problems (Boaler & Humphreys, 2005; Clements & Sarama, 2009; NCTM, 2000). A third dimension adds extra difficulty to volume problems for which students need to understand how layers of cubes and iterations of these layers can be used to determine volume (Clements & Sarama, 2009).
Access to Area and Volume Problems
Based on the challenges posed by area and volume problems, and the needs of students with MID, the concrete−semiconcrete−abstract teaching sequence (CSA) is a reasonable starting point for special education researchers (Clements & Sarama, 2009; Schuchardt et al., 2010). In general, visual representations are likely to help students with disabilities (Kroesbergen & Van Luit, 2003). CSA, which relies heavily on visual representation in the concrete (e.g., working with wooden blocks) and semiconcrete (e.g., drawing two-dimensional figures) phases, is supported by research to be effective for teaching students with MID in other areas of mathematics such as multiplication fact memorization, multiplicative word problems, and situations involving money (Miller & Mercer, 1993; Morin & Miller, 1998). Recent research has demonstrated how CSA can be utilized for helping students with learning disabilities access more challenging mathematics including algebra concepts, such as one-variable equations—for example, 5n − 6 = 14—and binomial expressions—for example, (x + 4) (x − 2)—and geometry concepts such as area problems (Cass, Cates, Smith, & Jackson, 2003; Scheuermann, Deshler, & Schumaker, 2009; Strickland & Maccini, 2012). However, there is a dearth of research on using CSA for teaching mathematics at these levels of complexity to students with MID (Hord & Bouck, 2012).
Conceptual Model-Based Problem Solving (COMPS; Xin, 2012) is another potentially effective instructional technique for teaching area and volume to students with MID (Xin & Hord, 2013). COMPS is emerging in the field of special education as an effective instructional approach for helping students with high-incidence disabilities solve word problems (Xin, 2008; Xin & Zhang, 2009). Through making the connection between real-world situational models (concrete models with diverse contexts) and the mathematics symbolic model (e.g., formula, algorithm, etc.), COMPS helps students develop understanding of the mathematical relationships in word problems and represent such relationships conceptually in model equations (such as Part + Part = Whole, Referent Unit × Number of Units = Product; Xin, 2008, 2012). Model equations that are designed to promote students’ conceptual understanding at the symbolic level can facilitate students’ solution planning as they solve word problems (Xin, 2008).
A combination of CSA and COMPS utilizes both visual representations and teaching strategies targeted toward the development of conceptual understanding. This can be especially helpful because it addresses the typical disadvantages students with MID experience, such as deficits in problem-solving skills (MacMillan et al., 1996; Miller & Mercer, 1993; Xin, 2008). To this end, we have conducted a pilot study (Xin & Hord, 2013), utilizing a single-subject design, to explore the potential impact of the combination of CSA and COMPS. One fourth-grade and three fifth-grade students with high-incidence disabilities (including two students with LD, one student with MID, and one student at risk for failure in school) participated in the study. The intervention was designed to teach basic geometry and measurement concepts through building on fundamental mathematical idea of multiplicative reasoning. For instance, in solving area of problems, length was used to represent the unit rate (i.e., the number of squares in a row), width was used to represent the number of composite units (i.e., number of rows), and area was used to represent the product. Findings from this pilot study indicated that all four participants, including the student with MID, demonstrated improvement at solving area and volume problems including area of rectangle, area of irregular polygon (with only right angles), and volume of rectangular prism problems. However, considering the inclusion of only one participant with MID in the pilot study, it was not possible to establish a functional relationship between the intervention and the outcome and, therefore, the efficacy of the intervention with this population.
The Purpose Statement
The purpose of this study was to further study the effect of CSA + COMPS in teaching area and volume problem-solving skills to students with MID. The research questions are as follows:
Method
Participants and Setting
The study was conducted in a middle school in the Midwestern United States. Three six graders with MID participated in the study. Alice was a multiracial, 13-year-old female, with an IQ score of 63; Breanna was an African American, 11-year-old female, with an IQ score of 73; and Candace was an African American, 13-year-old female, with an IQ score of 67. Each of the participants in this study was school identified as a student with MID and had an IQ score between 50 and 75, which is specified by the American Association on Intellectual and Developmental Disabilities (2011) as the range of IQ scores for students with MID. All three participants were not proficient on the most recent high-stakes, state assessment in all subjects.
Dependent Measures
The percentage of items correct on the 10-item criterion tests was the dependent measure. The criterion tests were designed to address the sixth-grade curriculum state standards specifically pertaining to area and volume. Criterion test items were adapted from the traditional mathematics textbook, Math Connects (McGraw-Hill, 2011). The criterion tests (see Table 1 for problem examples) consisted of 10 items involving finding area of rectangles, triangles, and circles as well as volume of rectangular and triangular prisms and cylinders. In addition to problems where the area or volume (or the product) was the unknown, the criterion tests also included problems where one of the dimensions of a geometric figure (e.g., length, width, or height) was the unknown. The researchers omitted factor unknown problems for area of circle or volume of cylinder problems due to the possibility that students would not have the background knowledge of exponents and square roots necessary for solving for unknown radii. To monitor participants’ progress, the participants also completed intervention worksheets that consisted only of material taught during that particular part of intervention.
Sample Problems in Criterion Tests.

The criterion tests given during baseline, treatment, post-test, and maintenance phases were equivalent forms and were created by modifying problem numbers and context while maintaining as much similarity in difficulty as possible. The reliability and equivalence of the pre-tests, post-tests, and maintenance tests were determined by testing students in the same school as the participants, but not participating in the study. For testing three equivalent forms/tests, these students were divided into three groups that took each test on separate days. The order was counterbalanced to control for practice and sequence effect. The Pearson product−moment correlation coefficient formula was used to calculate parallel form reliability (Glass & Hopkins, 1984). Reliabilities were .83, .83, and .87.
Students received a whole point for correct answers regardless of methods used or whether problem-solving methods were written by the students on the test paper. The researchers chose to award half-credit for showing correct problem-solving methods despite an incorrect answer. During testing and throughout the study, the participants were allowed to use four-function calculators to accommodate participants’ skill deficits in calculation. The researchers’ decisions to award half-credit for correct problem-solving methods and incorrect answers as well as to allow calculator usage were based on recommendations by special education researchers (Woodward & Montague, 2002) and by NCTM (2000) to more instructional time directing students’ attention toward developing an understanding of mathematical concepts and problem-solving processes rather than computational procedures.
One of the researchers in this study scored all the tests administered before and after the intervention. A researcher not involved in this study rescored 40% of the randomly selected tests. Inter-rater reliability was computed by dividing the number of agreements by the number of agreements and disagreements (Barlow, Nock, & Hersen, 2009). Results for inter-rater reliability were 100%.
Design and Procedure
We chose a single-subject research design due to the degree of micro-level analysis offered by this design and the exploratory nature of this study due to this topic being understudied at the time of the study (Hord & Bouck, 2012). We used an adapted multiple probe design across participants (Horner & Baer, 1978) to explore the potential functional relationship between the intervention (i.e., CSA & COMPS) and students’ performance on the criterion tests. According to Horner and Baer (1978), it can be advantageous for researchers to choose a design in which “multiple baseline and probe procedures are combined into a ‘multiple probe’ technique” so that intermittent probes can be utilized to provide “an alternative to continuous assessment” (p. 189). For instance, researchers may deem daily assessment impractical when there is a reasonable assumption of a lack of academic skills (Horner & Baer, 1978). Therefore, we chose an adapted multiple probe design because it allows researchers to not probe every session (as special education researchers often do during studies of behavior) to avoid continuously assessing skills students have not yet learned. Within the context of this design, the researcher can administer a series of pre-tests and post-tests, and administer probes only after completing a phase of instruction. Treatment data, in the form of worksheets, can be recorded on days when probes are not administered to demonstrate student progress on the isolated content areas that participants are in the process of learning.
The three participants completed three criterion tests during the baseline condition. A stable baseline was first established for Alice. After Alice showed significant improvement on area of rectangle problems and a stable baseline was established for Breanna, the intervention was introduced to Breanna. After Breanna’s performance on area problems increased and a stable baseline had been established for Candace, the researchers began implementation of the intervention with Candace.
The instruction followed the sequence of these problem types: area of rectangle, volume of rectangular prism, area of triangle, volume of triangular prism, area of circle, and volume of cylinder. To monitor the progress of the students during the course of intervention, the participants were assessed with criterion tests (i.e., mid-intervention probes) after volume of rectangular prism instruction and again after volume of triangular prism instruction. Following the completion of the intervention (i.e., after volume of cylinder instruction), the participants took the criterion post-test. To assess maintenance of the targeted skills, criterion tests were administered again 1 month and 2 months after the intervention. During administration of the baseline tests, mid-intervention criterion test probes, and the post-tests, the teacher read the tests to the participants upon request (and paused until students were finished writing information from a sentence before reading the next sentence) to make accommodations for possible reading difficulties. During criterion test administration, the students were provided with a formula sheet from which students could choose a formula for solving the problem (see the formulas listed for the “Testing” situations in the left column of Table 2).
Examples of Scaffolds, Representational Strategies, and Student Work.

To obtain information about the social validity of the intervention, the researchers also conducted semi-structured interviews before and after the intervention regarding students’ attitudes toward mathematics, their evaluations of themselves as mathematics students, and how they felt about their math classes. Sample items included in the survey were, “How good at math are you compared to the other kids in your class?” and “Can you describe a situation when any of the strategies were helpful for you or when they were not helpful?” The participants’ teacher was also asked about the practicality of the intervention for her classroom.
Intervention and Materials
The participants received the intervention in a one-on-one setting for seven to ten school days with each session lasting approximately 30 min. The teaching of each topic began with activities and discussions involving concrete figures. Students used tape measures, wooden cubes, and plastic unit squares to measure items such as tabletops, cabinets, flags, windows, and cans of food. Wooden blocks and wooden figures were used to create concrete representations (e.g., combining cubes or two triangular prisms to build rectangular prisms). Unit squares/tiles were also used to create concrete models. For instance, when working with area of rectangle problems, the teacher and participants discussed how length can be represented by the number of unit squares in a row and width can be represented by number of rows of squares. The teacher demonstrated how iterations of the rows of squares can be used to determine the number of total unit squares or the area of the rectangle. The teacher also discussed with the students the role of iterations of the base in volume of rectangular and triangular prism problems and cylinder problems. If the students correctly solved and justified their answers for three consecutive problems in the concrete context, the researcher advanced the students to the semiconcrete level of instruction.
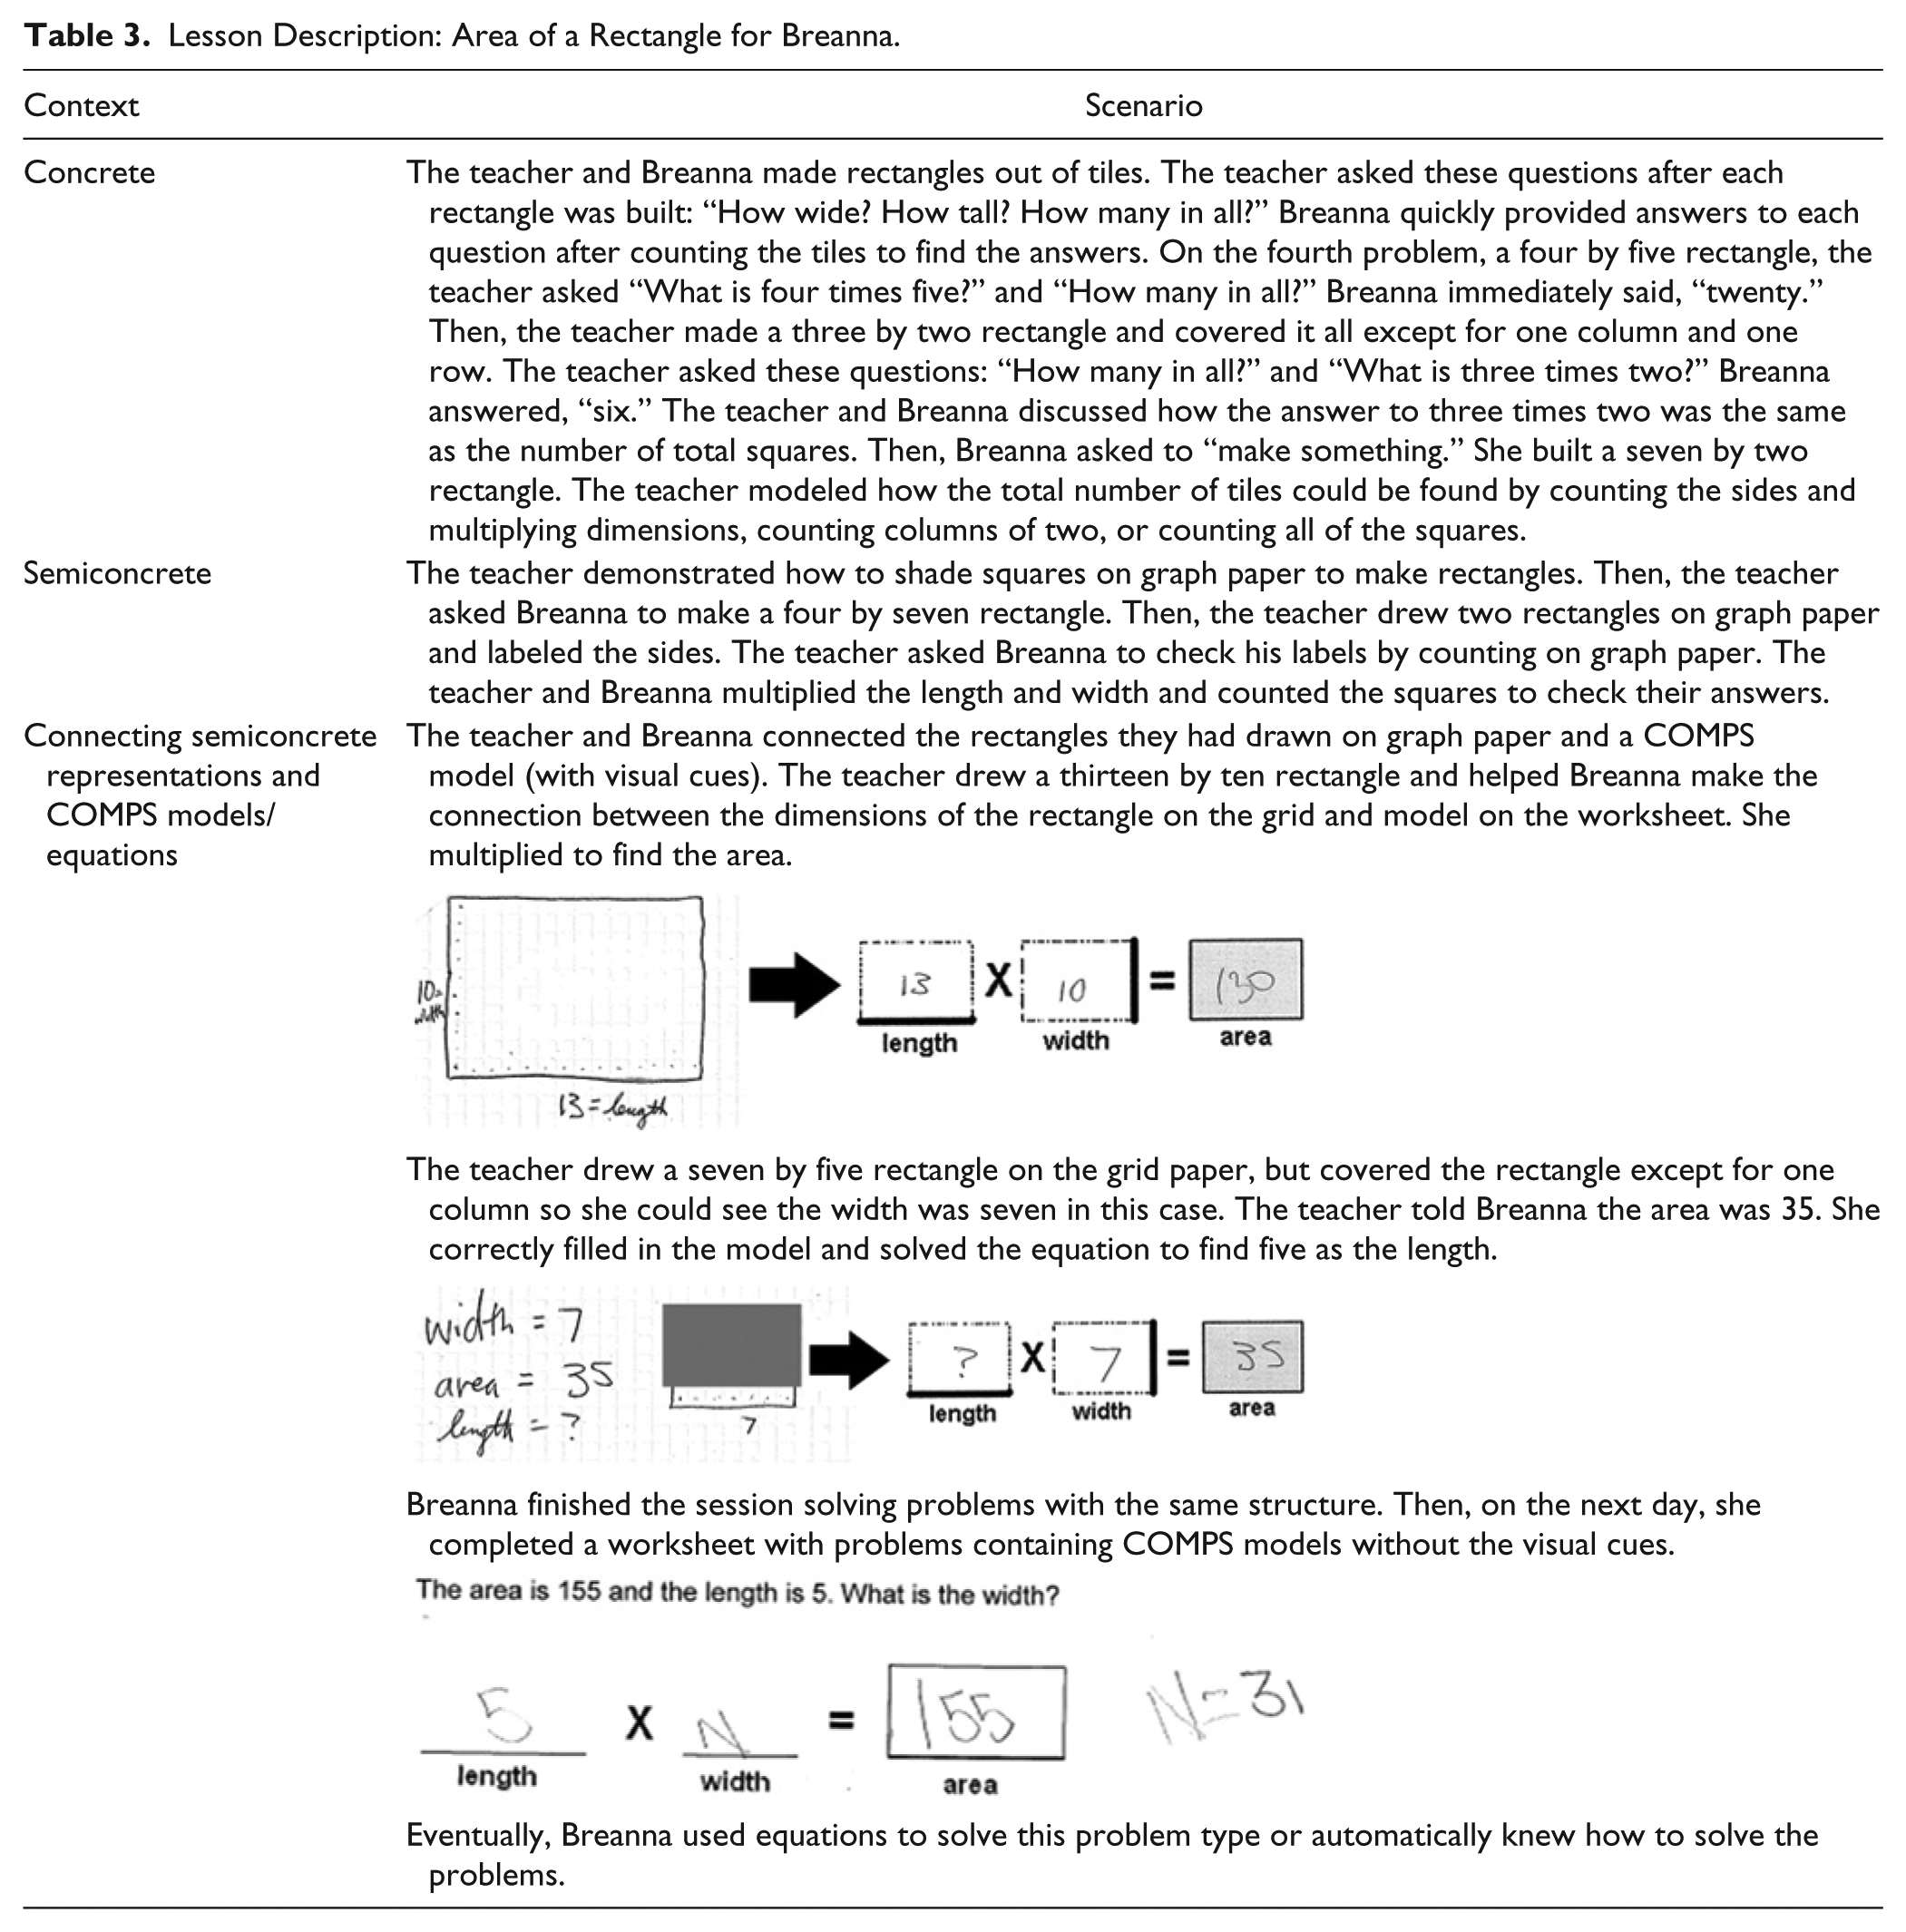
At the semiconcrete phase, students worked with drawings of figures on graph paper, rather than manipulating with concrete models, for solving area and volume problems. To this end, the teacher began to strategically connect the semiconcrete representations to abstract phases of instruction. At this stage, students were introduced to the COMPS model, that is, an abstract mathematical model (i.e., the formula) with semiconcrete visual cues built into the model (see the COMPS models listed for the “Teaching” situations in the left column of Table 2). Specifically, each variable in the formula or mathematical model was cued by semiconcrete visuals of a rectangle, for instance, with the relevant side being highlighted or the area being shaded. Students were guided to map problem elements from concrete and semiconcrete figures into COMPS models. As the participants became more proficient with a skill, the teacher transitioned from using COMPS models with more to fewer visual cues to the eventual use of formulas (see Table 2). Through blending the semiconcrete and abstract instructional phases, the COMPS model facilitated and strengthened students’ connection between the symbolic mathematical model (i.e., the formula) and the concrete and semiconcrete representations so that the abstract formula was more accessible for the students (see Table 3 for a detailed lesson description).
Lesson Description: Area of a Rectangle for Breanna.
Treatment fidelity of the intervention (i.e., the implementation of the independent variable) was documented (Horner et al., 2005; Kratochwill et al., 2012). Four independent observers conducted treatment fidelity ratings for 36% (i.e., 9 of 25) of the intervention sessions. A checklist, which contained all intervention components of the CSA + COMPS, was used to evaluate the degree to which the instruction adhered to the intervention protocol. To train the observers to identify each of the instructional components, the researchers explained this checklist with visual examples of concrete and semiconcrete models, the COMPS model with the embedded visual cues, and abstract representations such as formulas. Treatment fidelity was rated as 100% by all of the independent observers.
Results
Performance on Area and Volume Problems
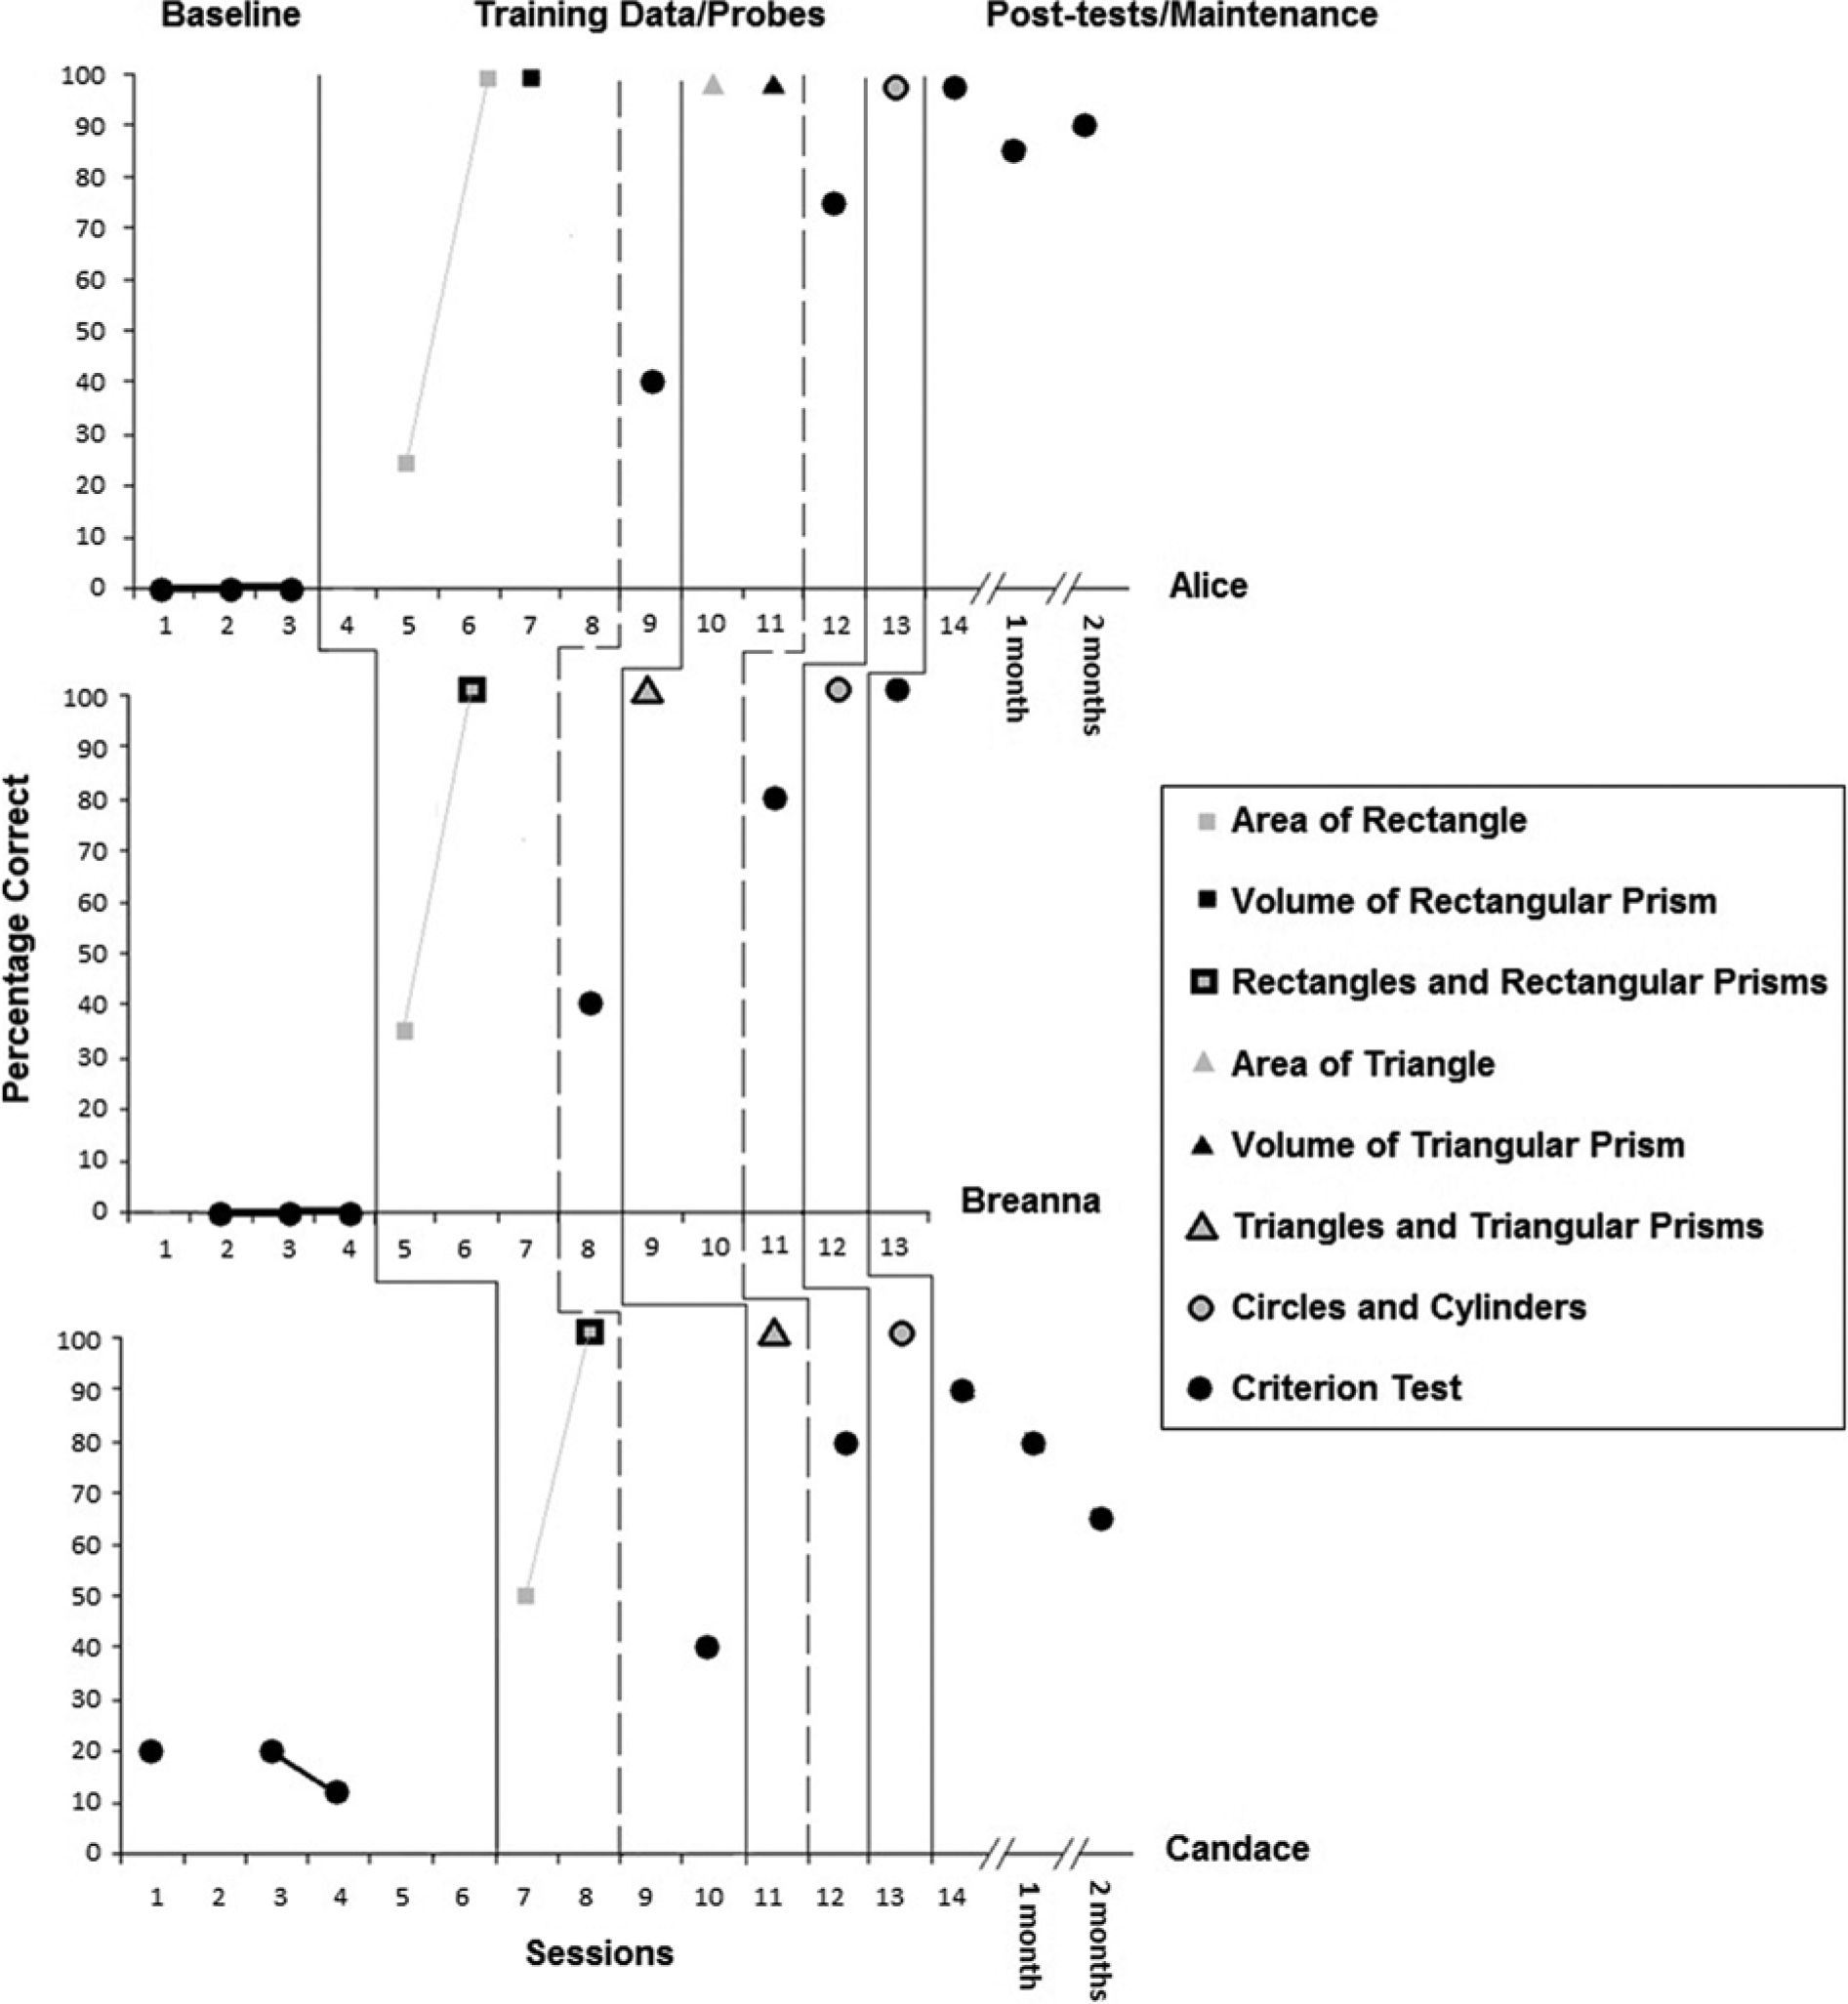
Figure 1 presents the three participants’ performances (recorded as percentage correct) on the criterion tests during baseline, intervention, and post-intervention assessment phases and on the intervention worksheets that addressed various sub-skills. Each session represents a day in a sequence of school days from the beginning of pre-testing to the end of the intervention (across all students); the only exceptions to this sequence are the maintenance sessions due to the month of elapsed time before and between these two assessment sessions. Some sessions are not marked with a data point because students were absent or because assessing on that day would have not been a reasonable educational decision (due to students’ frustration levels or stage in the learning process of new content). There were also some days during the pre-testing phase when students were available, but pre-tests were not administered because the researchers made the decision to not continue testing the students on skills they were lacking at that point in time to minimize student frustration. During the baseline phase, the median percent correct was 0% for both Alice and Breanna and 20% for Candace. Across the three participants, there was no variation in baseline trend other than a slight decrease in performance level for Candace. Alice wrote “I don’t know” on all pre-test items while Breanna added the given numbers on all of the problems. Candace attempted to multiply the given numbers on all the problems, which led to low scores in the baseline phase. The consistently low performance of the participants during the baseline phase indicated a need for the intervention.
Testing and treatment data for the participants.
During Alice’s first day of instruction, she demonstrated some growth on the basics of area of a rectangle (albeit not enough growth to warrant administration of an intervention worksheet). After two more days of instruction, Alice scored 100% on the intervention worksheets for area of a rectangle. On the next day, after a few minutes of instruction, Alice scored 100% on the intervention worksheet for volume of rectangular prisms. Breanna and Candace scored 100% for both of these problem types after two sessions of instruction. Alice and Breanna experienced some difficulty succeeding with both area of rectangle and volume of rectangular prism problems in a practice context. They both became frustrated, and the teacher chose to not assess either of those participants on those particular days. However, after a session of more practice with these skills, both Alice and Breanna scored 40% on the criterion tests; without this extra session, Candace also had a score of 40% (i.e., a 40% increase from the median scores from the baseline phase for Alice and Breanna and a 20% increase for Candace). A careful examination of student work indicated that all three participants successfully solved the area of rectangle and volume of rectangular prism problems on the criterion test. They all were incorrect on the other 60% of the problems, which had not been introduced, such as area or volume of triangular and circular figures.
Similar trends continued with subsequent problem types, but growth was more rapid. After two sessions, Alice earned 100% correct on the intervention worksheet for area of triangle and volume of triangular prism problem types. Breanna and Candace earned 100% on the same intervention worksheet after only one session. All participants got 80% correct (an 80% increase for Alice and Breanna and a 60% increase for Candace from the median scores for the baseline phase) on the criterion tests given at the end of the volume of triangular prisms session. These scores were consistent with the amount of problem types (i.e., rectangular and triangular figures) taught at that time. All students earned 100% correct on the intervention worksheets administered after one session of teaching area of circles and volume of cylinders.
During the post-testing phases, with three criterion tests distributed over two months (i.e., a month elapsed between the first and second post-tests as well as the second and third post-tests), Alice had a post-test median of 90% correct (range = 85%–100%) and Candace’s post-test was 80% (range = 65%–90%). Breanna, who was only present for one post-test, due to moving to a different school district before maintenance testing, received 100% correct on that post-test. These scores indicate a 90% increase for Alice, a 100% increase for Breanna, and a 60% increase for Candace from baseline to the post-treatment assessment.
In summary, criterion test data points indicated growth in the students’ performance after the intervention was introduced. Across the three participants, there was a clear level change from the baseline to intervention phase. The percentage of non-overlapping data was 100%. Visual analysis indicates little variability in any of the phases. There was a clear trend of improvement (i.e., increasing criterion test scores from baseline to intervention and to immediate post-intervention assessment) and a high rate of change. However, there was a notable decrease in Candace’s performance during the maintenance tests.
Social Validity
Informal interview data, pertinent to students’ attitudes toward math, indicated no notable changes other than Alice’s comparison of herself to her classmates, as a learner of mathematics, changed from “not as good” to “in the middle” after the intervention. When students were also asked whether CSA + COMPS strategies were helpful for them, Candace said all components of the intervention (i.e., building, drawing, and mapping) were helpful and asked for “harder stuff next time.” Alice said the intervention helped her in general, but indicated, specifically, that mapping was useful for her and that building and analyzing concrete models was more helpful than drawing and analyzing two-dimensional geometric figures.
The participants’ classroom math teacher indicated that CSA + COMPS strategies would be compatible with her existing teaching style and the needs of her students (in a self-contained classroom containing mostly students with MID). She indicated that she often uses manipulatives and drawings or pictures to represent abstract concepts (e.g., drawings of coins above equations in the money problem context). Her lessons typically began with group instruction of a new concept (e.g., showing procedures for solving problems often using diagrams or worked examples) and discussion of how the new concepts were connected to students’ previous knowledge and experiences. This type of instruction was followed by guided practice. The students in her class required significant one-on-one assistance with the academic material, which was provided by the teacher and two paraprofessionals. The individualized instruction often consisted of re-teaching the concepts as explained by the teacher as well as alternative explanations.
Discussion
The participants, sixth-grade students with MID, demonstrated some success with problems at a sixth-grade level, which addressed some of the state standards for area and volume at the time of the study. The participants were supported by the use of calculators, formula sheets, and visual diagrams to support their thinking while solving area and volume problems. However, the findings of this study support that CSA + COMPS was an effective instructional technique for teaching the participants in this study to solve some of the area and volume problems they are expected to solve at grade level.
The intervention was designed to provide students with a set of experiences working with concrete manipulatives and semiconcrete representations before they were expected to represent problems symbolically or abstractly (see Miller & Mercer, 1993). The foundation of understanding of the geometric figures and the relationships built during concrete and semiconcrete phases may have helped the students more effectively process, remember, and integrate the information in the problems during abstract phases of instruction and assessment (see Barrouillet, Bernardin, Portrat, Vergauwe, & Camos, 2007). When the teacher directed students to use COMPS model equations to represent mathematical ideas, the participants may have benefitted from storing and organizing information within the visual representations on paper, inherent in COMPS, so more attention could be focused on processing the concepts during problem-solving processes (Baddeley, 2003; Barrouillet et al., 2007; Schuchardt et al., 2010). Using these organizational strategies, the participants were able to break problems requiring multiple computational steps into single, manageable steps. For example, after Alice and Breanna learned how to map information from the problem in the COMPS model, they began to work through multi-step problems one step at a time; they likely had better opportunities to retain necessary information from the first step of the problem while processing the second step. Alice eventually learned to solve equations with three known factors, an unknown factor, and a known product (e.g., calculation of the base length of a triangular prism when the height of the base, height of the prism, and the volume of the prism were known). Similarly, Breanna utilized COMPS and visual representations of her computational procedures when she began to struggle with multi-step problems. For example, Breanna briefly struggled with an area of triangle problem: “A carpenter cuts a triangular piece of carpet for a room that has an area of 66 square feet. If the base of this piece of carpet is 22 feet, what is the height of this triangle?” After properly placing the problem elements in a COMPS model, she multiplied 0.5 and 22. Then, she stared at the paper and thought for a few seconds and, then, asked the teacher for help. The teacher prompted Breanna to “write down what you have done so far.” Breanna wrote 11 below her COMPS model on paper and, then, thought about her work. Then, she instantly knew to divide 66 by 11 to find the answer.
Given the success of the intervention as indicated by the immediate post-assessment data points as shown in Figure 1, it should be noted that the decrease in one student’s performance in the maintenance phase is troubling. These data indicate that follow-up instruction may be needed for students with MID when engaging in this level of mathematics. Further research is needed to explore strategies to help students with MID better maintain the skills they have learned. These students may need more experience with working with manipulatives, making connections between mathematical ideas, or discussing mathematical concepts (see NCTM, 2000).
Limitations and Implications for Future Research
There is still a need for researchers to investigate different methods to help students with MID develop stronger maintenance of learned skills. Also, a limitation of this study is that the intervention was a combination of CSA and COMPS. Future researchers may want to compare CSA with COMPS, CSA and COMPS in isolation with CSA + COMPS, and CSA + COMPS with other effective teaching strategies. Nevertheless, one unique contribution of the COMPS implemented in this study was that the semiconcrete representational visual cues were innovatively built into the abstract mathematical model, which might have played a critical role in participating students’ success in this study.
The strategic, symbolic representation of various concrete and semiconcrete representations (such as mapping the relationships of dimensions of geometric figures using diagrams and equations) present in the CSA + COMPS intervention follow some of the instructional principles of the Common Core Standards (CCSSO and NGA, 2010); however, to fully meet the challenges of Common Core Standards, students with MID will need to solve more complex problems than the problem types addressed in this study (see Partnership for Assessment of Readiness for College and Careers, 2013). Therefore, in addition to conducting further research into problem-solving strategies such as CSA + COMPS, we also recommend that researchers focus on developing interventions for students with MID that are focused on the development of deeper levels of understanding of mathematics and mathematical thinking processes specified in the Common Core Standards, such as integrating information from a variety of sources to form a conclusion, providing justification for mathematical reasoning processes, and critiquing the justification processes of others.
Footnotes
Declaration of Conflicting Interests
The author(s) declared no potential conflicts of interest with respect to the research, authorship, and/or publication of this article.
Funding
The author(s) received no financial support for the research, authorship, and/or publication of this article.