
Abstract
Teacher observations have become a national education phenomenon, mandated by federal policies and promoted by philanthropists. They are crucial components of teacher evaluation systems that often have high stakes for teachers and school systems, but have sparked little innovation. Recent calls to make teacher evaluations better, faster, and cheaper have been challenged as sitting outside the research evidence. In response, we present new evidence from experimental studies of the Rapid Assessment of Teacher Effectiveness (RATE) that suggests that innovation of that kind is possible. Using a six-item rubric after 4 hr of training, raters were able to identify effective teachers from just 20 min of one lesson as well or better than raters using popular evidence-based instruments with 10 times the items. We discuss our approach, the potential time and cost savings it may provide, and how better, faster, cheaper observation instruments may change how school districts choose to implement state and federal policies.
Teacher evaluation is under scrutiny in the United States. A study by The New Teacher Project (TNTP), which examined more than 36,000 evaluations, found that 97% of teachers were judged to be “superior” or “excellent” by school principals, raising serious questions about the accuracy and usefulness of these ratings (Weisberg, Sexton, Mulhern, & Keeling, 2009). In the year that report was published, the U.S. Department of Education allocated US$4.35 billion to a Race to the Top contest that provided substantial funding to states that improved their education systems. Two years later, the Obama administration announced it would also award waivers exempting states from some parts of the No Child Left Behind Act. A main requirement of both initiatives was that states develop new ways to evaluate teachers in relation to their students’ test scores, based on overwhelming evidence that teachers are the most important influence on student learning (e.g., McCaffrey, Lockwood, Koretz, & Hamilton, 2003; Rivkin, Hanushek, & Kain, 2000; Rowan, Correnti & Miller, 2002; Wright, Horn, & Sanders, 1997). By 2013, 35 states and the District of Columbia had made student achievement a significant, or the most significant, factor in teacher evaluations; 28 required annual evaluations of every teacher (Doherty & Jacobs, 2013). The stakes surrounding these evaluations can be high—persistent classroom ineffectiveness is grounds for dismissal in 22 states and the District. While there is a trend toward the use of multiple evaluation measures, classroom observations are nearly ubiquitous; only 6 states do not use them, alone or in combination, to evaluate teachers.
Educators do not agree on the rules for these observations: how often, whether announced, which instruments or rubrics, and who should observe (Hull, 2013). In the absence of evidence concerning the teacher evaluation approaches that best relate to student achievement, states are employing a variety of instruments, assigning various quantities of scarce resources, and putting increased strain on already overworked principals to learn complex observation methods.
There is no shortage of observation instruments on the market or available from researchers. Most assess the degree to which teachers perform according to a set of standards, such as those developed by the National Council for the Accreditation of Teacher Education (NCATE), the National Board for Professional Teaching Standards (NBPTS), the Interstate New Teacher Assessment and Support Continuum (INTASC), or various individual states such as California’s Standards for the Teaching Profession (CSTP). However, observation measures oriented toward a set of teaching standards typically do not have a primary goal of predicting student outcomes, although they are often accompanied by an underlying assumption that teachers with higher ratings will tend to help students learn more. To the extent that the instruments are predictive, it is by happy accident rather than the intentional effort of designers.
Furthermore, most teacher evaluation systems were not designed with users in mind. They tend to be complex and cumbersome, reflecting little concern for the logistical challenges they can impose. A recent follow-up report on this topic from TNTP and Student Achievement Partners (2013) suggests that changes are needed because, in addition to the problem of inflated ratings, observers are asked to do too much, observation procedures are too burdensome, and there is too little focus on feedback. TNTP authors recommend that teacher observation instruments pay more attention to lesson content and streamline rubrics to enhance focus and clarity. In a review of this report, Whitcomb (2014) doubts these suggestions will make a dent in the core problems surrounding teacher evaluations. She criticizes the TNTP report for relying mostly on anecdote and prior TNTP opinion pieces rather than “anchor[ing] its recommendations in the research literature.” (p. 3). She cautions that paring down observation rubrics may result in oversimplifying the complexities of teaching practice.
The TNTP report and Whitcomb’s review highlight one of the central paradoxes of teacher evaluation as it exists today. Currently, evidence-based observation instruments are comprehensive in their coverage of the teaching process, placing heavy demands of time and money on school systems. Simpler instruments can be faster and cheaper, but they put school systems at risk of standing outside of the research evidence. In this article, we take a first step toward resolving this paradox by providing evidence that a simpler evaluation system of the kind recommended by TNTP can indeed meet the evidence standards rightly demanded by Whitcomb and other researchers. The evidence we present comes from seven experimental validation studies of the Rapid Assessment of Teacher Effectiveness (RATE), an instrument we developed to identify successful teachers better, faster, and cheaper than current wisdom suggests is possible. Our preliminary results are encouraging, indicating that federal requirements for teacher evaluation systems may be met with substantially fewer resources while, at the same time, providing more information. Moreover, by reducing how long it takes to transform observations into information, we create new possibilities for supporting struggling teachers before students are negatively affected.
Research on the Predictive Qualities of Teacher Observation Measures
In late 2009, the Bill & Melinda Gates Foundation contributed more than US$45 million to fund the Measures of Effective Teaching (MET) project. This project was based on “two simple premises”: “First, a teacher’s evaluation should depend to a significant extent on his/her students’ achievement gains; second, any additional components of the evaluation (e.g., classroom observations) should be valid predictors of student achievement gains” (Bill & Melinda Gates Foundation, 2010, pp. 4-5).
A central component of the MET study’s design was the collection of more than 20,000 videoed lessons that would be scored by trained raters using previously developed observation instruments. The correlations of the observational scores and teacher value-added measures (VAMs) were estimated to assess how well instruments could predict student gains. In the second year of the study, some schools created class rosters and MET researchers randomly assigned the rosters to participating teachers within the same grade, allowing the researchers to determine more directly whether the students assigned to teachers identified in the prior year as more effective benefited more from their instruction. In so doing, they elevated the role of prediction in teacher evaluation, albeit by requiring prediction from existing measures rather than designing a predictive measure from scratch.
The five measures originally selected for study in the MET project were as follows: Classroom Assessment Scoring System (CLASS; Pianta, La Paro, & Hamre, 2008), Framework for Teaching (FFT; Danielson, 2007), Mathematical Quality of Instruction (MQI; Hill et al., 2008), Protocol for Language Arts Teaching Observations (PLATO; Grossman et al., 2010), and Quality Science Teaching (QST). This last measure was subsequently replaced by the UTeach Teacher Observation Protocol (UTOP; Walkington et al., 2012). All were constructed with items based on norms of good teaching, defined by a predetermined set of standards, and, in some instances, on levels of teacher content knowledge.
One challenge that MET researchers faced was the scale of the study. In particular, scoring 20,000 videos was a formidable undertaking, leading them to revise, and in some cases, shorten instruments to accommodate large-scale online scoring. These changes added to the uncertainty surrounding the performance of the instruments. Because none of them had been designed with the primary purpose of predicting student learning, there was already considerable uncertainty that they would meet this purpose at all. In fact, the limited research evidence up to that point suggested they might not.
The meager corpus of existing research on the association between these observational measures and student achievement was truly a mixed bag. Some studies considered the information observations provided on their own, others the information provided by a number of sources, including observations. Some investigated the relationship between observations and student achievement levels; others, raw gains; and still others, teacher value-added estimates, typically in the form of adjusted end-of-year test scores or year-to-year gains in scores. Some reported the associations in terms of correlations, others unstandardized regression coefficients, and still others, qualitatively. For a more comprehensive review of this research, see Strong (2011).
A number of different researchers studied a modified form of the FFT across several school sites in different states (Borman & Kimball, 2004; Gallagher, 2004; Holtzapple, 2003; Kane, Taylor, Tyler, & Wooten, 2010; Milanowski, 2004; White, 2004). Many of them are summarized in Heneman, Milanowski, Kimball, and Odden (2006). The highest correlation reported between the FFT scores and student achievement gains was .43 and the lowest was .03. It is important to note that observations often constituted only part of the FFT scores, student portfolio scores constituting the other part, making it impossible to untangle from the reported correlations how strongly observations would have correlated on their own. The reported correlations varied according to subject matter (usually reading scores had lower correlations than mathematics) and grade levels. Heneman et al. suggest that the disparate findings across sites might be due partially to variation in evaluator training and the level of consensus among teachers about what defines quality instruction.
Two studies described relationships between CLASS and student achievement among preschoolers (Howes et al., 2008; Mashburn et al., 2008). Only one of these reported correlations between the observation measure and student learning outcomes. These ranged from −.03 to .05. The authors of both studies note that these small correlations are a major limitation of their research.
One report on a pilot study of PLATO (Grossman et al., 2010) revealed that only one element of PLATO—Explicit Strategy Instruction—differentiated between teachers in the highest and lowest VAM quartiles. Overall correlations were not reported. The authors concluded that high quartile teachers “had a different profile of instructional practices” from the low quartile teachers. Apart from the relationship reflected in this rather general statement, the researchers were not able to draw any more concrete conclusions about the ability of PLATO to distinguish the more from the less effective teachers, as defined by their value-added scores. They acknowledge that even the element of Explicit Strategy Instruction occurs rarely, and the mean scores for this element were the lowest of all elements except for English Language Learner accommodations. PLATO, they offered, is “far from perfect” (Grossman et al., 2010, p. 27).
Hill, Kapitula, and Umland (2011) reported on an examination of the link between teacher value-added estimates and MQI scores. Their goal was to see whether value-added rankings reflected good teaching rather than to test whether their observation measures predicted VAM. This assumes the validity of the observation measures and questions the validity of VAM, rather than using VAM to gather validity evidence for MQI. They found correlations ranging from .30 to .56. The magnitude of the correlation and whether it reached statistical significance depended on the type of model used and the controlling variables it included. Interestingly, they did not report a correlation for a model that controlled for all variables at the same time. With their focus on testing VAM as a viable method for use in high stakes decisions about teachers, they conclude that value-added scores on their own are not sufficient for identifying teachers for reward, remediation, or removal.
Overall, the correlations were either small to nonexistent, used teacher evaluation scores based on more than observations, or were sensitive to the choice of value-added model yet did not include results for models that controlled for all available covariates. These results might provide a rough point of comparison for our efforts, but they were inappropriate as formal benchmarks. Consequently, we turned our attention to the MET study, which evaluated these instruments and reported comparable results for each. This allowed us to establish benchmarks for correlations, interrater reliability, and average distance between high and low quartile groups, and to estimate comparable values for RATE using similar methods.
RATE
FFT, CLASS, PLATO, MQI, and UTOP were each designed to reflect a broad set of standards for good teaching. Accordingly, they are comprehensive, multidimensional, and lengthy, containing as many as 76 items. “These instruments are not checklists, focusing on easy-to-measure but trivial aspects of practice,” according to the MET study authors who evaluated them. “They require training and judgment on the part of observers” (Kane & Staiger, 2012, p. 4). Although this may be an accurate description of the instruments, it is not a given that all useful observational instruments must have these features. Could we not develop an instrument that focuses on easy-to-measure and informative aspects of practice? An instrument that requires little training and judgment? In fact, could we not innovate the way we make observations so that they are more informative, cheaper, and faster than current instruments?
That is what we set to do with the RATE Project, and our approach has been ruthlessly empirical. Every step of development has included experimental pilot tests, we have reported the results of every test as they became available, and we benchmarked our results against previously published results, most notably those of the MET study. We found that by using shorter segments of instruction, fewer observations, less training, and a smaller number of simpler scoring criteria than in previously evaluated instruments, we were able to generate scores that were consistently more reliable, predictive, and inexpensive.
Unlike other observation instruments, RATE was designed from the beginning to predict the ability of teachers to raise the achievement of their students. We started by establishing how well judges from a variety of backgrounds, using either intuitive judgments or an observational instrument supported by research evidence, could identify teachers of high and low effectiveness (Strong, Gargani, & Hacifazlioğlu, 2011, referred to here as SGH). In every case, judges did no better than chance. However, judges tended to agree on which teachers they believed were effective. This result and past research (Strong, 2009, 2011) led us to hypothesize that judgments of teacher effectiveness may be biased by irrelevant personal preferences, regardless of the background of the judge, and that current observational instruments may not control for these biases adequately. Minimizing preconceptions might allow raters to identify effective teachers more accurately with less cumbersome rubrics, shorter training, and faster scoring procedures.
The Rubric
The latest version of RATE consists of six items relating to the lesson objective, instructional delivery mechanisms, teacher questioning strategies, clarity of presentation of concepts, time on task, and level of student understanding. Each item is rated on 3-point scale, and judges are encouraged to jot down notes to support their scores. We should emphasize that we do not claim that six items define good teaching. Rather, that we set out to test if six well-chosen items are sufficient to predict one important consequence of good teaching—increases in student learning of the sort that will be reflected on subsequent standardized tests. We also believe that this information may provide a basis for further diagnostic analysis that can aid in teacher development and support.
Validation Studies
To date, we have conducted seven experimental validation studies of RATE in which teams of raters scored videos of math instruction provided by teachers in Grades 3 to 8. We present each validation study, grouping them by the sample of teachers who were videoed and later viewed by raters. We created conditions in later studies that made successfully scoring the videos more difficult, our philosophy being that experimenters should try to make an effect disappear in their attempt to establish that it exists. By doing so, we believe that we informed the development of the instrument more fully, helped ensure that the resulting instrument is as robust and reliable as possible, and produced validity evidence of greater credibility.
Validation Study 1
Video Data Set 1
Raters viewed videos of six teachers providing a complete math lesson. Short clips drawn from the same videos were used in SGH Experiment 1. A short clip of a seventh teacher was included in the prior experiment; however, the full-length video from which it was excerpted failed to capture the entire lesson and was not included here. The teachers in the videos worked in a California school district in Grades 3 to 5 and were selected based on measures of prior effectiveness. Four had VAMs that were at least 0.5 standard deviations above the district’s average for each of the prior 3 years, designated the high VAM group. The remaining two had VAMs that were at or below the district’s average for each of the prior 3 years, designated the low VAM group. We later learned that the teachers fell into the same high and low groups for the year in which they were videoed, suggesting the validity of the groupings and establishing a minimum difference between high and low teachers in the study year of 0.5 standard deviations.
Raters
The two raters were undergraduate research assistants with no teaching experience or education background. They received one 2-hr training session that included an introduction to RATE with a discussion about each item in the rubric, followed by a group viewing of a video to practice the rating process, which also lasted approximately 2 hr. The training video was not part of the experiment. The research assistants then completed the rating procedure according to the protocol.
Rubric
Version 1 of the rubric comprised 11 items. Two of the behaviors that were not observed in most classrooms were omitted when we began our analysis. Each of the 9 remaining items was scored on a 3-point scale that represented whether the behavior was present, absent, or somewhere in between.
Scoring
We used a blind scoring procedure, ensuring that raters had no information about the teachers other than the videos they viewed. In particular, raters had no information about student portfolios, standardized test scores, VAMs, or other potential measures of teacher effectiveness. The videos were randomly ordered and raters scored them independently. Periodically, they compared their independent scores, discussed differences, and worked together to construct a common revised score—the RATE score. The RATE scores were ranked, and the four teachers with the highest RATE scores were classified as being high VAM teachers.
Results
Classification
Given the results of the SGH baseline experiments, our null hypothesis was that raters would do no better than chance at classifying teachers into high and low VAM groups. The raters’ common revised scores correctly classified 100% of the teachers. While the unintended asymmetry in high and low groups was not ideal, the probability of classifying all teachers correctly by chance is only .067, as estimated with a permutation test (Ernst, 2004). The probability is interpreted as a one-tailed p value, and given the limited number of high and low teachers in Video Data Set 1, it is the smallest p value that can be obtained.
Interrater reliability
We defined interrater reliability as the proportion of variance in RATE scores attributable to variation in the true, underlying effectiveness of teachers, which is how Shrout and Fleiss (1979) defined it with the intraclass correlation they referred to as ICC(2,k). The number in parentheses refers to their “Case 2,” in which there are multiple raters, each rater scores every teacher, and the raters are considered a random sample from a larger population as opposed to the sole group of interest. The k refers to the number of raters providing scores for the same teacher. ICC(2,1) is computed using a two-way random effects model in which teachers and raters are treated as random. As described by the Spearman–Brown formula, when raters produce scores that are positively correlated with each other, increasing k attenuates error and nuisance variance, thus increasing the proportion of the total variance attributable to underlying differences in the effectiveness of teachers. This is important because our purpose is to differentiate teachers according to their underlying effectiveness.
We benchmarked our ICC(2,k) estimates against the variance components reported by the MET study researchers (Kane & Staiger, 2012, Table 11, p. 35). They defined interrater reliability as we have, estimated it with comparable models, and accounted for changes in k (what they called implied reliability) in an equivalent manner. It is important to note that the MET study researchers set out to attribute variance to factors other than teachers and raters, including the variance in lessons taught by the same teacher, sections of the same subject taught by the same teacher, and multiple short segments of instruction within each video. To do so, they assigned different raters to different lessons, and where possible, different sections, such that multiple scores for one teacher incorporated variation by lesson, teacher, rater, and (sometimes) section (variance at the segment level was incorporated at the video level). When the MET study researchers estimated the proportion of variance between teachers, they controlled for the other sources of variance. We controlled for teachers and raters only. Our method for estimating reliability is essentially their method applied to fewer sources of variance.
The maximum proportions of between-teacher variance reported by the MET study using observational scores based on 1, 2, and 4 independent ratings were .37, .53, and .67, respectively (Table 1). The MET researchers used four independent ratings per teacher to produce their teacher-level observational scores. We used two.
Proportion of Between-Teacher Variance Explained by Observational Scores for RATE Validation Study 1 and those Reported by the MET Study.

Source. Kane and Staiger (2012, reported in Table 11, p. 35).
Note. MET = Measures of Effective Teaching; RATE = Rapid Assessment of Teacher Effectiveness
The ICC(2,1) and ICC(2,2) estimates for the independent RATE scores (not the common revised scores) were .50 and .66, respectively, well above the range reported by the MET study (Table 1). Moreover, the proportion of between-teacher variance explained by two independent RATE scores was equivalent to the maximum variance explained by four independent scores from the instruments evaluated by the MET study. The estimated proportion of variance that could be explained by four independent RATE scores is .89. In our case, raters may have had an advantage because teachers were separated by at least 0.5 standard deviations. Nonetheless, it is an encouraging piece of evidence that suggests that a simpler, more efficient observational tool may be able to provide more information about teacher effectiveness.
Validation Studies 2, 3, 4, and 5
Video Data Set 2
The following four studies used videos of eight teachers. We used short clips excerpted from them in SGH Experiments 2 and 3. The teachers in the videos worked in a Tennessee school district in Grades 3 to 5 and were again selected based on measures of prior effectiveness. Four had VAMs that were at least 0.5 standard deviations above the district’s average for each of the prior 3 years, designated the high VAM group. The remaining four had VAMs that were at least 0.5 standard deviations below the district’s average for each of the prior 3 years, designated the low VAM group. We later learned that the teachers fell into the same high and low groups for the year in which they were videoed, establishing a minimum difference between high and low teachers in the study year of 1.0 standard deviations—twice the minimum span separating teachers in the first data set. We began this series of studies by having raters view complete math lessons lasting about 45 min each. Starting with Validation Study 4, we reduced what raters viewed to clips of the first 20 min of instruction.
Raters
Validity Studies 2 and 3 used the same pair of raters as Study 1. Validation Study 4 used a new pair of raters consisting of a professional who had experience with other rating systems and a new undergraduate assistant with no prior experience. For Validation Study 5, we recruited six teachers of science in middle school, high school, and college. They had some recent experience observing and rating science instruction using another instrument, were experienced science instructors, and had facility with math. However, they were neither math instructors nor experts in math education. Thus, they more closely reflected the raters we would expect to find in real-world settings.
Rubric
Over the course of these studies, we modified the rubric twice based on what we learned. Version 2 included refinements of the nine remaining items, and we used it for the first time in Validity Study 3. Following this, we reduced the number items to six, eliminating items that were not strongly correlated with VAM, expanding upon those that were, and modifying items to make their wording and requisite judgments simpler. The result was Version 3, which we used starting with Validity Study 4.
Scoring
We changed the scoring procedure described above to improve its efficiency. Starting with Validity Study 4, after discussing similarities and differences in their independent scores, raters were now asked—but not required—to revise their own scores should they be persuaded by the discussion. The two revised scores for a pair were later averaged by the researchers to produce the RATE scores. As before, the RATE scores were ranked, and the four teachers with the highest ranks were the ones identified as belonging in the high VAM group. For Validity Study 5, the six raters were randomly assigned to one of three pairs. Each pair worked together as described above and raters were not permitted to discuss their scores with those in other pairs.
Results
Classification
In Validation Studies 2, 4, and 5, the RATE scores correctly classified 75% of the teachers in the high and low VAM groups. In Validation Study 3, the raters were asked to re-score the same videos in order to pilot test Version 2 of the rubric. The resulting RATE scores correctly classified 100% of the teachers. Excluding the re-score, the probability that five independent groups of raters would correctly classify 75% or more of the teachers by chance, as estimated with a permutation test, is .001 (Table 2).
Percentage of Correct Classifications of High and Low VAM Teachers From RATE Validation Studies 2, 4, and 5.

Note. RATE = Rapid Assessment of Teacher Effectiveness; VAM = value-added measures.
Probability that five independent pairs of raters correctly identified 75% or more of teachers by chance as estimated with a permutation test.
Interrater reliability
With each pair of raters considered separately, ICC(2,1) reliabilities for independent scores ranged from .31 to .75 (Table 3). This is at the top or above the MET study’s range of .14 to .37. Our most accurate reliability estimates are based on the combined scores of the eight raters in Validation Studies 4 and 5—all those using Version 3 of the rubric. This yields an ICC(2,1) estimate of .40 and an ICC(2,4) estimate of .73, both above the MET study’s range.
Interrater Reliability Estimates for Validation Studies 2 Through 5.
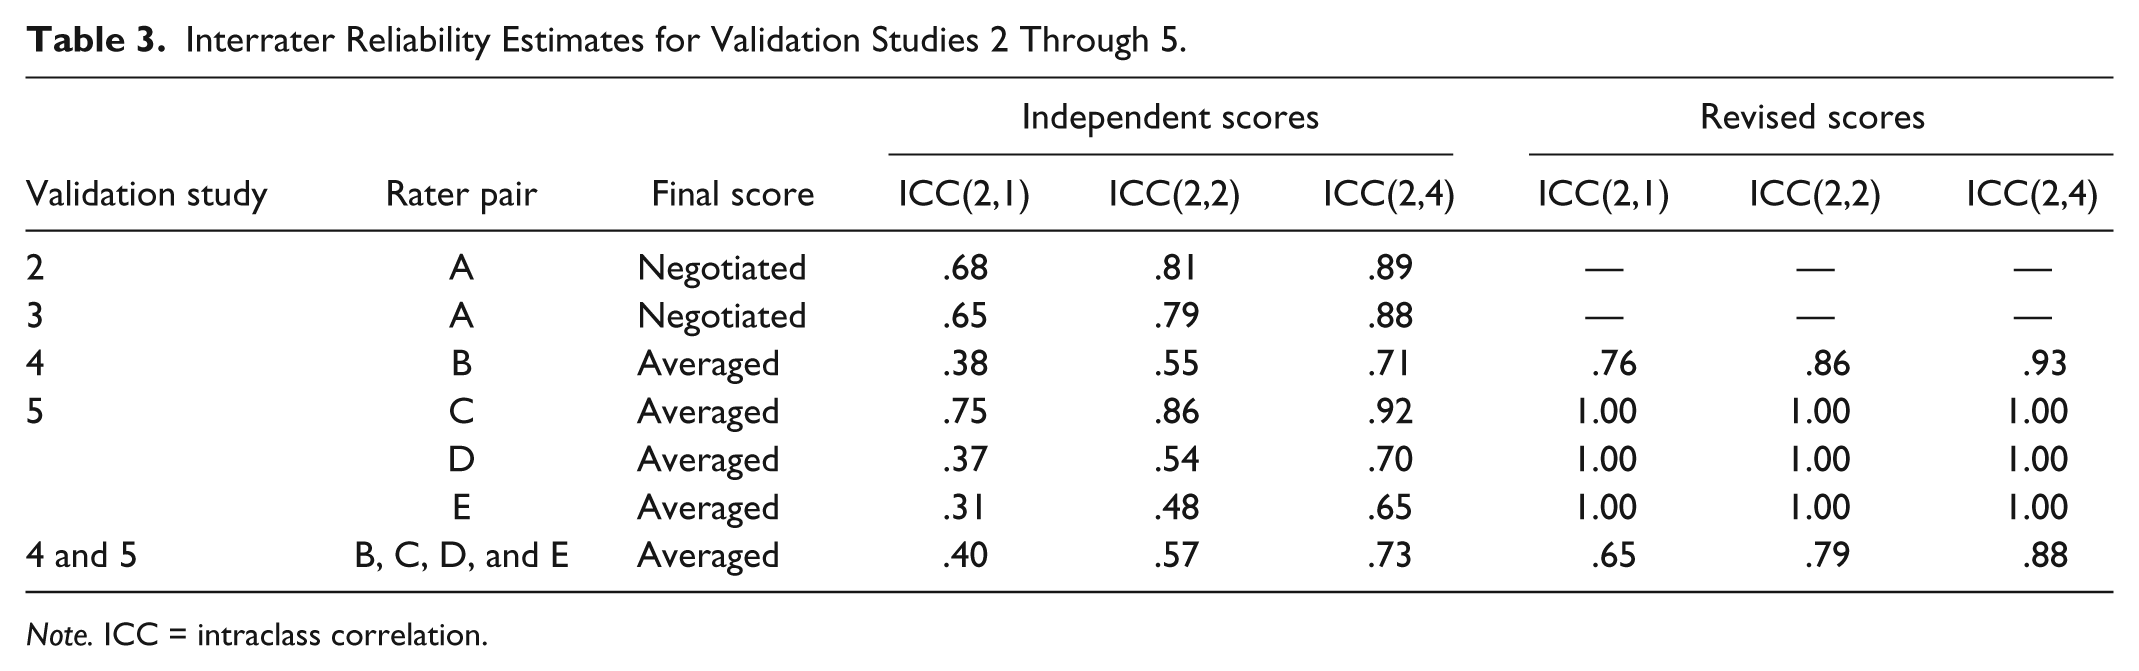
Note. ICC = intraclass correlation.
When we consider the revised scores of each pair of raters separately (only available for Validation Studies 4 and 5), the ICC(2,1) estimates range from .76 to 1.00. Estimating this value across the eight raters in Validation Studies 4 and 5 yields .65. This is greater than the maximum proportion of variance explained by four raters in the MET study. Again, our raters may be at an advantage because teachers in high and low groups are separated by at least 1.0 standard deviations on VAMs, but it suggests that a simpler rubric combined with a process of reconciling scores may produce more information.
Validation Studies 6 and 7
Video Data Set 3
The teachers in these 27 videos taught in Grades 3 to 8 in the same Tennessee school district as before. However, these videos were newly collected for our validity studies using (with one exception) teachers who were not included in the previous video data set. We used no criteria when selecting the teachers other than their willingness to participate; thus, we imposed no minimum difference between the VAMs of teachers above and below the district’s average. We later learned that 12 of the teachers had below average VAMs in the year they were videoed; they were designated as the low VAM group and the remaining 15 teachers were designated as the high group. We also learned that the minimum difference between teachers in the high and low groups was only 0.14 standard deviations, requiring raters to discern small differences among teachers in the so-called messy middle—perhaps the most challenging task facing raters in real-world settings.
Raters
The raters in Validation Study 6 included one from Validation Study 4 plus two other research assistants, both of whom worked as educational researchers (one with a graduate degree, the other with an undergraduate degree). The six raters in Validation Study 7 were the same as those in Validation Study 5.
Rubric
We used Version 3 of the rubric in both experiments.
Scoring
As before, raters viewed clips of the first 20 min of a math lesson taught by each teacher. In Validity Study 7, however, rather than forming static pairs of raters that rated all the clips together, we formed new pairs of raters for every video. Our intention was to foster a continuous social process of self-calibration in which raters were able to check their understanding of the rubric with each new partner. This was accomplished by establishing a fixed rotation of raters to three viewing stations. The rotation formed every possible pair of raters in sequence, and raters were randomly assigned to a starting position in the rotation. As before, independent scores were discussed and revised by raters within pairs. Raters, however, were not prevented from discussing their scores with those in other pairs. Each viewing station played the videos in a different order, ensuring that a video of the same teacher was not played on more than one station at the same time. Raters were allowed no more than 30 min to view the 20-min clip, record their independent score, discuss differences with their partner, and record their revised scores.
Results
Classification
The 27 teachers in the videos were divided into 12 low VAM and 15 high VAM teachers (those below and above the district’s average for that year). The RATE scores in Validation Study 6 (the average of the three revised scores) correctly classified 21 of the 27 teachers (78%) into these groups. The RATE scores in Validation Study 7 (the average of the six revised scores) correctly classified 19 of 27 (70%). The probabilities of achieving these results by chance (the one-tailed p value from a permutation test) are .006 and .045, respectively. The conservative joint probability—the probability that two independent studies would correctly classify 70% or more of teachers by chance—was .002. Thus, we can reject the null hypotheses of chance ratings that we established in SGH (Table 4).
Percentage of Correct Classifications of High and Low VAM Teachers From RATE Validation Studies 5 and 6.
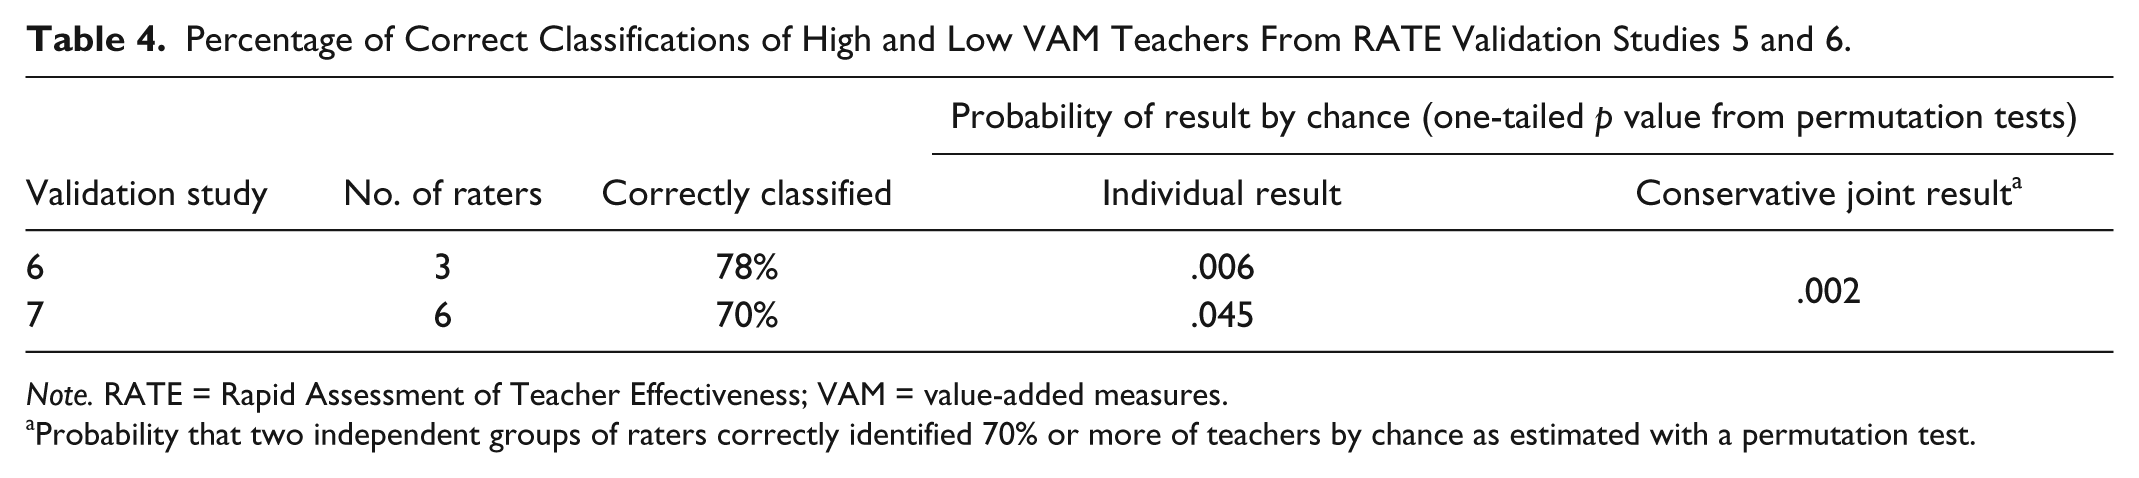
Note. RATE = Rapid Assessment of Teacher Effectiveness; VAM = value-added measures.
Probability that two independent groups of raters correctly identified 70% or more of teachers by chance as estimated with a permutation test.
Correlations
We compared our estimated correlations with two benchmarks reported by the MET study researchers: (a) the correlation of observational scores with the “stable component” of teacher effectiveness and (b) the correlation of observational scores with value-added measures in a single year. The stable component is a teacher’s expected contribution to student learning, and it is assumed to remain relatively constant over a period of at least a few years. This is analogous to a true score in classical test theory. Measures of teacher value added in a single year are noisier, yielding lower correlations.
The MET study estimated these correlations in two ways (see Table 5). To promote the comparability of our estimates, we approximate their methods. Mihaly, McCaffrey, Staiger, and Lockwood (2013) estimated the stable component, referred to as SVA for stable value added, using a maximum likelihood procedure applied to multiple measures of teacher effectiveness (details are provided in the appendix of Mihaly et al., 2013). The researchers then estimated the correlation of observational scores with the SVA estimates. We multiplied these correlations by .707, the square root of the reliability of SVA they reported, to estimate the correlation we would expect to find between observational scores and value-added scores in any single year (which we refer to as “Any” in Table 5).
The Correlation of Observational Scores and Teacher Value Added in Elementary Math From MET Study Reports.
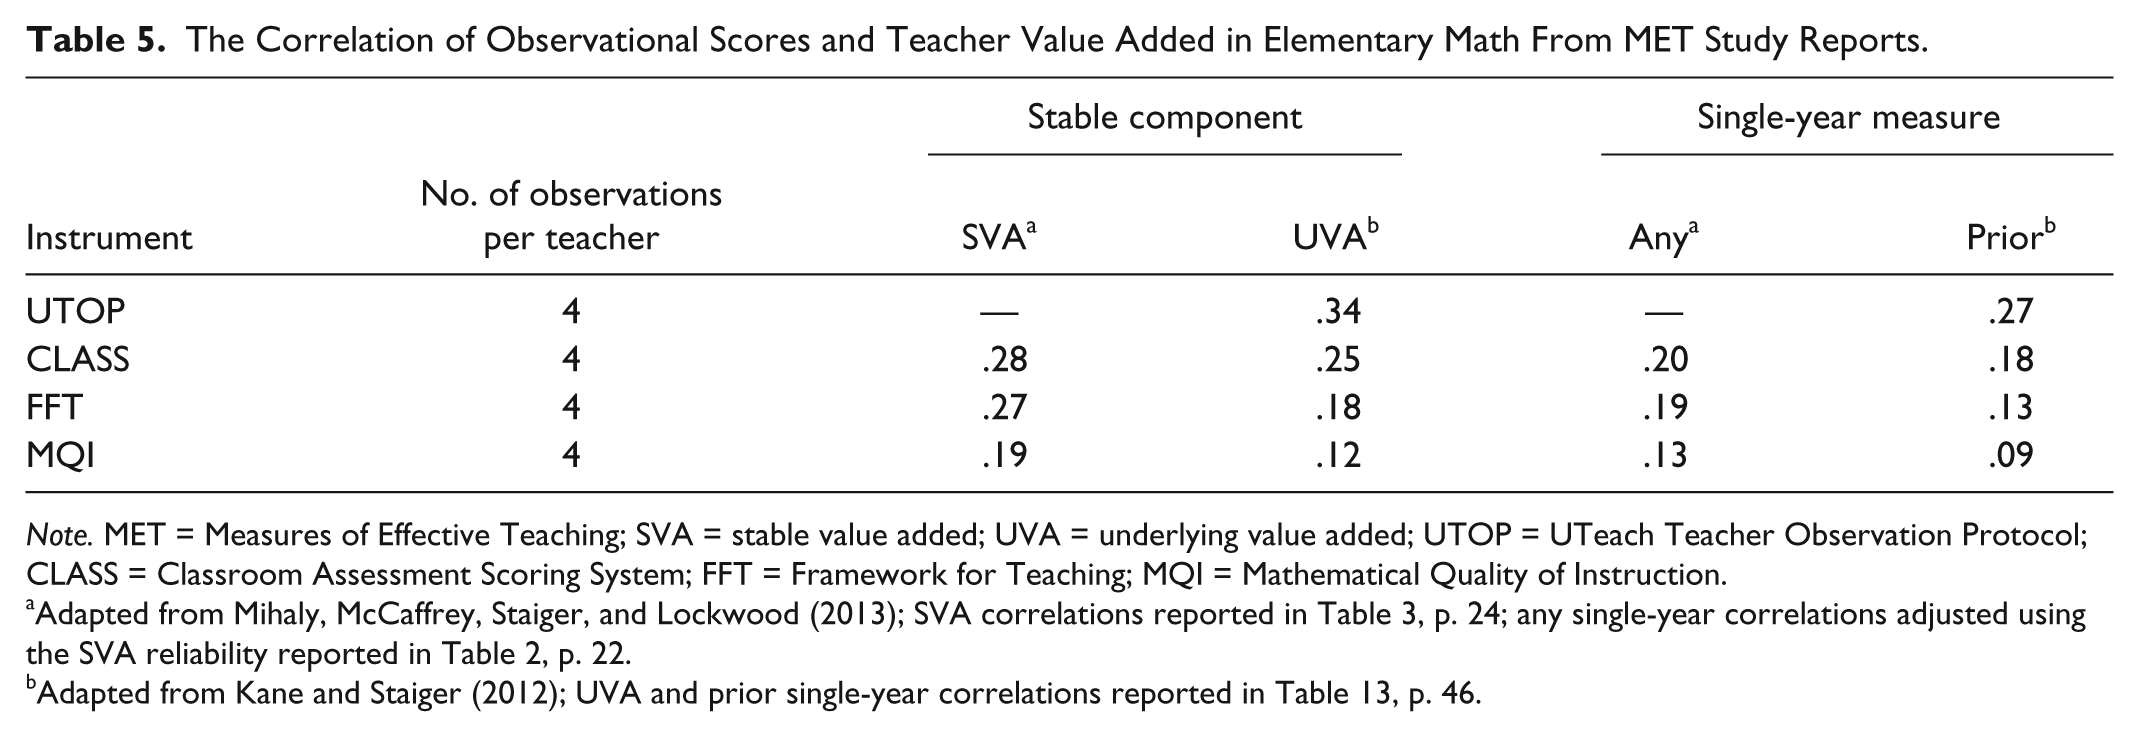
Note. MET = Measures of Effective Teaching; SVA = stable value added; UVA = underlying value added; UTOP = UTeach Teacher Observation Protocol; CLASS = Classroom Assessment Scoring System; FFT = Framework for Teaching; MQI = Mathematical Quality of Instruction.
Adapted from Mihaly, McCaffrey, Staiger, and Lockwood (2013); SVA correlations reported in Table 3, p. 24; any single-year correlations adjusted using the SVA reliability reported in Table 2, p. 22.
Adapted from Kane and Staiger (2012); UVA and prior single-year correlations reported in Table 13, p. 46.
Kane and Staiger (2012, Table 13, p. 46) went about this the other way around. First, they estimated the correlations of observational scores with value-added measures in a single year. (We use their correlations with prior year VAMs, referred to as “Prior” in Table 5, because they contained the largest values they reported.) The MET study researchers then divided the single-year correlations by the square root of the reliability to estimate the correlation of the observational measures with the stable component. They estimated the reliability as the correlation of VAMs from one year to the next, and found its square root to be approximately .69. They referred to the resulting disattenuated correlation as the correlation with the underlying value added (UVA in Table 5). The two estimation approaches yielded similar values and we use their ranges as our benchmarks. For correlations with single-year measures, the range is .09 to .27. For correlations with the stable component, which include both SVA and UVA estimates, the range is .12 to .34.
Approximating Mihaly et al., we modeled the stable component of the VAMs provided through the Tennessee Value-Added Assessment System (Sanders & Horn, 1994). We included all the teachers who instructed Grades 3 to 8 in the district and had at least one VAM for the current year—a total of 116 teachers. We also include VAMs from up to 2 prior years. Because each VAM is based on test scores from 2 consecutive years, our estimates incorporated up to 3 previous years of scores, like those of Mihaly et al. We treated the VAMs as repeated measures within teachers. However, each measure could relate to one of four academic subjects—math, English language arts, science, and social studies. We estimated the stable components for all subjects simultaneously using a multivariate, measures-within-teachers, variance-known hierarchical linear model (Raudenbush & Bryk, 2002). The stable components were treated as four potentially correlated random effects, and the corresponding teacher-level residuals (empirical Bayes’s estimates) were taken as the stable component estimates. We took this simultaneous estimation approach in an effort to incorporate all the available information about teacher effectiveness and promote the reliability of our stable component estimate. The correlations of RATE scores with the stable component for math are given in Table 6 under the column labeled “SVA.” Corresponding single-year correlations are given in the column labeled “Any.”
Correlations of RATE and VAM.
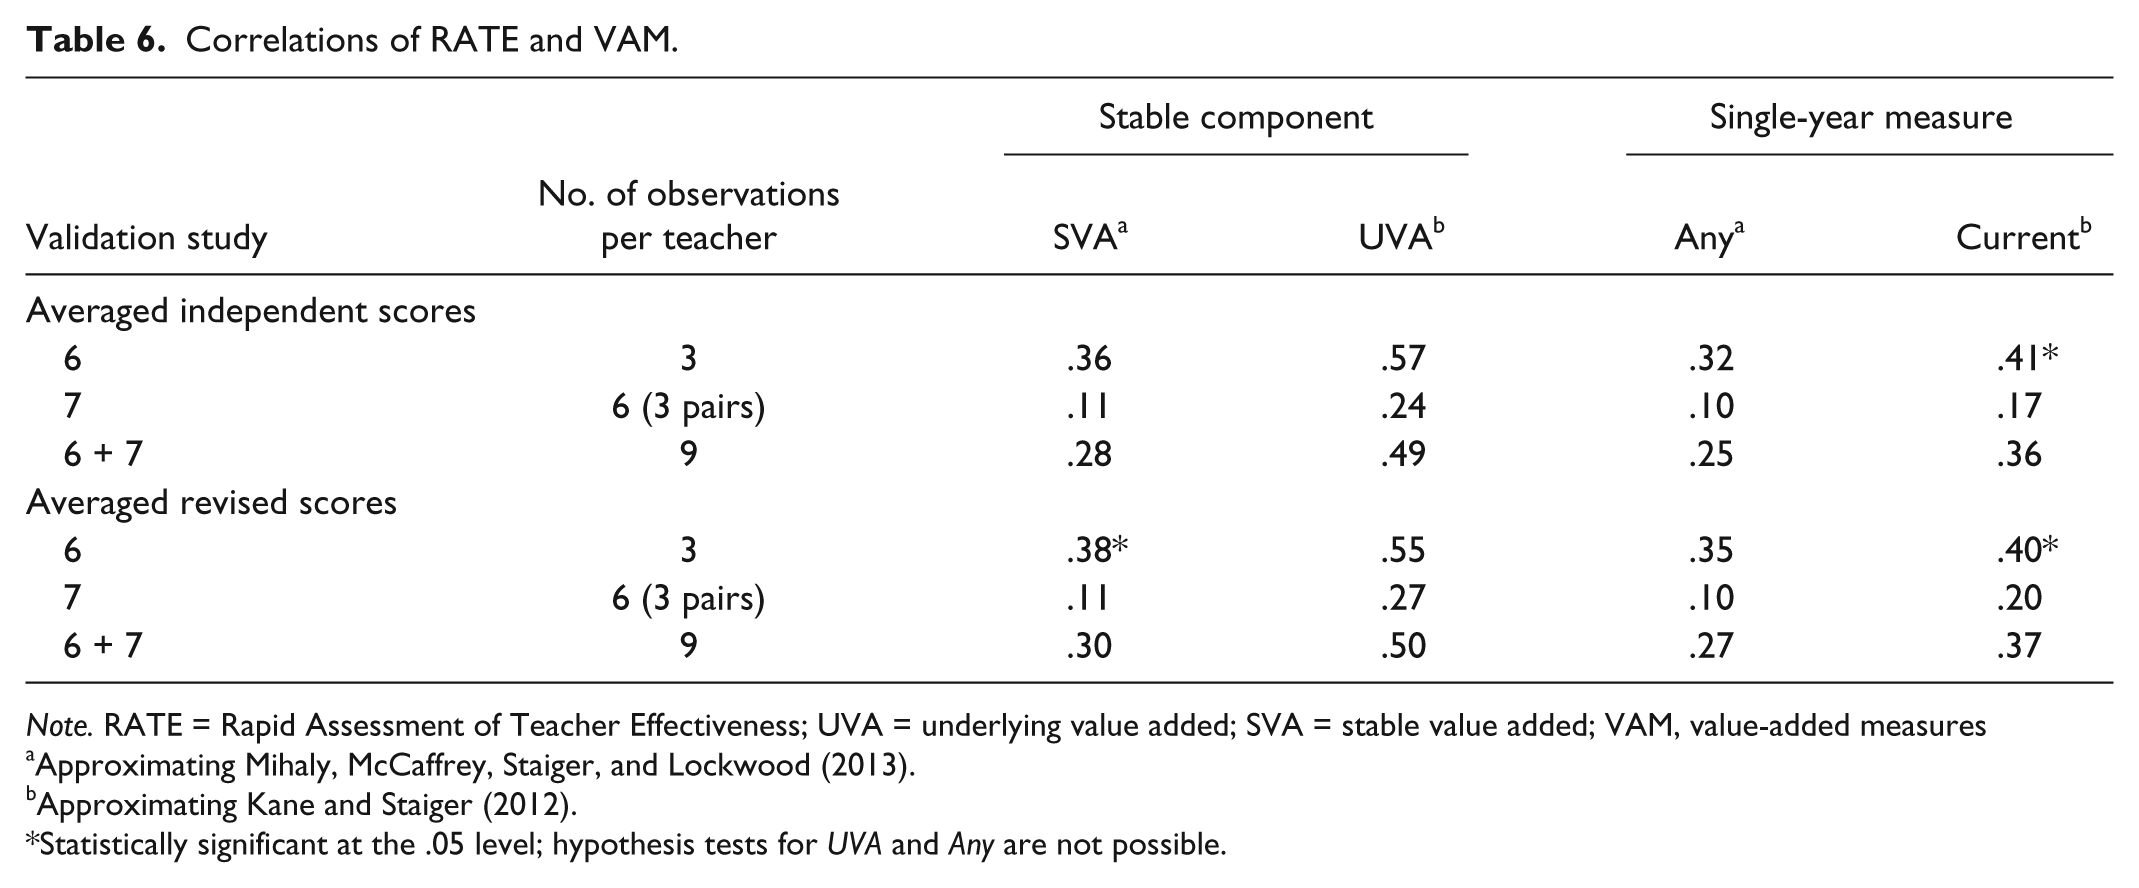
Note. RATE = Rapid Assessment of Teacher Effectiveness; UVA = underlying value added; SVA = stable value added; VAM, value-added measures
Approximating Mihaly, McCaffrey, Staiger, and Lockwood (2013).
Approximating Kane and Staiger (2012).
Statistically significant at the .05 level; hypothesis tests for UVA and Any are not possible.
Correlations of averaged independent scores with the stable component were .36 and .11 for Validation Studies 6 and 7, respectively. Correlations with the revised scores were .38 (statistically significantly different from 0) and .11, respectively. These are equivalent to or slightly higher than the benchmark values. Combining the RATE scores from the two studies using equal weights may provide a more stable observational score. Doing so allows us to establish with more certainty whether a correlation exists, yielding correlations of .28 and .30 for independent and revised scores, respectively. These estimates are at or above the top of the benchmark range. The estimated correlation of RATE scores with VAMs in any single year ranges from .10 to .32 for independent scores and .10 to .35 for revised scores, based on a reliability of .823 as estimated by fitting the hierarchical linear model with the HLM software package (Raudenbush, Bryk, & Congdon, 2008; Raudenbush & Bryk, 2002, p. 46).
Following Kane and Staiger, we estimated the correlations of the averaged independent and revised RATE scores with value-added measures from a single year—in our case, the same year in which the observations were made—which are labeled “Current” in Table 6. In Validation Study 6, the correlation with independent scores was .41, and with revised scores, it was .40—well above the highest benchmark value of .27. Both estimates were statistically significantly different from 0 at the .05 level. In Validation Study 7, the correlations with independent and revised scores were .17 and .20, respectively. These are as good as or better than the MET benchmark values. Again, combining the RATE scores from the two studies using equal weights may provide more reliable RATE estimates, and doing so yields correlations of .36 and .37 for independent and revised scores. These estimates are above the range of the benchmarks, but they are just outside the cutoff for statistical significance (p = .068 and .061 respectively based on an F test).
We estimated correlations with UVA by dividing the single-year correlations by .721, the square root of the estimated reliability of the VAMs (that is, the square root of the correlation of our VAMs from one year to the next). Statistical tests for these adjusted correlations are not possible. For Validation Study 6, the correlations with independent and revised scores were .57 and .55, respectively. For Validation Study 7, they were .24 and .27, respectively. These fall in and above the range of benchmark values. For the combined scores, correlations were .49 and .50, which are above the benchmark range.
Quartile differences
The MET study reported differences between the average VAM of teachers in the top and bottom quartiles of observational scores, where each score was based on four ratings per teacher. The largest difference reported was 0.11 standard deviations. RATE scores obtained differences of 1.12 and 0.59 standard deviations in Validation Studies 6 and 7, respectively. The former was achieved by averaging three revised scores per teacher, and the average difference between top and bottom quartiles was statistically significant at the .05 level. The latter was achieved by averaging six scores per teacher and was not statistically significant. To establish that the RATE scores could separate teachers in top and bottom quartiles, we combined the scores from the two studies with equal weights. This resulted in a difference of 1.11 standard deviations, which was statistically significant at the .05 level (see Table 7).
Average Difference in VAM Between Teachers in Top and Bottom Quartiles of RATE Scores.
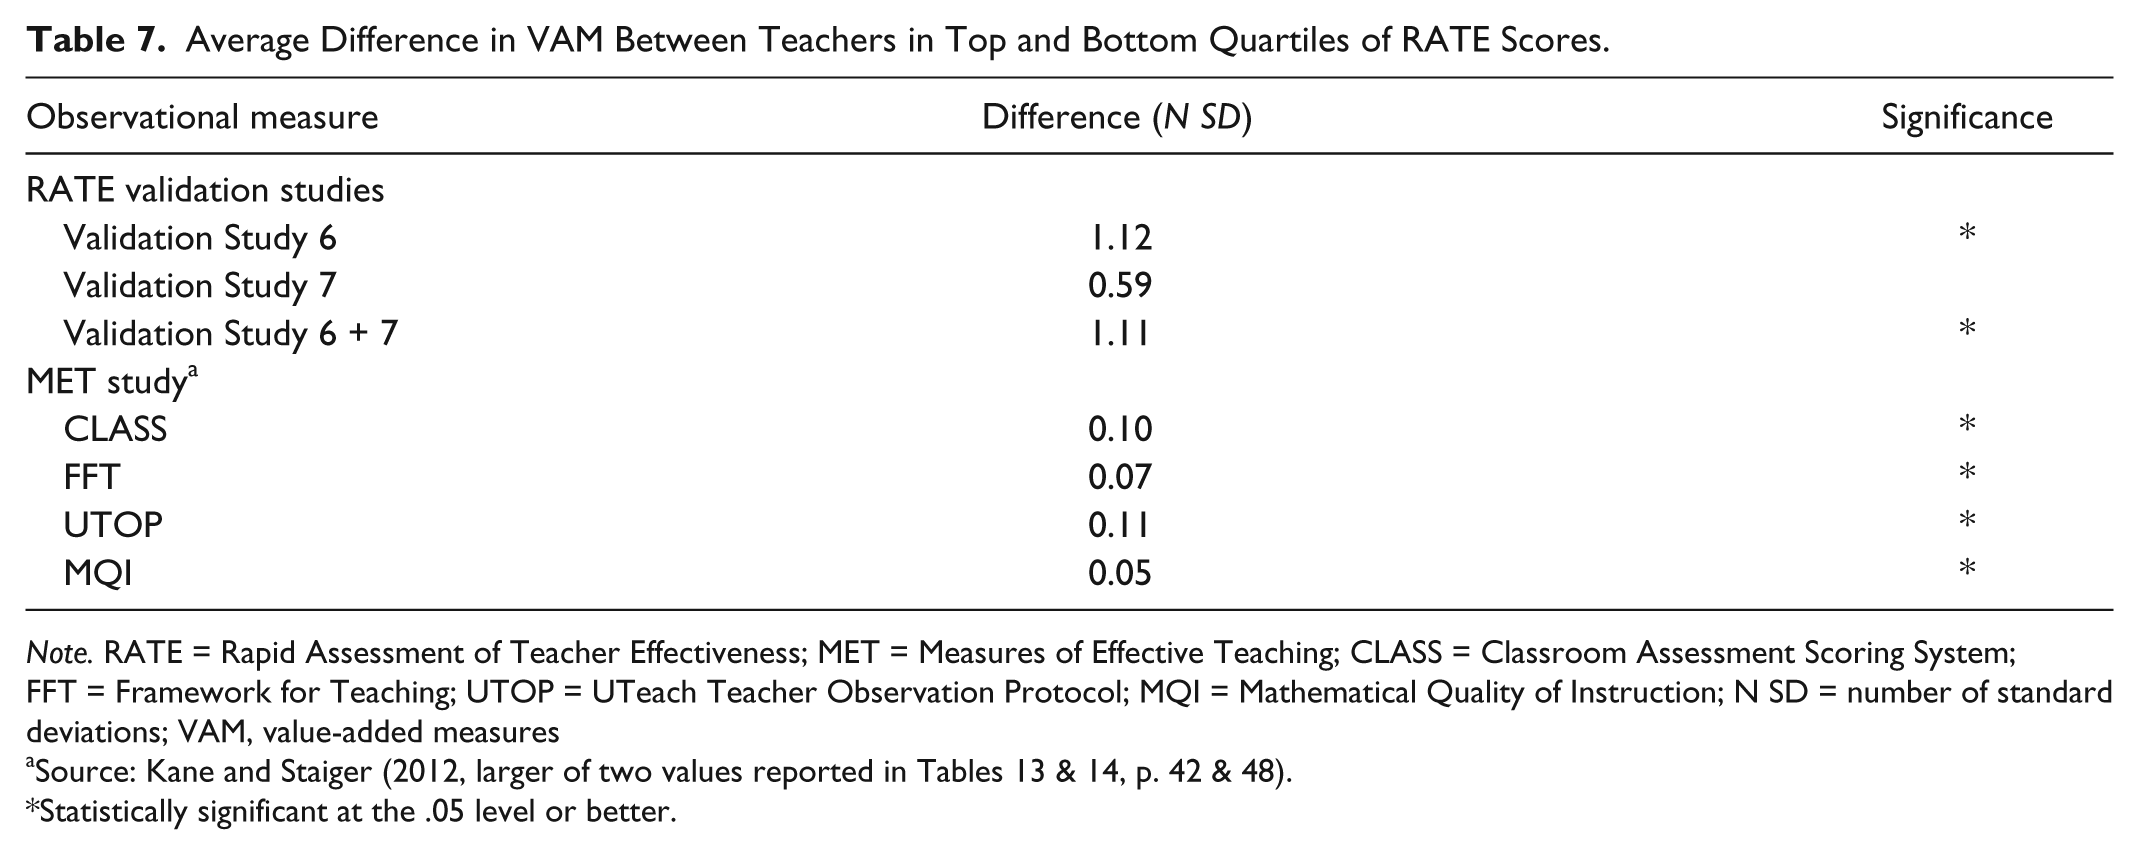
Note. RATE = Rapid Assessment of Teacher Effectiveness; MET = Measures of Effective Teaching; CLASS = Classroom Assessment Scoring System; FFT = Framework for Teaching; UTOP = UTeach Teacher Observation Protocol; MQI = Mathematical Quality of Instruction; N SD = number of standard deviations; VAM, value-added measures
Source: Kane and Staiger (2012, larger of two values reported in Tables 13 & 14, p. 42 & 48).
Statistically significant at the .05 level or better.
There are a number of possible reasons why our differences are larger than those reported in the MET study. Our measure of value added may be more precise, leading to a better result. The distribution of VAMs for our sample of volunteer teachers may have fatter tails than those for the samples used in the MET study, or our small sample may be unusual in some other way. One important possibility, however, is that RATE was developed using videos of teachers who were separated by at least 0.50 or 1.0 standard deviations. That is, it was designed to distinguish differences in value added of this magnitude. The result suggests that RATE can separate teachers in the upper and lower quartiles well, and that it is possible to do so with a simpler and more efficient instrument than is currently in use.
Interrater reliability
For Validation Studies 6 and 7, the proportions of between-teacher variance explained by one independent rating per teacher were .29 and .32, respectively. This is at the middle of the benchmark range. The proportions explained by one revised rating were .66 and .51, respectively. These are well above the benchmark range for one rating per teacher, and they are on par with the benchmarks for four and two ratings per teacher, respectively. For Validation Studies 6 and 7 combined, the ICCs are slightly lower than they are for the individual studies, suggesting rating norms may be more consistent within than across validation studies. In addition, the reliabilities from Validation Studies 6 and 7 are slightly lower than those of previous validation studies, suggesting that the separation of high and low groups in the previous studies may have promoted agreement. Even with this slight decrease, the revised RATE scores achieved greater interrater reliability than those reported in the MET study (see Table 8).
Interrater Reliability Estimates for Validation Studies 6 and 7.
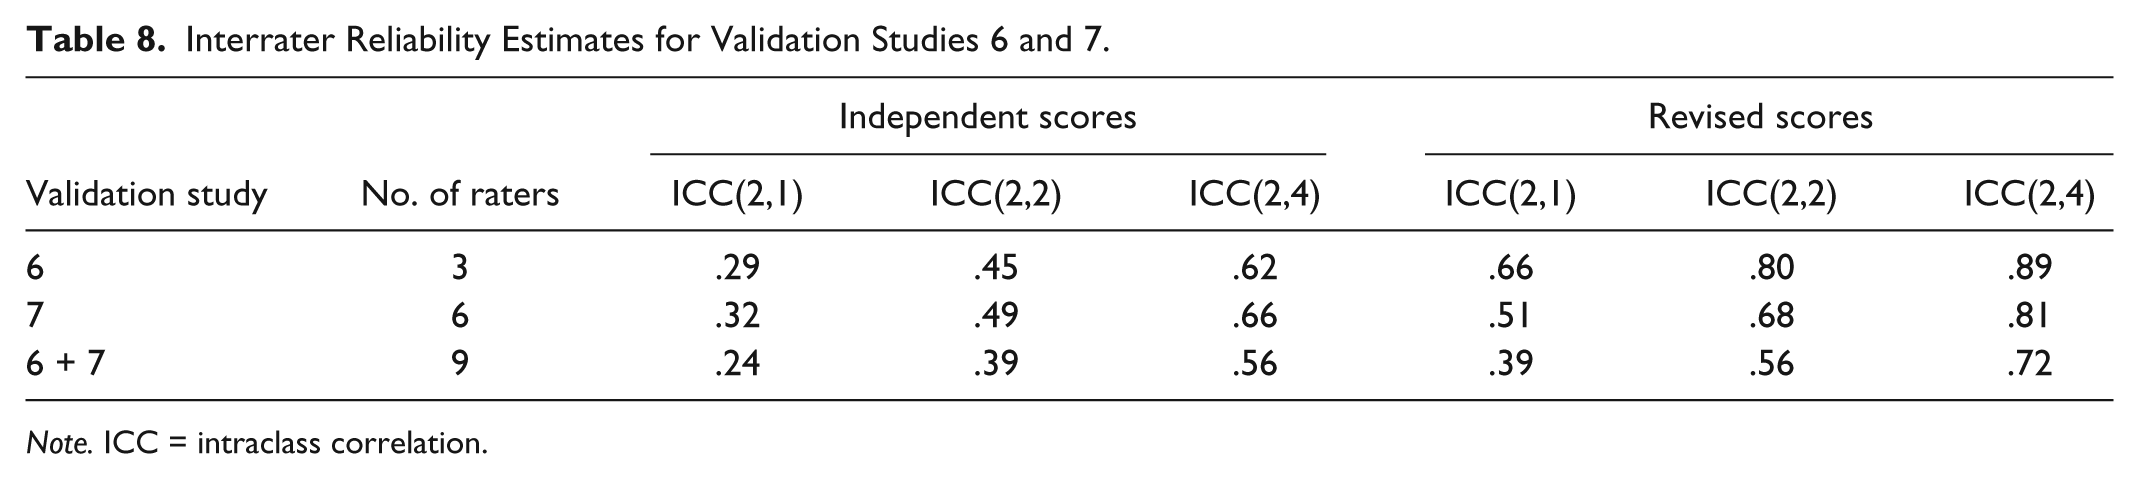
Note. ICC = intraclass correlation.
Conclusion
Can we identify a successful teacher better, faster, and cheaper? We present experimental evidence that suggests we can, demonstrating that innovation in teacher observation systems is possible. We summarize that evidence below, discuss its limitations, and conclude by describing our plans for future research on innovating teacher observations—and why other researchers should join in these efforts.
Better
The most widely used observation instruments were constructed to evaluate teaching according to a set of standards, under the assumption that they are related to student achievement. Research prior to the MET study suggested that correlations with achievement gains were not strong. Subsequent extensive examination of these relationships by MET researchers confirmed this. As did our SGH experiments, which established a baseline for successfully predicting whether teachers have an above or below average likelihood of raising student achievement.
After seven experimental validation studies, we were able to demonstrate that RATE compared favorably with the benchmarks we established. Compared with the SGH baseline experiments, RATE classified teachers into high and low VAM groups more accurately. Compared with the instruments reviewed by the MET study, RATE correlated with VAMs as well or better, separated teachers into high and low VAM quartiles more effectively, and achieved higher levels of interrater reliability. Our evidence has its limitations. Different data sets, value-added estimates, and estimation procedures cloud some of the comparisons we make. This is why we plan to conduct head-to-head comparisons of RATE with other observation instruments using the same videos and observation scores collected in the MET study.
Faster
The MET study observation scores were based on four videos per teacher, each rated by a different rater at a different time. If every class-length video were 40 min and it takes no more than 5 additional min to record the ratings to all rubric items, every teacher observation score would require 3 rater hr to produce. For RATE, a single 20-min clip was viewed and scored by two raters at the same time over a 30-min period, requiring a total of 1 rater hr to produce. Compared with the other instruments, RATE produced observational scores with one third of the estimated rater hours over one sixth of the elapsed time. This is important because a faster turnaround creates the possibility of supporting struggling teachers before students are negatively affected.
Cheaper
The cost of RATE as implemented in our studies compares favorably with those of other instruments. We do not have access to financial data related to other instruments, but one significant cost driver is rater time. In addition to reduced scoring time, RATE requires less training time. Raters in the MET study typically received training over at least 2 days for any given instrument. In addition, they periodically needed to demonstrate that they were “calibrated” either by scoring a calibration video within a given tolerance on a first pass, or by receiving additional training and subsequently scoring the calibration video successfully (Joe, Tocci, Holtzman, & Williams, 2013). We trained raters for 4 hr and used our reconciliation process to ensure ongoing calibration; much less time and effort resulting in lower cost.
The Future
To our knowledge, no other developers of a teacher observation instrument have set out to provide evidence that their instruments are better, faster, and cheaper. We find this curious because Race to the Top and No Child Left Behind have made teacher observations a priority, leading states to implement them on an unprecedented scale. Almost every state requires observation as part of its teacher evaluation systems, and more than half require multiple observations. The cost of these efforts is not trivial. Toch (2008) estimated that conducting modified FFT observations for all teachers in the United States would cost US$3 billion, or roughly 6% of total education expenditures in the United States. If there were evidence that these observations led to commensurate improvements in student achievement—or at the very least, that the strength of association between observation scores and teacher value added made the observations informative—costs such as these might be justified. However, researchers have not provided this evidence. In the absence of research results to guide their efforts, states have implemented a variety of evaluation systems and teacher observation protocols—some of them poorly; all of them costly; none of them based on evidence that suggests that the information they provide is worth the expense to produce it.
Perhaps one of the reasons researchers have not sought more evidence to demonstrate that teacher observations predict student achievement is that such evidence—regardless of its nature—would not be universally well-received. Many teachers and their unions are pushing back on evaluation systems that incorporate student achievement. Witness the Chicago Teacher Union strike in 2012 and the Florida Teachers Union’s suit in 2013 contesting the constitutionality of these efforts. Even some educational researchers resist linking teacher evaluations to student achievement, questioning the reliability of value-added calculations (e.g., Amrein-Beardsley, 2008; Newton, Darling-Hammond, Haertel, & Thomas, 2010) or the wisdom of focusing primarily on student test scores (e.g., Darling-Hammond, 2006). Common sense would suggest that developers of observation systems keep their distance from this fray—Why imperil the acceptance of a new tool, and the theories upon which it is built, by alienating those who would use it?
In the meantime, the adoption of teacher observations at a national level has raised the stakes for teachers and students. Perhaps the time has come for developers to engage in riskier, more public research behaviors, in particular the sort of experimental testing that brings with it the possibility of learning that the experimenter was wrong. This is a laudable aspect of the MET study, even though its efforts came well after the development of the observation instruments it evaluated. We pursued the same goal, albeit on a much humbler scale than the MET researchers, and will continue to do so by making head-to-head comparisons using MET study videos and data. We would invite other developers of teacher observation systems to do the same and join us in our efforts to innovate the way in which teacher observations are conducted and used.
Footnotes
Acknowledgements
The authors would like to thank Emily Davis for her assistance in developing the rating scale and acting as a resource on CLASS. Thanks are also due to Adele Hermann, Ayuri Terada, and Laura Lindauer for assisting with pilot ratings.
Declaration of Conflicting Interests
The author(s) declared no potential conflicts of interest with respect to the research, authorship, and/or publication of this article.
Funding
The author(s) received no financial support for the research, authorship, and/or publication of this article. However, the Carnegie Corportation of New York awarded a grant to the second author for the research upon which prior studies reported in this article were based.