



Abstract
In Colombia, cattle-fattening farms account for 20.7% of the Colombian cattle herd and play an important role in terms of economic and social benefits for rural communities. However, few characterization studies have been conducted on these production systems, which limit our understanding of their production dynamics and environmental impacts. This study aimed to characterize very small, small, medium, and large cattle-fattening farms from technical and environmental perspectives. The data analyzed were obtained from the Ganadería Colombiana Sostenible and the LivestockPlus projects, which gathered information from a total of 2618 farms, classified according to their cattle production orientation. From those, 275 cattle-fattening farms were classified as being either very small (1–30 bovines), small (31–50 bovines), medium (51–250 bovines), or large farms (more than 251 bovines). Numerical and categorical variables were distributed into five components: (1) general farm information, (2) composition and management of the herd, (3) pasture management, (4) production information, and (5) environmental information. Each component was analyzed using the factorial analysis of mixed data (FAMD) method. According to FAMD, for the components general farm information, herd composition and management, pasture management, and production information, distribution of variables led to a spatial separation of the centroid from each category of producers. For the component environmental information, there was no separation of the centroid. Better infrastructure, machinery and equipment, better pasture management, and better productive parameters and practices were observed in larger farms. This suggests that those public policies aimed at improving productive and environmental performance of the livestock sector should give priority to small- and medium-sized livestock producers considering their farm characteristics.
Keywords
Introduction
Cattle fattening, mostly under grazing conditions, is a very important economic activity in South America, with Brazil, Argentina, Mexico, and Colombia being the Latin-American countries with the largest beef herds (FAO, 2013). In 2015, the total number of cattle in the Colombian beef herd was 10,473,067, roughly 45.7% of the national cattle herd (DANE, 2017). Cattle fattening accounts for 45.2% of the Colombian beef herd with the remaining 54.8% distributed between cow-calf (40.4%) and full cycle (14.4%) activities (DANE, 2017).
Together, traditional-extensive and improved-extensive grazing systems are used in approximately 90% of the Colombian beef farms (Mahecha-Ledesma et al., 2002). In these systems, animals graze on large plots and their diets may include native forage species, the growth of which is reduced under dry conditions, thus affecting biomass and feed supply (Barahona et al., 2003). Cattle fattening occurs mainly on improved, extensively managed pastures, a land use that represents 49.1% of the beef industry. The use of extensive grazing, together with the low nutritional value of tropical grasses, has led to stagnation of the national herd size and to low productivity rates (ICA, 2017). Thus, although important for the country in terms of social and economic benefits, it is necessary to improve the productive parameters of Colombian beef farms.
Carrying out characterization studies facilitates the identification of the main production, reproduction, economic, and environmental variables that determine the degree of heterogeneity among farms. Collection of accurate information is critical to conduct characterization studies, which, among other benefits, are useful in identifying inefficiencies and in proposing good farming practices, technological strategies, and differential public policies for sectoral development. This is important when increasing productivity and reducing negative environmental impacts are policy priorities.
In Colombia, characterizations of cattle-fattening production systems, using primary data, have not been conducted, which limit our understanding of their dynamics, and the proposal of strategies to improve their productive and reproductive performance. Consequently, this study was carried out to characterize very small, small, medium, and large cattle-fattening farms across 13 cattle producing departments of Colombia from a technical and environmental perspective, to identify the main differences among groups and the proper strategies to improve their productive and environmental indicators.
Methodology
Sampled population
The information used in this study was obtained from the Sustainable Colombian Cattle Ranching (GCS, Spanish initials) and the Livestock Plus (L+) projects. The GCS project conducted surveys in a total of 2011 farms characterized as either cow-calf, cattle-fattening, dual-purpose, full cycle, or specialized dairy livestock farms, which were selected based on environmental attributes, the existence of globally important ecosystems, and proximity to protected areas. Livestock farms surveyed were located in the departments (in parenthesis, the number of municipalities surveyed): Atlántico (13), Bolívar (4), Boyacá (12), Caldas (2), Cesar (10), La Guajira (5), Meta (10), Quindío (9), Risaralda (2), Santander (4), Tolima (6), and Valle del Cauca (7) (Figure 1). The criteria used to select these farms included being the property of Colombian owners and covering over 2 ha. A 10-component questionnaire used with each farm covered: (1) general information, (2) herd composition and management, (3) pasture management practices, (4) livestock production and reproduction data, (5) animal health, (6) environmental information, (7) social information, (8) organizational and relationship with the external environment information, (9) incomes from livestock, and (10) financial information.

Departments where surveyed farms were located.
The L+ project conducted a survey among farms located in the Meta Piedmont (municipalities of Cumaral and Restrepo), Meta high plains (Puerto Gaitán and Puerto López), and Cauca dry valley of Patía (El Bordo and Mercaderes) (Figure 1). Surveys were conducted in 607 livestock farms as follows: Piedmont (150), High Plains (147), and dry valley of Patía (310). The questionnaire focused on eight components: (1) general information, (2) administrative information, (3) land-use information, (4) technical assistance, (5) production and trade system characteristics, (6) association membership, (7) financial information, and (8) climate events.
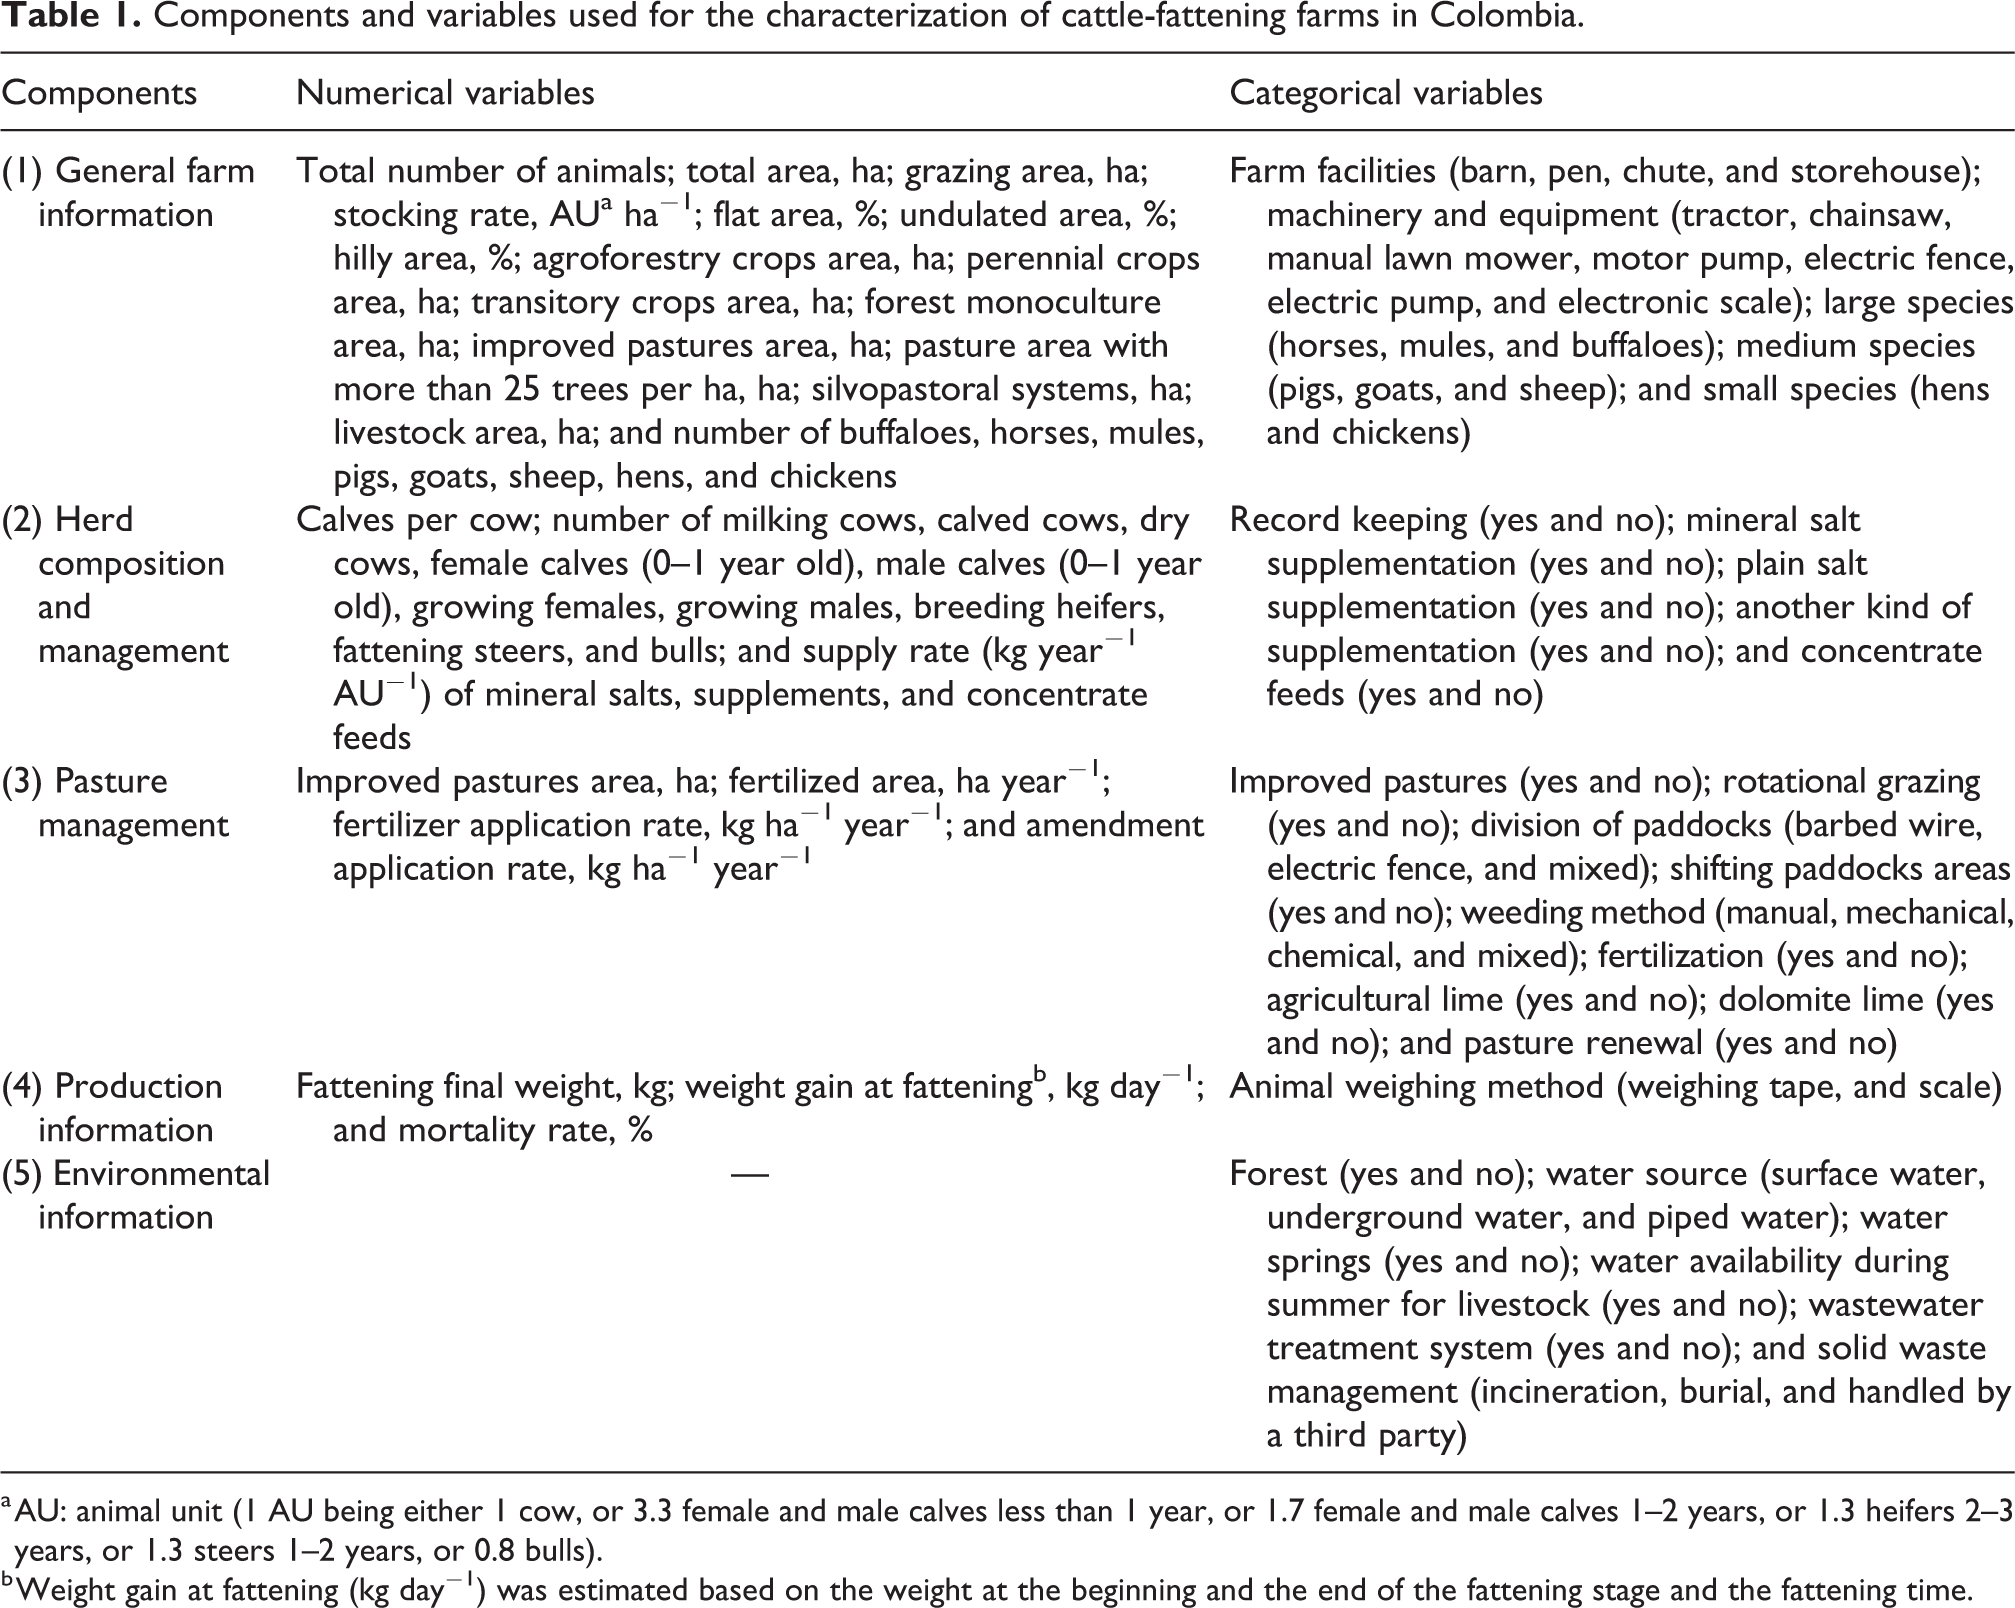
From the 2618 livestock farms surveyed, 275 beef cattle-fattening farms were identified. These were stratified into four categories of livestock producers according to the number of cattle heads (in parenthesis): very small producers (VSP: 1–30), small producers (SP: 31–50), medium producers (MP: 51–250), and large producers (LP: over 251) (Fedegan, 2006). Table 1 presents the numeric and categorical variables included and classified into five components.
Components and variables used for the characterization of cattle-fattening farms in Colombia.
a AU: animal unit (1 AU being either 1 cow, or 3.3 female and male calves less than 1 year, or 1.7 female and male calves 1–2 years, or 1.3 heifers 2–3 years, or 1.3 steers 1–2 years, or 0.8 bulls).
b Weight gain at fattening (kg day−1) was estimated based on the weight at the beginning and the end of the fattening stage and the fattening time.
Statistical analysis
Assessment of each of the five components was performed by means of factor analysis for mixed data (FAMD), using the homonymous function of the FactoMineR package in R (R Core Team, 2016). Mixed data are those in which both quantitative and qualitative variables are recorded on sampling units. FAMD is a multivariate method that simultaneously uses both types of variables as active elements to generate a lower dimensional space, trough the combination of principal component analysis and multiple correspondence analysis (Pagès, 2004). Quantitative variables were balanced and normalized to Z-values, while the qualitative variables were disaggregated in a disjunctive normalized data table. This ensures to balance the influence of both quantitative and qualitative variables on the determination of the dimensions of the lower dimensional space. This method allowed us to graphically study similarities/dissimilarities between production units (distances) and correlations between continuous variables (Pagès, 2004). Prior to applying FAMD, missing data imputation was carried out, using the algorithm implemented in the imputeFAMD function within the missMDA package (Josse and Husson, 2016).
Results
General information and land usage on the farms are presented in Table 2. Figures 2 to 6 include a graphic representation of the FAMDs for each of the five components described in Table 1 as well as (a) the spatial relationship among the centroids of qualitative variables, with the categories of livestock producers used as a supplementary variable and (b) the projection of continuous variables on the factor plane of the first two dimensions with number of cattle heads as a supplementary variable. Supplementary variables did not participate in the construction of the model. Table S1 of the Supplementary material presents the contingency tables of the variables included in the FAMDs. The first two dimensions explained 41.70, 24.78, 36.45, 68.7, and 39.37% of the total variability of the observations for the components: general farm information (Figure 2), herd composition and management (Figure 3), pasture management (Figure 4), production information (Figure 5), and environmental information (Figure 6), respectively. The contribution of each variable (Square Cosine—cos2) to the construction of the first two dimensions in each FAMD analysis is presented in Table S2 of the Supplementary material. Variables with cos2 values closer to 1 were those which contributed the most to build each dimension and showed a higher correlation with them. There was a separation of the centroid of the different groups (VSP, SP, MP, and LP) in the components: general farm information, herd composition and management, pasture management, and production information. For the component environmental information, there was no clear separation of the centroid, which suggests there are no remarkable differences in the implementation of these practices associated to farm size.
Biophysical and land-use features in cattle-fattening farms by group of livestock producers (average ± standard deviation).

VSP: very small livestock producers; SP: small livestock producers; MP: medium livestock producers; LP: large livestock producers; AU: animal units.
a Average calculated with farms having this type of crop or pasture.
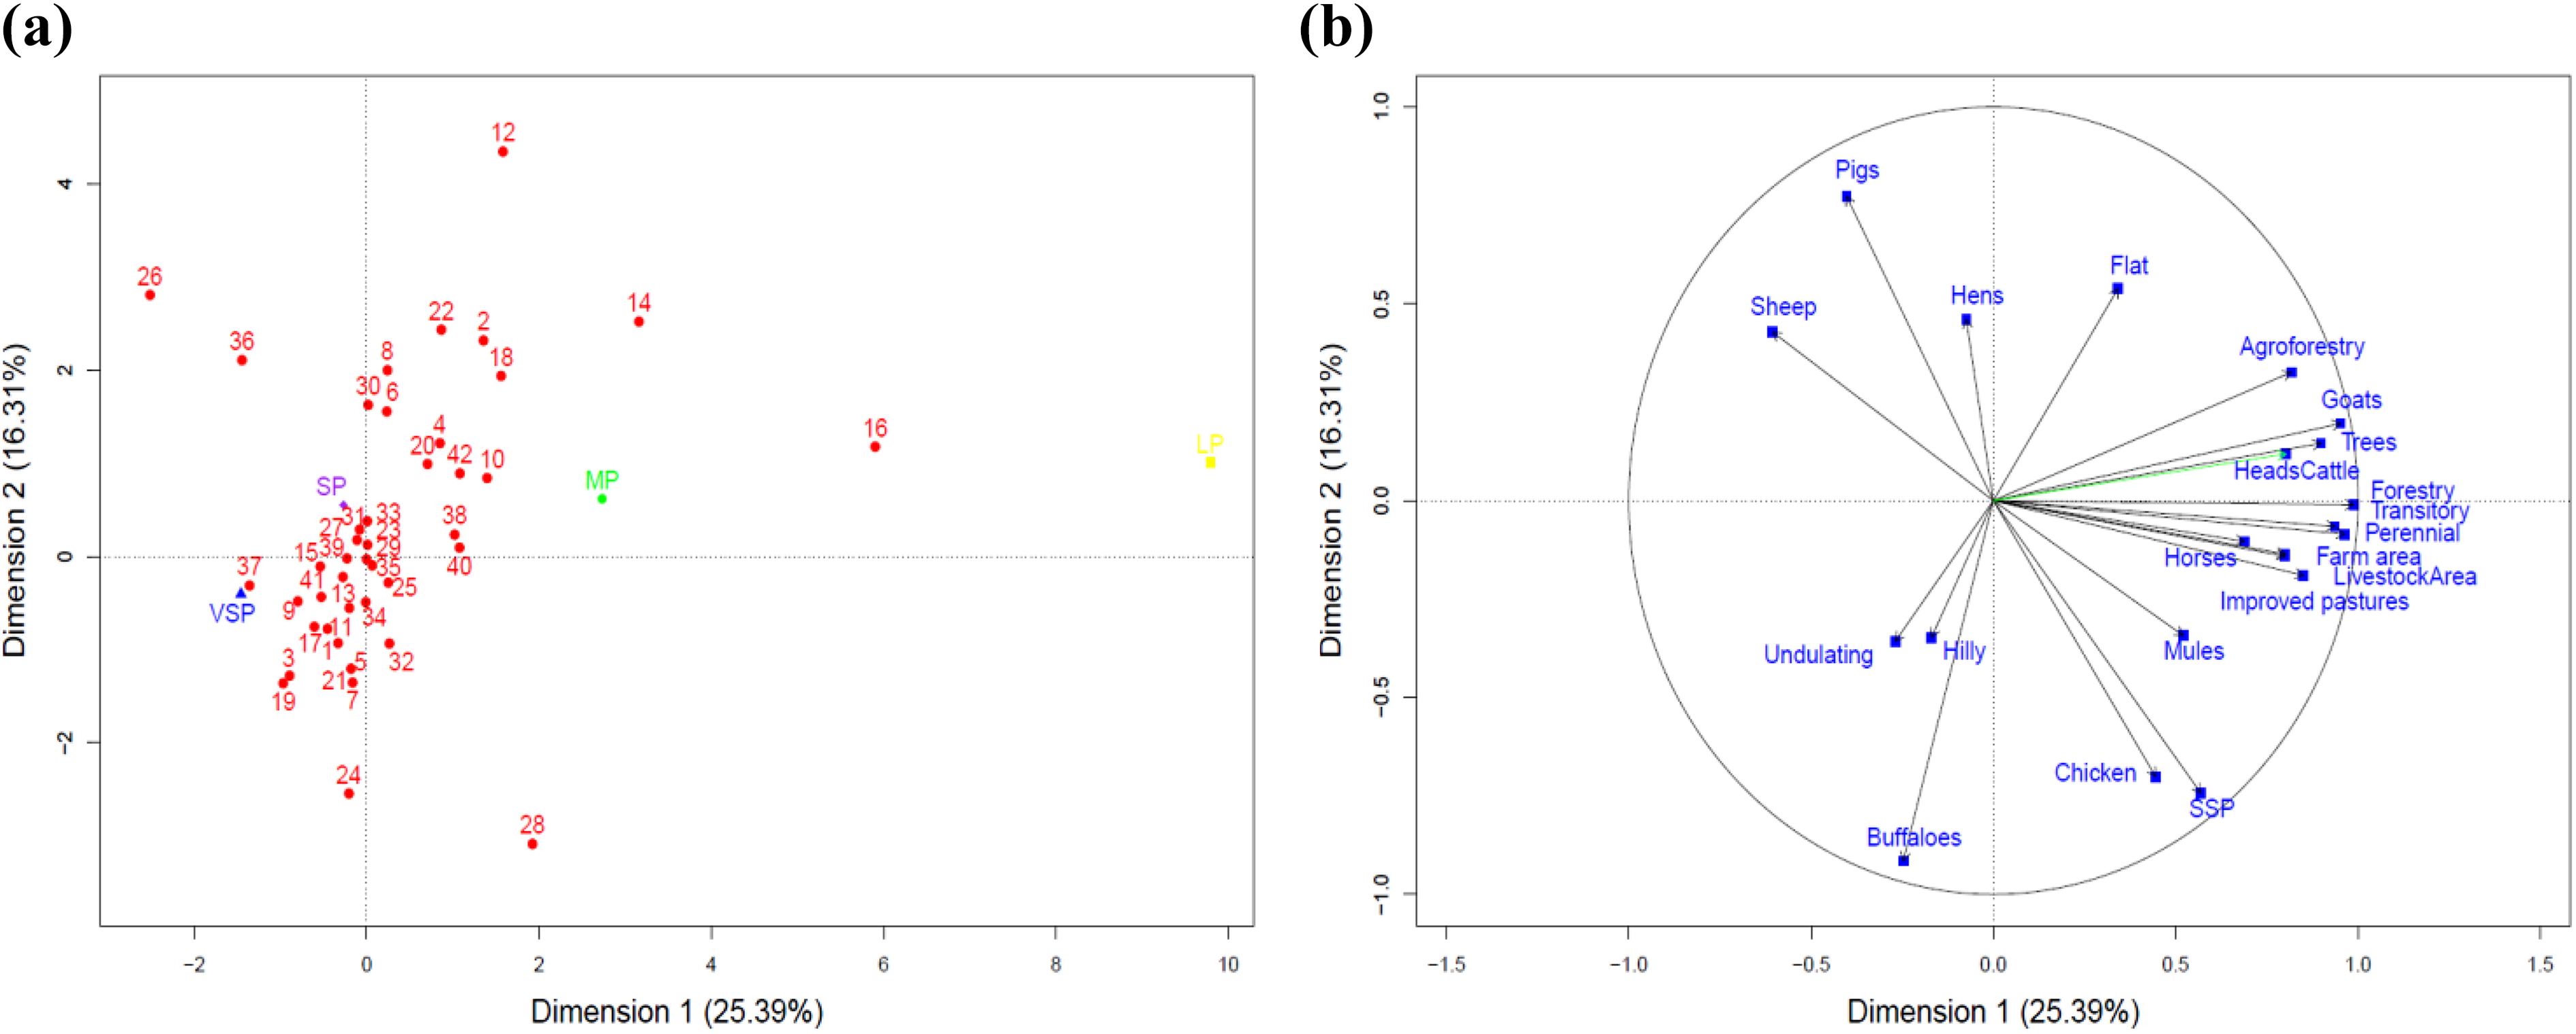
Spatial projection of (a) categorical variables and (b) numerical variables in the first and second dimensions of the component general farm information. Coding of categorical and numerical variables are shown in Table S3 of the Supplementary material.

Spatial projection of (a) categorical variables and (b) numerical variables in the first and second dimensions of the herd composition and management component. Coding of categorical and numerical variables are shown in Table S3 of the Supplementary material.
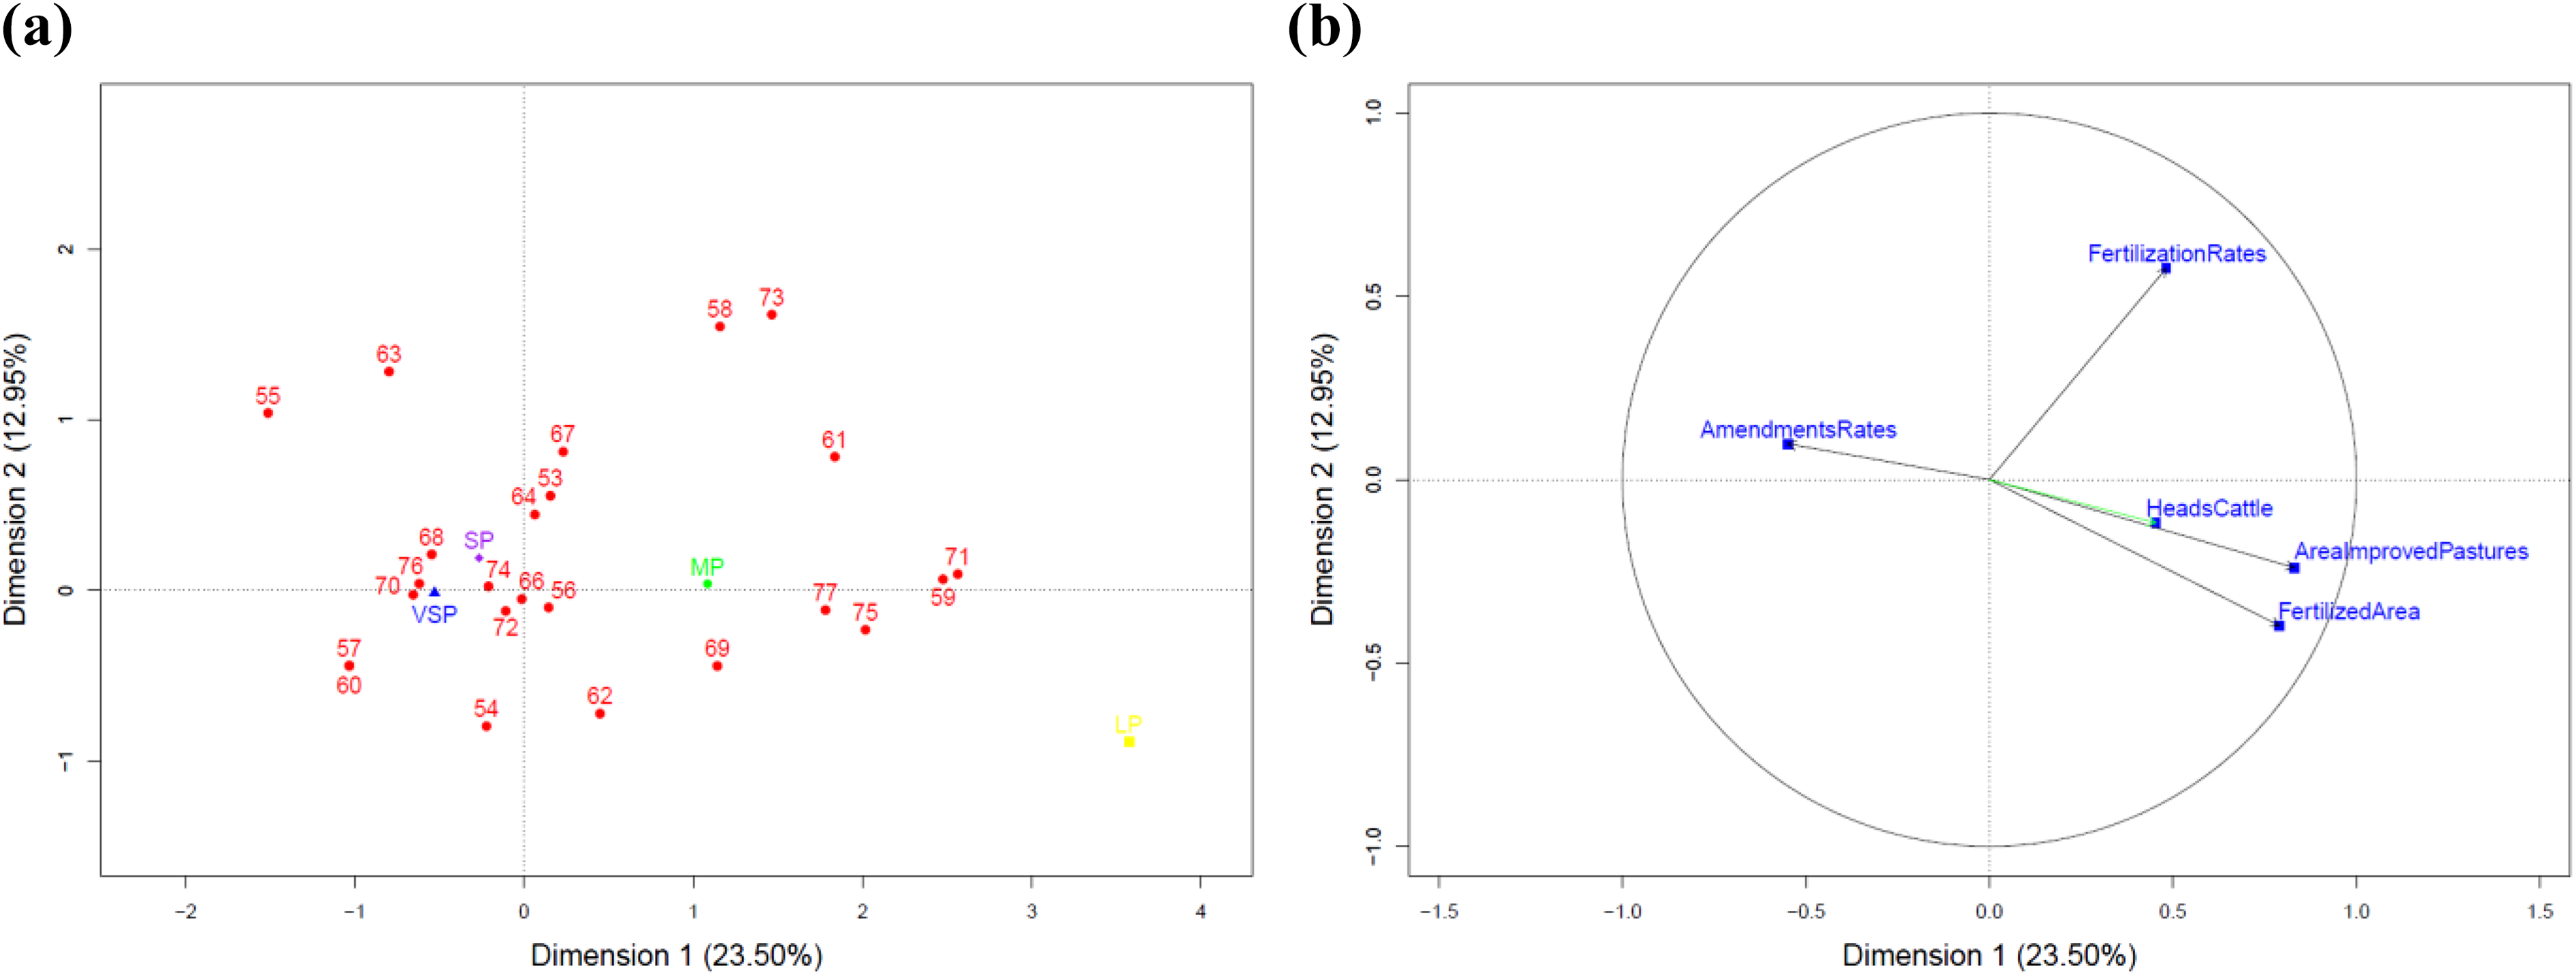
Spatial projection of (a) categorical variables and (b) numerical variables in the first and second dimensions of the pasture management component. Coding of categorical and numerical variables are shown in Table S3 of the Supplementary material.
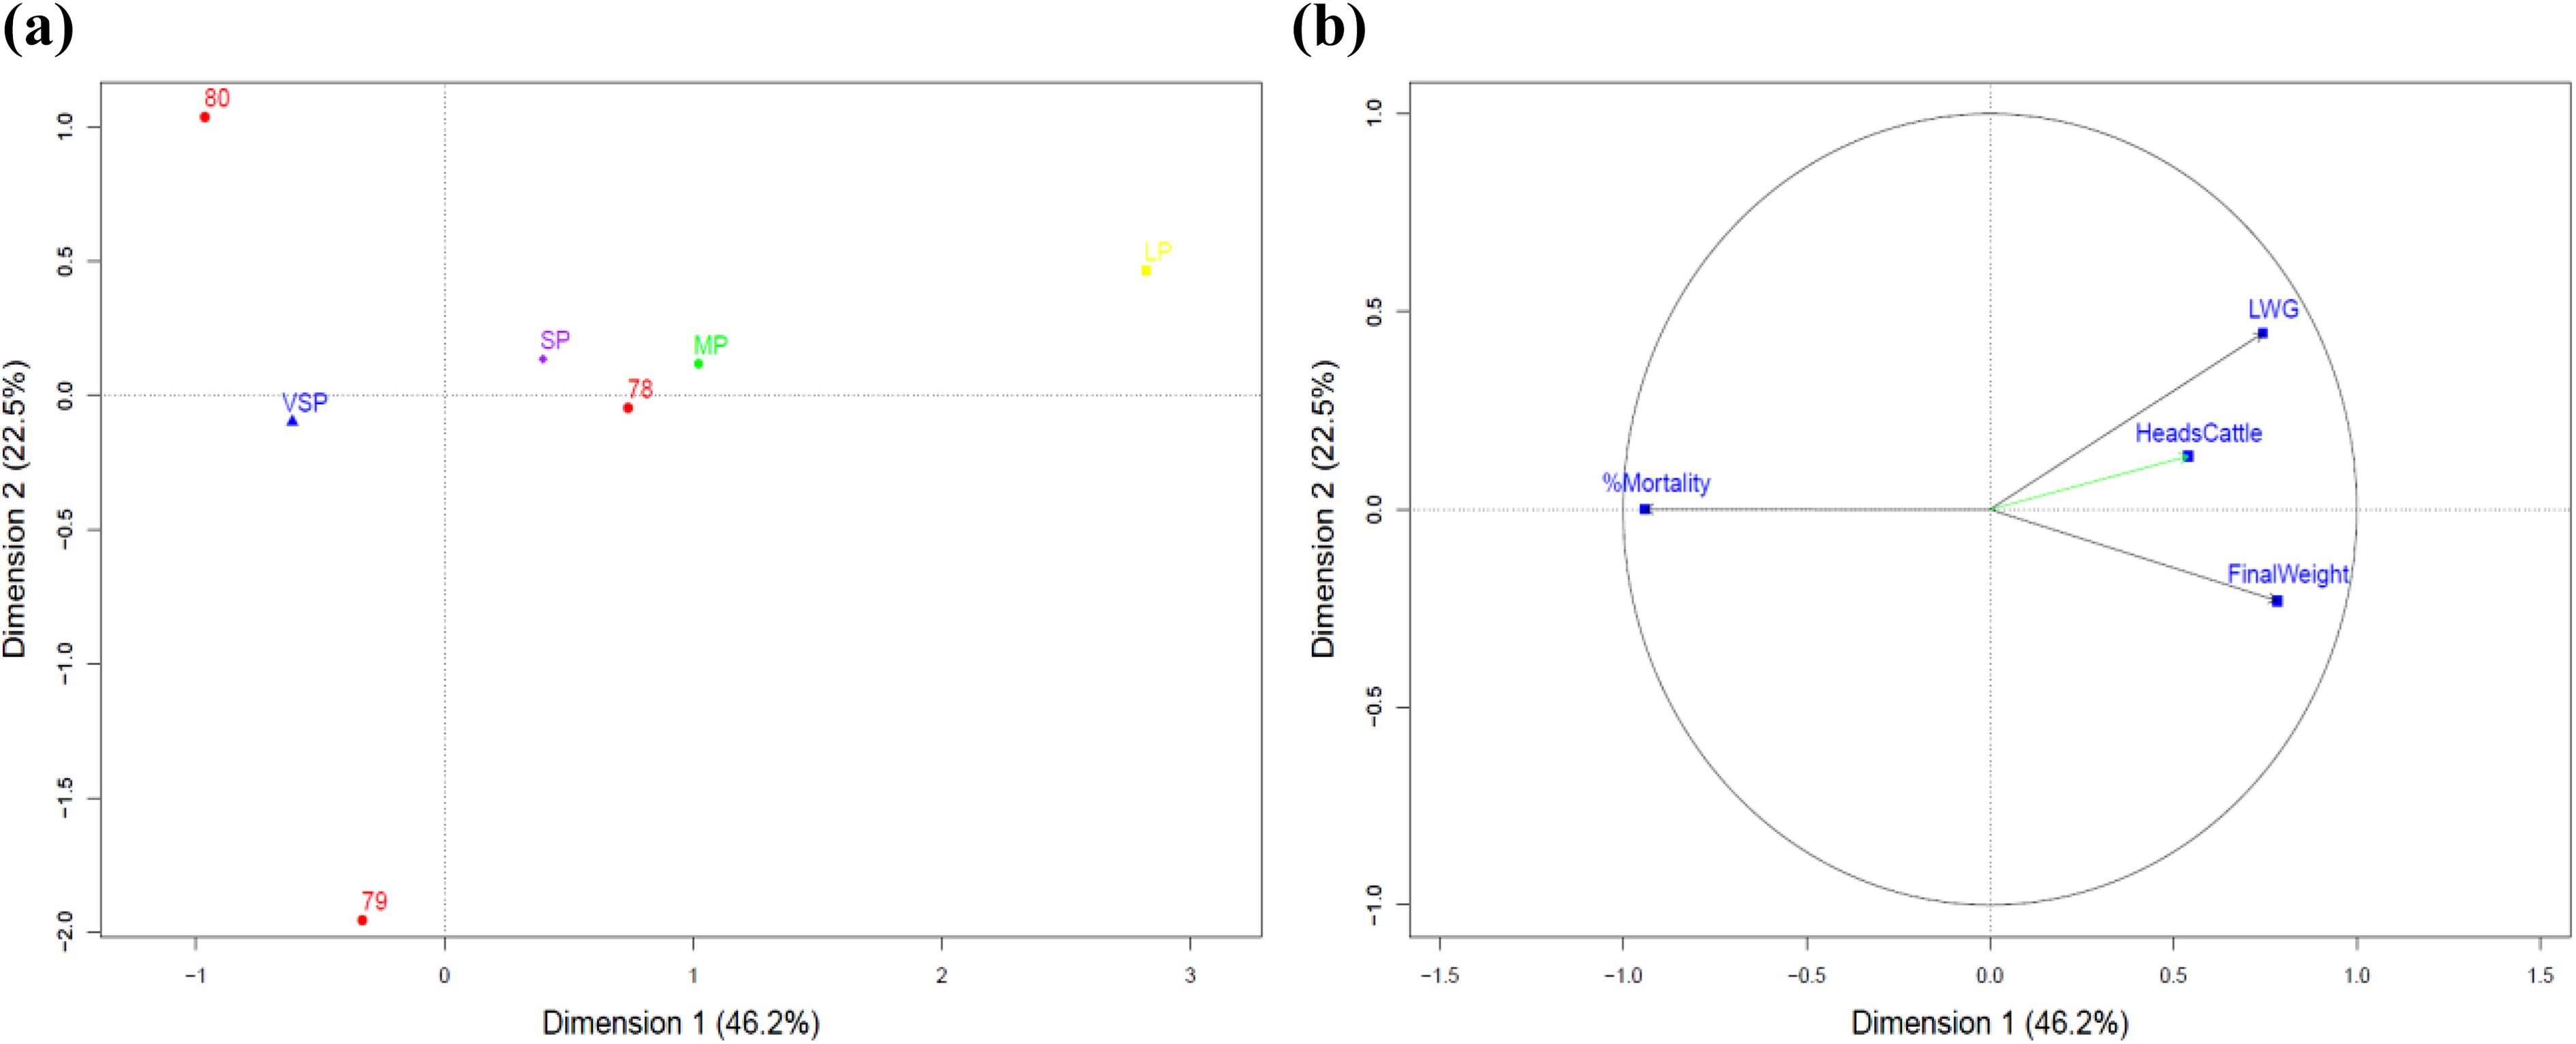
Spatial projection of (a) categorical variables and (b) numerical variables in the first and second dimensions of the component production information. Coding of categorical and numerical variables are shown in Table S3 of the Supplementary material.
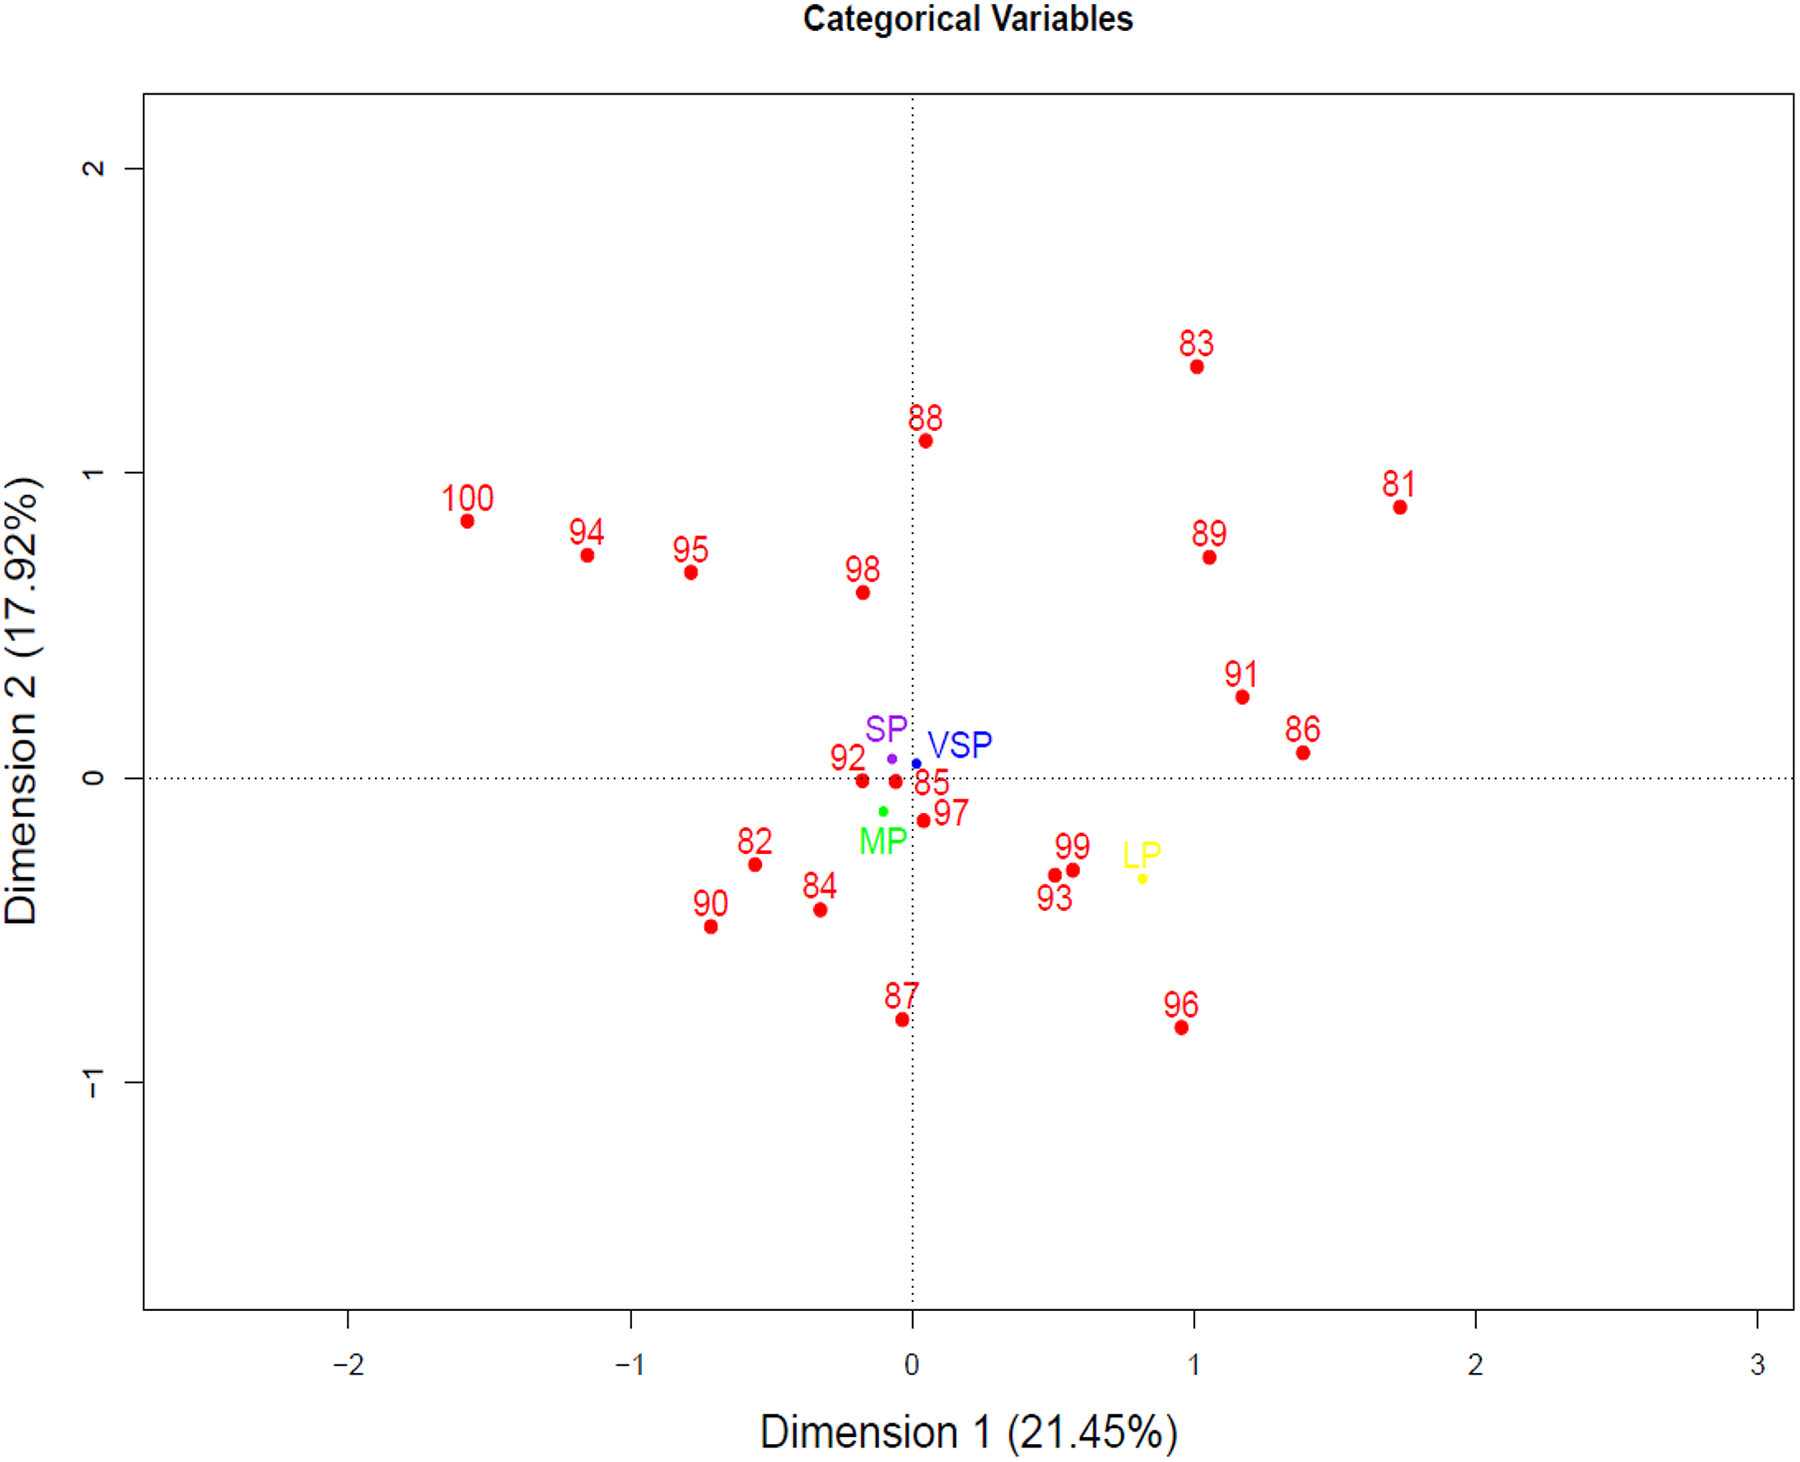
Spatial projection of categorical variables in the first and second dimensions of the Environmental Information component. Coding of categorical variables are shown in Table S3 of the Supplementary material.
General farm information
Plotting the categorical variables within this component showed an alignment of the livestock producer categories over the first dimension of the FAMD representation (Figure 2(a)). Such variables as electric fence, electronic scale, tractor, and big animal species were more correlated with the first dimension (Table S2 of the Supplementary material). On the other hand, variables as barn, pen, chute, storehouse, electric pump, chainsaw, manual lawn mower, and motor pump presented the highest correlation with dimension 2 (Table S2 of the Supplementary material). There was a close association between the presence of machinery, equipment and infrastructure, and the categories LP and MP (Figure 2(a)). On the contrary, the lack of use of these technologies aligned to the left side of dimension 1 and was associated to VSP and SP producers (Figure 2(a)).
Numerical area variables—total, with livestock, with improved pastures, with agroforestry crops, with forestry monoculture, with transitory crops, with perennial crops, and pasture areas with more than 25 trees per hectare—were positively correlated with the first dimension representing farm size (Table S2 of the Supplementary material). In addition, there was a high correlation between these variables and the number of cattle, that is, with MP and LP (Figure 2(b)). In turn, the variables number of buffaloes and number of chickens were more correlated in a negative way with dimension 2, while the number of pigs and the percentage of flat area were positively correlated to this dimension (Table S2 of the Supplementary material; Figure 2(b)).
Herd composition and management
Herd composition, supply rates of supplementary feeds, and productive parameters for VSP, SP, MP, and LP farms are presented in Table 3.
Herd composition, supplementary feeding, and productive parameters by farm size (average ± standard deviation).
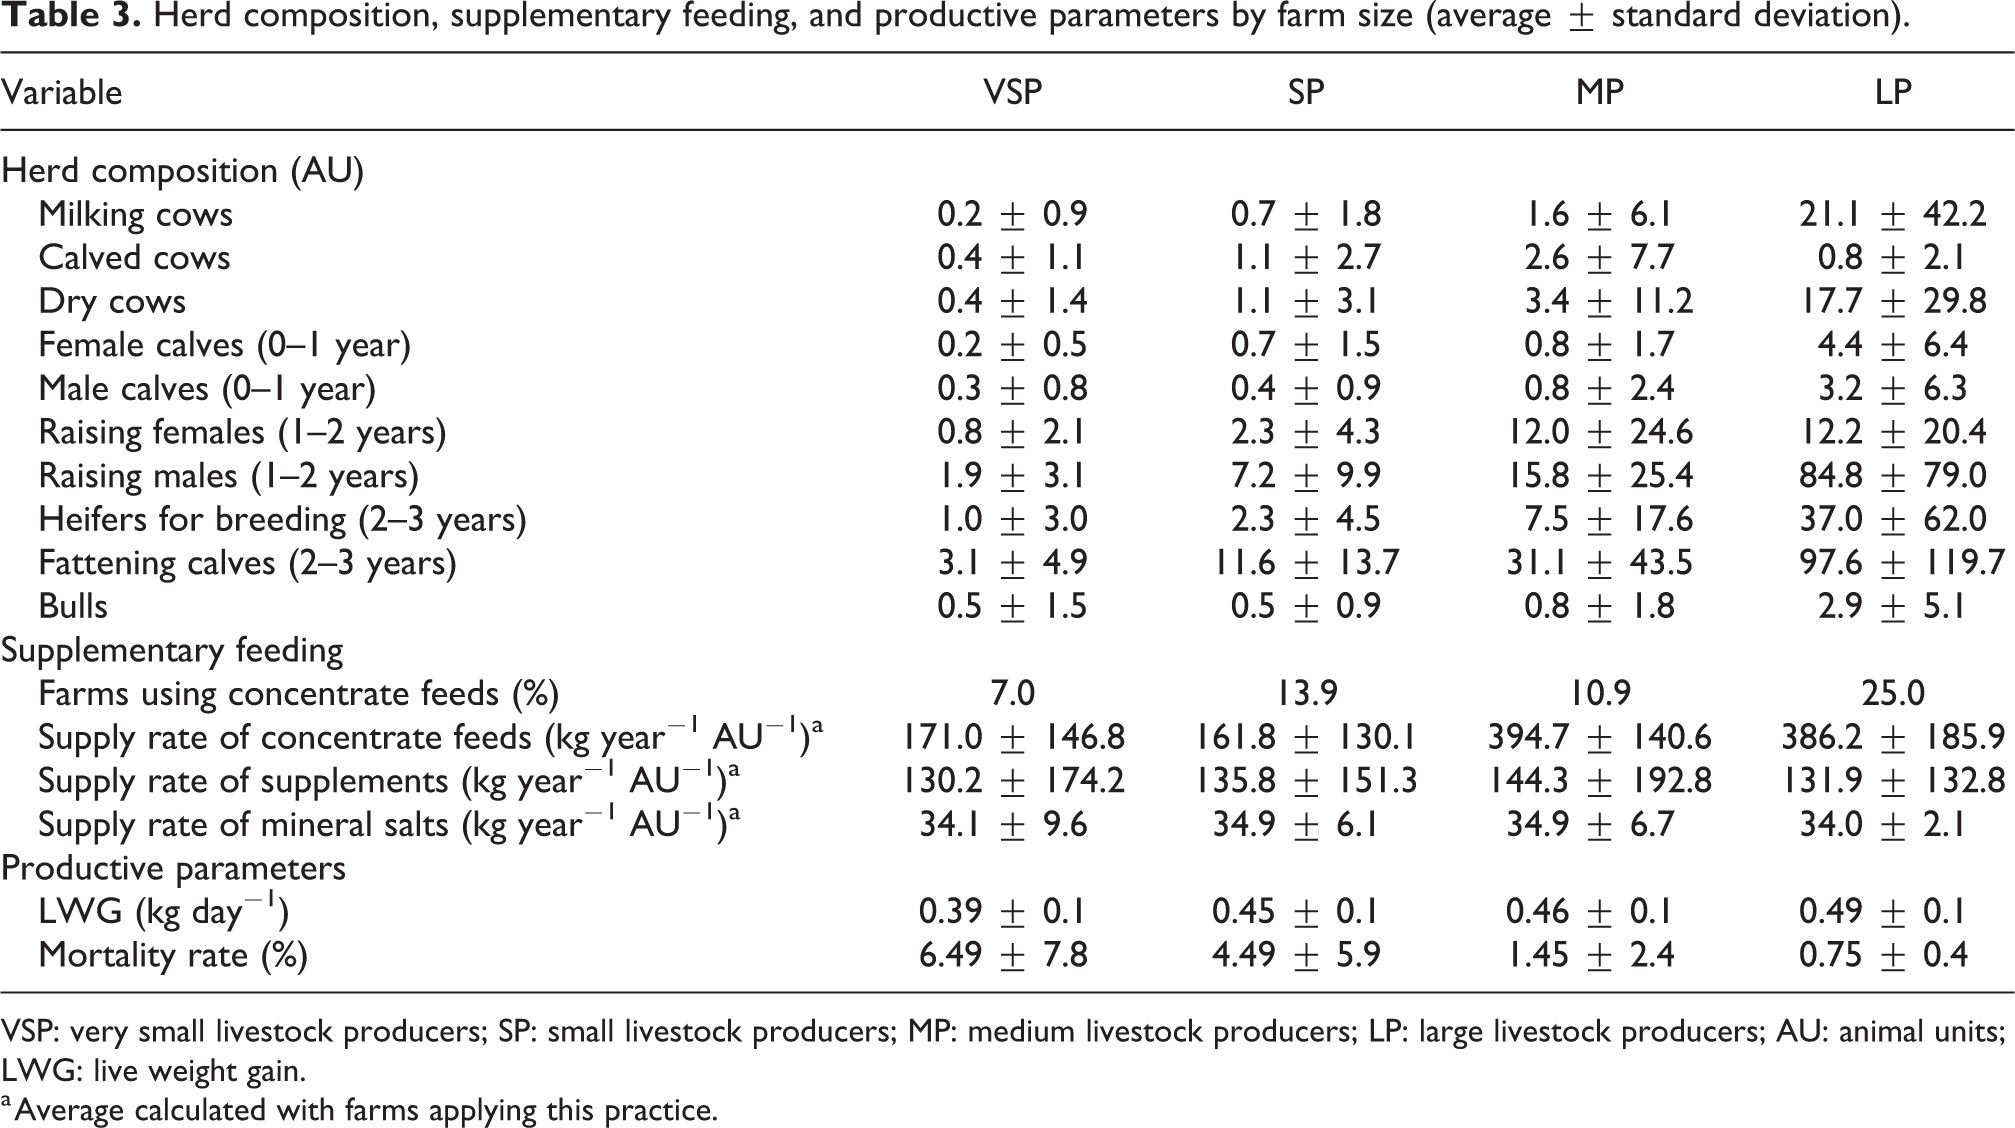
VSP: very small livestock producers; SP: small livestock producers; MP: medium livestock producers; LP: large livestock producers; AU: animal units; LWG: live weight gain.
a Average calculated with farms applying this practice.
Analysis of the categorical variables showed a higher correlation in the use of concentrate feeds with the first dimension. In addition, the supplementation of mineral and plain salt presented the highest correlation with dimension 2 (Table S2 of the Supplementary material). Results suggest that MP and LP farmers are more likely to keep productive records and use a larger proportion of supplementary feeds in the animal diets than VSP and SP farmers (Table S1 of the Supplementary material).
Numerical variables as the percentage of dry cows, calved cows, calves, and supply rate of mineral salt presented positive correlation to dimension 1, while the cow:calf ratio and the percentage of fattening calves were negatively correlated with this dimension (Figure 3(b)) (Table S2 of the Supplementary material). In turn, the supply rate of concentrate feeds, the percentage of breeding heifers, and the percentage of bulls were positively correlated to dimension 2, while the percentage of growing males showed a negative correlation. Since the variable number of cattle heads did not contribute to a great extent to the first two dimensions of the FAMD, herd composition and management practices were not associated to the size of farms.
Pasture management
Categorical variables as barbed wire and mixed division of paddocks, rotational grazing, mixed weed control, fertilization, and pasture renovation presented a higher correlation with dimension 1 (Figure 4(a)) (Table S2 of the Supplementary material). On the other hand, improved pastures, division of paddocks with electric fence, and manual and mechanical weed control had a higher correlation with the second dimension (Table S2 of the Supplementary material). In addition, there was an aggregation toward the right side of dimension 1 of the categorical variables chemical fertilization, pasture renovation, amendment application, mixed division of pastures (barbed wire and electrical fence), mixed weed control, and use of electrical fences (Figure 4(a)). Variables related to the nonimplementation of these practices oriented toward the left side of dimension 1, together with the division of pastures with barbed wire and nonrotational grazing. Livestock-producer categories were aligned along dimension 1, as SP and VSP farmers tend to carry out pasture improvement and conservation practices to a lesser extent.
With respect to numerical variables (Figure 4(b)), the area with improved pastures and fertilization, and the number of cattle were positively correlated to dimension 1, while the amendment application rate was negatively correlated (Figure 4(b)) (Table S2 of the Supplementary material). Thus, in MP and LP farms, the area with improved pastures and receiving fertilization was larger.
Production information
With respect to the categorical variables, the use of a scale showed a high correlation with dimension 1, while the use of a weighing measuring tape and not weighing the animals being correlated with dimension 2 (Table S2 of the Supplementary material). Regarding numerical variables (Figure 5(b)), live weight gain (LWG) in the fattening stage, final fattening weight, and the number of cattle heads were positively correlated to the first dimension, while the mortality rate was negatively related to it, indicating better production performance in MP and LP farms compared to VSP and SP farms.
Environmental information
In this component, there was no clear separation of the centroid among the four livestock-producer categories (Figure 6), which suggests there are no patterns in the development and implementation of environmental practices across producer categories.
Discussion
Around 97.1% of farms fell into the VSP, SP, and MP categories (Table 2), which agree with Fedegan (2006) in that a high percentage of livestock farms in the country belongs to SP and MP. Thus, public policies targeted at improving production, environmental, and social conditions of Colombian cattle-fattening farmers should prioritize VSP, SP, and MP as well as to discriminate the type of market incentives among small-scale farmers and larger and entrepreneurial producers.
General farm information
Livestock farms with a higher number of animals and higher availability of machinery and equipment are more profitable, competitive, and generate greater income (Holmann et al., 2003). In this study, MP and LP were found to have greater availability of machinery and equipment and better facilities and thus their economical and productivity performance should be better than that of VSP and SP. Similar observations were reported in studies conducted in Venezuela and Mexico, where farms with a higher number of animals had greater use of technology and infrastructure and higher income (Chalate-Molina et al., 2010).
The percentages of farm area with flat topography were higher in LP (81.9%) and MP (66.9%) than in SP (48.9%) and VSP (43.0%). In contrast, the percent of farm area with hilly topography (slope over 60%) was higher in VSP (31.7%) and SP (23.5%) than in MP (10.3%) and LP (6.3%). Lands with steep slopes (over 30%) are not suitable for grazing (Ríos-Núñez and Benítez-Jiménez, 2015). Grazing on hillsides generates soil erosion and pasture degradation problems, reducing livestock production due to low forage biomass availability (Braz et al., 2013). This suggests that VSP and SP may be concerned with land degradation issues that can lead to less productivity. In addition, less than 50% of farms in each livestock producer category used improved pastures (Table 2), in spite of the fact that implantation of improved pastures increases forage biomass availability and farm productivity (Chirinda et al., 2019). Hence, ensuring adoption of improved pastures is of high priority to increase productivity in cattle-fattening farms.
Herd composition and management
In all farms evaluated, the percentage of males in the herd, mainly as fattening steers, ranged between 65% and 71%, and the cow:calf ratio was higher than 4.5, which confirms the orientation of all farms toward beef production. This is similar to what was observed in characterization studies of cattle-fattening systems of Mexico and Venezuela (Mosquera, 2005; Velázquez-Avendaño and Perezgrovas-Garza, 2017). Supplementation with mineral salt was carried out in over 71% of farms assessed in each category; the use of supplementary feeds occurred between 51% and 75% of all farms, while the use of concentrate feeds occurred in less than 25% of farms belonging to each category (Table S1 of the Supplementary material). In general, herd structure was similar in all farm categories, with a high percentage of males and a high cow:calf ratio. Feeding practices, however, varied, based on pasture topography and salt uses, while some farms used supplementary feeds, similar to what has been described in Costa Rica (Holguín et al., 2003).
Pasture management
Between 70% and 80% of the total farm area in the four livestock producer categories had naturalized, degraded pastures (Table 2), which leads to reduced forage availability and low animal productivity. Both MP and LP farms used better pasture renewal practices and had proportionally larger areas with improved pastures and fertilization, compared to VSP and SP (Table S1 of the Supplementary material). In addition, VSP and SP had land with steeper slopes and a reduced availability of machinery, which limits soil mechanization, the establishment of pastures, and more intensive land use. Similarly, among Costa Rican producers, it was mostly those of large farms who made substantial investments to renew their pastures (Benavides-Salazar et al., 2013). Pasture renovation practices aim at improving soil physical and chemical conditions by means of improving nutrient, water, and air dynamics, thus promoting the growth and vigorous development of forages (Cajas-Girón et al., 2005). Pasture renovation includes practices such as mechanization, fertilization, weed control, planting grass and/or leguminous species, rotational grazing, and, depending on the degree of pasture degradation, the use of different combinations of the above. Therefore, it is clear that by implementing this type of technologies, it is possible to increase forage and beef production and farm income (Cajas-Girón et al., 2012).
Production information
The average harvesting age ranged from 28 months to 33 months across all four producer categories, which is similar to what is reported for beef production systems in Ecuador (Ríos-Núñez and Benítez-Jiménez, 2015). The average final fattening weight ranged from 430 kg to 459 kg, which was comparable to those of fattening systems under extensive grazing in Brazil, where final fattening weight ranged from 420 kg to 500 kg (Dick et al., 2015a,b; Ruviaro et al., 2015). Higher daily LWG occurred in LP and MP farms (Table 3), which might lead to higher income. In previous characterizations (Velasco-Fuenmayor et al., 2009), it was reported that larger farms showed better productive parameters and higher income than smaller farms. In this study, higher stocking rates, younger harvesting ages, and higher daily LWGs occurred in LP farms, probably due to better pasture management practices than those of smaller farms.
The mortality rates in the study were inversely related to the number of cattle (Figure 5(b)). Research shows that conducting record keeping and technical control practices fosters health management of the herd, which reduces the occurrence of diseases and deaths (Díaz-Castillo et al., 2014). On the other hand, grazing in hilly lands can reduce the quality of forage as well as animal well-being and increase mortality (Ríos-Núñez and Benítez-Jiménez, 2015). As more MP and LP farmers kept records and their farms had a higher percentage of flat farm area (Table 2), this could have contributed to the lower mortality rates observed in these farms. In addition, it must be kept in mind that in small farms, the proportional impact of one dead animal is greater than in a big farm.
Environmental information
Over 63% of all farmers reported the presence of forests on their farms (Table S1 of the Supplementary material). It was not determined what percentage of the farm area was allocated to this land-use, information need for the establishment of public policies for the conservation of forest and landscapes. In previous descriptions of Latin-American livestock production systems, the forested area was found to be below 10% of the total farm area (Holmann et al., 2003; Ramírez et al., 2012). In tropical Latin America, the expansion of agricultural and cattle-herding frontier has been conducted at the expense of forests. In Colombia, for example, 55% of the deforested area was transformed into pastures for livestock production (Cabrera et al., 2011). This suggests that it is important to analyze changes in land use to generate information useful to strategies for forest conservation, expanding forested areas, increasing terrestrial carbon sinks, and reducing national greenhouse gas (GHG) emissions.
Both lotic and lentic surface water bodies were the main sources of water in all four categories of the farms evaluated (Table S1 of the Supplementary material). Under extensive grazing conditions, it is common that animals have free access to these water bodies, which could reduce their physical quality, increase their organic matter content, and reduce their concentration of dissolved oxygen (Chará and Murgueitio, 2005), especially, in the cattle-fattening systems, where the main source of water is surface water. It is important to conduct assessments at the watershed level, to determine if livestock farming might cause eutrophication problems, and to set up measures to mitigate these negative impacts. Creating vegetation corridors along riverbanks and ravines and restricting livestock access to these areas can reduce negative impacts (Chará et al., 2007).
The use of wastewater treatment systems in the four farm categories was below 38% (Table S1 of the Supplementary material). The contamination of water bodies from livestock farming operations is associated with nitrogen, phosphorous, and other elements, as well as pathogens and substances, such as pesticides, antibiotics, and heavy metals (Patiño-Murillo and Tobasura-Acuña, 2011). Thus, it is important to promote the adoption of wastewater treatment systems in livestock farms to reduce possible water source eutrophication.
Conclusions
Our findings show that, in general, better infrastructure, better machinery and equipment, better pasture management, and better productive parameters and practices were found on larger farms. These factors, we believe, lead to a better economic performance. Developing better cattle management practices, implementing technology on-farm, and providing technical assistance to the smaller producers are necessary to achieve better productive and reproductive parameters in the Colombian beef sector.
Further, it is important to assess the environmental performance of farms and identify the main environmental impacts associated with different size livestock production categories, with the purpose of proposing appropriate climate change mitigation measures that effectively contribute to the national goals of reducing GHG emissions.
Future policies and government programs aimed at improving productivity and environmental indicators should pay special attention to the smaller producer, which accounts for the greater number of the Colombian beef farmers.
Supplemental material
Supplemental Material, Table_S1 - Technical and environmental characterization of Colombian beef cattle-fattening farms, with a focus on farm size and ways of improving production
Supplemental Material, Table_S1 for Technical and environmental characterization of Colombian beef cattle-fattening farms, with a focus on farm size and ways of improving production by Ricardo González-Quintero, María Solange Sánchez-Pinzón, Diana María Bolívar-Vergara, Ngonidzashe Chirinda, Jacobo Arango, Heiber Alexander Pantévez, Guillermo Correa-Londoño and Rolando Barahona-Rosales in Outlook on Agriculture
Supplemental material
Supplemental Material, Table_S2 - Technical and environmental characterization of Colombian beef cattle-fattening farms, with a focus on farm size and ways of improving production
Supplemental Material, Table_S2 for Technical and environmental characterization of Colombian beef cattle-fattening farms, with a focus on farm size and ways of improving production by Ricardo González-Quintero, María Solange Sánchez-Pinzón, Diana María Bolívar-Vergara, Ngonidzashe Chirinda, Jacobo Arango, Heiber Alexander Pantévez, Guillermo Correa-Londoño and Rolando Barahona-Rosales in Outlook on Agriculture
Supplemental material
Supplemental Material, Table_S3 - Technical and environmental characterization of Colombian beef cattle-fattening farms, with a focus on farm size and ways of improving production
Supplemental Material, Table_S3 for Technical and environmental characterization of Colombian beef cattle-fattening farms, with a focus on farm size and ways of improving production by Ricardo González-Quintero, María Solange Sánchez-Pinzón, Diana María Bolívar-Vergara, Ngonidzashe Chirinda, Jacobo Arango, Heiber Alexander Pantévez, Guillermo Correa-Londoño and Rolando Barahona-Rosales in Outlook on Agriculture
Footnotes
Authors’ note
This study is part of the LivestockPlus project funded by the Consultative Group on International Agricultural Research (CGIAR) Program (CRP) on Climate Change, Agriculture and Food Security. In addition, this work was also done as part of the Livestock CRP.
Acknowledgments
We thank all donors that globally support the work of the CRP programs through their contributions to the CGIAR system. We are thankful to the Colombian Sustainable Cattle Ranching project implemented by the Federación Colombiana de Ganaderos, the Fundation Centro para la Investigación en Sistemas Sostenibles de Producción Agropecuaria, Fondo Acción, and The Nature Conservancy.
Declaration of conflicting interests
The author(s) declared no potential conflicts of interest with respect to the research, authorship, and/or publication of this article.
Funding
The author(s) disclosed receipt of the following financial support for the research, authorship, and/or publication of this article: This work was supported by the Global Environmental Fund, Consultative Group on International Agricultural Research Fund Donors and through bilateral funding agreements (for details please visit  ), and COLCIENCIAS (call 727 of 2015).
Supplemental material
Supplemental material for this article is available online.
References
Supplementary Material
Please find the following supplemental material available below.
For Open Access articles published under a Creative Commons License, all supplemental material carries the same license as the article it is associated with.
For non-Open Access articles published, all supplemental material carries a non-exclusive license, and permission requests for re-use of supplemental material or any part of supplemental material shall be sent directly to the copyright owner as specified in the copyright notice associated with the article.
