
Abstract
Although the Level of Service Inventory–Revised (LSI-R) has been validated across genders and races, few studies have investigated the validity of the instrument for different combinations of races and genders. Using data from a sample of offenders in New Jersey (N = 9,454), we measure the LSI-R’s validity in predicting recidivism within 1 year of prison release. Our findings indicate that the LSI-R is a valid predictor of recidivism across different race and gender combinations; however, the instrument performs poorly at distinguishing recidivists from non-recidivists and exhibits the lowest discriminant capacity for Black males. Policy implications are discussed.
Introduction
According to the most recent estimates, the number of persons under the jurisdiction of state and federal correctional agencies stands at nearly 1.57 million (Carson, 2014). The majority of these persons will eventually be released from custody, further challenging already strained reentry resources. In an effort to reduce offender recidivism and reincarceration after release, increase public safety, and operate within existing fiscal limitations, risk assessment instruments that yield accurate measures of risk and need are promising approaches. Such assessments can serve to aid correctional and community supervision agencies by identifying risk/need scores, prioritizing agency resource expenditure, and acting as an evaluation for both offender and agency success (Flores, Lowenkamp, Smith, & Latessa, 2006; Ostermann, 2009). Thus, assessment tools can significantly aid in the reentry process for both offenders and the agencies that supervise them.
The prediction of offender recidivism has changed dramatically within the last two decades. Actuarial assessment instruments have largely replaced unstructured professional judgment as research has continued to demonstrate the superiority and increased accuracy of actuarial instrumentation in determination of recidivism risk (e.g., Ægisdóttir et al., 2006; Bengtson & Långström, 2007; Grove & Meehl, 1996; Grove, Zald, Lebow, Snitz, & Nelson, 2000). One main objective of such instrumentation is to reduce the presence of gender and racial biases (Gottfredson & Gottfredson, 1988); however, there is some question as to whether these instruments do, in fact, predict recidivism risk uniformly across varying genders and races. To go one step further, it is largely unknown how actuarial instruments predict risk between different racial and gender pairings. Despite this lack of knowledge, actuarial instruments have maintained their popularity and are used extensively within the criminal justice field.
The Level of Service Inventory–Revised (LSI-R; Andrews & Bonta, 1995) is an actuarial risk assessment instrument that is favored among criminal justice agencies, particularly within corrections. While the instrument has demonstrated reliability and predictive validity (e.g., Andrews, 1982; Andrews & Bonta, 1995; Andrews & Robinson, 1984), and promotes standardized and objective risk decisions (Flores, Lowenkamp, Holsinger, & Latessa, 2006), much of the validation research is based on predominately White male samples. A robust yet comparatively smaller literature has explored the validity of the LSI-R among offenders of minority populations, specifically racial minorities (e.g., Holsinger, Lowenkamp, & Latessa, 2003; Schlager & Simourd, 2007; Whiteacre, 2006) and females (e.g., Folsom & Atkinson, 2007; Holsinger et al., 2003; Holtfreter & Cupp, 2007; Manchak, Skeem, Douglas, & Siranosian, 2009; Ostermann & Herrschaft, 2013; Salisbury, Van Voorhis, & Spiropoulos, 2009; Smith, Cullen, & Latessa, 2009; Van Voorhis, Wright, Salisbury, & Bauman, 2010; Vose, Lowenkamp, Smith, & Cullen, 2009). While the study of the validity of the LSI-R for racial minority and female subgroups is a growing area of the criminological literature, many of the currently available prior studies have pursued these investigations using races and genders in isolation rather than in combination with one another. This approach leaves questions about the validity of the instrument for different racial and gender group pairings unanswered.
The present study attempts to fill the void in the extant literature by exploring and comparing the validity of the LSI-R to predict recidivism across different race and gender groups. Specifically, we investigate the validity of the LSI-R in predicting recidivism within 1 year of release from New Jersey correctional facilities between 2004 and 2010. The LSI-R was specifically chosen over other general risk/needs instruments given its wide utilization in community corrections overall (Jones, Johnson, Latessa, & Travis, 1999) as well as its broad use in determining community supervision provisions for New Jersey, specifically. In the following sections, we review the available literature evaluating the use of the LSI-R among variant racial and gender samples, and present the methods for the present study. After communicating the results from our explorations, we present the policy implications from our research as well as potential directions for future research.
Background
The LSI-R
The LSI-R is a 54-item risk/needs assessment that measures both static and dynamic factors associated with risk for future recidivism and offender success. Items on the LSI-R are grouped into 10 subcomponents: Criminal History, Education/Employment, Financial, Family/Marital, Accommodations, Leisure/Recreation, Companions, Alcohol/Drug Problems, Emotional/Personal, and Attitudes/Orientation. An offender’s score on the LSI-R is calculated by summing the individual scores within each subcomponent. Total scores range from 0 to 54, with higher scores indicating a higher risk level.
The validity and reliability of the LSI-R have been demonstrated throughout the literature (e.g., Andrews, 1982; Andrews, Kiessling, Mickus, & Robinson, 1986; Andrews & Robinson, 1984; Bonta & Motiuk, 1987), and the instrument has been found to be a valid predictor of various definitions of recidivism within a variety of community supervision groups including probationers (Andrews, 1982; Andrews & Robinson, 1984), halfway house residents (Bonta & Motiuk, 1985), and parolees (O’Keefe, Klebe, Hromas, 1998; Schlager & Pacheco, 2011). Within the last 15 years, meta-analyses have consistently verified the superiority in the predictive validity of the LSI-R for recidivism over other risk measures and personality scales (e.g., Gendreau, Goggin, & Smith, 1999, 2002; Gendreau, Little, & Goggin, 1996), with researchers deeming the assessment the “current measure of choice” (Gendreau et al., 1996, p. 590). However, the majority of validation research has been conducted on male Canadian offenders of predominately White descent (Schlager & Simourd, 2007). For instance, of the 57 studies eligible for inclusion within the Gendreau et al. (2002) meta-analysis, 86% were from Canadian sources and only 44% included mixed-race samples. Further, the majority of samples included were male-only (i.e., 75%). A more recent and comprehensive meta-analysis (Olver, Stockdale, & Wormith, 2014) investigating the validity and predictive abilities of the Level of Service scales across 128 studies provides insight into the performance of the instrument across both genders and races. However, the few studies that include information about the ability of the instrument to predict recidivism for both different genders and races treat these characteristics as isolated states rather than presenting findings at the intersection of different race/gender combinations. Such findings demonstrate the need for validation research that includes both female and mixed-race samples, and presents information about the validity of the instrument across different racial and gender make-ups.
Race and the LSI-R
Researchers within the field of criminology have argued that risk factors and their prevalence may differ by ethnicity (e.g., Epstein, Botvin, Griffin, & Diaz, 1999; Jung & Rawana, 1999), thus compromising the results of many existing validation studies of the LSI-R. To determine the validity of the instrument among non-White populations, researchers have tested the instrument with racial minority populations as well as mixed-race samples. Results of these studies are mixed.
For example, Whiteacre (2006) tested for differences in LSI-R classification errors among Black, White, and Hispanic male residents at a federal work release facility using the performance measures of program outcome and in-program disciplinary incidents. The results indicated that classification errors for the two measures were dependent on the choice of the cutoff score and the performance measure predicted. For example, Blacks were more likely to be underclassified than Whites or Hispanics when predicting disciplinary incidents and overclassified when predicting program outcome. In addition, there was a consistent overall trend of more classification errors for Blacks than for Whites and Hispanics.
In using recidivism as an outcome measure, Fass, Heilbrun, DeMatteo, and Frentz (2008) compared the accuracy of the LSI-R and the Correctional Offender Management Profiling for Alternative Sanctions (COMPAS; Brennan & Oliver, 2000) among a sample of male offenders released from assessment and treatment centers in New Jersey. The sample included a substantial number of racial/ethnic minorities (i.e., 71.4% Black, 15.0% Hispanic, and 13.6% White). Predictive inaccuracy was found to be contingent on race/ethnicity, in that Blacks were more likely to be overclassified by the tool when compared with the other racial/ethnic groups, and Hispanics and Whites were more likely to be underclassified.
Also utilizing a sample of offenders from New Jersey, Schlager and Simourd (2007) tested the validity and psychometric properties of the LSI-R on a sample of halfway house residents and day reporting center participants of entirely Black or Hispanic race/ethnicity. They found great similarity in the psychometric properties, internal consistency, and validity estimates between the two groups. In addition, there were no significant differences in the LSI-R composite scores of the two groups. Building on the findings drawn by an earlier validation study also completed in New Jersey (i.e., Schlager, 2005), the authors concluded that LSI-R scores of community corrections offenders in New Jersey do not vary significantly by race/ethnicity. However, the predictive validity estimates indicated that the LSI-R was correlated with recidivism outcomes, though these correlations did not reach statistical significance (Schlager & Simourd, 2007).
Gender and the LSI-R
Although women make up a smaller percentage of the U.S. correctional population than men (6.97% specifically), and subsequently comprise a relatively small proportion of the offenders that are reentering the community each year, the need for accurate risk assessment tools for this population is essential. However, utilizing actuarial instruments that were initially designed for male offenders may provide for inaccurate risk/need results for female offenders. Researchers have identified that female offenders, particularly those facing reentry, suffer from a number of issues that are different than male offenders (e.g., mental health problems, chronic and acute health issues, parenting and relationship concerns, poor educational and vocational training, and a history of violent behavior; Veysey, 2008). It has also been suggested that the pathways into and out of crime differ by gender (Bloom, Owen, & Covington, 2004; Covington, 2002; McIvor, Murray, & Jamieson, 2004; Ostermann & Herrschaft, 2013), and that the roles and identities males and females take on after reentry are very different (Herrschaft, Veysey, Tubman-Carbone, & Christian, 2009).
There is research to suggest that the differences found between males and females during reentry present themselves in the utilization of the LSI-R for a female offending population. A meta-analysis (Holtfreter & Cupp, 2007) of 11 studies that utilized mixed-gender samples or female-only samples in studying the predictive accuracy of the LSI-R concluded that the instrument correctly classifies females when their crimes are not of a “gendered” nature (i.e., crimes that most closely resemble that of males, such as economically motivated offenses, which are said to be rare among female offenders). Such findings were supported in a later study (i.e., Salisbury et al., 2009), which explored how gender-responsive needs impact the validity of established risk assessment instruments, including the LSI-R. Like Holtfreter and Cupp (2007), the authors concluded that the LSI-R was inaccurate for women whose offending was influenced by a “gendered” context; interestingly, needs as identified by the LSI-R were more predictive of community recidivism and institutional adjustment outcomes than offense-related outcomes.
There is also research that runs counter to such findings and concludes that the LSI-R performs well in predicting reoffending outcomes for female offenders. Folsom and Atkinson (2007) found that a self-report version of the LSI-R demonstrated reliability and predictive validity when measuring recidivism for a mixed-race group of female offenders released from a Canadian federal prison. In comparing the validity of the instrument across samples of male and female offenders, researchers have found few statistically significant differences across the sexes and have largely demonstrated strong predictive accuracy across various follow-up times and definitions of recidivism (see Andrews, Bonta, & Wormith, 2001; Olver, Stockdale, & Wormith, 2009, for specific examples, or Olver et al., 2014, for a synopsis; Ostermann & Herrschaft, 2013; Schwalbe, 2008; Smith et al., 2009).
Race, Gender, and the LSI-R
What is unclear from the results of prior studies exploring the validity of the LSI-R is a determination of whether and how the instrument’s predictive validity differs at the intersection of gender and race. One particular study (Holsinger et al., 2003) examined the predictive validity of the LSI-R using a mixed-gender sample of Native American offenders and a mixed-gender sample of non-Native American offenders. Ethnicity and sex were found to be significant predictors of LSI-R composite score. A follow-up study, evaluating the predictive validity of the instrument for the same group of offenders, found that the LSI-R was predictive of recidivism for the entire sample as a whole, but had mixed support when the results were disaggregated by subgroup, leading the researchers to deem the instrument a better fit for White offenders overall, male offenders overall, and White males and White females in particular (Holsinger, Lowenkamp, & Latessa, 2006). While a step in the right direction, the analyses suffered from small sample sizes, especially for the female Native American subgroup. Sample size was also found to be an issue for Folsom and Atkinson (2007) in their study of the predictive validity of the LSI-R across genders for Blacks, Whites, and Aboriginals. Ultimately, this study was not able to disentangle the differences between race and gender combinations because the researchers had access to a small subsample (n = 100) of female offenders.
The present study contributes to the extant research in this area by exploring the validity of the LSI-R to predict recidivism across unique race and gender group pairings. We explore recidivistic behavior patterns within 1 year of an inmate’s release from a correctional setting utilizing a large sample of individuals released from New Jersey prisons. We define recidivism as a rearrest or a parole violation that results in a revocation and a return to prison within 1 year of release. We pose three research questions: (a) Is the LSI-R a valid predictor of recidivism over a 1-year follow-up period across races (i.e., Black, White, and Hispanic); (b) Is the LSI-R a valid predictor of recidivism over a 1-year follow-up period across gender; and (c) Is the LSI-R a valid predictor of recidivism over a 1-year follow-up period across the various combinations of race and gender? The findings of the present study will advance the literature in the areas of risk assessment and evidence-based correctional practices, as well as aid corrections and community supervision agencies in better understanding the utility of the LSI-R assessment tool for racial and gender-specific subgroups of offenders.
Data and Methods
Participants
The New Jersey State Parole Board (SPB) collected data for this study. The SPB provided the authors with a database that highlighted individuals released from New Jersey Department of Corrections (DOC) facilities from 2004 to 2010 with demographic and pre-release LSI-R assessment score information attached to cases at an individual level. The sampling frame consisted of 62,329 individuals with complete information; of these, 4,727 offenders were women. An equivalently sized group of men were randomly selected 1 from the remaining sampling frame (n = 57,602) for a total final sample of 9,454 cases evenly split between men and women.
Table 1 presents the distribution of the final samples according to the combination of race, gender, and risk band characteristics. LSI-R score ranges within risk bands were informed by a previous validation study conducted in New Jersey (Schlager, 2005; 0-16 = low risk, 17-23 = moderate risk, 24-30 = medium risk, >30 = high risk). The modal race and risk band combination overall for both men and women were medium risk Blacks with 1,324 men and 1,067 women. The category with the overall smallest representation for males was low-risk Whites (n = 109); for females it was high-risk Hispanics (n = 83). Table 1 also displays the percentages of each racial category within gender, stratified by risk band.
Sample Representation by Gender, Race, and Risk Level.
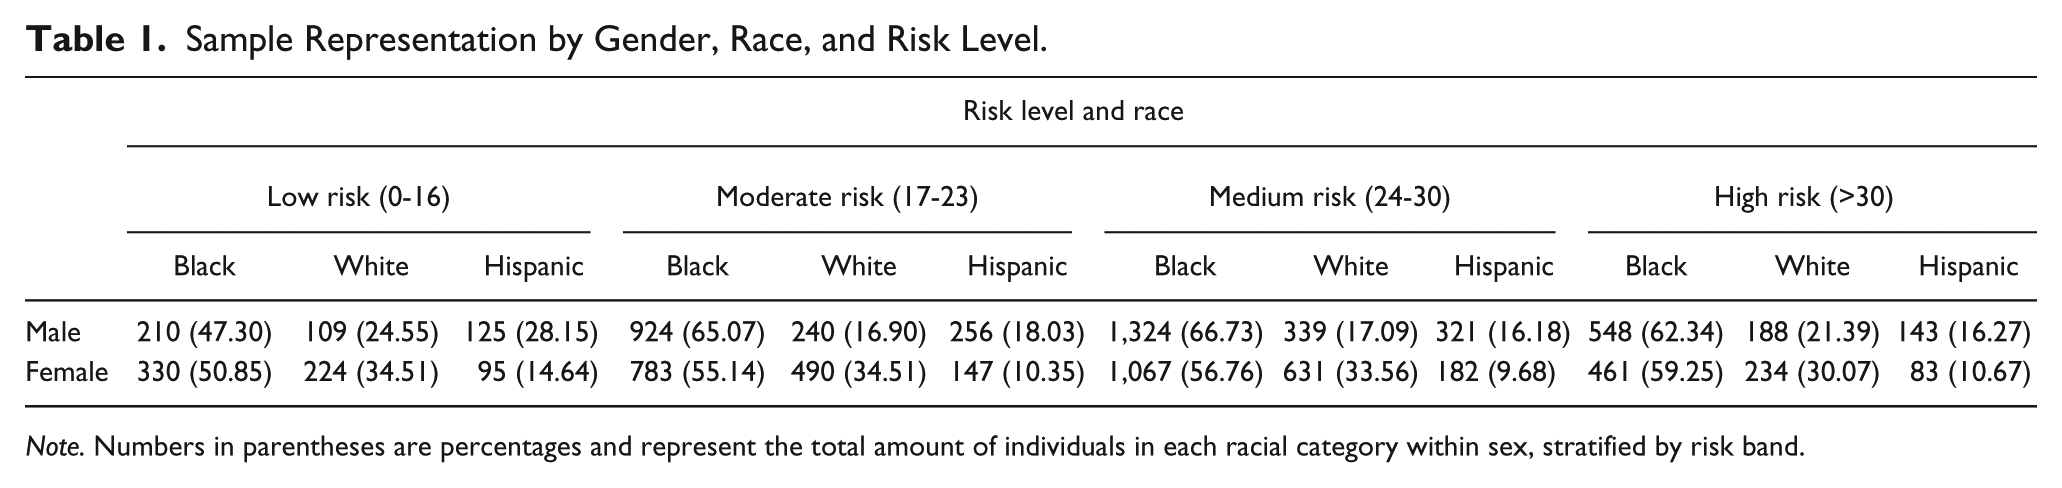
Note. Numbers in parentheses are percentages and represent the total amount of individuals in each racial category within sex, stratified by risk band.
Data Collection
Recidivism information was attached to each case through the use of an SPB data abstracting system administered and maintained by the state’s Department of Criminal Justice (DCJ). This system tracks individual-level arrest, conviction, and sentencing data associated with a unique state-level identifying number. For the purposes of this study, we define recidivism as an arrest for a new crime or a return to prison due to a parole revocation, whichever occurs first after release from DOC custody. We define recidivism in this way because our final sample consists of both parolees (n = 6,335) and unconditional releases (n = 3,119).
The DCJ’s data systems only include criminal outcomes and not parole revocations. If parole revocations were excluded from our recidivism definition, we would potentially run the risk of misidentifying parolees who had been revoked and returned to prison as successes rather than failures. Although a parole revocation ultimately results in a return to prison, the process of revocation in New Jersey does not necessarily include traditional court involvement. Hence, a parole revocation or a new arrest (whichever occurs sooner) represents the primary form of recidivism that a reintegrating individual could experience upon their release from a correctional institution, despite whether they are released to parole supervision or unconditionally at the expiration of a sentence. Parole revocation data were provided by the SPB.
Our data are right censored on December 31, 2011. As a result, we consider recidivism events if they occurred within one year of leaving prison. This allows us to maximize our sample sizes while including a reasonable follow-up time. 2
Data Analysis
Between-group differences were tested on a bivariate level for demographic and risk assessment variables both within and across different race and gender combinations. Bivariate differences in the recidivism outcome were further tested according to the different race, gender, and risk band combinations. Within these analyses, we specifically explore group differences within risk bands and between genders as well as within risk bands and between races. Chi-square tests, t tests, and Analysis of Variance tests were utilized for our bivariate analyses in accordance with the structure of the specific variable under analysis.
We test the validity of the LSI-R for the gender and race combinations through the use of correlation and receiver operating characteristic (ROC) area under the curve (AUC) analyses. Within the correlation analyses, we test the correlation between the recidivism outcome and the composite LSI-R score for each of the race and gender combinations. The ROC curves were used to assess the ability of the LSI-R to distinguish recidivists from non-recidivists according to the various race and gender combinations. Within our analyses, the AUC statistic that is produced from these curves communicates the probability that a randomly selected recidivist will have a higher LSI-R score than a randomly selected non-recidivist. AUC values of .50 communicate specificity no better than chance (e.g., a coin flip). Instruments that produce AUCs above .70 are typically considered “good” distinguishers of an outcome (de Vogel, de Ruiter, van Beek, & Mead, 2004).
Results
Bivariate Analyses
Table 2 presents descriptive statistics for the full sample, each gender and race, and each combination of race and gender. Results from bivariate statistical tests between genders and races are presented in the rightmost columns. On average, the former inmates in this study had LSI-R scores of about 24, with 11.56% being classified as low risk, 30.04% as moderate risk, 40.87% at medium risk, and 17.53% as high risk. Risk assessment scores and risk band classifications significantly differed both between genders (t = −6.51, p ≤ .001 and χ2 = 48.50, p ≤ .001) and races (F = 20.62, p ≤ .001 and χ2 = 11.16, p ≤ .01). Males had significantly higher scores than females on average. Hispanics had lower scores than Blacks or Whites. The modal risk category for genders and races was medium risk.
Descriptive Statistics by Gender and Race.
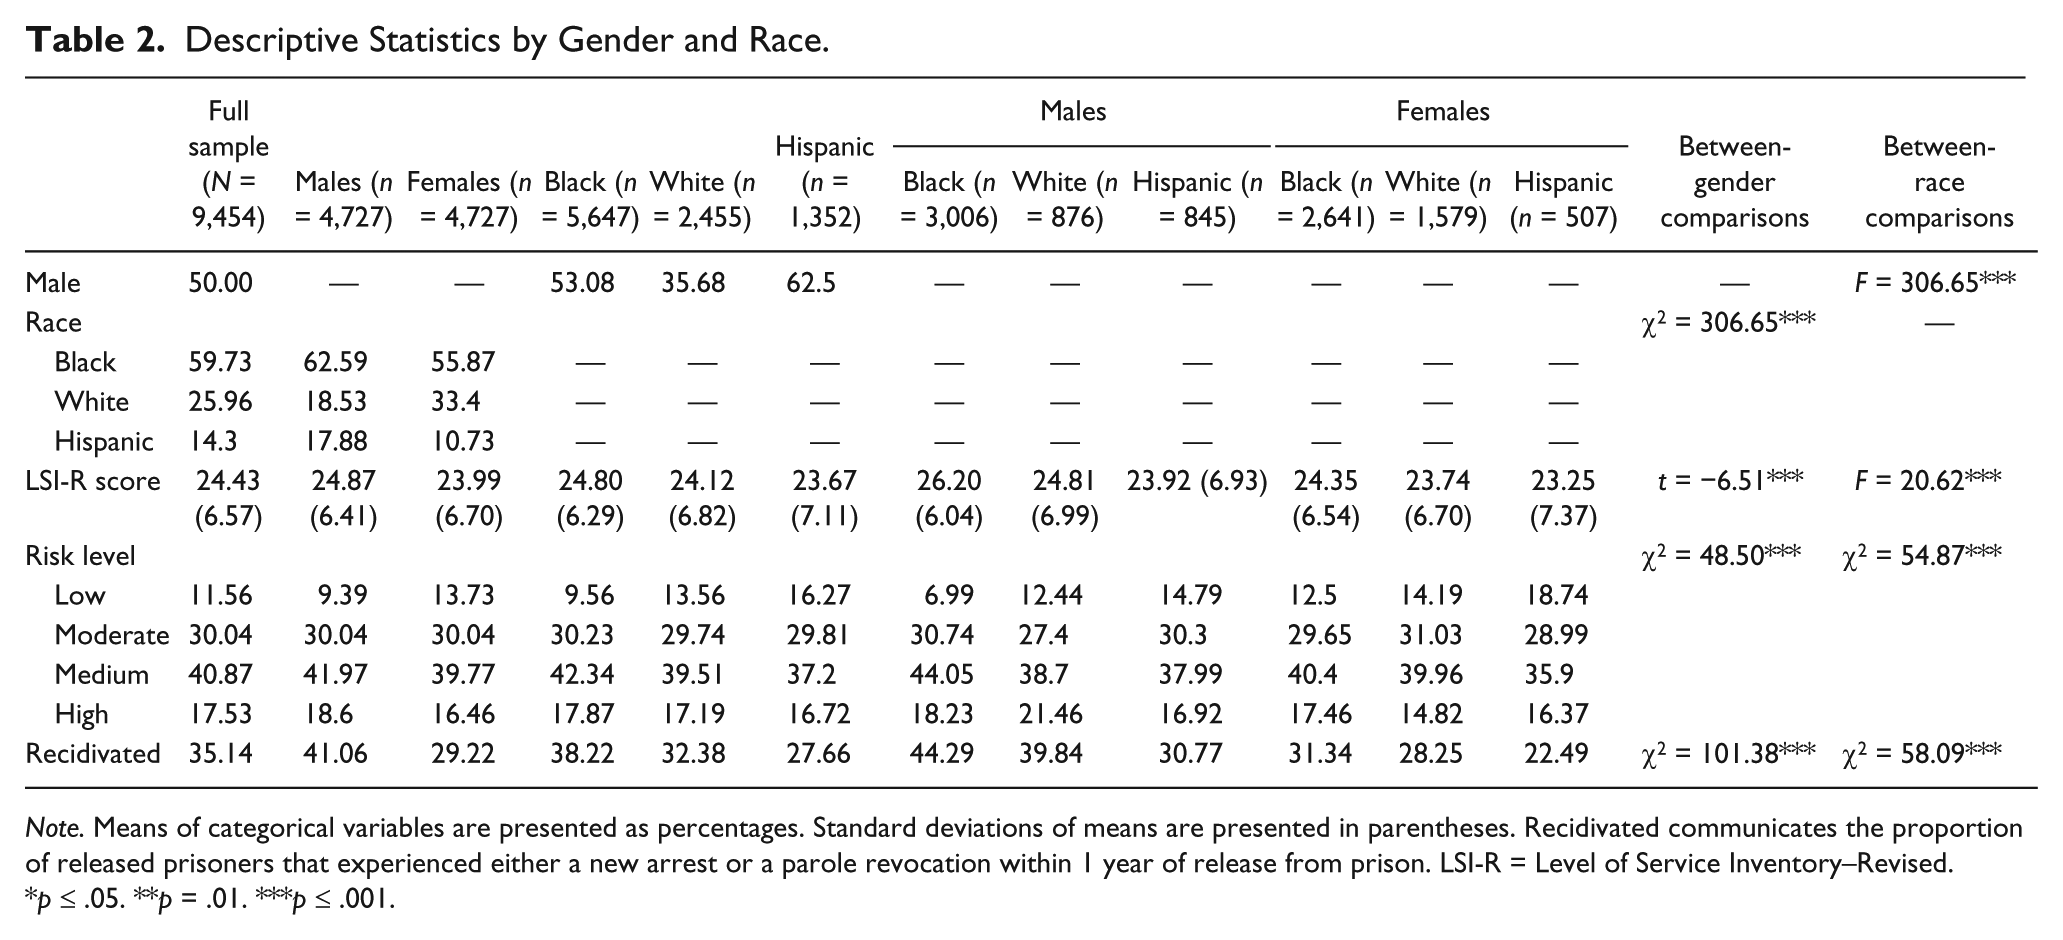
Note. Means of categorical variables are presented as percentages. Standard deviations of means are presented in parentheses. Recidivated communicates the proportion of released prisoners that experienced either a new arrest or a parole revocation within 1 year of release from prison. LSI-R = Level of Service Inventory–Revised.
p ≤ .05. **p = .01. ***p ≤ .001.
Approximately 35% of the sample was either rearrested or had their parole term revoked within 1 year of release from prison. A significantly higher proportion of males recidivated when compared with females (χ2 = 101.38, p ≤ .001), and a higher proportion of Blacks recidivated (38.22%) when compared with Whites (32.38%) or Hispanics (27.66%) (χ2 = 58.09, p ≤ .001). When looking at the race and gender combinations, about 44% of Black males and 31% of Black females recidivated. This recidivism rate is markedly higher when compared with the approximate 40% of White and 31% of Hispanic males that recidivated, as well as the approximate 28% of White and 22% of Hispanic females who recidivated.
Table 3 presents a more nuanced comparison of gender and race recidivism outcomes in accordance with the specific risk band in which the individual was classified. Approximately 16% of low-risk former inmates recidivated compared with about 30% of moderate risk, 39% of medium risk, and 49% of high risk. Significant differences in proportions of males and females who recidivated were apparent within each risk band classification (χ2 = 11.99, p ≤ .001), with the largest discrepancies between males and females occurring within the high- and moderate-risk categories. Between-race differences were also evident (χ2 = 14.04, p ≤ .001). Only 8.64% of low-risk Hispanics recidivated compared with approximately 20% of low-risk Blacks and 16% of low-risk Whites.
Recidivism Within 1 Year of Release From Prison by Gender, Race, and Risk Level.

p ≤ .05. **p = .01. ***p ≤ .001.
A similar pattern emerged between the moderate and medium risk bands, though differences were minimized in the high risk band, as 51.64% of Blacks recidivated compared with 45.02% and 45.13% of Whites and Hispanics, respectively. When examining recidivism outcomes within risk bands and between the race and gender combinations overall, males experienced higher recidivism rates when compared with females across all races. In some instances, the differences were extensive. For example, only 3% of low-risk Hispanic females reoffended compared with 13% of their male counterparts.
LSI-R Validation Analyses
Table 4 presents results from the correlation and ROC AUC analyses. The correlations investigate the relationships between the recidivism outcome and the composite LSI-R score according to gender and race in isolation, as well as gender and race combinations. In general, the recidivism outcome and the LSI-R composite score exhibited statistically significant (all relationships met the p ≤ .001 level), but weak, relationships. The r-values ranged from .1558 for Black males to .2828 for Hispanic females. The r-value for the full sample was .2034. Males exhibited a slightly lower r-value when compared with females (.1946 vs. .2005), and Blacks (.1835) exhibited lower r-values when compared with both Whites (.2012) and Hispanics (.2605). R-values for both Black males and Black females were consistently lower when compared with the other races within identical genders.
Correlation and Receiver Operating Characteristic AUC Results by Gender and Race.
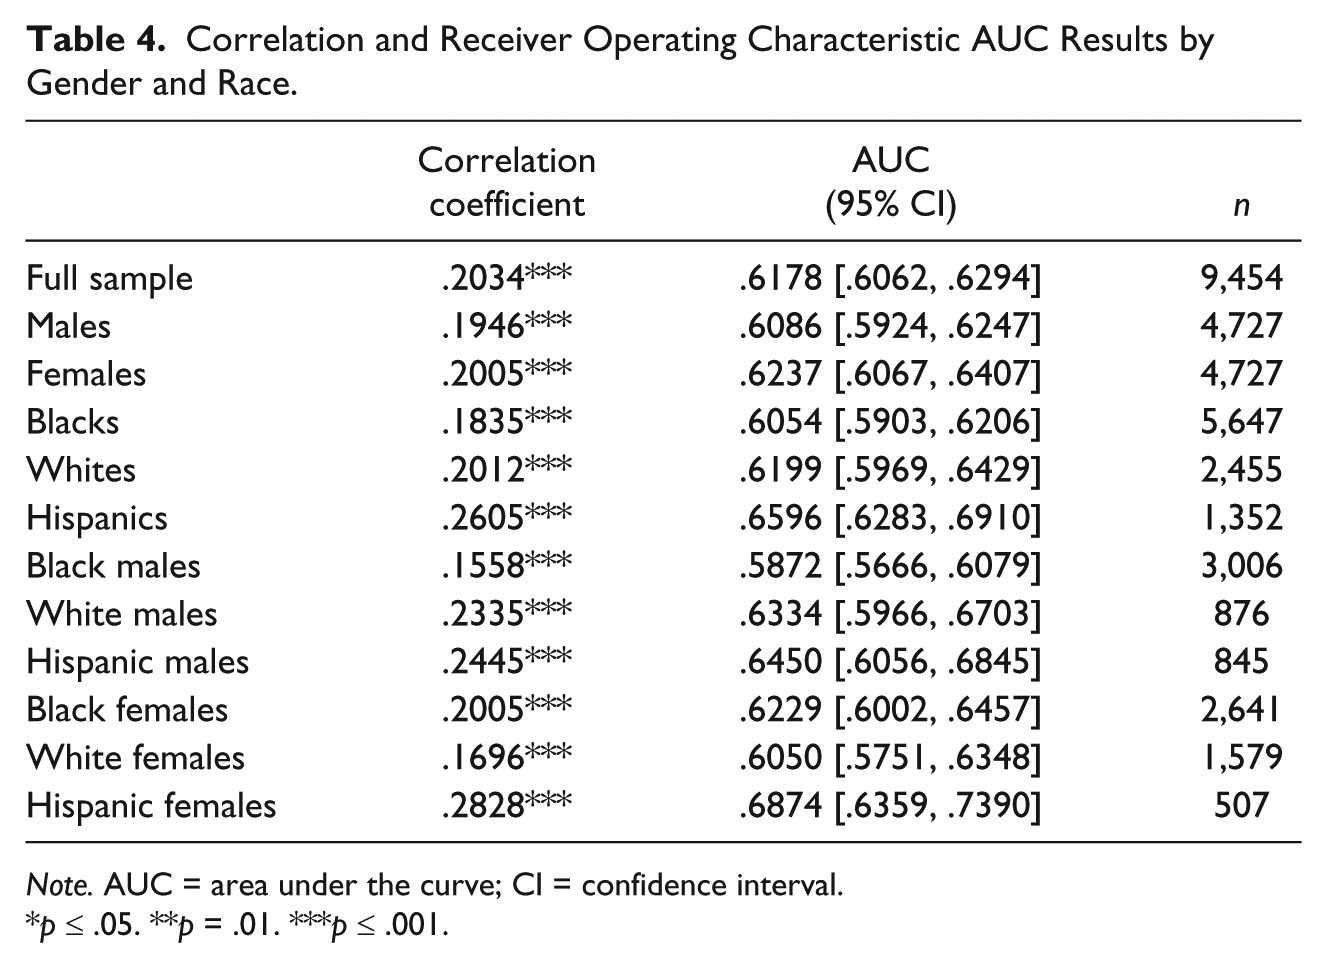
Note. AUC = area under the curve; CI = confidence interval.
p ≤ .05. **p = .01. ***p ≤ .001.
The ROC AUC findings show that, in general, the LSI-R demonstrated poor discriminant ability to distinguish recidivists from non-recidivists. The AUC for the total sample demonstrates that a randomly selected recidivist has approximately a 62% chance of having a higher LSI-R score than a randomly selected non-recidivist. For the full sample, the LSI-R improved the ability to distinguish recidivists from non-recidivists by approximately 12% above chance (AUC = .6178, 95% CI = [.6062, .6294]). AUC values were approximately 2 percentage points higher for females (AUC = .6237, 95% CI = [.6067, .6407]) when compared with males (AUC = .6086, 95% CI = [.5924, .6247]) and were highest for Hispanics (AUC = .6596, 95% CI = [.6283, .6910]) when compared with Blacks (AUC = .6054, 95% CI = [.5903, .6206]) and Whites (AUC = .6199, 95% CI = [.5969, .6429]). Within gender and racial combinations, the AUC values for Black males (AUC = .5872, 95% CI = [.5666, .6079]) were lower than those for White (AUC = .6334, 95% CI = [.5966, .6703]) and Hispanic males (AUC = .6450, 95% CI = [.6056, .6845]). However, Whites had the lowest AUC values within females (AUC = .6050, 95% CI = [.5751, .6348]) when compared with both Blacks (AUC = .6229, 95% CI = [.6002, .6457]) and Hispanics (AUC = .6874, 95% CI = [.6359, .7390]).
Figure 1 presents graphical representations of the ROC results for the six race and gender combinations. As demonstrated in the Figure, the ability of the LSI-R to distinguish recidivists from non-recidivists was not far above chance across all of the race and gender combinations. Relative to the other race and gender groups, the LSI-R was especially poor at distinguishing recidivists from non-recidivists for Black males. The AUC value for Black females was approximately 4 percentage points higher than their male counterparts. In addition, the AUC values for White and Hispanic males were about 5 and 6 percentage points higher (respectively) when compared with Black males.

ROC curves for gender and race combinations.
Discussion
The purpose of the present study was to test the validity of the LSI-R in predicting recidivism across race and gender, as well as various combinations of race and gender. We generally found that recidivism rates were significantly different within identical risk bands when looking at outcomes across genders, races, and combinations of genders and races. Males were more likely to recidivate than females across identical risk categories, and Blacks were more likely to recidivate than their White and Hispanic counterparts across identical risk categories. Similar patterns were found across the different gender and race combinations.
Our findings indicate that the instrument was a “valid” predictor of recidivism because the composite score demonstrated a statistically significant relationship to the recidivism outcome both within the full sample as well as our various subgroups. Additionally, the instrument was able to distinguish recidivists from non-recidivists above chance alone for all of our groups. However, when viewing the effect sizes produced from our analyses, the composite LSI-R score demonstrated weak relationships to one year recidivism outcomes and performed poorly at distinguishing recidivists from non-recidivists across races, genders, and combinations of races and genders. When compared with other race and gender combinations, we found that the LSI-R was an especially poor performer within the Black male subgroup.
For Black males specifically, the LSI-R score was weakly associated with recidivism, and was especially poor at distinguishing recidivists from non-recidivists. When compared with the other race and gender combinations, the correlation coefficient between the composite LSI-R score and the recidivism outcome was the lowest for Black males and this group exhibited the lowest ROC AUC values relative to the other groups. The correlation coefficient value of .1558 communicates essentially no relationship (despite its statistical significance) between the LSI-R score and recidivism for Black males. Further, the AUC value of .5872 communicates that the likelihood of a Black male recidivist having a higher LSI-R score than a Black male non-recidivist is only about 8 percentage points higher than simply flipping a coin. These findings are highly relevant from a policy perspective. Black males represent the modal category of race and gender combinations across many state-level corrections systems, as well as the United States as a whole (Carson, 2014). From a national perspective, Black males currently represent approximately 36% of the total prison population compared with 30% and 22% representations for their White and Hispanic male counterparts, respectively (Carson & Golinelli, 2013), and within our specific research setting, Black males represent approximately 55% of annual release cohorts (Ostermann, 2015).
Taken together, our results demonstrate that the LSI-R is a useful tool for aiding in the prediction of recidivism, but that the utility of the tool is conditioned by the particular racial and gender combination of the offender being assessed. This conclusion should be cautiously consumed, however, because it is difficult to disentangle the ways in which the results from the LSI-R are (or are not) used within our specific research setting. Generally speaking, the LSI-R is used to inform release decisions made by the SPB, and aids in parole officer case management decisions for parolees. What that means in practice is unknown, and the actual use (or disuse and/or lack of use) of the instrument in an applied setting would certainly impact the present study’s findings. Unfortunately, our study is not able to address questions of implementation.
Furthering this point, it is also unclear if results from the LSI-R are used in a systematic and appropriate way that aligns with established evidence-based practices (e.g., targeting high-risk individuals for services that align with their criminogenic needs). Additional research in this area is needed to disentangle process-level questions about how these instruments are used in applied settings. Specifically, future explorations should seek to better determine how law enforcement and corrections officials approach situations in which an arrest and/or parole revocation would be warranted, and whether their approaches toward these sorts of outcomes systematically differ across gender and races irrespective of actuarial risk. These endeavors may shed light on to why individuals within identical risk bands have marked differences in outcomes, and why these outcomes are impacted by race and gender characteristics.
Limitations
Our use of official records to measure recidivism and our use of 1 year of follow-up time would not allow for the measurement of unreported crimes in general, and unreported crimes that occurred more than 1 year after release in particular. While we did not have the resources to seek other means of measuring recidivism other than the use of official records (e.g., self reports), the use of 1 year of follow-up was a purposeful design of the study to maximize the sizes of our subgroups (i.e., limiting follow-up allowed for the inclusion of additional release years that were temporally close to the date on which our official arrest data were gathered).
It should also be noted that the present study was designed to explore the intersection of race and gender in predicting recidivism after an offender’s release from a correctional setting utilizing the LSI-R instrument only. While our findings may have implications for practitioners and clinicians who score offender risk using other actuarial instruments, as well as the criminal justice agencies that utilize the scores for decision-making, it is currently unknown how our results may generalize to offenders who are scored using instrumentation other than the LSI-R. Thus, the results of the present study should be generalized with caution.
Conclusion
The results of our study confirm previous findings about the validity of the LSI-R. The instrument is indeed a valid predictor of recidivism across races and genders, but its predictive utility is weak—especially for Black males. We demonstrated that different race and gender arrangements within identical risk bands exhibited, at times, starkly different recidivism rates when compared with one another. We recommend that the mechanisms that could potentially produce these differences be more closely studied in future research to provide improved guidance regarding how results of risk and needs assessments are used in applied settings, and how this use may differ according to gender and race.
Footnotes
Declaration of Conflicting Interests
The author(s) declared no potential conflicts of interest with respect to the research, authorship, and/or publication of this article.
Funding
The author(s) received no financial support for the research, authorship, and/or publication of this article.