
Abstract
The aim of the present research is to assess goal orientation (mastery and performance) by developing an objective behavioral test. We elaborated the Mastery Performance-Goal Orientation Test, a task that allows assessment of goal orientation along a single dimension. We studied its reliability and validity by conducting two studies. In Study 1 (N = 293 adults), the distribution of scores along the goal orientation variable showed wide variability and high internal consistency. The mastery-oriented participants demonstrated higher levels of category learning, whereas the performance-oriented participants responded in a less discriminative way but achieved higher scores. In Study 2 (N = 41 undergraduate students), the mastery-oriented participants achieved higher scores on a learning task than the performance-oriented subjects. The results also showed that the test had the potential to predict subsequent learning. We conclude that it might be a useful instrument to assess goal orientation.
Keywords
The Relevance of Computerized Objective Tests for Personality Studies
The study of personality traditionally has been focused on self-reports of individual behavior (e.g., Boyle & Barton, 2008; Fernández-Ballesteros & Botella, 2008; Proyer & Häusler, 2007). Self-reports not only allow us to obtain data quickly, but they also suffer from deficiencies. One of the main limitations is that social desirability can affect participants’ responses. People might respond by trying to describe themselves in a favorable way. In addition, people may answer in a positive way because they do not have an accurate self-view. Another limitation is acquiescence, which is the tendency to agree with the items regardless of their content. In short, these limitations involve the subjectivity of the people being assessed (Edwards, 1957; McDonald, 2008; Ortner & Proyer, 2015).
Personality variables can also be described based on the information provided by behavioral assessments. Observational ratings of personality require measuring and recording behavior in a specific context. For example, Hartshorne and May (1928) studied honesty in children by observing their behavior in situations in which they had the opportunity to lie, cheat, or steal. Funder, Furr, and Colvin (2000) developed the Riverside Behavioral Q-Short, a coding system to assess social behavior. In order to assess personality in work settings, Speer, Christiansen, and Honts (2015) designed the Work Simulation Personality Rating Scale, a behavioral observation inventory that can be applied in the human resources context. Observational methods provide information about what people do, instead of what they describe about what they do. However, one of their main problems is that participant’s behavior might be affected by the presence of an observer (McDonald, 2008).
Another procedure for conducting a behavioral assessment is the use of mechanical and computerized tests. Cattell and Warburton (1967) developed more than 400 tests to study personality by recording individual behaviors as they are carried out in controlled situations (Boyle & Barton, 2008; Cattell, 1963; Ortner & Proyer, 2015). Based on the pioneering work of Cattell and colleagues, and with the advance of new technologies, researchers have promoted the development of computerized tests to assess personality and competence variables. This methodology allows us to register not only the different responses of each participant but also the exact time they occur, as if we were observing the behavior (Bloom, 1992; Santacreu & Hernández, 2017). For example, in recent years, researchers have developed computerized tests to assess persistence (Santacreu & Garcia-Leal, 2000), risk-taking (Arend, Botella, Contreras, Hernández, & Santacreu, 2003; Lejuez et al., 2002), vocational interests (Proyer & Häusler, 2008), and conscientiousness (Hernández, Lozano, Shih, & Santacreu, 2009).
Computerized testing allows us to collect T data (Cattell, 1958, 1963, 1965; Cattell & Kline, 1977; for a review, see Ortner & Proyer, 2015; Santacreu & Hernández, 2017). It is possible to obtain these data from performance tasks that record responses for a series of stimuli without the participants knowing the test’s eventual objective (Proyer & Häusler, 2007). These tasks are called performance tests as well as objective tests. This is because they are objective not only from the researcher’s point of view (two researchers will obtain the same data) but also from the perspective of the participants being assessed (they do not know the specific variable that the test measures) (Cattell, 1965; Cattell & Kline, 1977; Proyer & Häusler, 2007). Self-reports are objective from the researcher’s point of view, but this methodology is not always objective from the perspective of the participants (they can find out which are the variables that are being assessed and that may encourage them to distort their responses) (Cattell, 1958).
Objective tests offer direct information about participants’ behaviors, instead of what the responders choose to inform the evaluator about their behavior. They are less affected by faking than self-reports. Therefore, it overcomes some of their limitations (Ortner & Proyer, 2015; Santacreu & Hernández, 2017; Santacreu, Rubio, & Hernández, 2006).
A set of standards needs to be fulfilled to produce valid and reliable personality assessments by using computerized behavioral tests (Cattell, 1965; Cattell & Kline, 1977; Ribes, 2009; Ribes & Sánchez, 1992; Santacreu et al., 2006):
All evaluated persons need to have the skills required to complete the test. They need to have a behavioral repertoire that allows them to solve the task. Individuals who perform the tests need to be motivated and respond appropriately to the demands of the task. Those evaluated need to be able to establish functional relationships among the presented stimuli. In other words, they should understand the purpose of the task and be able to follow the instructions properly. Therefore, the instructions need to be clear. Instructions must not direct participants’ behavior by describing which responses are more efficient. It is important that participants apply their response strategies in a natural way. The test should not provide feedback about the personality variable that the researchers want to evaluate. This variable need to be masked (Cattell, 1965). The configuration of the test might well allow the evaluated persons to discover the purpose of the test, but they should not be able to determine the variable that is actually being evaluated.
It is necessary to conceptualize personality from the point of view of behavioral theory in order to make assessments by using objective computerized testing. In addition, it is important to keep in mind possible interactions between people’s behaviors and their environmental contexts (Kantor, 1978; Ribes & Sánchez, 1992). Knowing that, we will use the term “interactive style” when talking about aspects of personality that affect behavior in specific contexts. We define interactive style as an idiosyncratic, consistent, and stable tendency that people show when they behave in particular situations (Ribes & Sánchez, 1992; Santacreu et al., 2006).
Goal Orientation Theory
For the present study, we have designed an objective test based on goal orientation theory. Ames (1984) and Dweck (1986) developed this theory by proposing a bidimensional model that identifies two types of orientations: performance-orientation and mastery-orientation. Mastery-oriented people want to learn and develop their abilities and competencies. They pay attention to their personal progress rather than attempting to be better than others. On the other hand, performance-oriented people want to gain advantages, to achieve the highest scores, and to show more competence than others. These people want to achieve their goals as soon as possible, without necessarily caring about learning or developing their abilities (Acarla & Bilgiç, 2010; Dweck & Leggett, 1988; Elliot, 2005; Elliot & McGregor, 2001; Morrone & Schutz, 2000; Payne, Youngcourt, & Beaubien, 2007; Shi et al., 2001; Skaalvik, 1997; Tanaka, Okuno, & Yamauchi, 2013). In sports psychology, the terms ego-orientation and task-orientation are also used, generally framed within Self-Determination Theory (see Deci & Ryan, 1985, for a review). Ego-oriented people are those who try to achieve the best results, whereas task-oriented people want to master certain skills, learn, and enjoy the activities they perform (Nicholls, 1989). Elliot and McGregor (2001) proposed an extended model, suggesting that mastery- and performance-oriented people can show differences in approach or avoidance motivation. Ten years later, Elliot, Murayama, and Pekrun (2011) proposed that people could show a mastery-oriented style in two variants, considering on the one hand those who want to improve their learning in relation to a standard, and on the other hand, those who seek to increase their level of competence in relation to their previous performance.
The application of goal orientation theory has the potential to improve the level of learning achieved in school and to avoid some problems in the educational field. For example, Shi et al. (2001) observed that performance-oriented students tend to use shallower strategies (e.g., shortcuts and conjectures) than those who are mastery-oriented.
Goal orientation theory is also important in the human resources field. Companies want their employees not only to work efficiently but also to make a clear impact on the global company profits. Managers often ask their employees about what they can contribute to the company or how they can add value to the company. Sometimes companies focus their efforts on short-term profits, depleting stocks, and exploiting their knowledge, while at other times, they initiate an expansion process investing in research and new products. People who seek mastery tend to learn, investigate, and improve company outcomes over the long term (Heidemeier & Staudinguer, 2015; Maden, 2015; Tanaka et al., 2013). On the other hand, performance-oriented people tend to outperform other people and to avoid being seen as incompetent (Heidemeier & Staudinguer, 2015; Midgley, Kaplan, & Middleton, 2001). Either mastery or performance orientations can be optimal depending on the circumstances (Midgley et al., 2001); therefore, companies will need to employ people with different levels of motivational orientation.
There have been attempts to determine whether there are any gender differences in terms of goal orientation, and thus far, the results have been mixed. Some studies have found that males are more performance-oriented than females (Heidemeier & Staudinger, 2015; Midgley et al., 2001; Shi et al., 2001). However, other studies have not found any significant results, which might be due to sociodemographic and socioeconomic differences across the samples (Frost, 2002; Givvin, 2001; Meece, Anderman, & Anderman, 2006). It appears that there are no consistent differences between men and women in terms of goal orientation. One of the purposes of the present research will be to explore the issue of possible gender differences in goal orientation.
Researchers have also examined the relation between goal orientation and other variables. Previous studies show that mastery orientation is positively related to learning (Bernacki, Byrnes, & Cromley, 2012; Payne et al., 2007). Keeping this in mind, the aim of Study 2 of the present work will be to study the relation between mastery orientation and learning. Furthermore, studies have shown that this orientation is positively related to extraversion, openness (Bipp, Steinmayr, & Spinath, 2008; Day, Radosevich, & Chasteen, 2003; Payne et al., 2007), and positive affect (Mouratidis, Vansteenkiste, Lens, & Auweele, 2009; Pekrun, Goetz, Titz, & Perry, 2002). Mastery orientation is also negatively related to neuroticism (Bipp et al., 2008; Chen & Zhang, 2011; Day et al., 2003), anxiety, and anger (Hall & Kerr, 1997; Mouratidis et al., 2009; Payne et al., 2007). Mastery-oriented people tend to search for stimulation and new tasks for entertainment and to increase their competence. Moreover, this orientation is related to persistence (Day et al., 2003) and conscientiousness (Brown & O'Donnell, 2011; Colquitt, LePine, & Noe, 2000; Payne et al., 2007). Mastery-oriented people tend to be organized and to persist in the face of difficulties.
On the other hand, performance orientation correlates positively to neuroticism (Bipp et al., 2008; Day et al., 2003), anxiety, anger, and shame (Duda & Ntoumanis, 2003; Hall & Kerr, 1997; Mouratidis et al., 2009; Payne et al., 2007). Performance-oriented people tend to experience negative emotions when they need to show their competence. In addition, performance-avoidance orientation is negatively related to task persistence (Day et al., 2003; Elliot, 2005), extraversion, and openness (Day et al., 2003). When facing difficulties, performance-oriented people tend to reduce effort, and they do not actively seek out or enjoy challenging tasks.
Tests based on self-reports have been the most common means of assessing goal orientation and related variables. The most frequently used goal orientation tests are the Patterns of Adaptive Learning Scale (Midgley, Maehr, & Urdan, 1993), the General Learning and Performance Orientation Scale (Button, Mathieu, & Zajac, 1996), the Work Domain Goal Orientation Instrument (Vandewalle, 1997), Skaalvik’s questionnaire (1997), the Achievement Goal Questionnaire (Elliot & McGregor, 2001), and the Achievement Goal Questionnaire-Revised (Elliot & Murayama, 2008).
Because researchers have assessed goal orientation almost exclusively by using self-reports, our aim is to expand its theoretical development by assessing individual goal-oriented behaviors in task performance. In the present study, we used a category learning task in which we classified people into two groups based on their behaviors: those who learn which category distinctions lead to the highest scores (mastery-oriented) as opposed to people who achieve high scores without depending on category-determined reasoning (performance-oriented).
Aim of the Study
The aim of the present research is to conduct two studies to develop an objective test to assess mastery and performance orientations as interactive styles. Our plan was to design a test that provides T data (objective information about goal orientations) and to study its reliability and validity. Taking into account the conditions needed to create an objective test, we have developed the Mastery Performance-Goal Orientation Test (MP-GOT), a computerized test that allows us to study the two modalities of goal orientation: mastery and performance orientation.
In Study 1, the MP-GOT test will be administrated to study its psychometric properties. In order to adhere to design standards of an objective test, it is necessary to check that the results are independent of competence and motivation in performing the task. The next step will be to determine whether the task allows us to discriminate between participants in terms of their goal orientation. If so, the results will show discriminative variability.
In addition, and without any preliminary hypotheses, another aim will be to check if there are any gender differences in goal orientation.
In order to evaluate the reliability of the test, we will calculate Cronbach’s alpha as well as whether participants maintain consistent orientations throughout the test.
If the test allows us to discriminate between participants who follow different strategies to achieve their goals, we will attempt to determine if such differences align with the conceptualization of mastery and performance orientations in the measured variables. Given the foundations of goal orientation theory (Ames, 1984; Dweck, 1986; Elliot & McGregor, 2001; Shi et al., 2001; Skaalvik, 1997; Tanaka et al., 2013), we would expect mastery-oriented people to learn more than performance-oriented participants. It is expected that performance-oriented participants should achieve higher scores.
Then, a second study will be performed to determine if mastery-oriented people get higher learning scores than performance-oriented participants in a different objective learning task. It is hypothesized that a high correlation will be found between the Goal Orientation variable and scores in the learning task.
Study 1
Method
Participants
Participants were 293 adults (175 males and 118 females) who took part in a hiring process that was part of an application for a job with a new company. The average age was 35 years (varying between 24 and 60 years). All of them had some university-level instruction.
Instrument
We developed the MP-GOT to assess goal orientation as an interactive style. The real purpose of the assessment was masked, as required by the standards of objective testing (Cattell, 1965; Cattell & Kline, 1977; Ribes, 2009). The instructions stated that the goal of the test was to accumulate points by using the mouse to click on different figures presented on a computer screen, and that some clicks would lead to greater numbers of points than others. Participants were expected to learn which category of figures was associated with the highest score, though this fact was not communicated to the participants, either in the instructions or in any other stage of the test.
There were 12 trials, and each lasted for 20 seconds. A sliding bar showed the time elapsed until the end of the trial. Trials 1–6 were training trials.
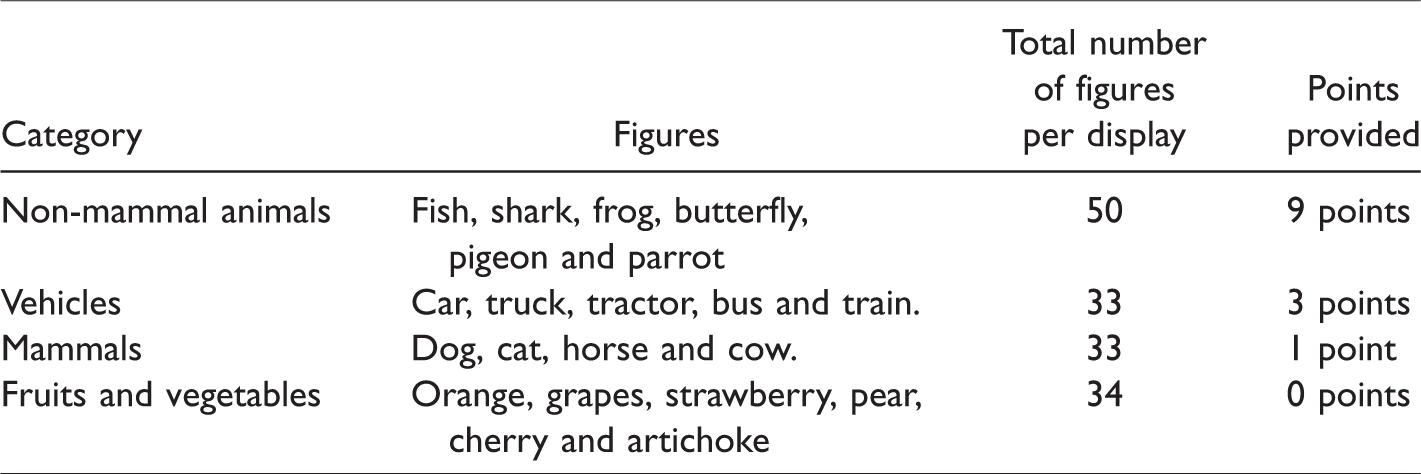
In each trial, a 15 × 15 matrix (225 squares) was presented on a computer screen, and 150 of the squares contained figures randomly distributed over them. Figures were same size and color and represented animals, vehicles, fruits, and plants (Figure 1). When clicking on each figure, the number of points awarded for each click was immediately displayed. Table 1 shows the numbers and types of figures in each category and the points awarded for each response to a category member. We decided to provide 9, 3, 1, or 0 points to clearly differentiate rewards for responses across the different categories.
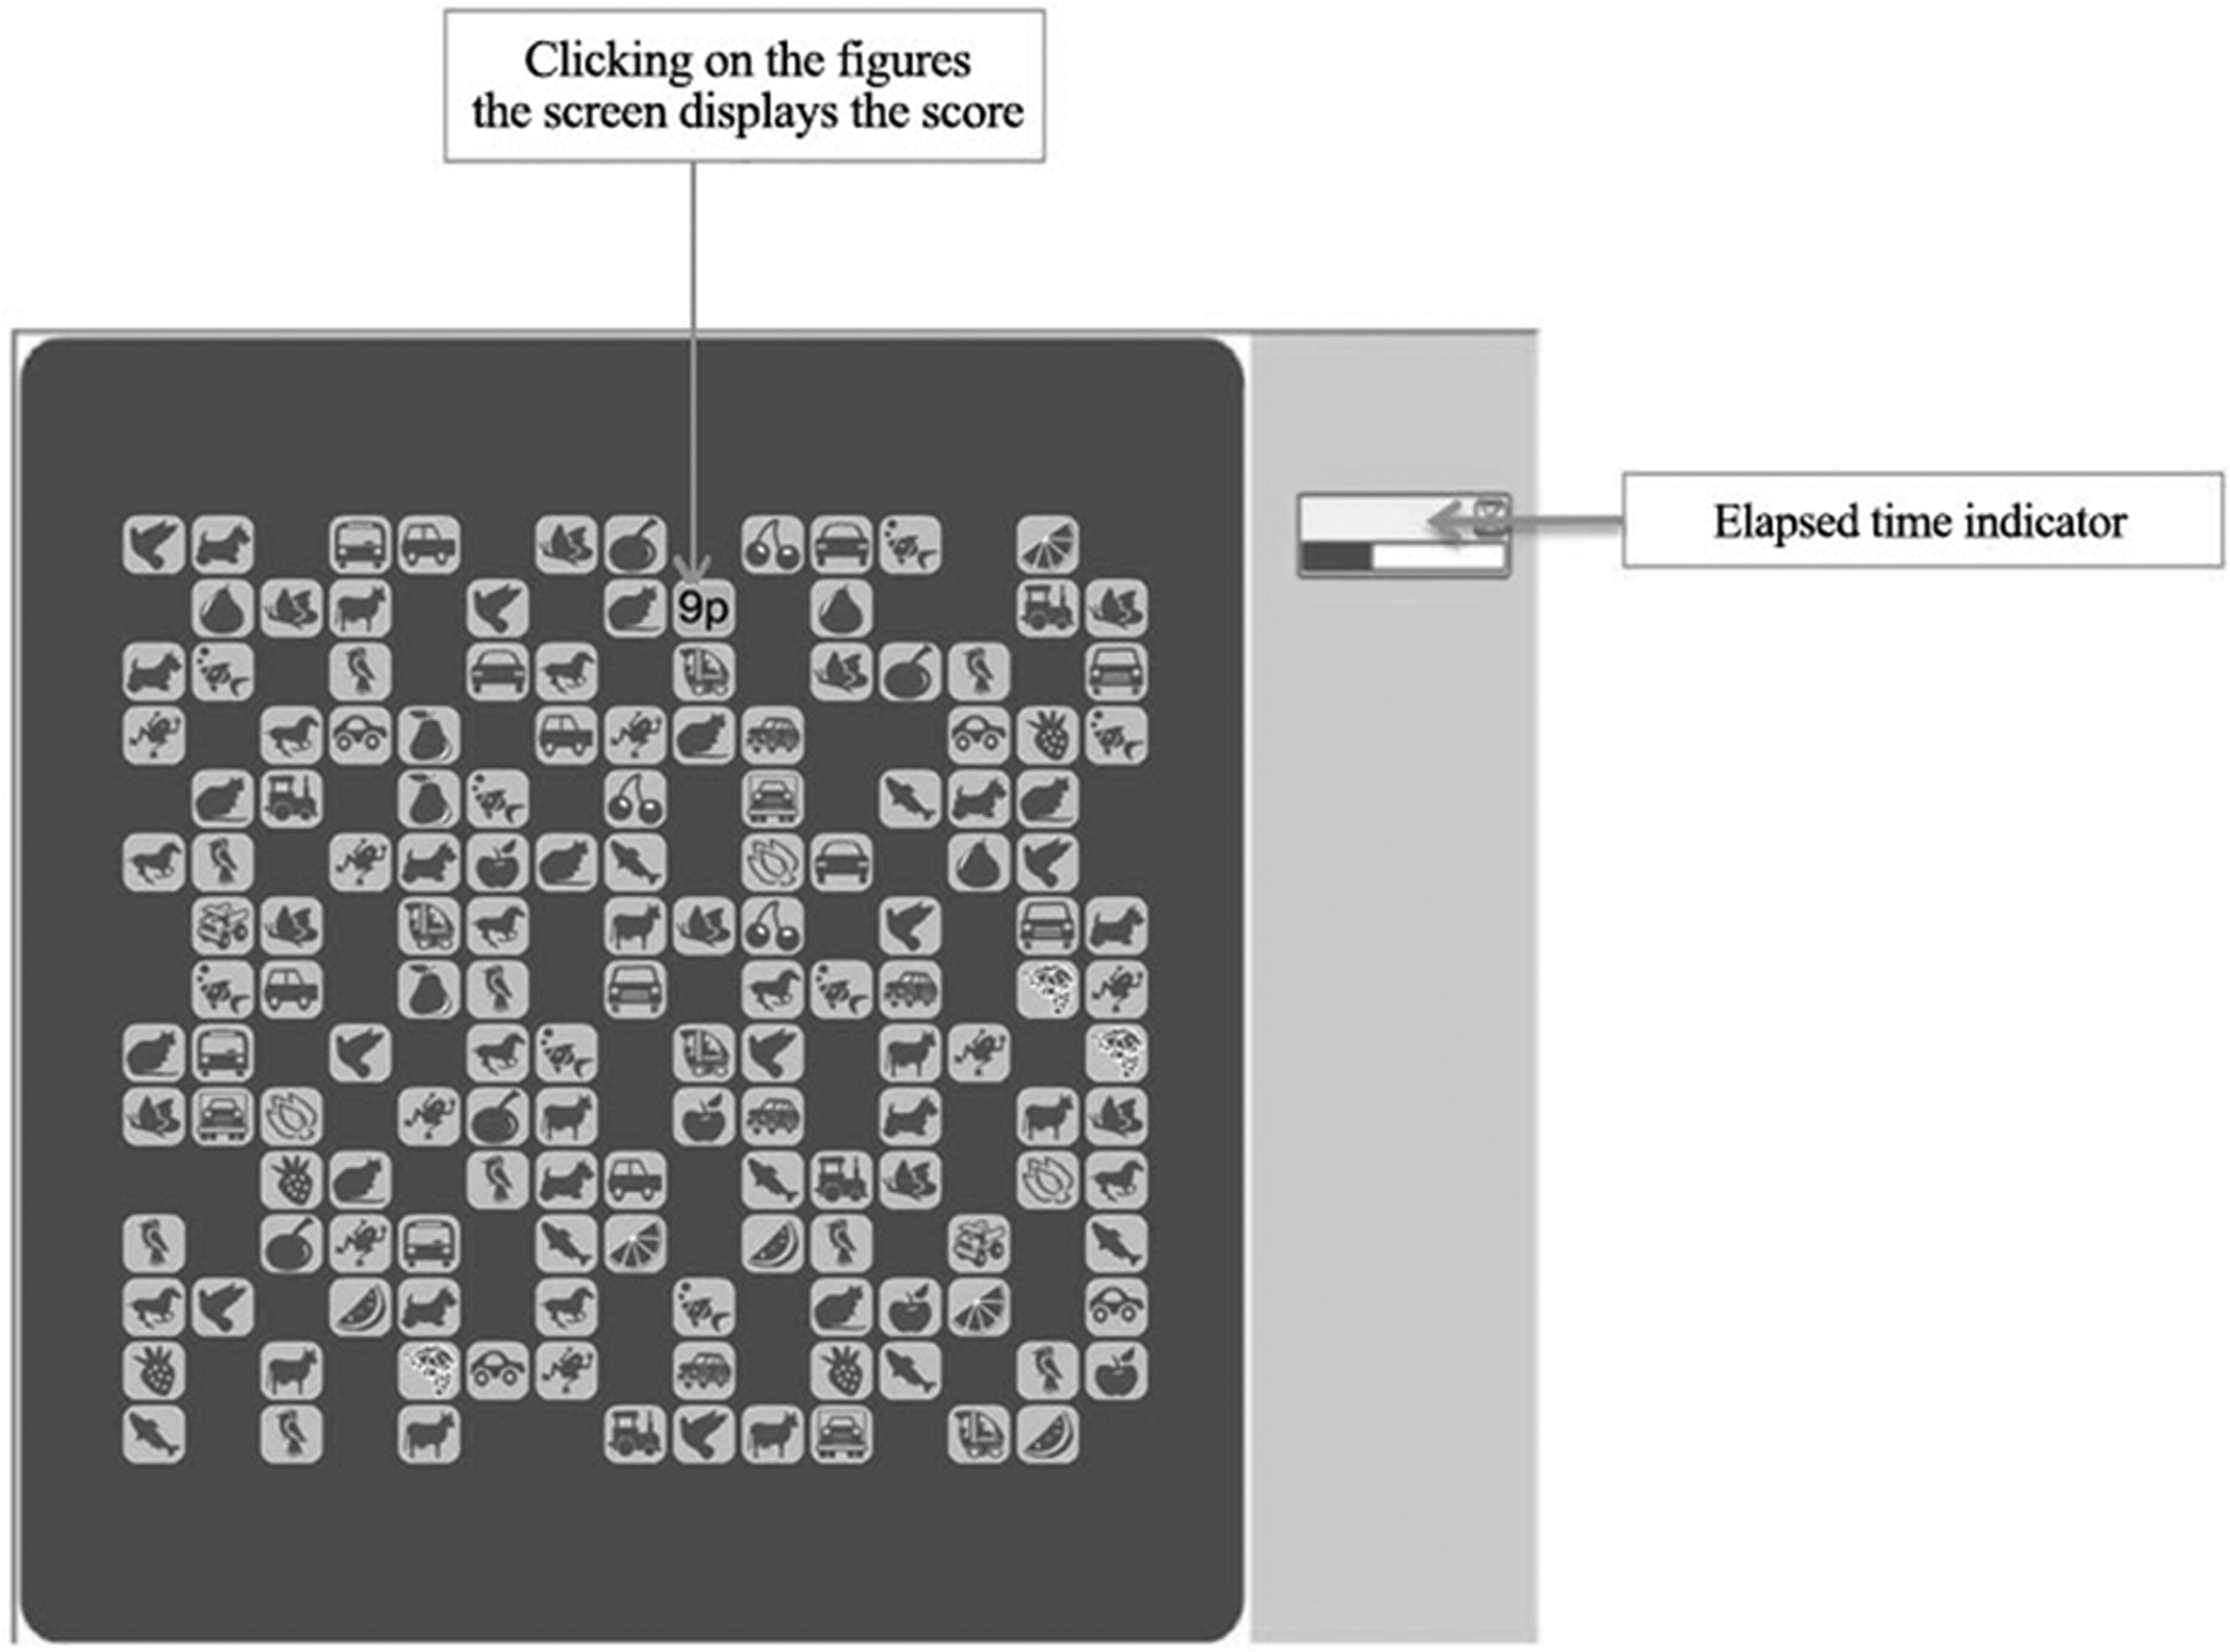
Example of a display shown on each trial of the MP-GOT test (Study 1).
Number of figures and points provided by each of them (MP-GOT; Study 1).
Clicks on non-mammal animals resulted in feedback of 9 points awarded, whereas clicks on vehicles or mammals resulted in feedback of 3 points awarded. When participants clicked on a fruit or a vegetable, the figure changed to a grey square (0 points awarded). No action was taken nor were any points awarded for clicking on the grey squares. After each trial, the test displayed the total number of points scored. As required by objective test standards, the test did not provide feedback about the interactive style that was being assessed.
Dependent variables
The computer recorded information about which figures participants clicked and the precise time of each click. It also allowed us to obtain data about the following variables:
Number of optimal responses: total number of clicks on figures from the category that provided 9 points (non-mammal animals). Number of non-optimal responses: total number of clicks on figures other than those that could be worth 9 points. We were interested in knowing the number of clicks on optimal figures and the total number of clicks on the other figures. Therefore, to simplify, all clicks on figures other than the targets were considered as non-optimal. Total responses: total number of clicks on any of the figures (Number of optimal responses + Number of non-optimal responses). Learning: total number of optimal-figures clicked/total responses. Ratio of optimal responses across trials. Reinforcement rate (Points): Mean number of points per second. Response rate: Mean number of clicks per second. Goal orientation: mean of ((total points over the last six trials)/(total responses in the last six trials)). That is, the mean number of points per response over the last six trials. This variable assumes a single bipolar dimension, from performance orientation (a value close to 2.6, the expected value of points per click if the categories of figures are ignored) to mastery orientation (a maximum value of 6.7, the expectation if only the optimal-category items are clicked). Participants classified as performance-oriented will have a low score in goal orientation, despite their potential ability to get a high number of points, if they click indiscriminately on as many figures as possible during the trial, rather than seeking out and clicking on high-value figures. In contrast, participants classified as mastery-oriented will have a high score in goal orientation, despite having potentially lower overall scores, because they will attempt to restrict their clicks to the optimal figures.
Procedure
The test was part of a wider battery that the participants completed in a recruitment process. They all signed an informed consent document thereby allowing their test data to be used anonymously for research purposes. They completed the tests using a secure identification and password on a web server. Participants did not need to have specialized computer abilities; they only needed to have experience using a web browser and mouse.
At the beginning of the task, the participants received instructions and examples of how to complete the task. Once the participants understood the instructions, they began to perform the test.
Data were automatically registered and stored in a safe server. There were no personal identifications of the participants except for gender and age. The data analyses were carried out using the SPSS Statistics 24 software program. Data necessary to reproduce the results are available upon request from the corresponding author.
Results
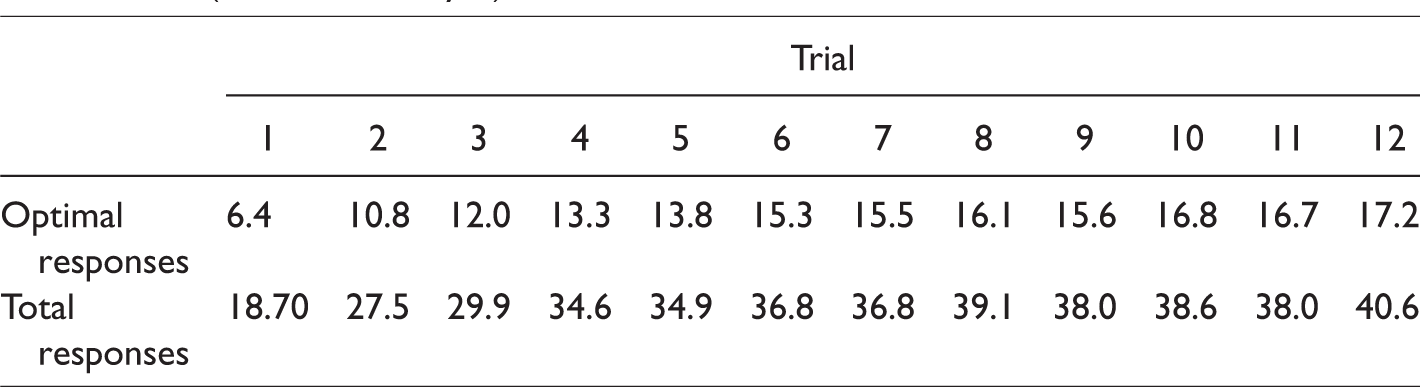
The first step was to analyze the difficulty of the test and evaluated the participants’ motivations to check on the fulfillment of objective test standards. The established ability criterion was that each participant should make a greater proportion of optimal responses than that expected by chance (Number of optimal figures in each trial/Total number of figures = 50/150 = 0.33) in each of the first six trials. All participants fulfilled this criterion. The motivation standard we set was that participants should click on a minimum of nine figures in each trial. All participants fulfilled this criterion as well. Table 2 shows the mean number of optimal responses and the mean number of total responses for each trial. As seen in the table, both the mean numbers of optimal responses and total responses increase across trials.
Mean numbers of optimal responses and total responses obtained in each of the 12 test trials (MP-GOT; Study 1).
The next step was to explore the variability of the outcomes. Figure 2 shows the distribution of the Goal orientation variable. It shows a significant deviation from normality (Kolmogorov–Smirnov normality test; p < .001), and appears to be bimodally distributed over the range of observed scores between 2.48 and 6.75.
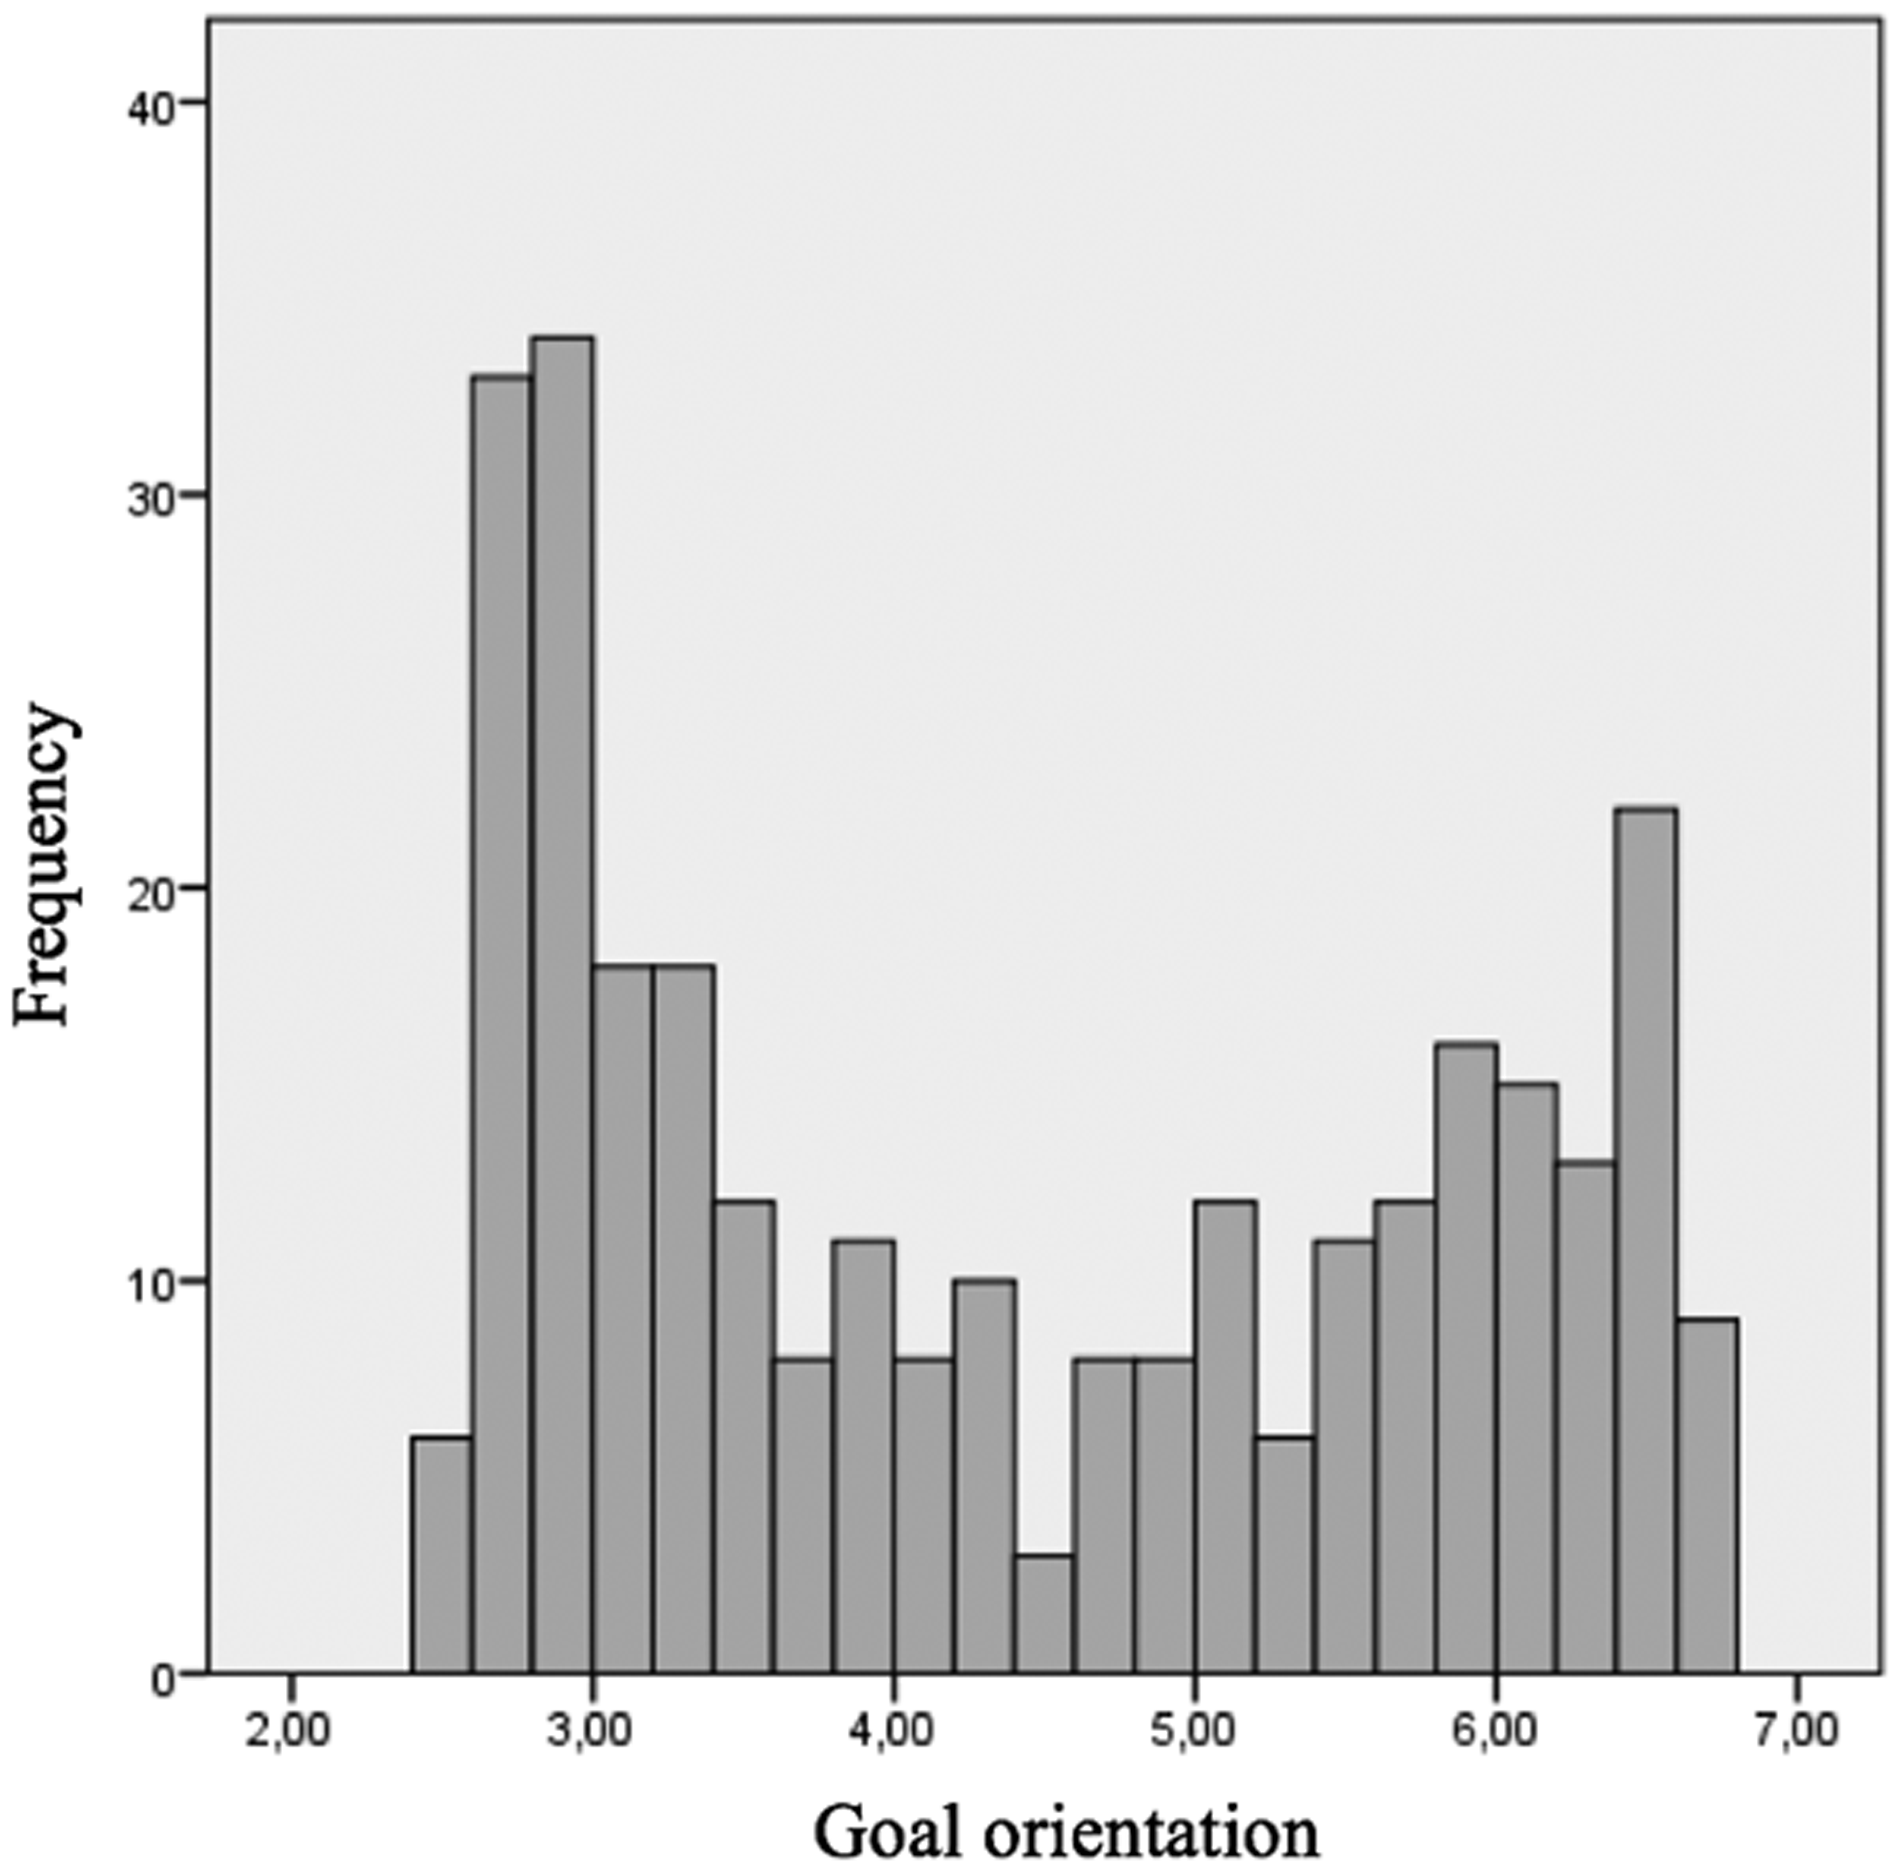
Distribution of the Goal orientation scores across all participants in the last six trials. Note: Goal orientation = Mean of (total points/total responses) (Study 1).
Table 3 shows descriptive data of the variables measured by the test (men, women, and combined samples). Figure 3 shows the development of Learning, Reinforcement Rate (Points), and Goal orientation variables across trials. As seen, scores increased for the first six trials and then showed a more stable tendency.
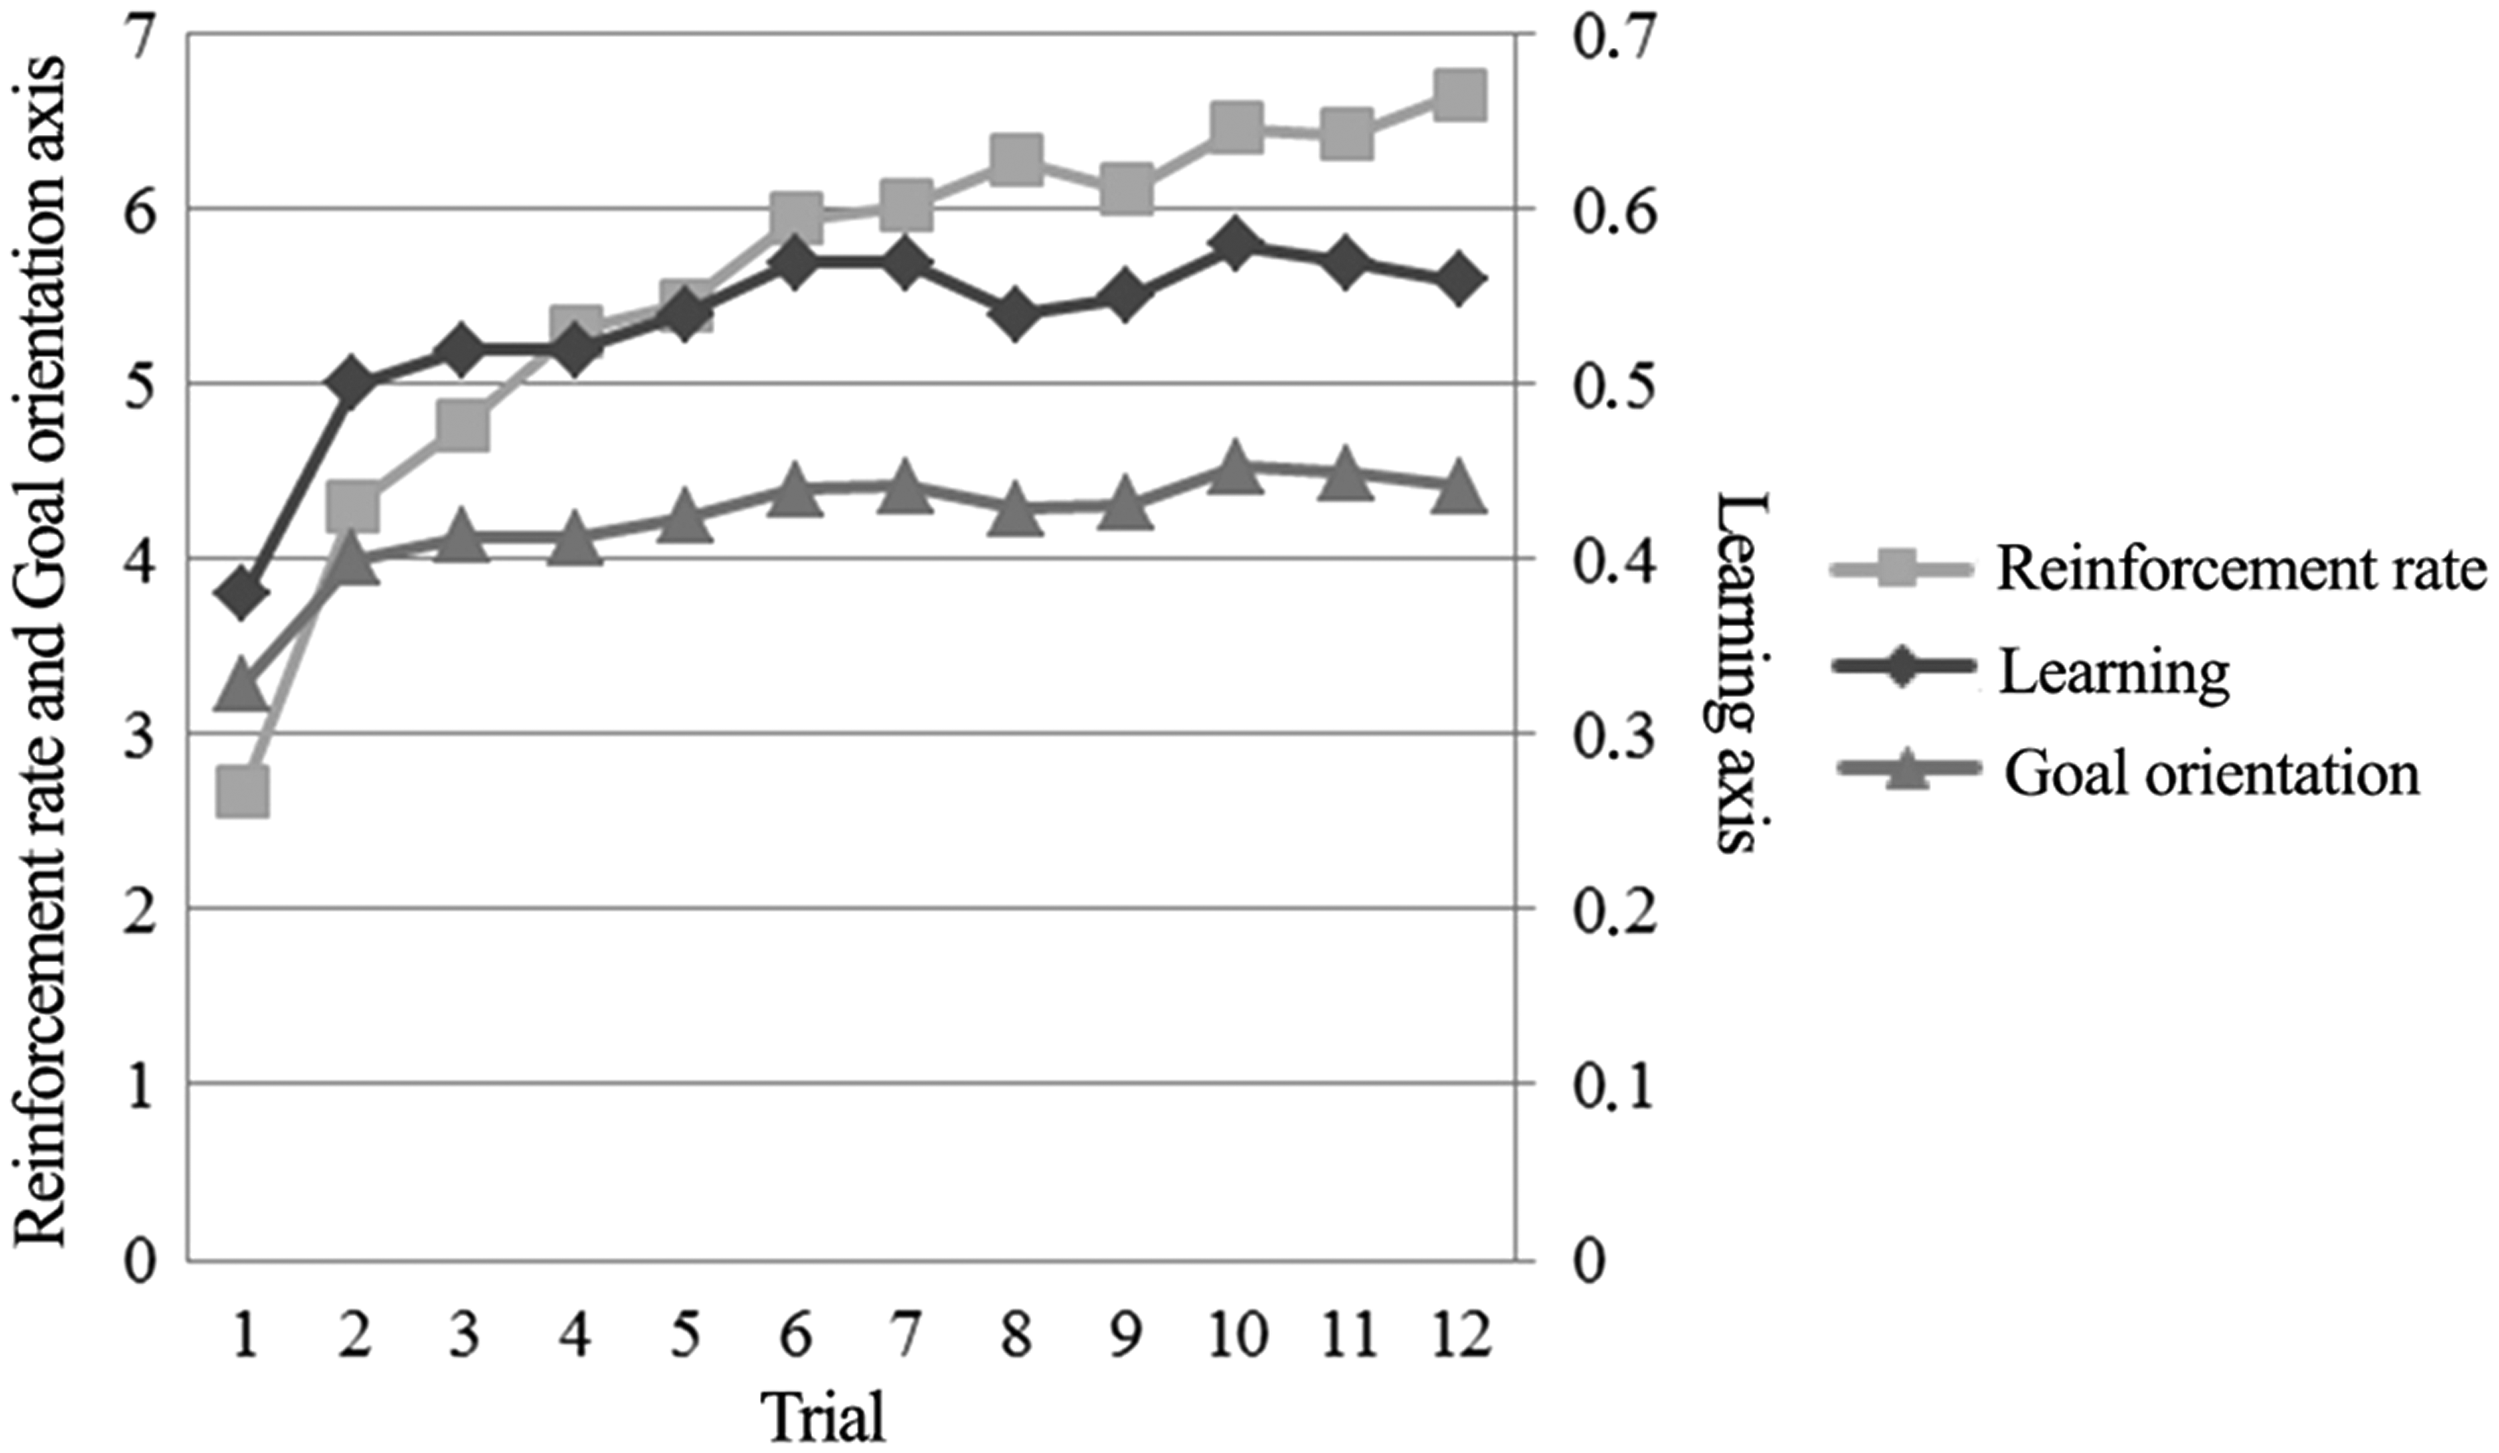
Scores of the variables along all trials in the total sample (Study 1).
Descriptive data of the variables recorded in the MP-GOT test (Study 1).
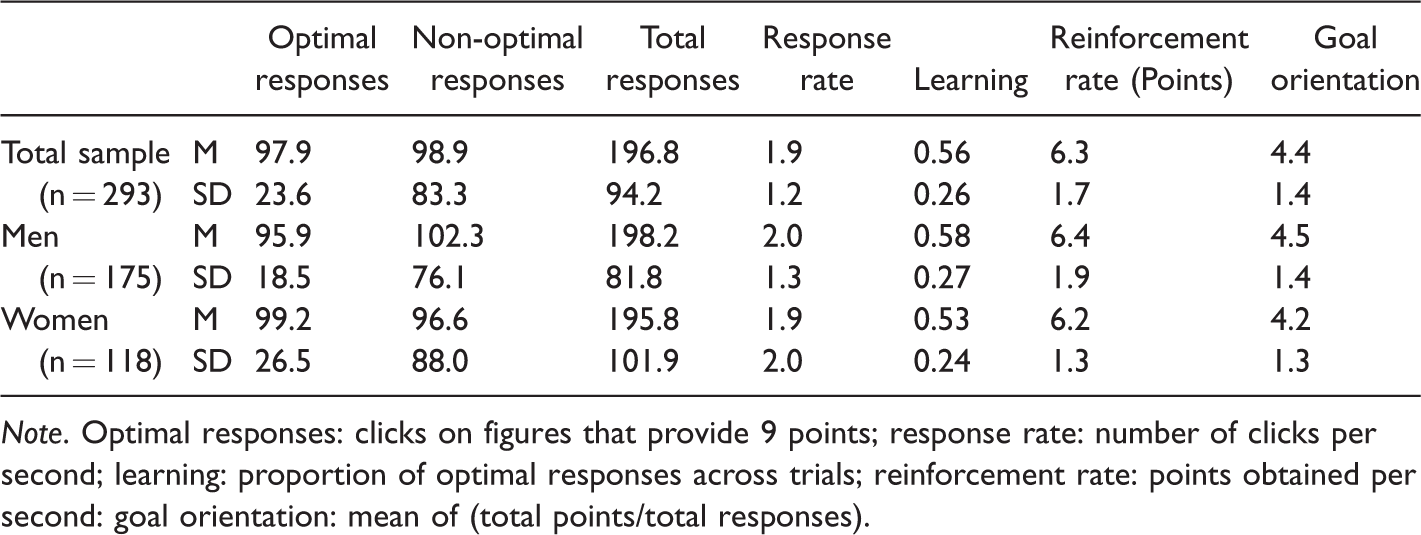
Note. Optimal responses: clicks on figures that provide 9 points; response rate: number of clicks per second; learning: proportion of optimal responses across trials; reinforcement rate: points obtained per second: goal orientation: mean of (total points/total responses).
In order to check the internal consistency of responses in the task, we calculated the values of Cronbachs’ alpha coefficient for the last six trials (data of the six training trials were not considered). Cronbach’s alpha for Learning, Reinforcement rate (Points), and Goal orientation had values of 0.97, 0.96, and 0.97, respectively.
We assessed whether participants showed consistent orientation throughout the test by using the interitem-variance procedure (Baumeister & Tice, 1988). To check consistency, these authors calculated variance of responses to the items on a test for each participant (interitem-variance). Then, they calculated the mean of interitem-variance values to establish a criterion: they classified participants who showed interitem-variances values below the mean as consistent and participants with interitem-variances above the mean as nonconsistent. In our study, we calculated interitem-variance of the Goal orientation variable for each participant and found a mean value of 0.36. We classified participants with variance scores below the mean as showing higher consistency. By this criterion, 70% of them showed high consistency.
In addition, gender differences in all measured variables were calculated and compared using t tests for independent samples. There were no significant gender differences in any variable (p > .05).
Finally, to observe the scores of mastery- and performance-oriented participants in the variables measured by MP-GOT (Reinforcement rate, Response Rate, and Learning), the sample was divided into two groups. The division criterion was a goal orientation mean of 4.4. We classified participants with lower scores on this variable in the performance-oriented group (GOT-Performance) and participants with higher scores in the mastery-oriented group (GOT-Mastery). Then, mean differences (t test for independent samples) were calculated. The GOT-Performance group had significantly higher scores on the Reinforcement rate (Points) and Response rate variables. However, they had lower scores on the Learning variable. All the differences were statistically significant (Table 4).
Scores and mean differences obtained by the performance-oriented and mastery-oriented participants (Study 1).
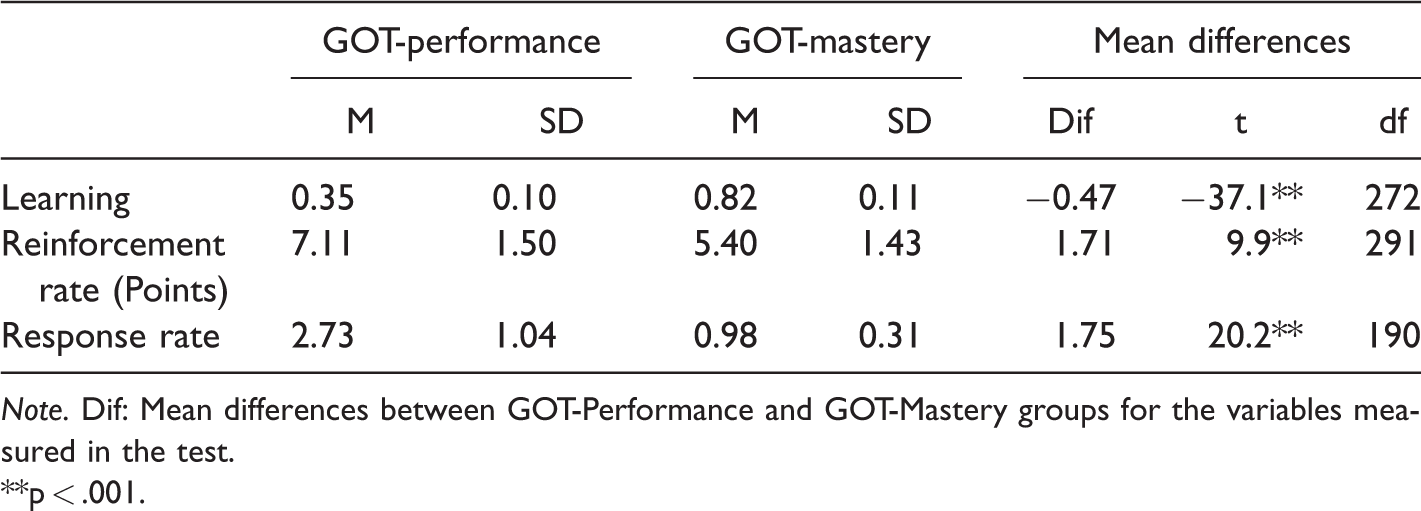
Note. Dif: Mean differences between GOT-Performance and GOT-Mastery groups for the variables measured in the test.
**p < .001.
Study 2
In order to examine the validity of the test, a second study was conducted. As mentioned above, given the theoretical foundations and empirical studies (Ames, 1984; Bernacki et al., 2012; Dweck, 1986; Payne et al., 2007), we would expect mastery-oriented participants to learn more than performance-oriented ones.
In this study, the MP-GOT was administrated to check if the Goal Orientation scores showed a correlation with learning measured by a different learning task and to study the predictive validity of the test. We also checked mean learning differences within mastery and performance groups.
Method
Participants
Participants were 41 undergraduate adults (7 males and 34 females) from the Psychology Department of the Autonomous University of Madrid. The average age was 20 years (varying between 19 and 25 years).
Instruments
The Mastery-Performance Goal Orientation Test was used to assess achievement goals. Configuration of the test was the same as described in Study 1.
We measured learning by using an objective operant task named Treasure Forest. The instructions described that the goal of the task is to search for coins under trees. It had two different phases. In Phase 1, participants had to learn which two types of trees provide a coin (target trees). As this phase was long and easy enough, all participants were expected to learn to perform the task. In Phase 2, the types of trees that provide a coin changed. Participants had to modify their behavior and learn which trees were changed to targets.
There were a total number of 18 trials (12 for Phase 1 and 6 for Phase 2). Each trial lasted for 10 seconds and during which a 16 × 16 matrix (225 squares) was displayed on a computer screen. The matrix contained 70 figures randomly distributed over the 225 squares. Figures were the same size and color and represented different types of trees (see Figure 4).
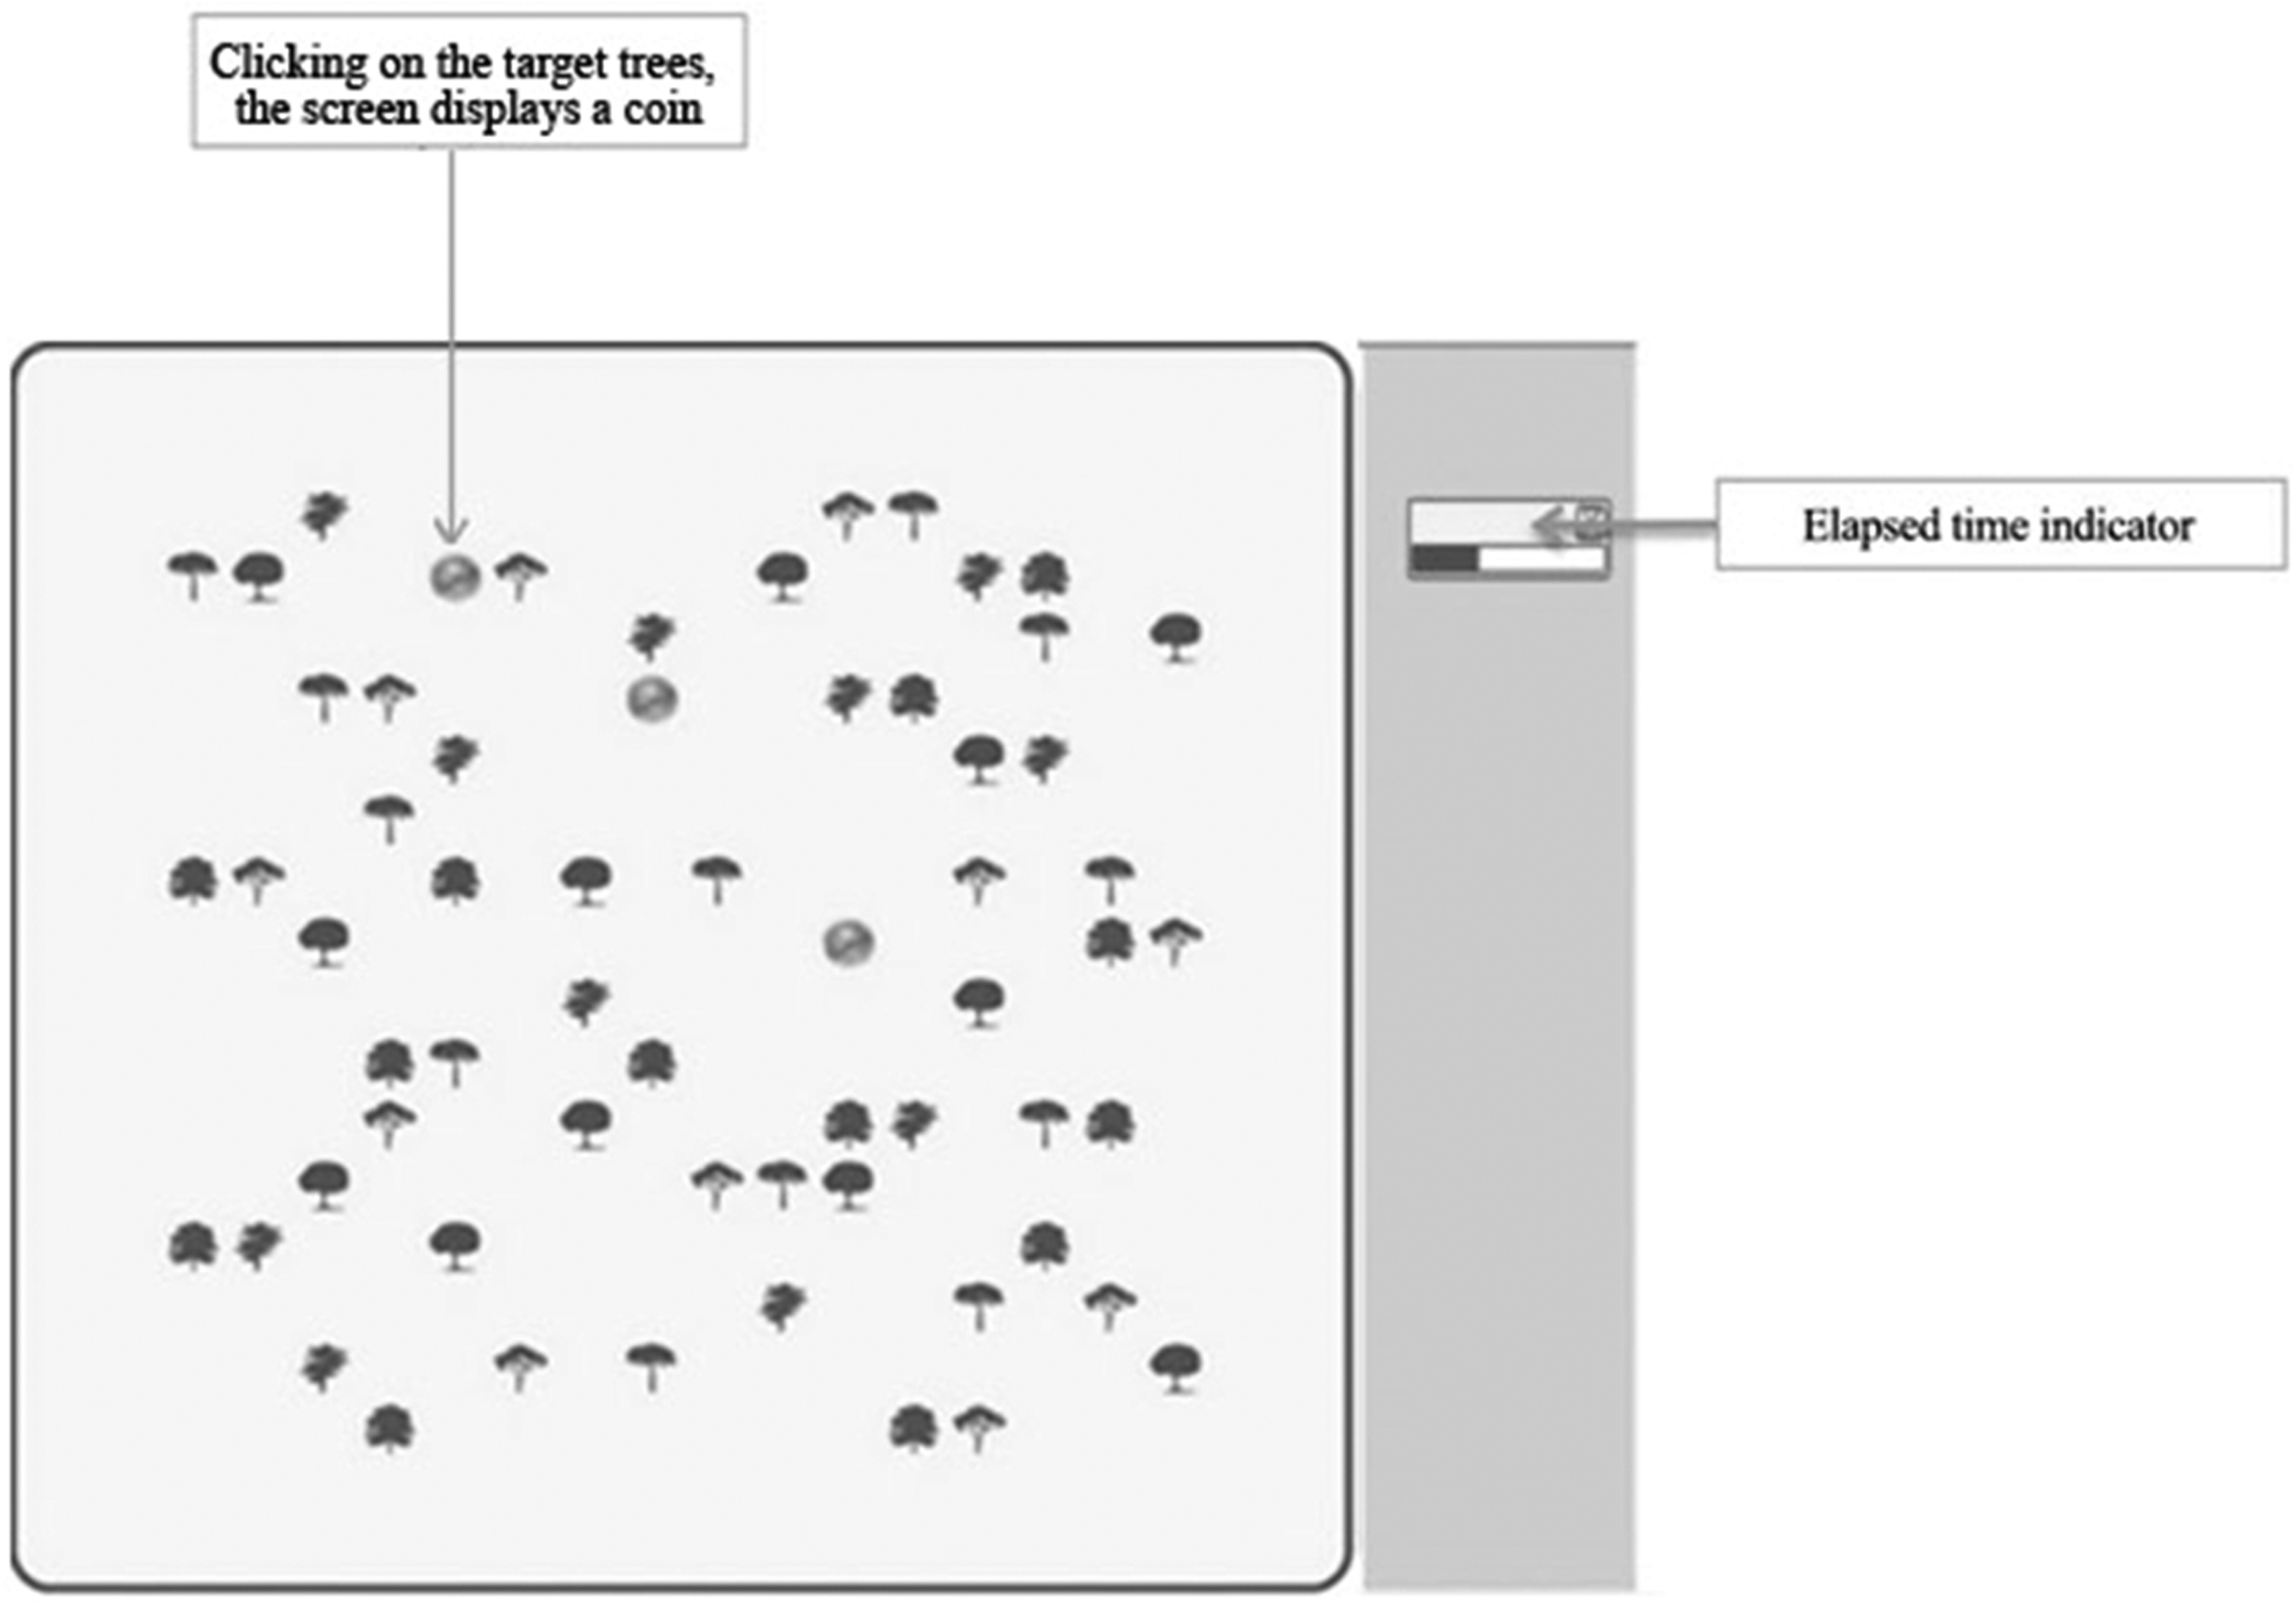
Example of a display shown on each trial of the Treasure Forest test (Study 2).
In Phase 1, two types of trees were replaced with the image of a coin when clicked (target trees e.g., oak and pine). If participants clicked on another type of tree, the square changed to gray and no figure was presented. There were 20 target trees in each trial.
In Phase 2, there were also 20 target trees, but they were different from those used in Phase 1 (e.g., willow and fir). As mentioned above, in this phase, participants had to learn that the target trees had changed. The behavior recorded in this second phase will be used to estimate learning.
Variables
MP-GOT recorded the same variables described in Study 1.
The Treasure Forest learning task recorded the following variables:
Number of responses on target trees per trial (the trees that show a coin when clicked). Number of responses on non-target trees per trial. Total responses per trial: total number of clicks on any of the figures. Learning score per trial: total number of target trees clicked/Number of trials. New Target-Learning: Number of target trees clicked per trial in Phase 2, in trials 17–18. We did not include trials 13–17 as participants need time to realize the target trees have changed and to learn the new ones. New Target-Learning is the most relevant variable of the task as it allows us to study if participants learn that there are new target trees. Therefore, we will consider this variable as an estimation of learning ability.
Procedure
Participants first signed an informed consent document. They used a secure identification and password on a web server to complete the tests. As in the first study, they did not need to have specialized computer abilities.
All participants completed MP-GOT first and Treasure Forest learning task second. At the beginning of each test, they received instructions about how to complete it. In both tests, a sliding bar showed the time elapsed until the end of the trial.
Data were registered in a safe server without personal identifications (except for gender and age) and analyzed using the SPSS Statistics 24 software program. The database is available upon request from the corresponding author.
Results
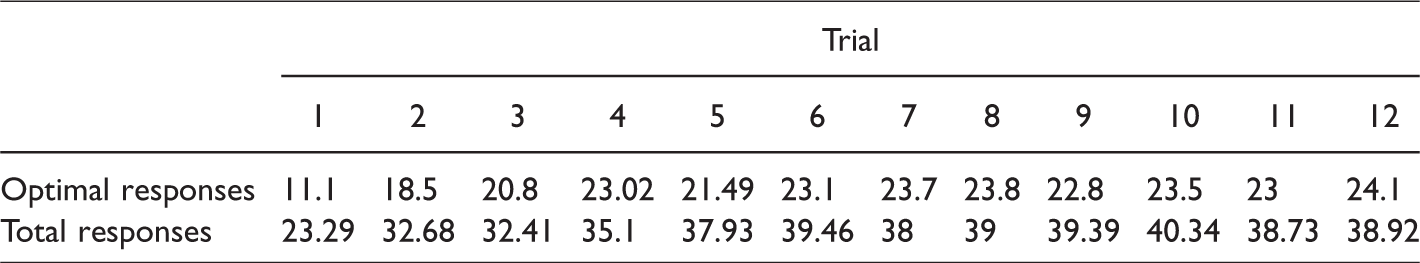
The first step was to study if the MP-GOT fulfilled the objective test standards by using the same motivation and ability criterion described in Study 1. All participants fulfilled the motivation standard, as each of them clicked on a minimum of 9 figures in each trial. Table 5 shows the mean number of optimal responses and the mean number of total responses for each of the 12 trials. Both variables increase across trials. On the other hand, the ability criterion, that each participant should make a greater proportion of optimal responses than expected by chance in each of the first six trials (as described in Study 1), was not met by 6 out of 41 participants (15%). We obtained the proportion of optimal responses for each trial of the six participants who did not meet the competence criterion. They only met the criterion in some of the training trials. However, they all met the criterion in trials 7–12. Since the measured variables are calculated based on the scores of trials 7–12 (and as in these trials those participants showed competence), we decided not to remove them from the study, as the sample size was already small.
Mean numbers of optimal responses and total responses obtained in each of the 12 test trials (MP-GOT; Study 2).
The second step was to study the variability of the goal orientation variable. Figure 5 shows the distribution of scores of the MP-GOT (M = 6.32, SD = 1.71). In this study, although it is possible to appreciate a slight tendency toward bimodality, we did not find a significant deviation from normality (Kolmogorov–Smirnov normality test; p > .05).
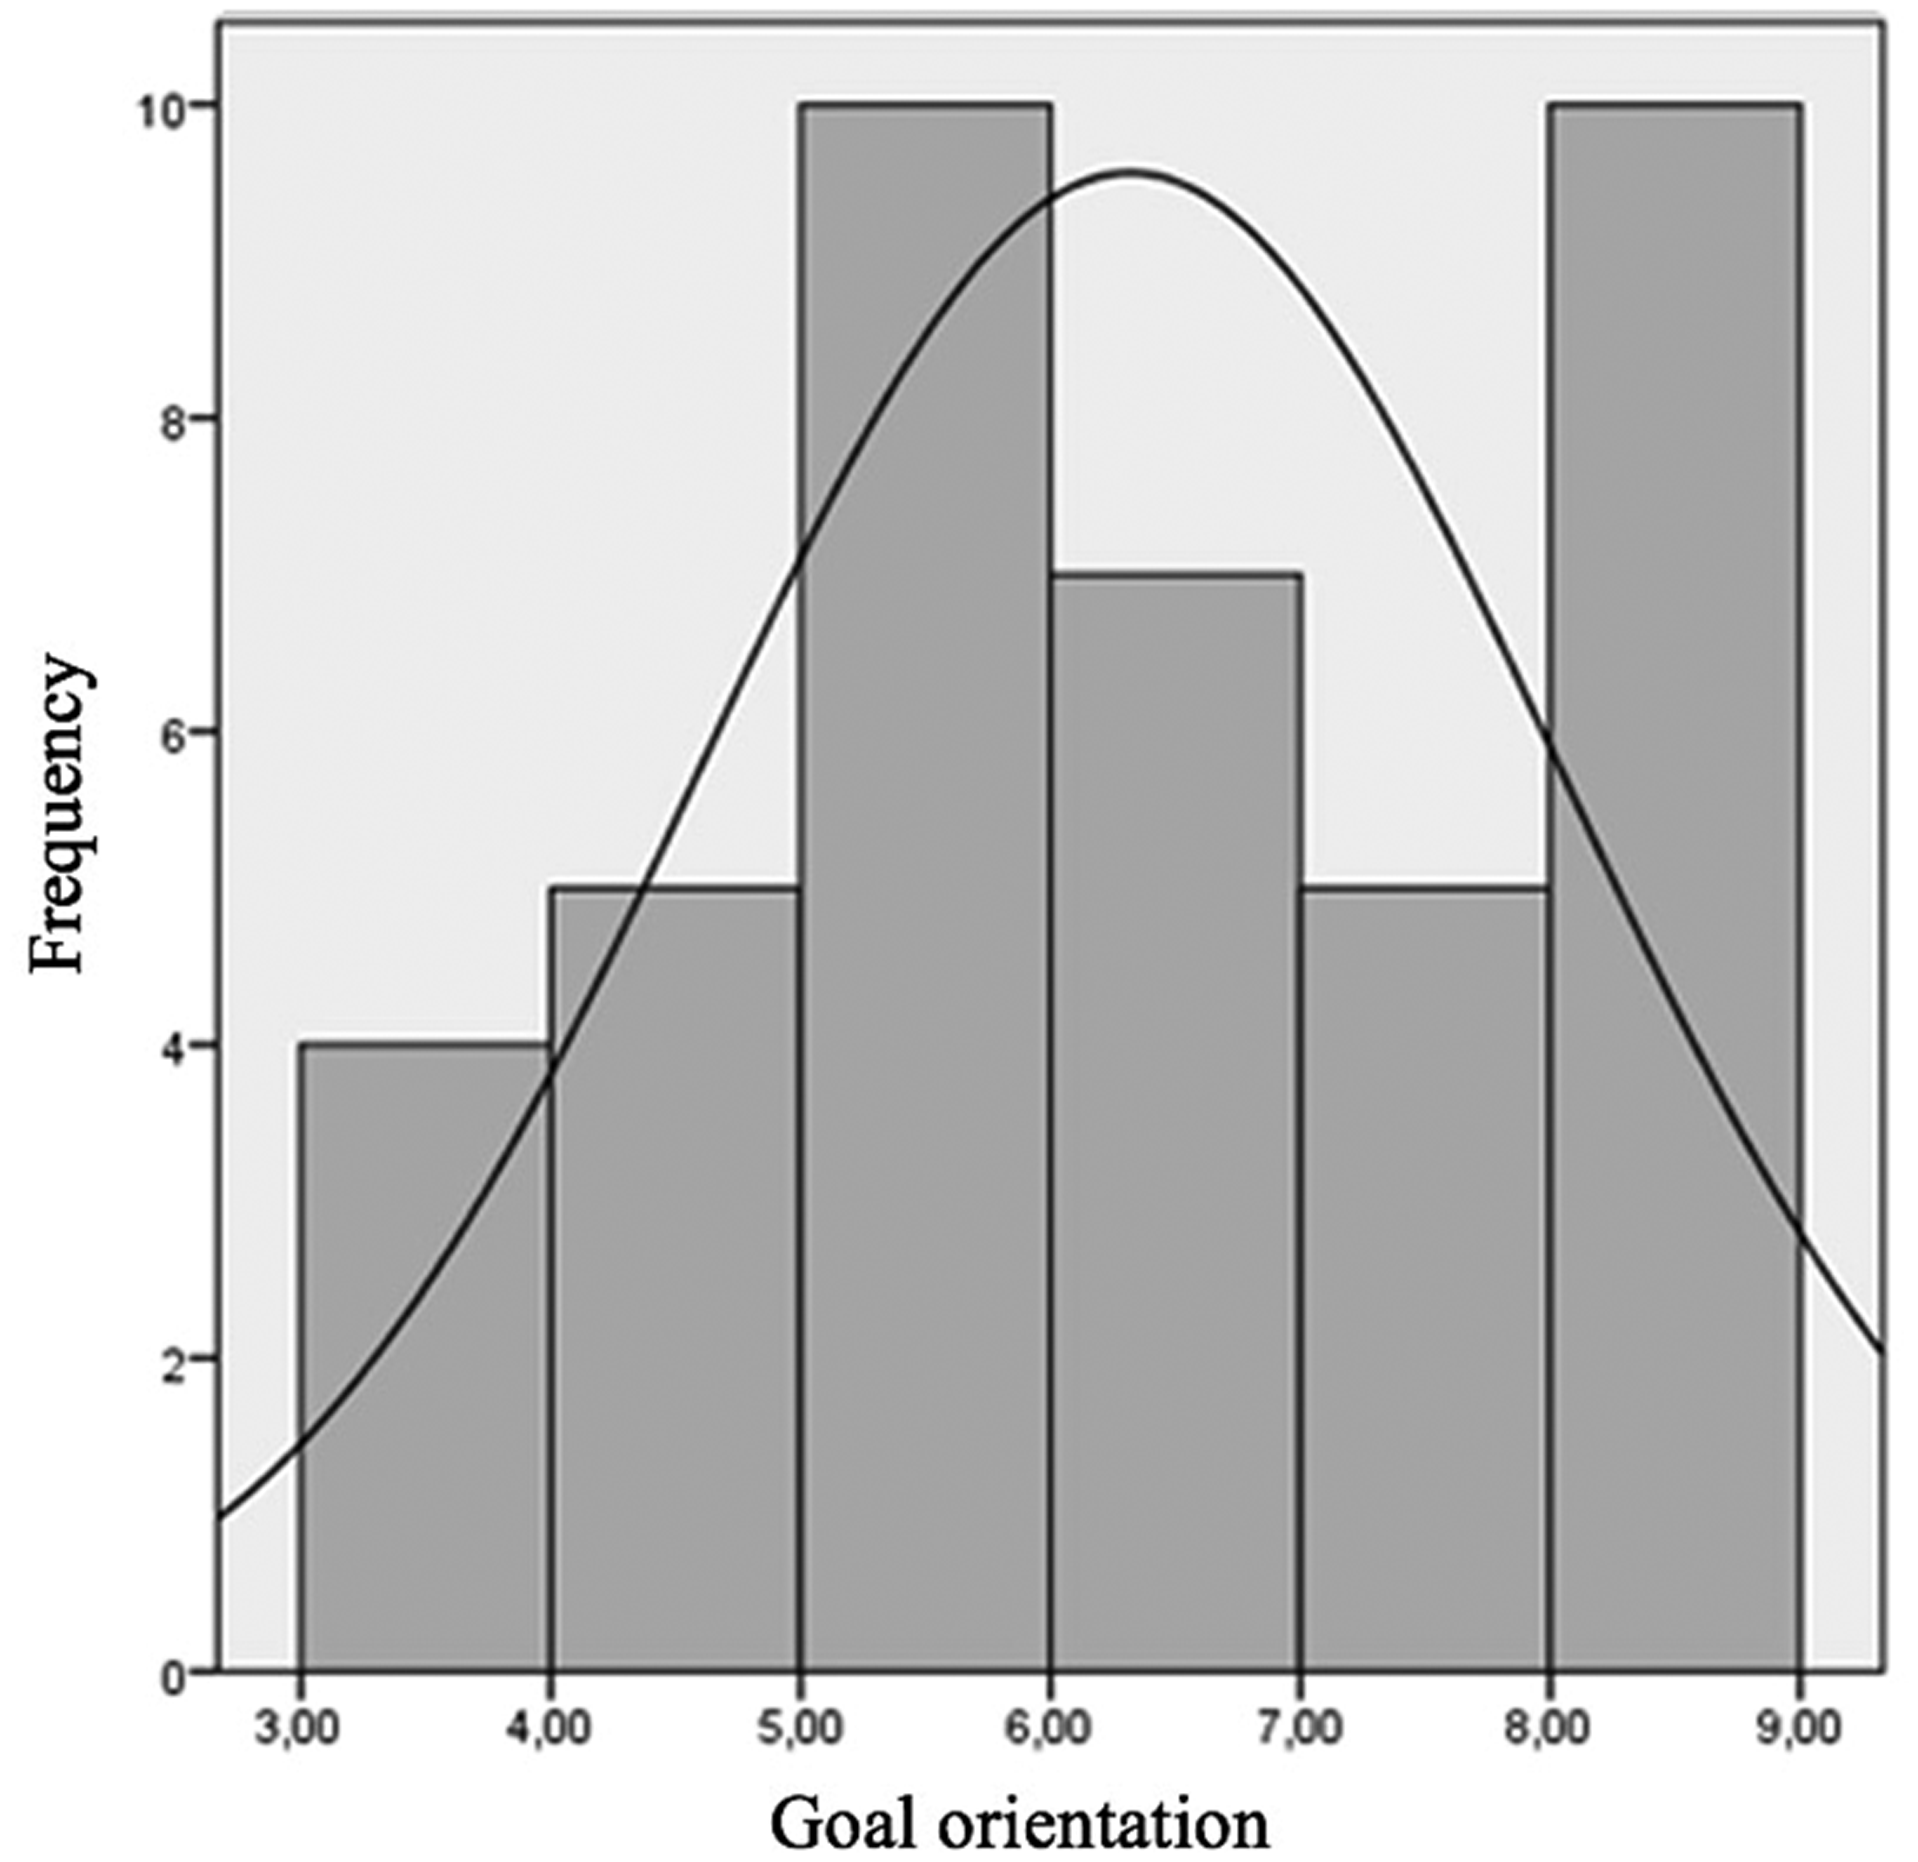
Distribution of the goal orientation scores measured by MP-GOT (Study 2).
We also analyzed the amplitude of the variability and descriptive data of the Treasure Forest learning task (M = 0.61, SD = 0.25). Figure 6 shows the distribution of New Target-Learning variable, which is not normally distributed (Kolmogorov–Smirnov normality test; p > .05). It appears to be bimodal.
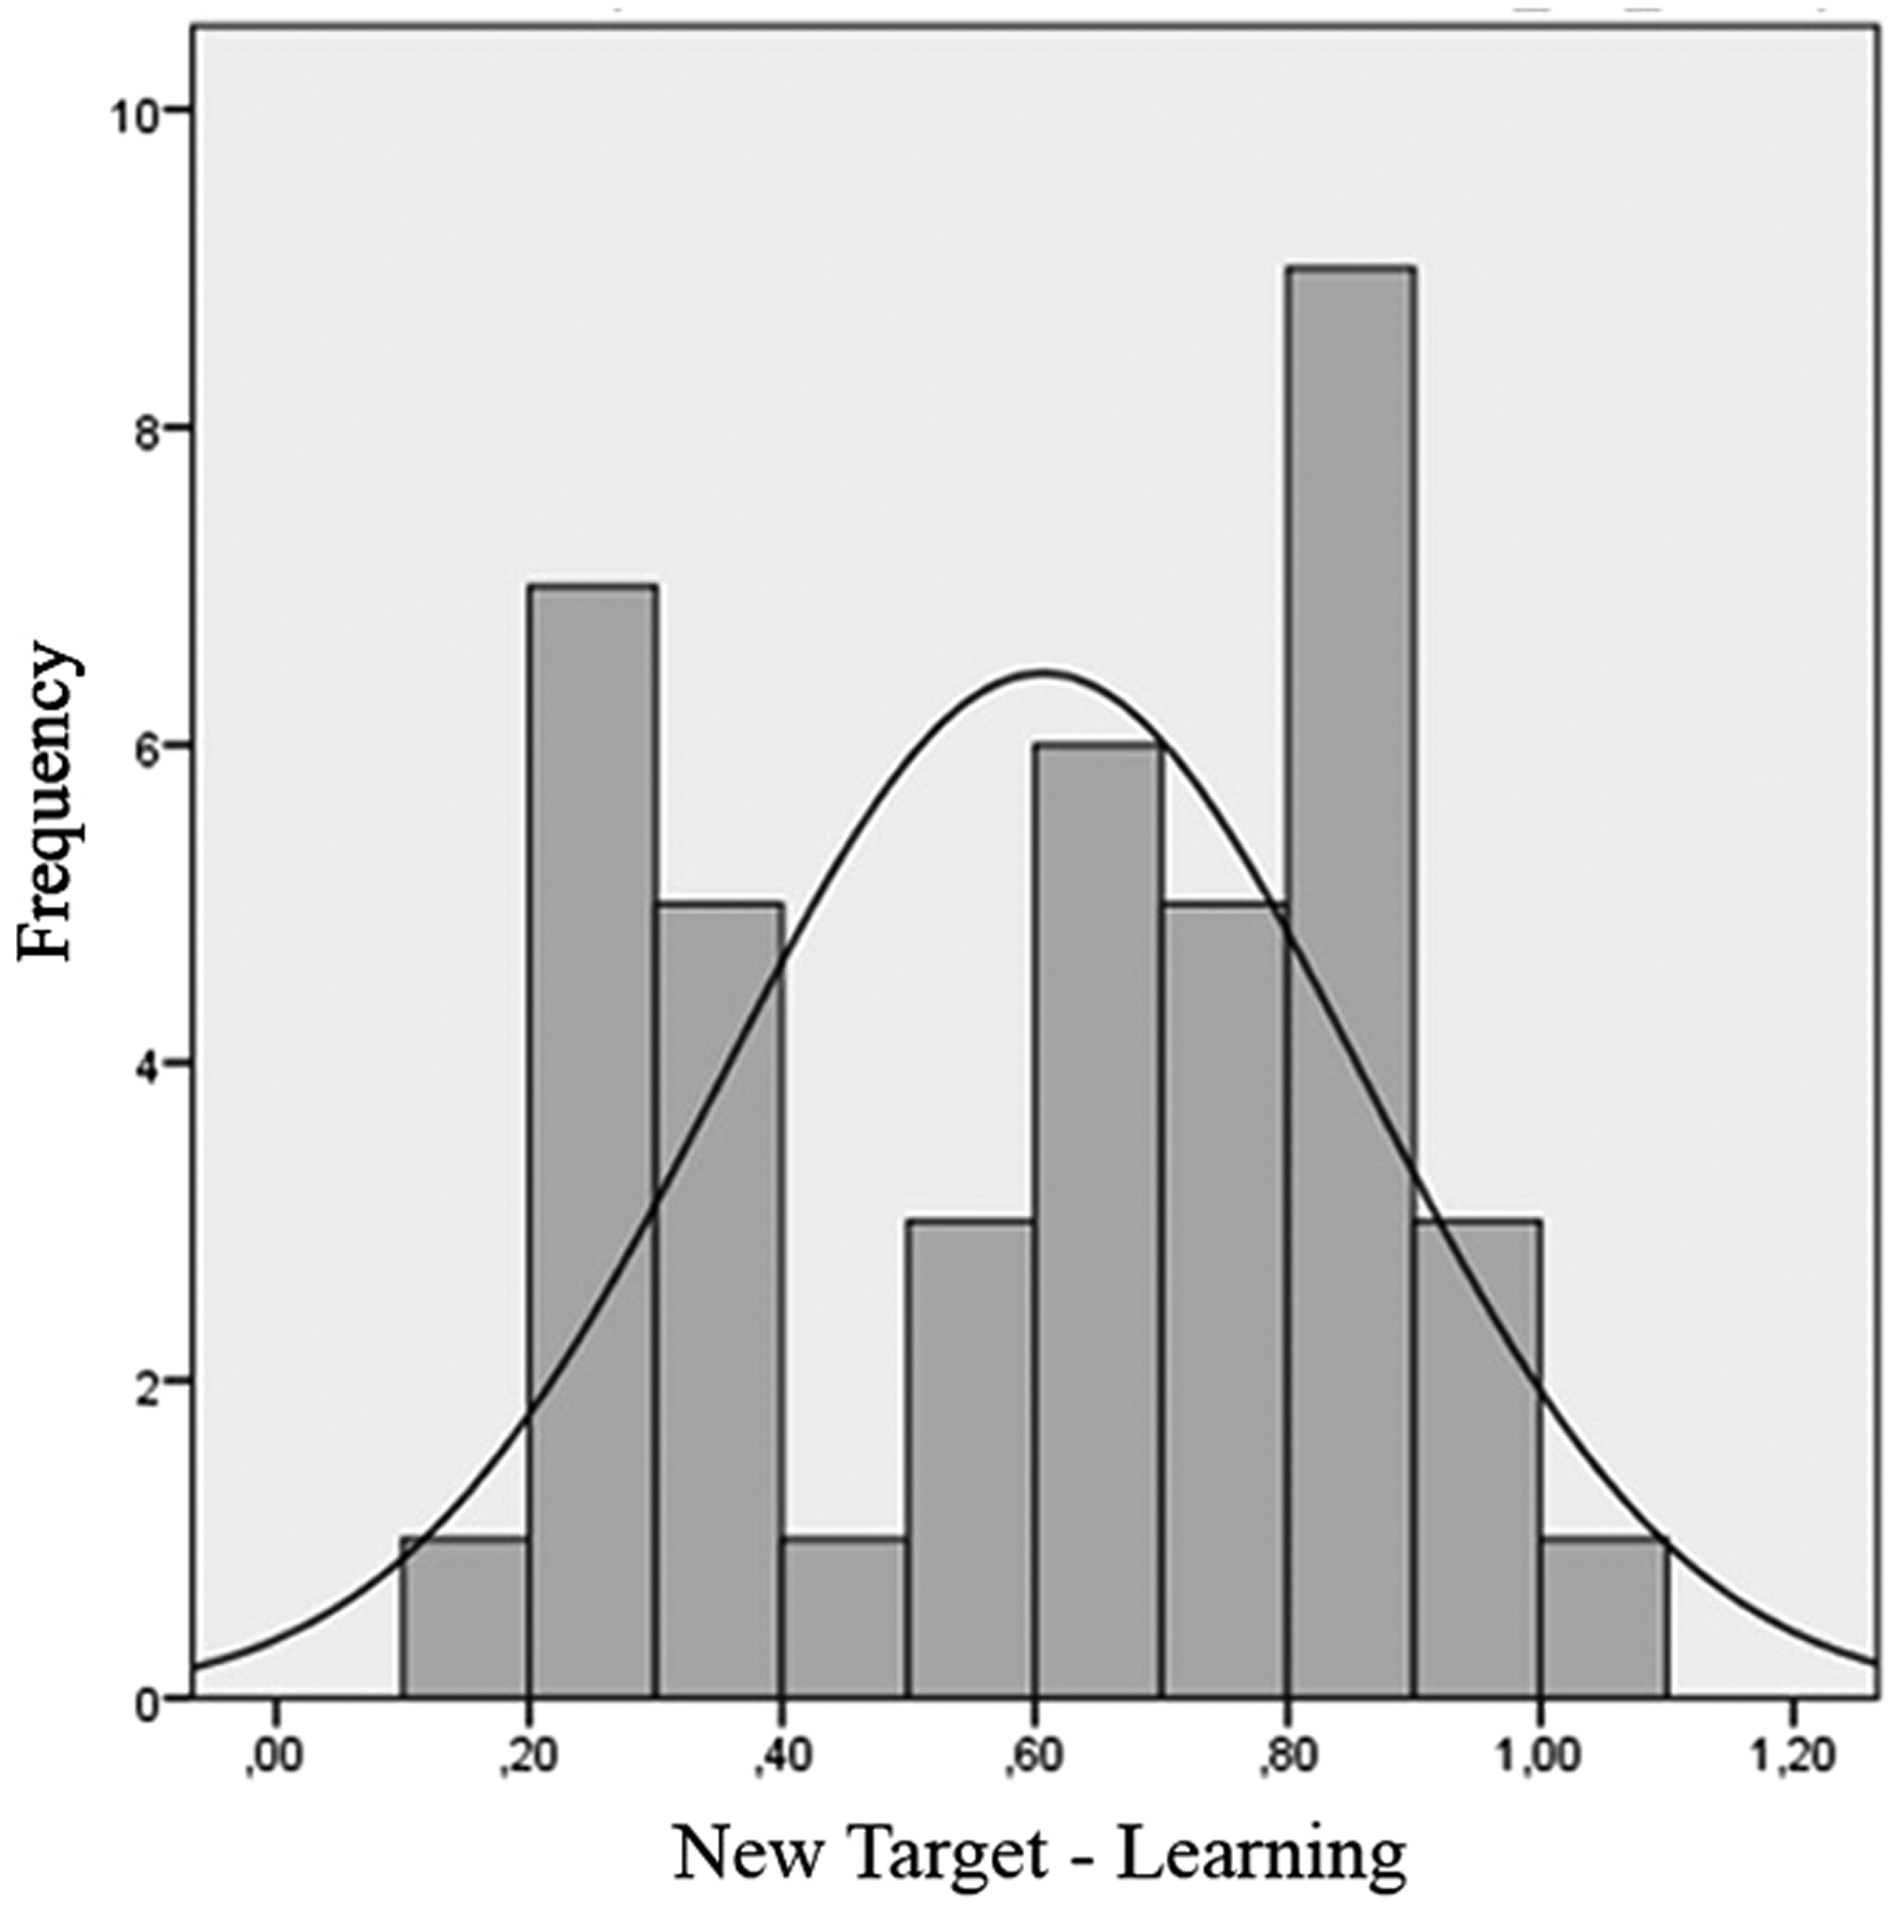
Distribution of the New Target-Learning scores measured by Treasure Forest test (Study 2).
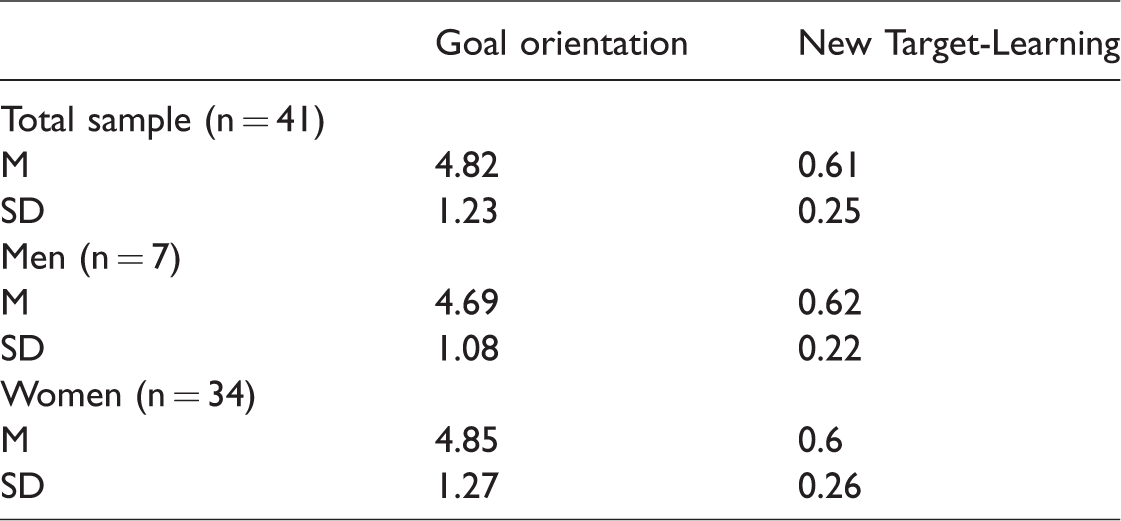
Table 6 shows descriptive data of goal orientation measured by the MP-GOT and learning measured by the Treasure forest task (men, women, and combined samples). We checked if there were gender differences in the variables but they were not significant (p > .05).
Descriptive data of the goal orientation of MP-GOT and learning of Treasure Forest Test recorded in Study 2.
We studied the internal consistency of the tasks by calculating Cronbach's alpha for Goal Orientation (α = 0.975) and New Target-Learning (α = 0.775). We assessed the consistency of the participants by using the interitem-variance procedure (Baumeister & Tice, 1988) applied to the goal orientation variable as described in Study 1. The mean value of the Goal Orientation interitem-variance is 0.46. By this criterion, 71% of the participants showed high consistency.
The next step was to study correlations between Goal Orientation and the learning variable as measured by Treasure Forest test. Goal Orientation shows high and significant correlation (r = .746; p < .001) with the New Target-Learning variable.
To check if the goal orientation variable could predict New Target-Learning, we performed a regression analysis and found a significant regression (F(1.39) = 48.9, p < .001) with an R2 of .557. Goal orientation accounted for 55.7% of the variance of New Target-Learning.
In Study 2, the sample was also divided into two groups: Mastery and Performance oriented. The division criterion was the Goal orientation mean of the sample (4.82). Table 7 shows the mean differences. The GOT-Performance group had significantly higher scores (t test for independent samples) on the New Target-Learning variable.
Scores and mean differences obtained by the performance-oriented and mastery-oriented participants (Study 2).
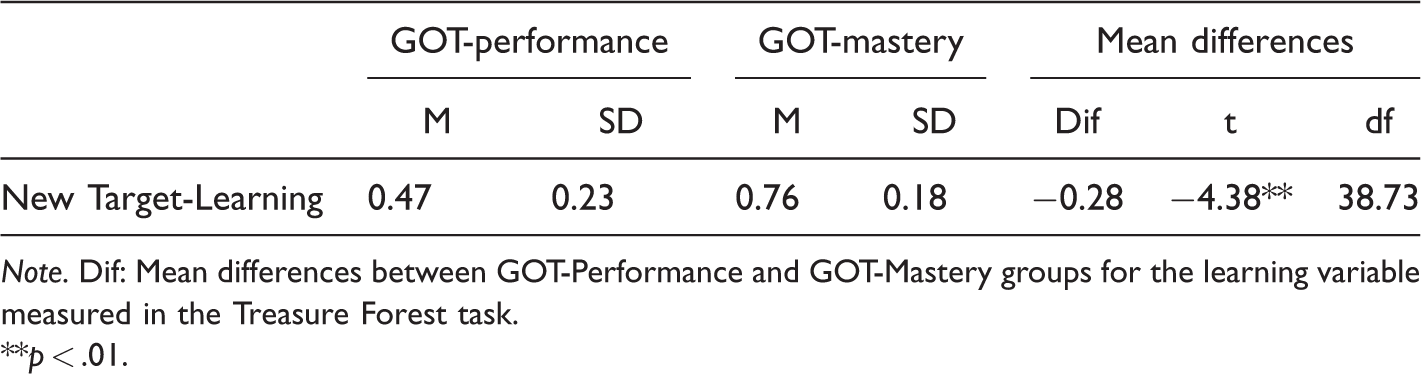
Note. Dif: Mean differences between GOT-Performance and GOT-Mastery groups for the learning variable measured in the Treasure Forest task.
**p < .01.
A chi-square test of independence was performed to examine the relation between different levels of Goal orientation and New Target-Learning. We considered tertiles as division criteria. Table 8 shows the proportions of participants who obtained low, medium, or high scores in Goal orientation and New Target-Learning. There were significant differences in the dependent variable that was compared across proportions, χ2(4, N = 41) = 36.92, p < 0.001.
Goal orientation scores by New Target-Learning scores (Study 2).
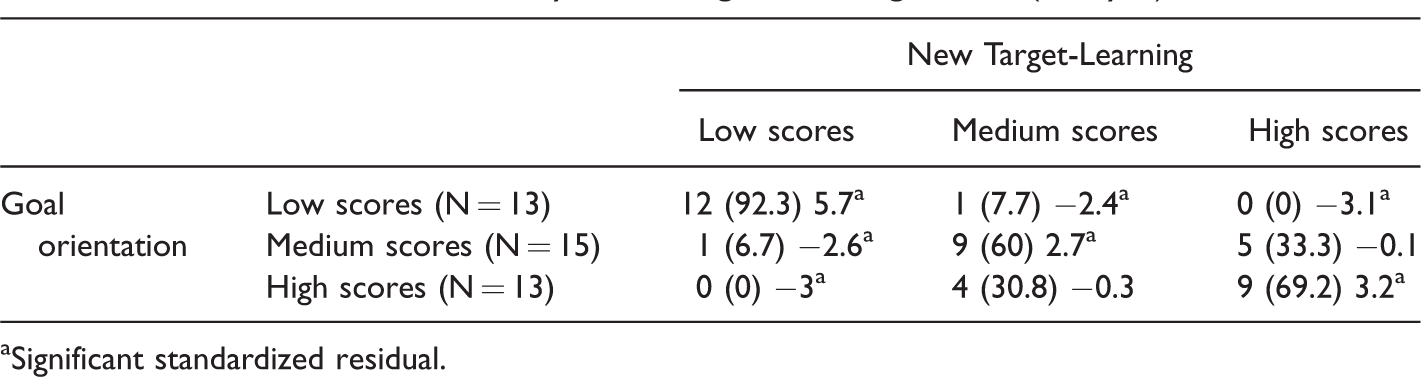
aSignificant standardized residual.
As seen in Table 8, 92.3% of the participants who obtained low scores in Goal orientation (performance-oriented) also obtained low scores in New Target-Learning; 60% of the participants who obtained medium scores in Goal Orientation also obtained medium scores in New Target-Learning; and 69.2% of the participants who obtained high scores in Goal orientation (mastery-oriented) also obtained high scores in New Target-Learning.
Finally, we wanted to study differences between participants with high, low, and medium scores in New Target-Learning as measured by the Treasure Forest task. Three participants were randomly selected, one with a New Target-Learning mean below 0.30, another with a New Target-Learning mean about 0.65, and another one with a New Target-Learning mean over 0.80. Figure 7 shows the development of learning across trials for each of these participants in the Treasure Forest test. The participant with a low New Target-Learning mean learned more slowly and received lower scores than the participant with a high mean. The participant with a medium New Target-Learning mean showed an erratic pattern.
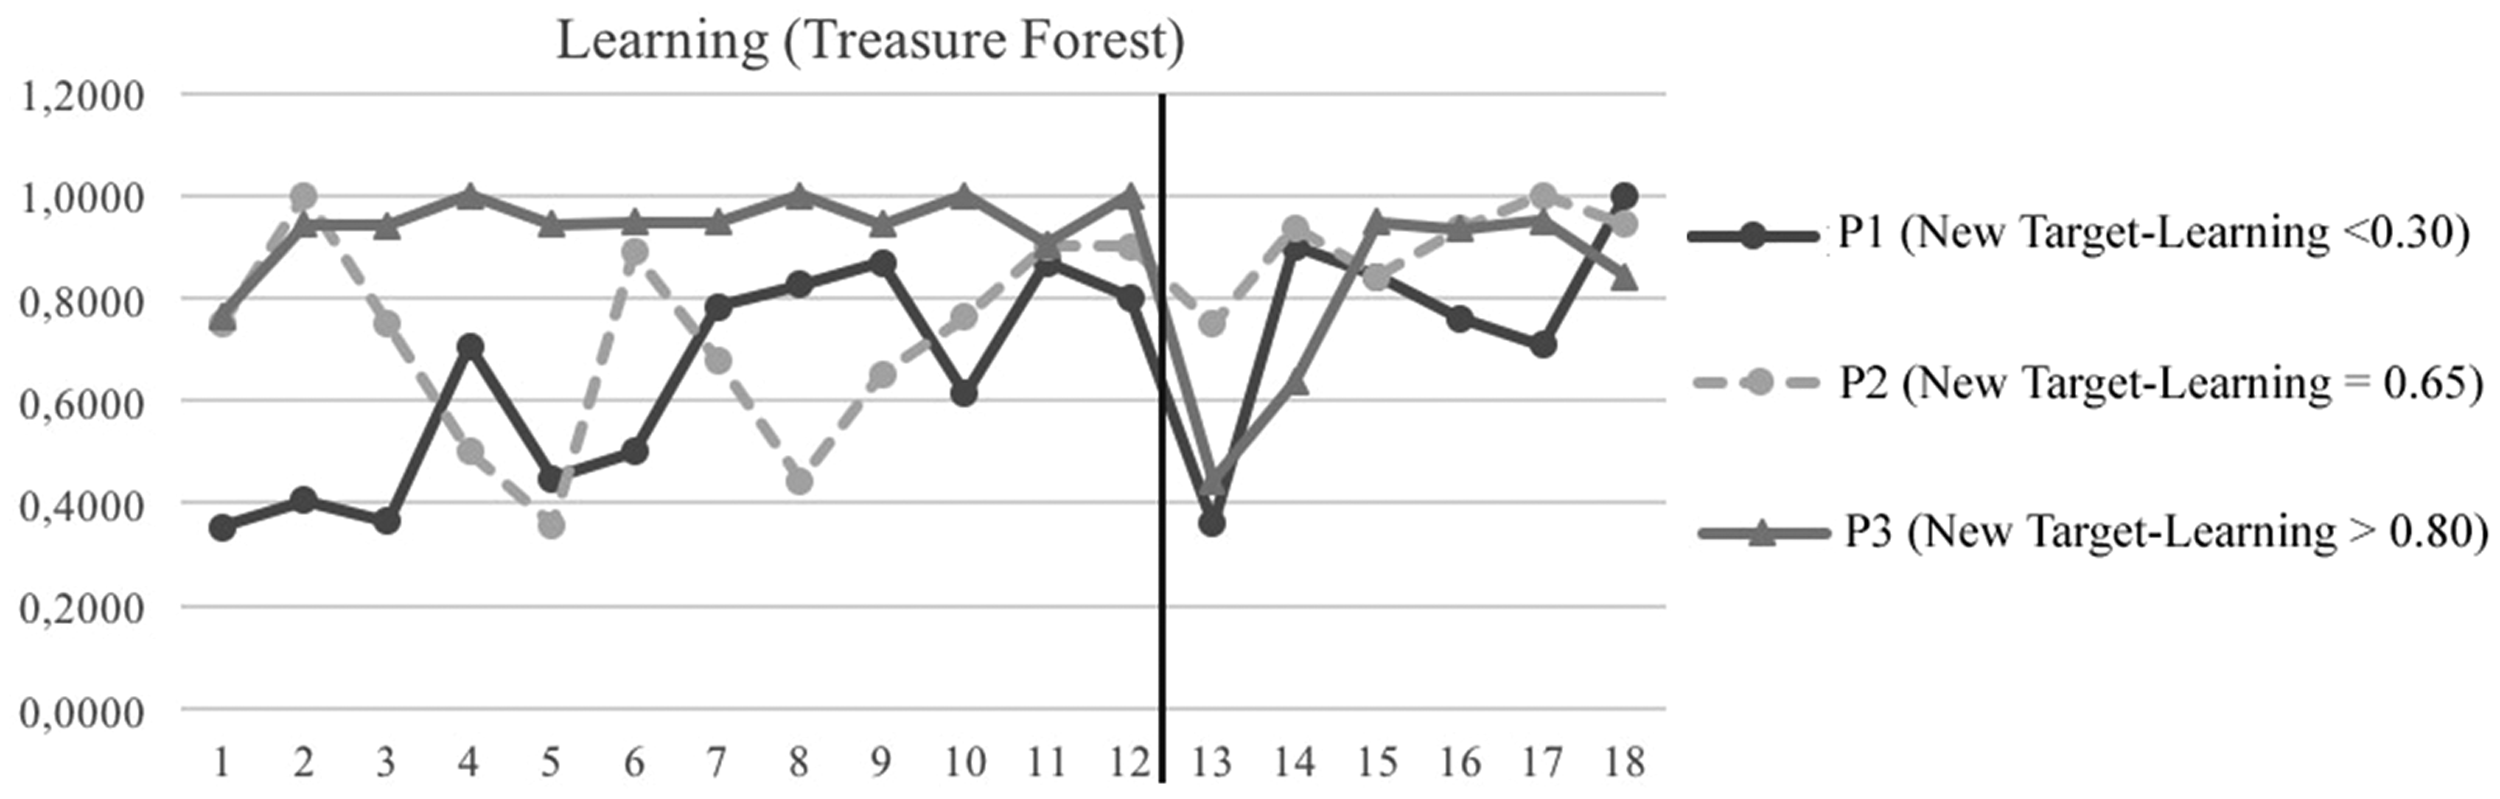
Learning scores across trials of three participants with low (P1), medium (P2), and high (P3) learning mean score (Treasure Forest test). Phase 1: Trials 1–12. Phase 2: Trials 13–18 (Study 2).
Discussion
The goal of the present study was to develop a behaviorally objective test to assess the level of goal orientation interactive style. We managed to design an instrument to assess mastery and performance orientations objectively. It was designed within the conceptual framework of Ames’ (1984) and Dweck’s (1986) theories. We used a category-learning task and were able to classify participants as either mastery-oriented (those who try to deeply understand the essentials of the task) or as performance-oriented (those whose purpose is to obtain the most successful results). Two studies were conducted in order to check reliability and validity of the test.
One of the aims of the study was to check if the test fulfilled a set of standards needed to assess behavior by using an objective test (Cattell, 1965; Cattell & Kline, 1977; Ribes, 2009). The participants who were assessed using the MP-GOT in Study 1 seemed to be properly motivated, and the test was easy to perform. The test also fulfilled the criterion of providing clear instructions that did not bias participants’ behaviors. In satisfying another condition, the task did not provide feedback about the participants’ interactive styles. Therefore, the MP-GOT met the requirements needed to be a proper behavioral assessment of the stated interactive style.
We also checked the test result’s consistency by measuring participants’ interactive styles. In Studies 1 and 2, Cronbach’s alpha coefficient of goal orientation variable was always greater than 0.90, so our test has internal consistency. The observed values are comparable to those obtained from self-reports used to assess this interactive style (Button et al., 1996; Elliot & McGregor, 2001; Elliot & Murayama, 2008; Midgley et al., 1993; Skaalvik, 1997; Vandewalle, 1997). In addition, 70% (Study 1) and 71% (Study 2) of the participants fulfilled the consistency criterion of Baumeister and Tice (1988). Given the high consistency of the test coupled with the high consistency of the participants, MP-GOT allows relatively precise assessments of goal orientation interactive style.
Distribution of the Goal orientation variable in Study 1 was bimodal. Although in Study 2 the distribution showed a slight tendency toward bimodality, we did not find a significant deviation from normality. A possible explanation is that in the second study, the sample size was much smaller.
MP-GOT can classify participants as performance-oriented (lower scores in the goal orientation variable) or as mastery-oriented (higher scores in the goal orientation variable). Whereas other tests can classify participants into two different categories (performance and mastery), the MP-GOT configuration allows us to assess participants’ behaviors along a single goal orientation dimension. Therefore, the test cannot classify participants simultaneously as performance and mastery oriented; however, it is possible to obtain a score that places them between these orientations.
The test provides information about the level of learning, the total score, and response rate. Cronbach’s alpha of these variables was greater than 0.90. In Study 1, mastery-oriented participants seemed to perform the test more slowly (they clicked on fewer figures in a given time) than performance-oriented participants, but they received higher Learning scores. Performance-oriented participants received lower Learning scores, but they managed to get higher scores in Reinforcement Rate (they received more points). How can we explain that? Performance-oriented participants clicked on a larger number of figures (receiving high Response rate scores) but were relatively indifferent to the target class definition. Due to the configuration of the test, participants could get a large number of points by clicking on as many figures as possible. Thus, the MP-GOT not only allowed us to locate participants on the Goal orientation dimension but also offered us the chance to study the different strategies that they carried out in performing the test.
In Study 2, the aim was to check if mastery-oriented participants also received higher learning scores as measured by a different task: Treasure Forest. This task allows us to study learning in two different phases, being Phase 2, the one that allows us to better estimate learning ability. Cronbach’s alpha for the learning variable measured by the Treasure Forest task (New Target-learning) was greater than 0.80. Therefore, the task showed high internal consistency.
Mastery-oriented participants had significantly higher scores in New Target-Learning (M = 0.76) than did performance-oriented ones (M = 0.47). We studied the relation between Goal orientation and New Target-Learning scores across the sample. Over 90% of the participants classified as performance-oriented had low New Target-Learning scores; 69% of participants classified as mastery-oriented had high New Target-Learning scores. When examining scores across trials for three participants, we also found that the participant with a higher New Target-Learning mean learned faster than the others and had a higher score in Goal Orientation variable (mastery-oriented).
The results showed a significant positive correlation between goal orientation and the learning variable (r = .746). Moreover, a regression analysis showed that goal orientation explained more than 55% of the variance of New Target-Learning. Therefore, the test showed high predictive validity.
The results mentioned above are in line with previous studies and the theoretical definition of goal orientations (Bernacki et al., 2012; Payne et al., 2007). Mastery orientation, as measured by the designed objective test, is related to learning. However, as our sample size is small, it will be necessary to replicate this study with a larger sample size to obtain firm conclusions.
In addition, in Studies 1 and 2, we also wanted to test for any potential gender differences. The data showed that there were no significant differences between the performance of men and women in our tasks, as has been reported in other comparable studies (Frost, 2002; Givvin, 2001).
We have managed to measure goal orientation objectively, without using questionnaires. This is probably the most important contribution of our research. The test allows avoiding bias due to effects such as attempts to demonstrate social desirability in responses to questionnaires. It can be concluded that the reliability of the MP-GOT is high. In line with theoretical formulations of goal orientation, mastery-oriented participants seem to learn more and that performance-oriented participants tend to achieve higher scores in the short term.
In future studies, it will be necessary to continue the validation process of the test. To do so, it is important to obtain data not only from subjective measures as self-reports but also from other objective tests. This is because there is not always a close correspondence between how people behave and what they report about their behavior. This fact has been corroborated by studies showing a lack of correlation between the data obtained by self-report measures and the data obtained by objective measures (i.e., T-data; Cattell & Kline, 1977; Skinner & Howart, 1973). Therefore, if the data obtained in the MP-GOT test and those obtained from a self-report test were analyzed, we should not necessarily find a correlation between them. Objective tests should make use of different task environments but should also measure the same types of interactive styles (i.e., they have to be functionally similar). Traditionally, convergent and divergent validity have been studied by using self-reports, but for the reasons mentioned above, it will be interesting and also necessary to study them by using objective measures. Therefore, future research should study the relation between goal orientation and other variables measured by subjective and objective tests in a larger sample.
Future studies should also focus on the development of a behavioral test that allows us to study goal orientation more deeply. As mentioned above, MP-GOT offers information about variables incorporated into the classic goal orientation theory (Ames, 1984; Dweck, 1986). However, it does not provide information about interaction styles proposed in more recent theories, for example, those that consider approach and avoidance modalities (Elliot & McGregor, 2001) or those that consider learning in relation to an objective criterion or in relation to previous performance (Elliot et al., 2011). A future line of research would be to design an objective test with a configuration that would allow to evaluate goal orientation framed in these more recent theoretical proposals.
It is important to keep in mind that objective tests also show some limitations. First, they are costlier than self-reports in terms of time and even in economic terms. They are also more difficult to administer. In addition, although they are meant to be a reflection of natural situations, most of them present artificial situations. However, the information provided by objective tests can be rich and valuable for different contexts. Designing them is a worthwhile challenge (McDonald, 2008; Ortner & Proyer, 2015; Santacreu & Hernández, 2017).