




Abstract
In several studies, it has been suggested that task-switching performance is linked to processing speed. Here we argue that the relation between processing speed and high-level cognitive ability found in previous studies may be due to confounded measurements of processing speed and task-switching ability. In the present study, we required participants to complete an inspection time (IT) task to probe their processing speed. We employed conventional task-switching paradigms but applied a linear integrated speed-accuracy score (LISAS) which combines latency and accuracy scores to express task-switching ability. The results of regression analyses show that IT predicted average performance in task-switching paradigms. However, IT did not relate to any specific effects common in the task-switching task, which contradicts previous results. Our results suggest independent mechanisms of processing speed and tasks that require a high level of cognitive flexibility and control.
Keywords
Introduction
Task-switching is a core aspect of human cognitive control (Diamond, 2013; Miyake et al., 2000; Miyake & Friedmen, 2012). Previous studies have shown considerable individual differences in task-switching abilities: For some participants shifting between different tasks is almost effortless, whereas for other participants shifting between different tasks can seriously impair performance (e.g., Li, et al., 2019; Li et al., 2020; Lindsen & De Jong, 2010); Salthouse, et al., 1998, Stoet & Snyder, 2007; Umemoto & Holroyd, 2016; Wasylyshyn, 2007).
In several studies, it was suggested that a substantial proportion of variance in task-switching can be explained by inter-individual differences in processing speed (Moretti et al., 2018; Salthouse et al., 1998; Wasylyshyn, 2007). Participants who showed faster processing speeds tend to have better task-switching abilities resulting in a negative association between processing speed and task-switching costs (r = −.69 in Salthouse et al., 1998; β = −0.23 in Moretti et al., 2018). Similarly, Wasylyshyn (2007) reported that processing speed accounted for 36%∼42% of the variance in inter-individual task-switching abilities.
Typically, task-switching ability is measured in computerized task-switching paradigms with two or more tasks intermixed, so that between successive trials the task changes (switch trials) or not (repetition trials). Switching between tasks leads to delayed response times and lower accuracy, generally known as “task-switching costs” (Kiesel et al., 2010). The smaller someone’s task-switching costs are, the better their task-switching ability is. However, faster or slower information processing speed of participants may affect both task-repeat and task-switch trials to the same extent, leaving task-switching costs unchanged. This raises the question whether linear relations between task-switching and processing speed reported in previous studies may be an artefact of measurements. Indeed, there is evidence suggesting that processing speed and task-switching ability may be unrelated. For example, participants’ task-switching ability does not decline with aging (Kray & Lindenberger, 2000; see a review by; Kray & Ferdinand, 2014; Wasylyshyn et al., 2011), whereas processing speed significantly deteriorates with aging (Faroqi-Shah & Gehman, 2021). A disassociation between task-switching and processing speed was also observed in cognitive learning and development. In a recent study, for example, it was shown that 8 weeks of cognitive training led to significant improvement of cognitive control (which is related to task-switching) but had no effect on processing speed (Kim et al., 2017). These results imply that speed of processing and task-switching ability may be unrelated.
We reason that previous results on the relation between task-switching and processing speed may be confounded by “task-impurity” (cf., Burgess, 1997; Miyake et al., 2000). Their relations may be accounted for by two aspects of task impurity: 1) measuring “processing speed” requires some task-switching ability. 2) measuring “task-switching” taps into visuomotor processing speed. For example, both Salthouse et al. (1998) and Wasylyshyn (2007) used a same/different pattern comparison task to assess processing speed. Participants were asked to discriminate whether patterns presented side by side were the same or different from each other. The difficulty of the task was manipulated by the number of segments differing between the two patterns. In addition, Salthouse et al. (1998) also employed a pattern matching task by asking participants to circle, as quickly and accurately as possible, one out of five alternatives that matched a target. Response times for correct responses (Salthouse et al., 1998; Wasylyshyn, 2007) or the difference between the number of correct responses and the number of incorrect responses (Salthouse et al., 1998) were calculated to probe processing speed. In a study by Moretti et al. (2018), processing speed was assessed by a symbol digit modalities test (SDMT) in which participants were required to pair specific numbers with geometric figures. Using the above measurements, researchers consistently found a negative correlation between scores of the SDMT test (higher scores indicate more correct responses in the test) and task-switching costs. However, it should be noted that in addition to processing speed, the pattern comparison/matching task or symbol digit modalities test may elicit additional cognitive processes. For instance, comparing patterns may involve visual search, feature matching, and may even require updating of target features in working memory, similar to cognitive reconfiguration during task-switching (Koch et al., 2018). Since performing in pattern comparison tasks requires a certain degree of “task-switching” and performance in task-switching requires a certain degree of “pattern comparison,” performances in these tasks may be correlated. Therefore, processing speed may account for task-switching ability in these tasks (i.e., Moretti et al., 2018; Salthouse et al., 1998; Wasylyshyn, 2007).
In a recent study, MacPherson et al. (2017) investigated the relation between processing speed and task-switching and applied a more precise method—an inspection time (IT) task—to measure processing speed. IT tasks provide a better measure of basic information processing than other cognitive tasks because they are simpler, require very little cognitive abilities, and reduce a possible speed-accuracy trade-off (Deary & Stough, 1996; Egan & Deary, 1992). However, MacPherson et al. (2017) employed a number/letter trail-making test to measure task-switching abilities where participants are required to search and establish consecutive numbers and letters in an alternating sequence (e.g., 1-A-2-B-3-C). Although many studies have applied the trail-making test to measure task-switching, the test was originally designed to measure speed of cognitive processing and mental flexibility (Lezak, 1995). Other studies have suggested that visuomotor processing speed impacts on participants’ performance in the trail-making test (Salthouse, 2011; Sanchez-Cubillo et al., 2009). Nevertheless, a computer-based task-switching paradigm is better to measure task-switching ability (Diamond, 2013).
In order to establish whether processing speed and task-switching are related, we applied the IT task (Deary & Stough, 1996; Egan & Deary, 1992; Eisma & Winter, 2020; for a review see; Salthouse, 2000), and computer-based task-switching paradigms in which participants were instructed to either perform the same task or to alternate between tasks (Rogers & Monsell, 1995; Stoet, et al., 2013).
Measure of Processing Speed
In the IT task, each participant was briefly shown two parallel vertical lines with different lengths and the participant had to decide which line was longer. Participants with fast processing abilities can make correct decisions even when the stimulus exposure duration is extremely short. Hence, one way to index processing speed is to systematically vary the stimulus duration and find the minimum presentation time at which 85% accuracy was achieved (c.f., Deary & Stough, 1996; Egan & Deary, 1992; Luciano et al., 2005).
It has been argued that IT tasks require very little cognitive abilities while eliminating a possible speed-accuracy trade-off (Deary & Stough, 1996; Egan & Deary, 1992; but also see; Eisma & Winter, 2020). As Kranzler and Jensen (1989, p. 329–330) pointed out, “IT, the only index of mental speed that does not involve either motor (output) components of executive cognitive processes (meta processes), is held to tap individual differences in the ‘speed of apprehension’, the quickness of the brain to react to external stimuli prior to any conscious thought.” Therefore, the main aim of the present study was to re-examine the relation between task-switching ability and processing speed by using an IT task.
Covariates for Task-Switching and Processing Speed
In order to accurately estimate a linear relation between processing speed and task-switching, we also measured IQ, gender, age, and educational background as potential covariates that might affect both processing speed and task-switching.
In previous studies, a close relation between IQ and processing speed as measured by IT was demonstrated (Deary & Stough, 1996; Grudnik & Kranzler, 2001; Hills & Hertwig, 2011). For example, in a meta-analysis of 92 studies, Grudnik and Kranzler (2001) established a mean IT-IQ correlation of −0.30 across studies, or −0.51 after correcting for artifactual effects. In addition, studies suggested that IQ affects the efficacy of cognitive control (Graham et al., 2010; Wang et al., 2021). IQ and strategy-shifting ability were related and participants with lower IQ faced more cognitive challenges during a Wisconsin Card Sorting test, showing greater activation in their left and right prefrontal regions and anterior cingulate gyrus cortex, compared to participants with higher IQ (Graham et al., 2010). Greater activation in these regions indicates a greater need for conflict detection and response selection (Bari & Robbins, 2013). Both are important cognitive processes when switching between tasks. We therefore controlled for participants’ IQ score and examined whether IT itself predicted average task-switching performance over trial types and task-switching costs.
In previous studies, it was shown that information processing speed measured by IT and other neuropsychological speed tests was related to educational background (Duan et al., 2009; Ihle et al., 2018), gender (Daseking et al., 2017; but see; Burns & Nettelbeck, 2005; Roivainen, 2011) and age (Faroqi-Shah & Gehman, 2021; Roivainen, 2011). Moreover, these covariates have been shown to impact cognitive performance (Gajewski et al., 2018; Rimkus et al., 2018; Weiss et al., 2003). Thus, in the present study, we focused on estimating the relation between processing speed and task-switching while controlling for other variables in our regression models.
In contrast to traditional task-switching studies that calculate task-switching costs in terms of response times (RTs) and error rates (ERs) separately, we applied the linear integrated speed-accuracy score (LISAS) which can take into account speed-accuracy trade-offs when comparing task-repeat with task-switch trials (Vandierendonck, 2017, 2018). The LISAS linearly combines response times with error rates

On the basis of well-established previous results on task-switching, using RTs and errors (e.g., B. Li et al., 2019; Wasylyshyn, 2007), we hypothesize that LISAS should increase with IT scores independent of different paradigms and control variables. In addition, we predict no interaction between trial types and IT when modeling task-switching performance in terms of LISAS for task-repeat and task-switch trials. By comparing four different models with or without experimental conditions, covariates (age, gender, IQ, and education) and two-way interactions, we investigate whether IT performance predicts task-switching costs or average performance only.
Method
Participants
A priori power analysis (Faul et al., 2007) suggested a sample size of N = 88 for a multiple linear regression with two predictors (alpha = 0.05, power = .90, effect size f 2 = 0.15).
Ninety-four participants from Glasgow in Scotland, UK (18 participants) and Shanghai in China (76 participants) took part in the study. One female participant did not reach 85% accuracy in the IT task and was therefore excluded from the analyses. The final sample consisted of 93 participants (42 males, mean age = 25.84, range = 19–45 years, SD = 4.82). Thirty-seven participants were postgraduate students and 20 were undergraduate students. The other participants had degrees from technical colleges (20 participants) or lower degrees (19 participants). Research was conducted in accordance with the Declaration of Helsinki, and approval of ethical standards was given by the Fudan University School of Social Development and Public Policy committee. All participants gave written and verbal consent to participate.
Apparatus
Both the IT and task-switching tasks were programmed using PsyToolkit software (an open access software toolbox for programming psychological experiments based on Linux operating systems; Stoet, 2010, 2017). Task-switching tasks were run on a PC with a 24-inch screen. IT stimuli were displayed at a refresh rate of 1000 Hz on a light-emitting diode (LED) digital number display which had a height of 33 mm and a width of 22.5 mm. Participants were tested individually in a laboratory that was only dimly-lit. During the experiment, they placed their head on a chin-rest to keep the viewing distance constant at 55 cm. The “A” and “L” key on a standard QWERTY keyboard served as response keys.
Task, Stimuli, and Procedure
Inspection time (IT) task
In order to study participants’ sensory processing speed, we employed an inspection time (IT) task adapted from Egan and Deary (1992). Fixation, target stimulus, mask, and error feedback were presented at the center of a red seven-segment LED display. A red horizontal bar “-” with a length of 13 mm at the center served as a fixation point. Throughout the task the target stimulus was composed of three vertical segments and one horizontal line segment on top of a digital display forming a “walking stick” (Figure 1(a)). Each line segment extended 13 mm. The mask was similar to the target stimulus but had two vertical line segments on each side. The error feedback consisted of three red horizontal bars (Figure 1(b)). IT target stimulus, response mappings, and schematic timeline of a trial in the inspection time task (adapted from Egan & Deary, 1992). Note. that only one of the target stimuli appeared in each trial.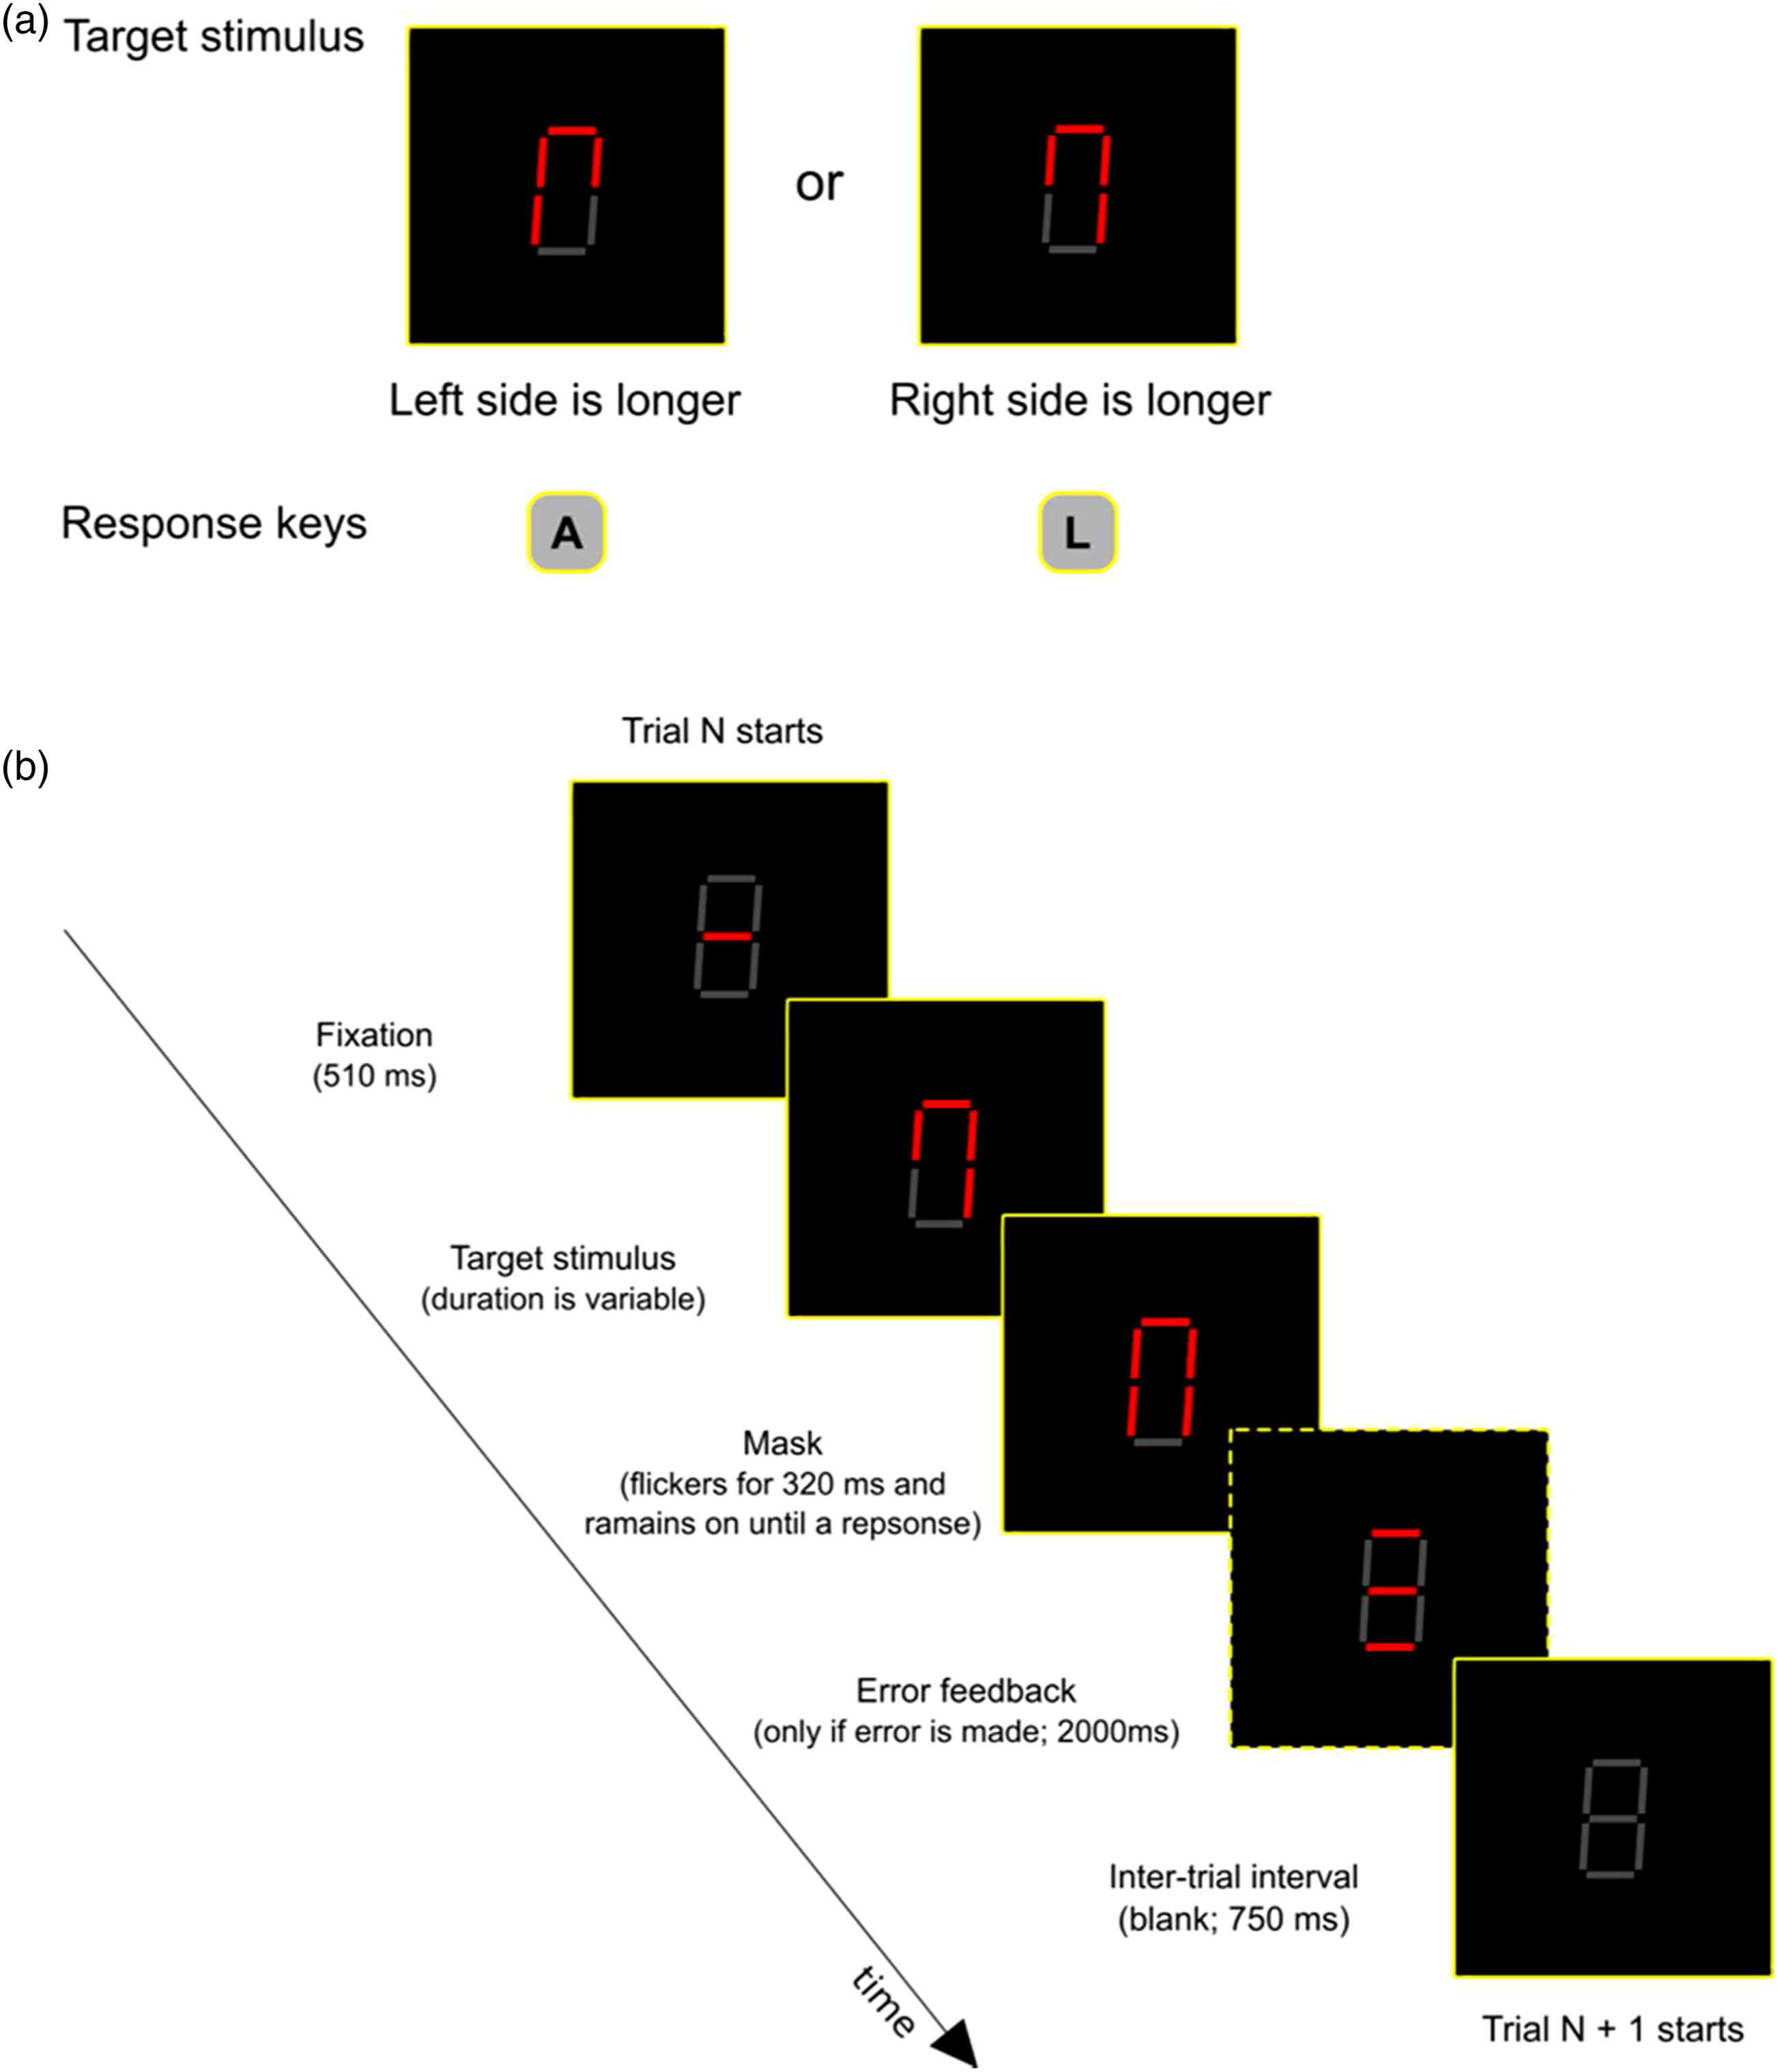
Each trial started with a fixation interval lasting 510 ms, before the target was displayed. The location of the “longer line” (left or right) was randomly selected by the software. The exposure duration of the target stimulus was determined by a Parameter Estimation by Sequential Testing procedure (c.f., PEST procedure in Egan & Deary, 1992; and Luciano et al., 2001). Immediately after the target, the mask was displayed. Participants were required to discriminate the location of the longer vertical line of the target stimulus, by pressing key A and L to indicate the left- or right-hand side, respectively. Participants made their responses without time constraint but were asked to respond as fast and as accurately as possible. In order to suppress premature responses, the mask flickered for 320 ms in each trial and participants were asked not to respond until the flicker stopped. If a correct response was made, the next trials would commence after a 750 ms inter-trial interval. Incorrect responses were followed by error feedback that was visible for 2 seconds (Figure 1(b)). Participants first carried out a training block with 10 trials followed by an experimental block with 110 trials.
Parameter Estimation by Sequential Testing Procedure
By using an adaptive PEST procedure, we tried to determine the lowest stimulus exposure duration at which an individual was able to discriminate whether the elongated vertical line was on the left- or right-hand side of the digital number display (Figure 1(a)). The initial stimulus exposure time was 200 ms and was decreased after four successive correct trials and increased after every incorrect response. The initial change in stimulus duration was 64 ms but depended on the number of reversals. A reversal refers to a change in the direction of the exposure duration from increase to decrease and vice versa. After two reversals (step size >1), the step size was halved. The PEST procedure stopped after 110 trials. Individual inspection times are typically estimated by finding the stimulus exposure time at which a participant reaches an accuracy of 85%.
Task-Switching Tasks
Color/Shape Paradigm
In the color/shape task-switching paradigm, participants were required to perform either a color or shape task on rectangle bars based on triangle task cues. A triangle that pointed up indicated a color task and a triangle pointing down indicated a shape task. There were four different rectangles as target stimuli: a vertically elongated (high) red or green bar, a horizontally elongated (wide) red or green bar. In the color task, participants had to discriminate whether the rectangle bar was red or green by pressing the “A” or “L” key, respectively, on the keyboard, while ignoring the shape. In the shape task, participants had to discriminate whether the bar was high or wide by pressing the “A” or “L” key, respectively, ignoring the color. The RGB color and the size of the stimuli varied randomly across trials to encourage the use of general task rules when making responses (for details, see B. Li et al., 2019). During the experiment, the two tasks were randomly selected and intermixed. In each trial, the task cue was shown for 250 ms before it was covered by a mask for 250 ms, followed by a blank screen for 150 ms, resulting in a cue-stimulus interval (CSI) of 650 ms for cue-based task preparation. We chose a CSI of 650 ms because previous research suggests that this preparation interval works well across different paradigms despite producing considerable individual differences in task-switching performance (B. Li et al., 2019). After a CSI of 650 ms, a critical target stimulus appeared and remained on screen until the participant gave a response or until the maximal RT was exceeded.
Shape/Filling Paradigm
The shape/filling task was the same as the task used by Stoet et al. (2013, Experiment 1). In the shape task, participants were asked to press an “A” key if a diamond-shaped target appeared (30.7 mm each side) and an “L” button if a square-shaped target appeared (30.7 mm each side), ignoring the dots inside. In the filling task, participants were asked to press the left button for two vertically arranged dots and the right button for three vertically arranged dots, ignoring the surrounding shape. All stimuli were printed in yellow and presented on the top or bottom of a rectangular yellow frame (70 × 80 mm). Participants responded to the surrounding shape when the target was presented in the upper part of the frame and responded to the filling dots when the target was presented in the lower part. The “Shape” and “Filling” cues were visible throughout each trial to remind participants of the currently relevant task.
Letter/Number Paradigm
The letter/number task was the same as the task used by Rogers and Monsell (1995, Experiment 1). Participants received a letter/number pair in each trial. The task was to either categorize the letter as a vowel or consonant, or to categorize the digit as being odd or even. The odd numbers were drawn from the set 3, 5, 7, 9, and the even numbers were drawn from the set 2, 4, 6, 8, displayed on screen in yellow sans-serif with font size 22. The consonant letters were drawn from the set G, K, M, R, and vowel letters from the set A, E, I, U, also displayed on screen in yellow sans-serif with font size 22. To help participants to keep track of the task sequence, the letter/number pair was presented on a 2 ∗ 2 yellow grid (5 cm each side), moving around clockwise inside the grid. Participants were told to respond to the letter only when the letter/number pair was shown in one of the top two cells, and to respond to the number only when the pair was shown in one of the bottom two cells. In the number task, participants were asked to press the “A” key if the number was odd and the “L” key if the number was even. In the letter task, participants were asked to press the “A” button if the letter was a vowel and the “L” button if the letter was a consonant.
Intelligence Test
The paper-and-pencil Raven’s advanced progressive matrices test (Raven et al., 1998) was employed in order to measure non-verbal reasoning ability. The test has 12 diagrammatic puzzles in Set I (for practice) and 36 puzzles in Set II (for data analysis, with a full score of 36). Each item in the test contains a figure with a missing piece, and participants are required to select one out of eight possible answers to fit the missing space from the pattern.
Procedure
We applied an English version of task instruction for the participants in the UK and a Chinese version for the participants in China. Further explanation was provided by the experimenter in order to make sure all participants understood the instruction well. During each task-switching paradigm, participants completed two blocks of a total of 256 trials. In each trial, participants had up to 1500 ms to make a response. If participants failed to respond within 1500 ms, the message “Too slow” (or  in the Chinese version) appeared for 2000 ms. If participants pressed the wrong key, an error warning was displayed for 2000 ms. In order to prevent eye strain that may affect the stimulus discrimination in the IT task, all participants completed the IT task first before the three task-switching paradigms and Raven’s intelligence test. The order of the task-switching paradigms was counterbalanced across participants. Breaks were allowed between blocks and tests. On average, participants took about 45 min to complete the IT and task-switching tasks, and they had an additional 45 minutes to complete the Raven test.
Results
Data Analyses
In the following, we tried to establish a relation between stimulus presentation times and accuracy in the IT experiment. We identified individual exposure durations and accuracy with the PEST procedure. In the next step, we related the IT to their task-switching performance. Specifically, we used LISAS to obtain an integrated score for different trial conditions of the task-switching paradigms (c.f., Vandierendonck, 2017, 2018).
Following common practice in the task-switching studies, the first trial of each block and all trials immediately following an incorrect response were excluded from analyses. If participants made an error in a trial, the subsequent trial could not be classified as a switch or repeat trial. As a consequence, a total of 7.51%, 5.72%, and 7.46% of the data had to be removed from the color/shape, shape/filling, and letter/number task-switching paradigms, respectively. All data were analyzed in R version 3.6.2 (R Core Team, 2019).
Stimulus Exposure Duration and Individual Accuracy
The data and model fits are illustrated in Figure 2. In order to model the effect of exposure duration on accuracy, we conducted logistic regressions using the binomial link function (R package stats; R core R Core Team, 2019). This was done in order to establish discrimination functions from the data of the PEST procedure. It appears plausible that accuracy in each individual is at chance level (0.5) when inspection time is 0 ms and reaches a probability of 1.0 as exposure time increases (see Figure 2). Illustration of probability correct as a function of exposure duration. Circles denote the observed binary response (jittered around 0 and 1) at different exposure durations. A logistic regression curve in black is fitted to the data. The dashed horizontal line indicates the 85% accuracy threshold.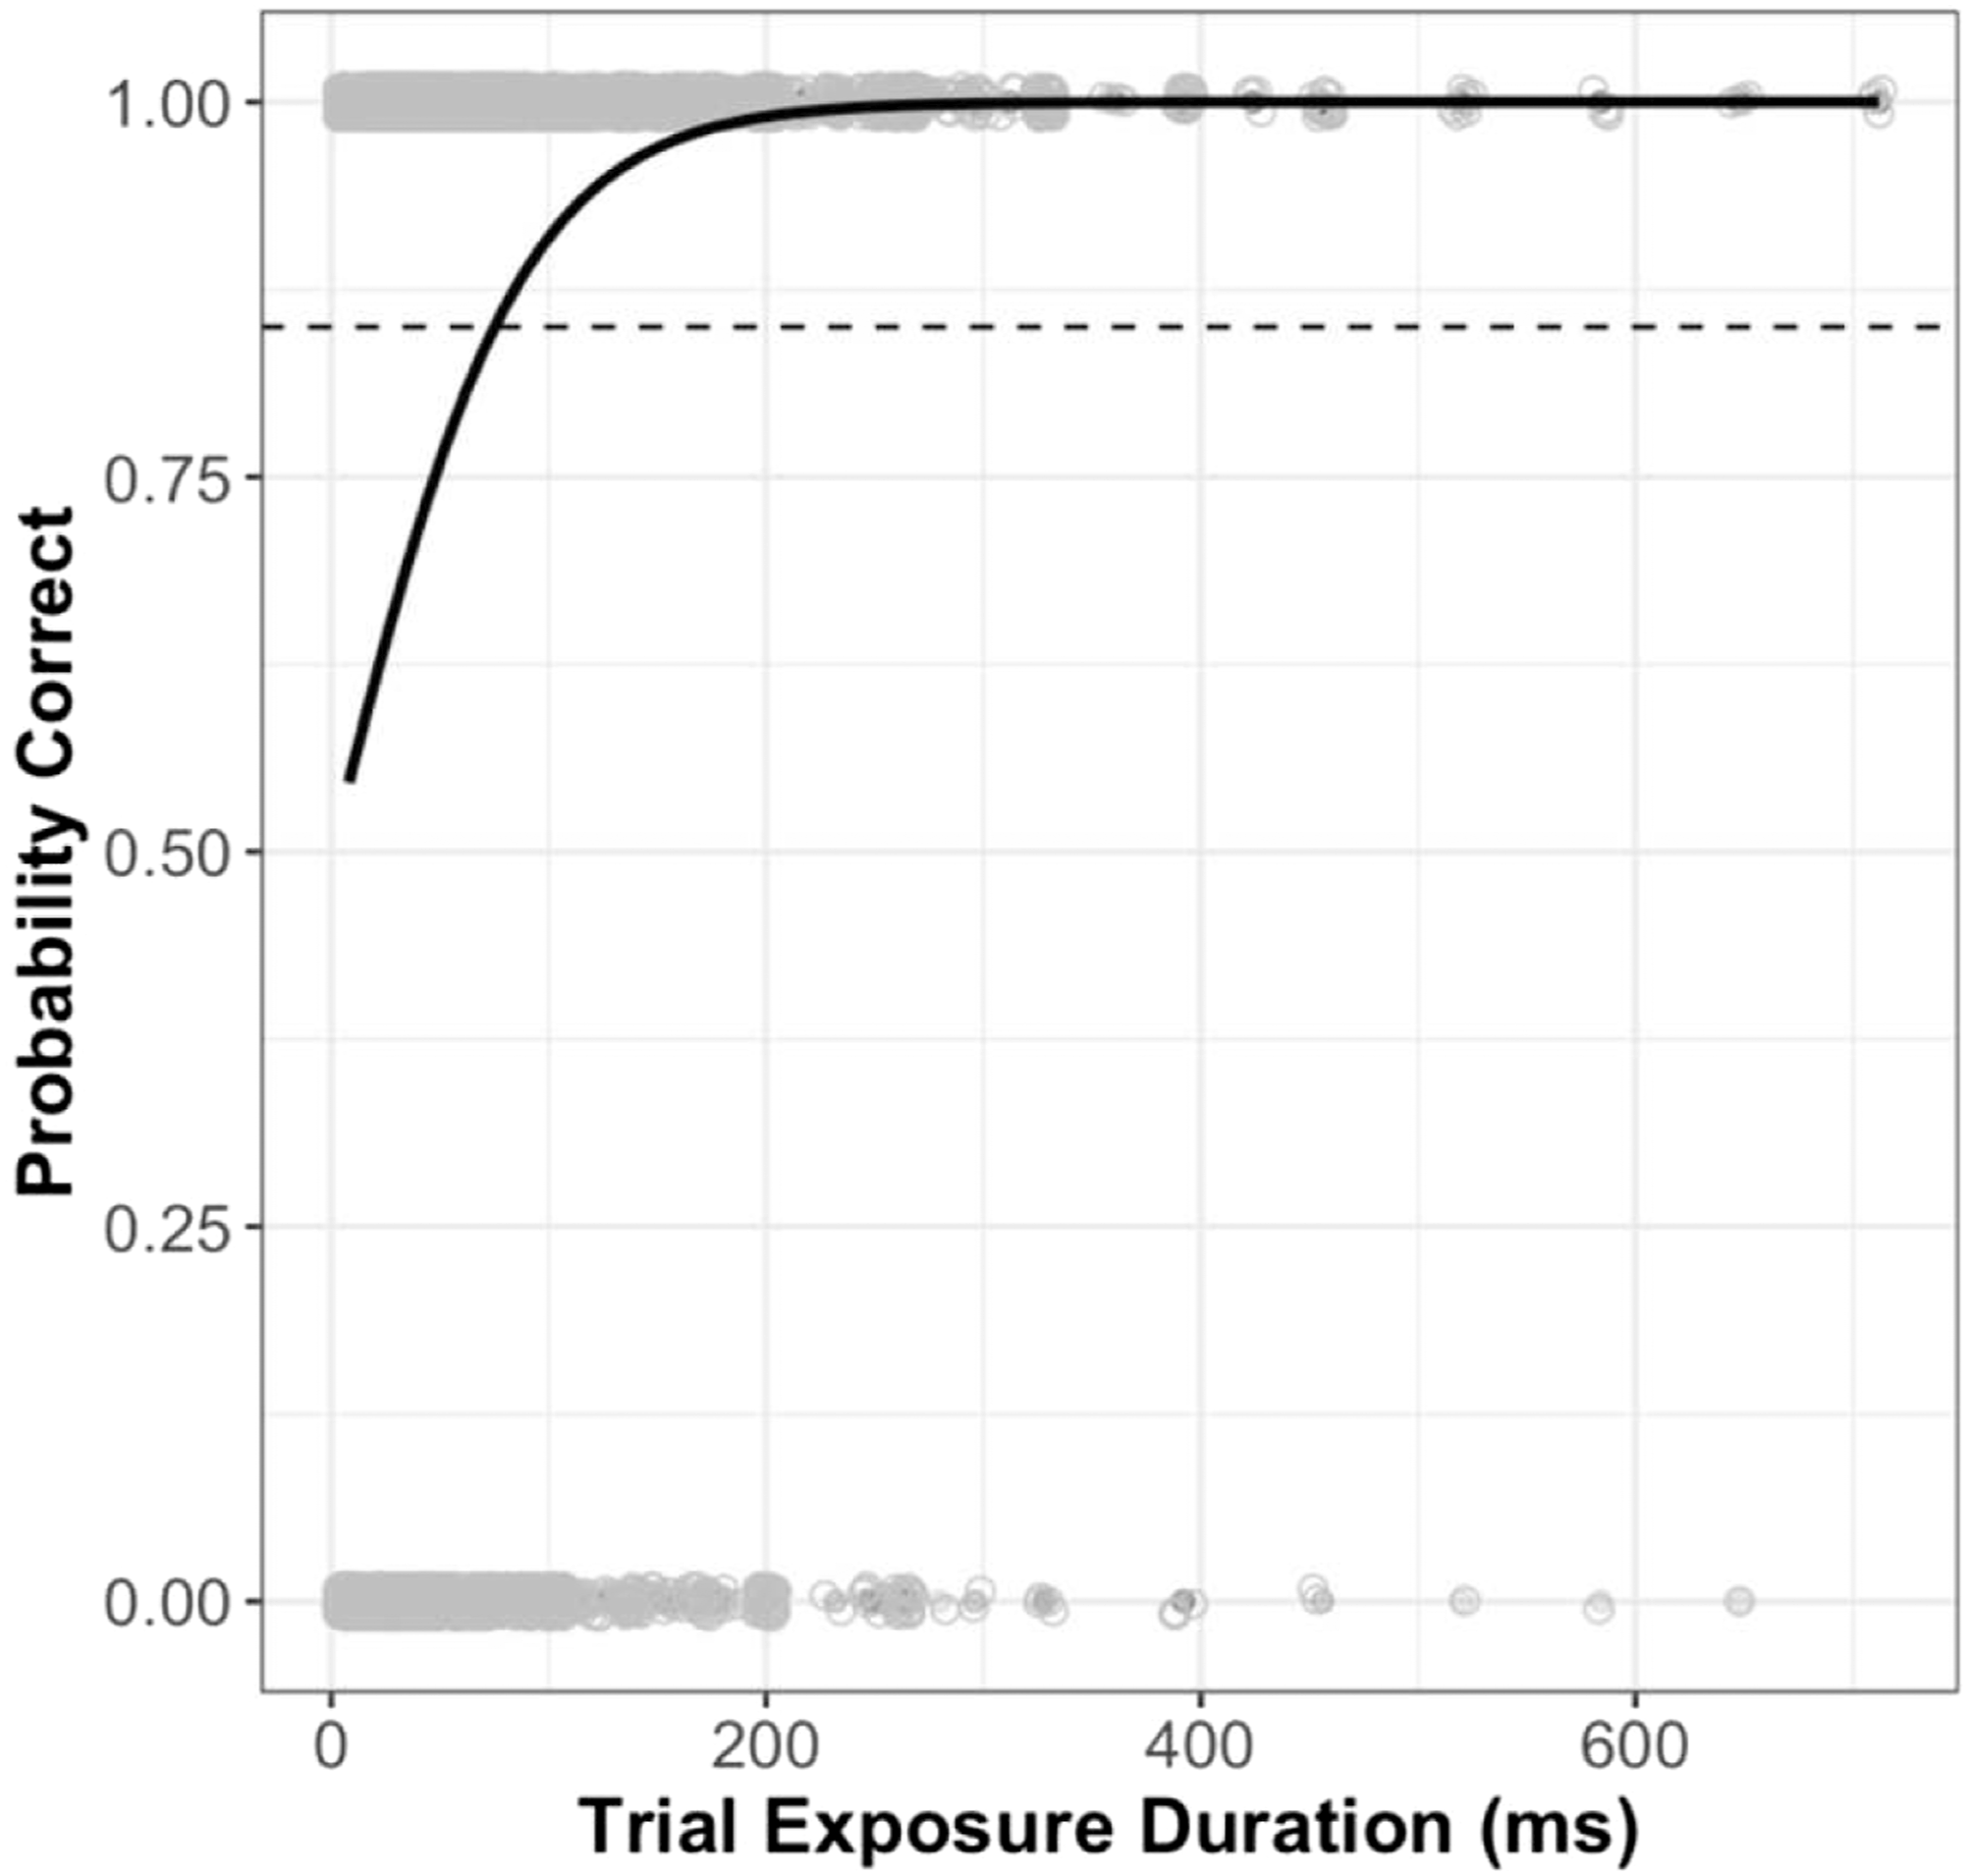
Inspection Time
We extended the logistic model by including by-subject random effects of exposure duration. Then, IT of each participant was derived from the logistic mixed-effect model by using the stimulus exposure time at which participants reached an estimated accuracy of 85%. Mean IT was 131.76 ms (SE = 7.08), ranging between 63.67 ms and 533.71 ms in the sample. IT correlated significantly with IQ (r = −.21, p = .044) but not with age (r = .06, p = .539).
Task-Switching Performance
We established LISAS for all three task-switching paradigms: color/shape, shape/filling, and letter/number. A two-way ANOVA with repeated measurements was conducted to compare LISAS for task-repeat and task-switch trials in different task-switching paradigms. The two factors were Trial transition (task-repeat, task-switch) and Paradigm (color/shape, shape/filling, letter/number task-switching paradigms). Mean results of each condition are illustrated in Figure 3 and listed in the Appendix A. Boxplots of LISAS for color/shape, shape/filling, and letter/number task-switching paradigm. Each black dot indicates an outlier. Boxes and bold horizontal bars inside boxes denote interquartile ranges and medians, respectively. The whiskers extending from the box in both directions represent 1.5 times the interquartile range. Red diamonds and error bars denote means and standard errors, respectively; dLISAS represents the difference between LISAS for task-repeat and task-switch conditions. Note. ***p < .001; **p < .01; ns = non-significant.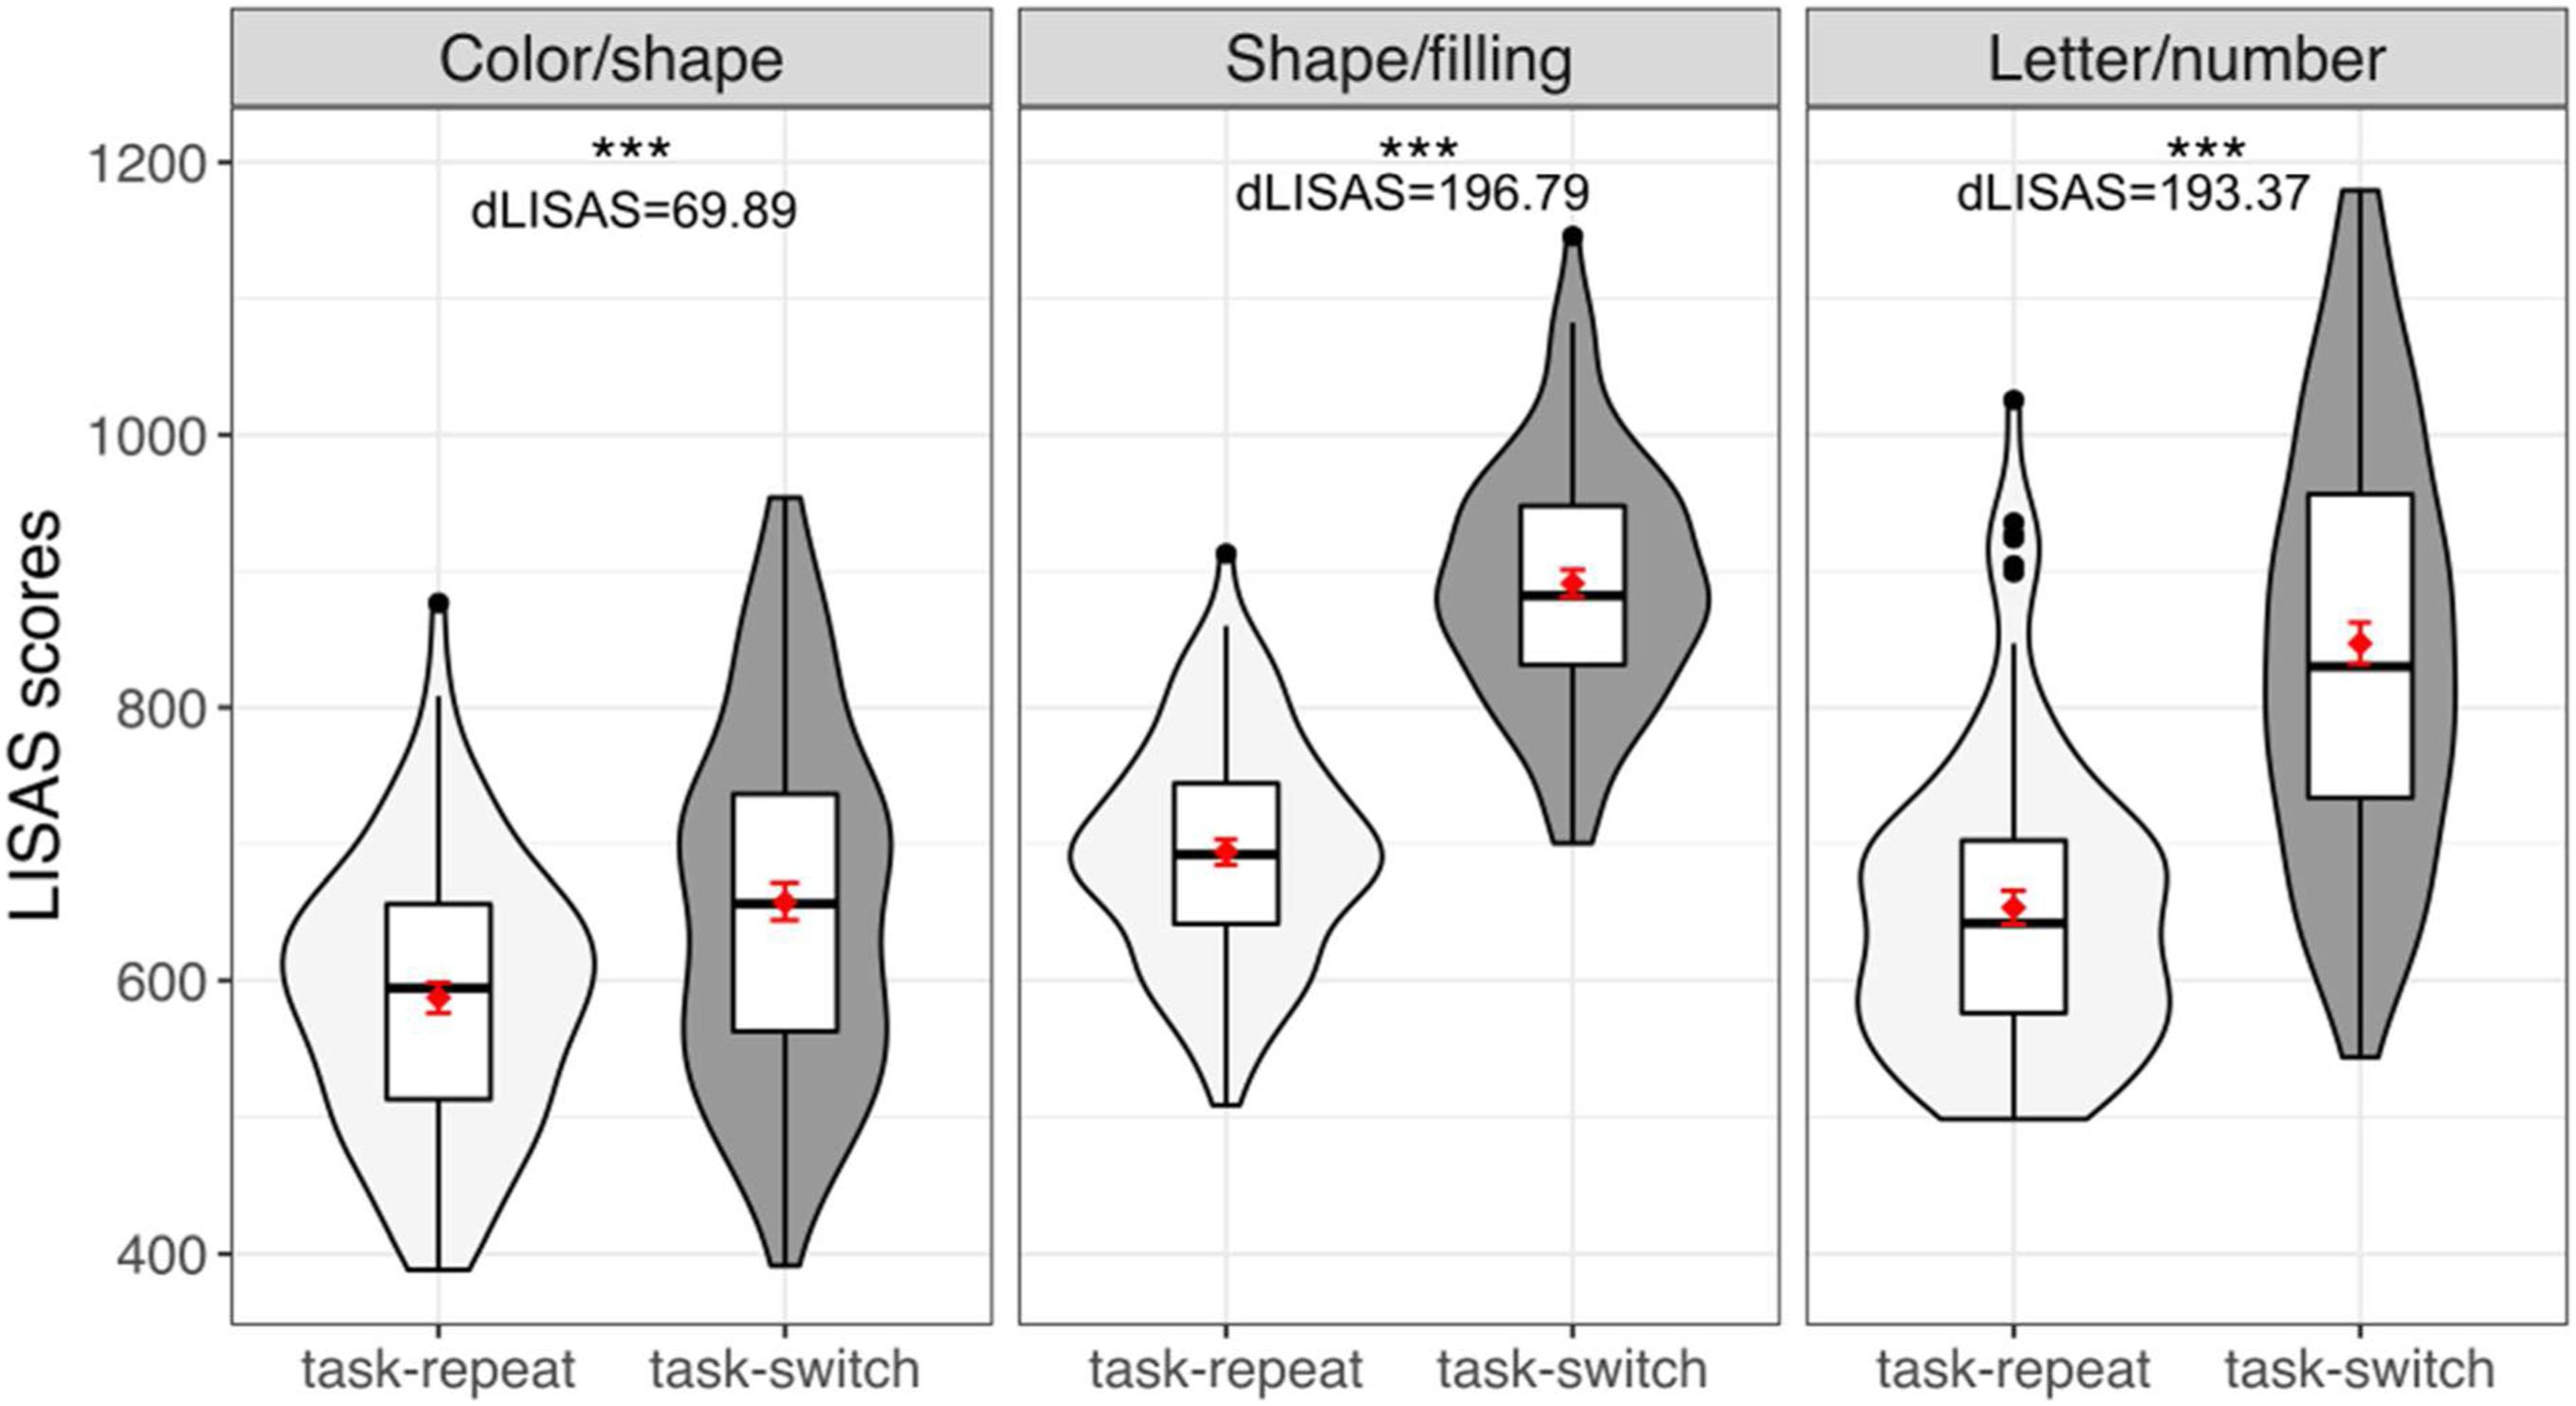
We found a significant main effect of Trial transition, F (1, 92) = 635.55, p < .001, ηp2 = 0.32, and Paradigm, F (2, 184) = 153.72, p < .001, ηp2 = 0.29. LISAS was higher in task-switch trials (798.39) compared to task-repeat trials (645.04), and was higher in the shape/filling (792.56) compared to the color/shape (622.41) and letter/number task-switching paradigms (750.16). Participants indicated lowest LISAS score in the color/shape task-switching paradigm (for all comparisons, p < .001). Trial transition interacted significantly with Paradigm, F (2, 184) = 87.53, p < .001, ηp2 = 0.06. Post hoc testing adjusted according to Holm (Holm, 1979) indicated that LISAS was significantly higher in task-switch than in task-repeat trial conditions for all three task-switching paradigms (all p < .001).
Relating IT to LISAS Across Trial Conditions
Linear regression analyses were conducted to examine the relation between IT and overall task-switching performance as measured by LISAS, and whether Trial transition (task-repeat, task-switch) affected this relation. Four models (Appendix B) were fit and compared in likelihood ratio (LR) tests. Model 1 involved Trial transition as the only fixed effect, Model 2 involved IT and Trial transition as fixed effects, and Model 3 involved both main effects and their interaction. Model comparisons suggest that Model 2 was significantly better than Model 1 (LR test χ 2 (4) = 8.06, p = .005), suggesting IT explained additional variance in LISAS. However, Model 3 with the interaction term was not significantly better than Model 2 (LR test χ 2 (6) = 0.21, p = .644).
Linear Regression Results Predicting LISAS.
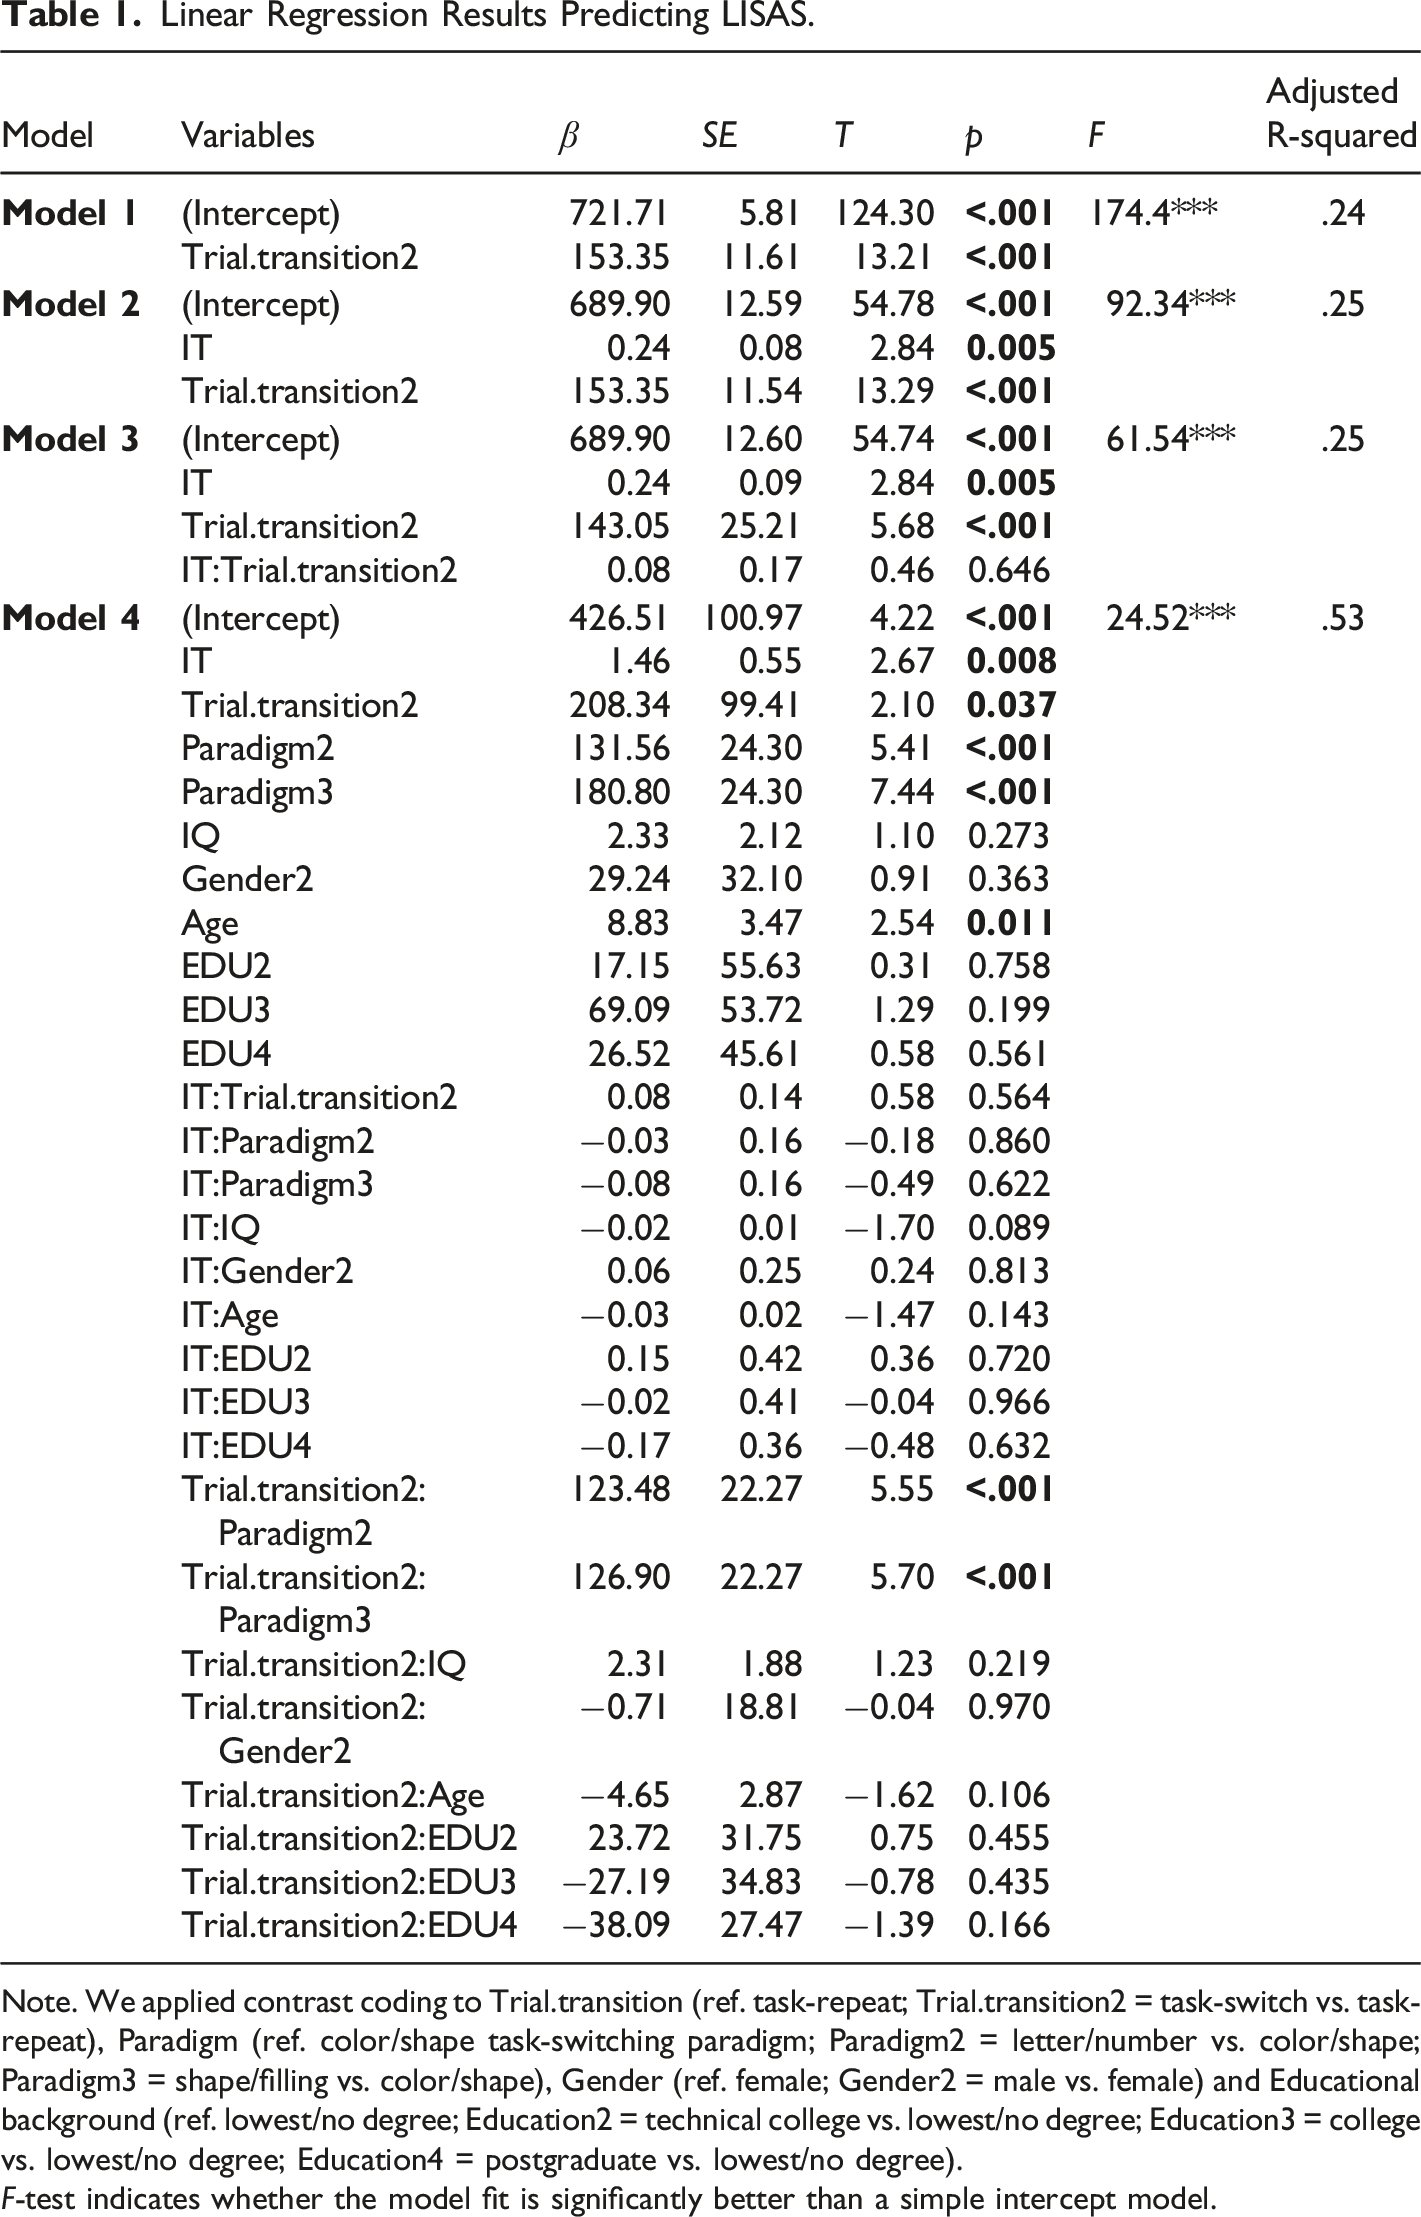
Note. We applied contrast coding to Trial.transition (ref. task-repeat; Trial.transition2 = task-switch vs. task-repeat), Paradigm (ref. color/shape task-switching paradigm; Paradigm2 = letter/number vs. color/shape; Paradigm3 = shape/filling vs. color/shape), Gender (ref. female; Gender2 = male vs. female) and Educational background (ref. lowest/no degree; Education2 = technical college vs. lowest/no degree; Education3 = college vs. lowest/no degree; Education4 = postgraduate vs. lowest/no degree).
F-test indicates whether the model fit is significantly better than a simple intercept model.
We also calculated the difference between task-repeat and task-switch LISAS as a measure of task-switching performance (dLISAS). We conducted a linear regression analysis to test whether performance on IT can predict task-switching costs as measured by dLISAS. In summary, the results showed that IT did not significantly predict task-switching costs as measured by dLISAS. However, IQ, Age, and Education significantly predicted dLISAS in this analysis (see Appendix C).
Discussion
The main purpose of the present study was to re-examine whether there is a significant relation between processing speed and task-switching performance. We found that LISAS is predicted by IT, which was not affected by different trial types (i.e., task-repeat, task-switch). In other words, our results indicate that processing speed was significantly related to average performance in task-switching paradigms but not to task-switching costs, which contradicts previous results (Moretti et al., 2018; Salthouse et al., 1998; Wasylyshyn, 2007). We attribute the differences between results to confounded measurements in these studies. In previous studies, measurement of processing speed (i.e., the pattern comparison/symbol-digit matching test; Moretti et al., 2018; Salthouse et al., 1998; Wasylyshyn, 2007) required a certain “task-switching ability” such as feature updating and this creates problems of task impurity (Burgess, 1997; Miyake et al., 2000). Instead, we measured processing speed by an IT task (Deary & Stough, 1996), a measure that is not believed to involve executive control (Deary & Stough, 1996; Egan & Deary, 1992; Kranzler & Jensen, 1989).
A recent study by Eisma and Winter (2020) showed that even very simple IT tasks are “impure” or confounded. Factors such as focused attention and task experience were found to impact on participants’ IT performance (Eisma & Winter, 2020). Specifically, eye blinks during stimulus onset were negatively related to response accuracy in the IT task. However, with increasing experience and practice participants improved in accuracy while response times decreased. Nevertheless, compared with other processing speed tests (i.e., the pattern comparison/symbol-digit matching test), at least the abilities that are associated with performing an IT task are relatively basic—the IT task depends heavily on efficient processing of simple stimuli to complete the task, and it is related to speed of visual perception (Burns & Nettelbeck, 2003; Connor & Burns, 2003).
Although task-switching costs were a golden standard to index cognitive flexibility, it inevitably faces the problem of task impurity. For example, task-switching costs might reflect the ability to control proactive interference (Allport et al., 1994). That way, our research results also show that processing speed has no obvious relation with the interference control ability. As previous studies suggested, processing speed (measured by IT) has little in common with aspects of cognitive control (Burns & Nettelbeck, 2003; Garaas & Pomplun, 2008; Tourva et al., 2016).
Processing Speed and Task-Switching Performance
Consistent with our prediction, task-switching costs were not significantly related to the speed of information processing although participants’ processing speed significantly predicted their overall performance in three different task-switching paradigms. At first glance, these results appear to be in conflict with some conclusions about task-switching costs. Several studies demonstrated that faster responses are associated with smaller switch costs compared to slower responses (Brown et al., 2006; De Jong, 2000; Xu et al., 2021). This raises the question why processing speed can only improve overall performance while it is unrelated to task-switching costs?
In task-switching paradigms, participants’ performance is determined by at least two processes. First, participants need to encode the stimuli (i.e., task cues and targets) in both task-repeat and task-switch trials. Second, once the stimuli are encoded, participants need to prepare the response based on task rules. There are two types of preparation: general preparation which occurs in both task repetitions and task switches and task-specific preparation which occurs only when a task switch is required in an upcoming trial (Kiesel et al., 2010). Nevertheless, both preparation processes require common cognitive abilities such as identifying task features and activating task rules in working memory (Altmann, 2004; B.; Li et al., 2019). Therefore, participants who have better general preparation tend to show better task-specific preparation, resulting in overall performance (RT and ER) that are related to task-switching costs.
However, faster processing facilitates the process of cue and target encoding thereby enhancing overall performance, but does not affect higher-level cognitive functions. This means that processing speed does not affect task rule updating and the ability to control interference from task-irrelevant features during task-switching. Therefore, specific aspects of task-switching, task-switching costs in particular, and processing speed are not directly related. In other words, we argue that the ability to switch between tasks is not closely related to processing speed. This, in turn, suggests independence of processing speed and higher-level cognitive functions. Supporting evidence was provided by Burns and Nettelbeck (2003) who found only a weak correlation between IT and response time/decision time in an “odd-man-out” task. In an explorative factor analysis, they reported that IT loaded on factor “speediness” and response time measures loaded strongly on factor “general fluid ability,” suggesting little relation between IT and general cognitive abilities.
Task-Switching and Covariates
Beyond the main issue of predicting task-switching performance from processing speed, our results suggest that IQ, age, and education served as significant predictors of task-switching costs in terms of dLISAS (see analyses in Appendix C). To our knowledge, there have been no results indicating that IQ, age, or education would predict integrated task-switching costs. We found that higher Raven IQ scores significantly predicted increased task-switching costs (Appendix C). This appears to contradict results on IQ and cognitive abilities (Graham et al., 2010; Wang et al., 2021). Nevertheless, in previous studies, researchers typically found a close relation between IQ and cognitive control of working memory. There is empirical evidence that although flexible switching and working memory are both core executive functions, their association can be weak (Deák & Wiseheart, 2015; Nweze & Nwani, 2020). It seems possible, although highly speculative, that there may be a trade-off in terms of cognitive resources allocated to task-switching and abstract thinking. Trade-offs between cognitive functions are not a novel idea. Classical studies, based on factor analyses, suggest that many cognitive abilities may be positively correlated to each other in a hierarchical fashion (e.g., Carroll, 1993; Johnson & Bouchard, 2007; Caemmerer et al., 2020). More recent studies have looked at trade-offs between cognitive abilities (Colzato et al., 2021; Hills & Hertwig, 2011; Tello-Ramos et al., 2019). For example, Colzato et al. (2021) discussed possible downsides of cognitive enhancement. Since human cognitive resources are limited, training and improving the efficiency of one particular cognitive function (e.g., stability of mental representation) may be associated with loss in another function or process (e.g., flexible updating of the representations), and this can be related to individual differences in working memory span (Iuculano & Kadosh, 2013), eye blink rates and different levels of emotion (Akbari Chermahini & Hommel, 2012). We speculate that there may be a potential trade-off between abstract reasoning and task-switching, but this claim requires further investigations.
Although task-switching performance (LISAS) got worse with increasing age, a negative relation was found between age and task-switching costs (dLISAS) which is not in line with previous results showing negligible age differences for task-switching costs (Kray & Lindenberger, 2000; see a review by; Gajewski et al., 2018; Kray & Ferdinand, 2014; Wasylyshyn et al., 2011). However, in a recent study by Zunini and colleagues (López Zunini et al., 2019), smaller response time switching costs were observed in older monolinguals and bilinguals compared to younger participants. Older participants even showed no task-switching costs in a Stroop-switching paradigm, whereas younger adults had significant switching costs in the same conditions, suggesting differences in strategy preference (i.e., target-first strategy; Xu et al., 2021; see also X. Li, Li, Liu, et al., 2019).
The finding that participants who reached higher education levels showed smaller switching costs is consistent with previous research suggesting that longer formal education is associated with smaller task-switching costs (Moretti et al., 2018) and better cognitive performance across a range of neuropsychological tests (Rimkus et al., 2018).
Limitation and Future Direction
The present study has two main limitations. First, we assessed speed of information processing with the help of a single IT task. Other research employed several measures including pattern comparison/symbol matching tests (Moretti et al., 2018; Salthouse et al., 1998; Wasylyshyn, 2007) to probe processing speed. Future studies may compare different measures of processing speed for the same participants. Second, a recent study by Eisma and Winter (2020) suggested that IT performance is influenced by task experience, focused attention (e.g., eye blinking when the stimulus was presented), and may vary depending on individual response strategies (e.g., apparent motion or perceived brightness cues) which was not recorded and controlled in the present study. Nevertheless, all participants were naive to the IT task and most participants had no experience with task-switching tests before participating in the present study. Whether levels of attention and strategy use in the IT task moderate the relation between processing speed and task-switching costs remains to be investigated.
The finding that participants with higher Raven IQ scores showed larger task-switching costs in terms of dLISAS is surprising and difficult to explain (Appendix C). In future studies, it may be of interest to further investigate potential links between IQ and task-switching ability. Moreover, there are other factors such as participants’ language background (e.g., Garbin et al., 2010; Prior & MacWhinney, 2010), emotion (e.g., Dreisbach & Goschke, 2004; Wang et al., 2017), motivation (e.g., De Jong, 2000; Yee, Krug, Allen & Braver, 2016), and task-switching strategy (e.g., X. Li et al., 2019; Xu et al., 2021) that may also affect flexible switching between tasks. However, these factors were not evaluated and controlled in the present study. Future studies may control additional factors across participants while investigating the effect of processing speed on task-switching performance.
Conclusion
We revisited the relation between task-switching and processing speed using a more sophisticated measurement of task-switching (LISAS) and processing speed (IT task). Contrary to previous studies, we found that task-switching costs and processing speed were unrelated. We propose that previous studies may have drawn inadequate conclusions about the relation between task-switching and processing speed because “task impurity” and confounded measurements of processing speed affected their results. In contrast, our results suggest that processing speed does not predict task-switching costs in different task-switching paradigms, and processing speed may be independent of different executive functions and certain higher-level skills.
Footnotes
Declaration of Conflicting Interests
The author(s) declared no potential conflicts of interest with respect to the research, authorship, and/or publication of this article.
Funding
The author(s) disclosed receipt of the following financial support for the research, authorship, and/or publication of this article: This work was supported by the China Postdoctoral Science Foundation.

Appendix A
Mean (SE) of LISAS of task-repeat and task-switch trials for color/shape, shape/filling, and letter/number task-switching paradigm.
Color/shape
Shape/filling
Letter/number
Total
Task-repeat
587.46 (10.23)
694.17 (8.47)
653.48 (11.34)
645.04 (6.37)
Task-switch
657.35 (13.48)
890.95 (9.23)
846.85 (15.90)
798.39 (9.71)
Total
622.41 (8.82)
792.56 (9.56)
750.16 (12.06)
Appendix B
Linear regression models examining the relation between IT and average task-switching performance as measured by LISAS, with or without including experimental conditions, covariates (age, gender, IQ, education) and two-way interactions.
Formulas
Model 1
LISAS ∼ Trial.transition
Model 2
LISAS ∼ IT + Trial.transition
Model 3
LISAS ∼ IT + Trial.transition + IT:Trial.transition
Model 4
LISAS ∼ IT + Trial.transition + Paradigm + IQ + Gender + Age + Education + IT:Trial.transition + IT:Paradigm + IT:IQ + IT:Gender + IT:Age + IT:Education + Trial.transition:Paradigm + Trial.transition:IQ + Trial.transition:Gender + Trial.transition:Age + Trial.transition:Education
Relating IT to task-switching costs (dLISAS)
We conducted linear regression analyses to test whether performance on IT can predict task-switching costs as measured by dLISAS. Three models were conducted. Model 1 involved IT as fixed effect, Model 2 involved IT, paradigms and other covariates IQ, gender, age, and educational background as fixed effects, and Model 3 involved both main effects and their interaction. Model comparisons showed that Model 2 was significantly better than Model 1 (LR test χ 2 (8) = 131.85, p < .001), suggesting task-switching paradigms and covariates explained additional variance in dLISAS. However, Model 3 with the interaction term was not significantly better than Model2 (LR test χ 2 (8) = 13.80, p = .087).
We found that IT did not significantly predict task-switching costs as measured by dLISAS (see Table A1), which did not depend on task-switching paradigm as well as covariates. However, paradigm, IQ, age, and educational background served as significant predictors to predict dLISAS. To our surprise, IQ and dLISAS were positively related, suggesting participants who had a higher Raven IQ score tended to show larger task-switching costs. In addition, dLISAS was negatively related to age and education. Linear Regression Results Predicting dLISAS. Note. We applied contrast coding to Trial.transition (ref. task-repeat; Trial.transition2 = task-switch vs. task-repeat), Paradigm (ref. color/shape task-switching paradigm; Paradigm2 = letter/number vs. color/shape; Paradigm3 = shape/filling vs. color/shape), Gender (ref. female; Gender2 = male vs. female) and Educational background (ref. lowest/no degree; ref. lowest/no degree; Education2 = technical college vs. lowest/no degree; Education3 = college vs. lowest/no degree; Education4 = postgraduate vs. lowest/no degree).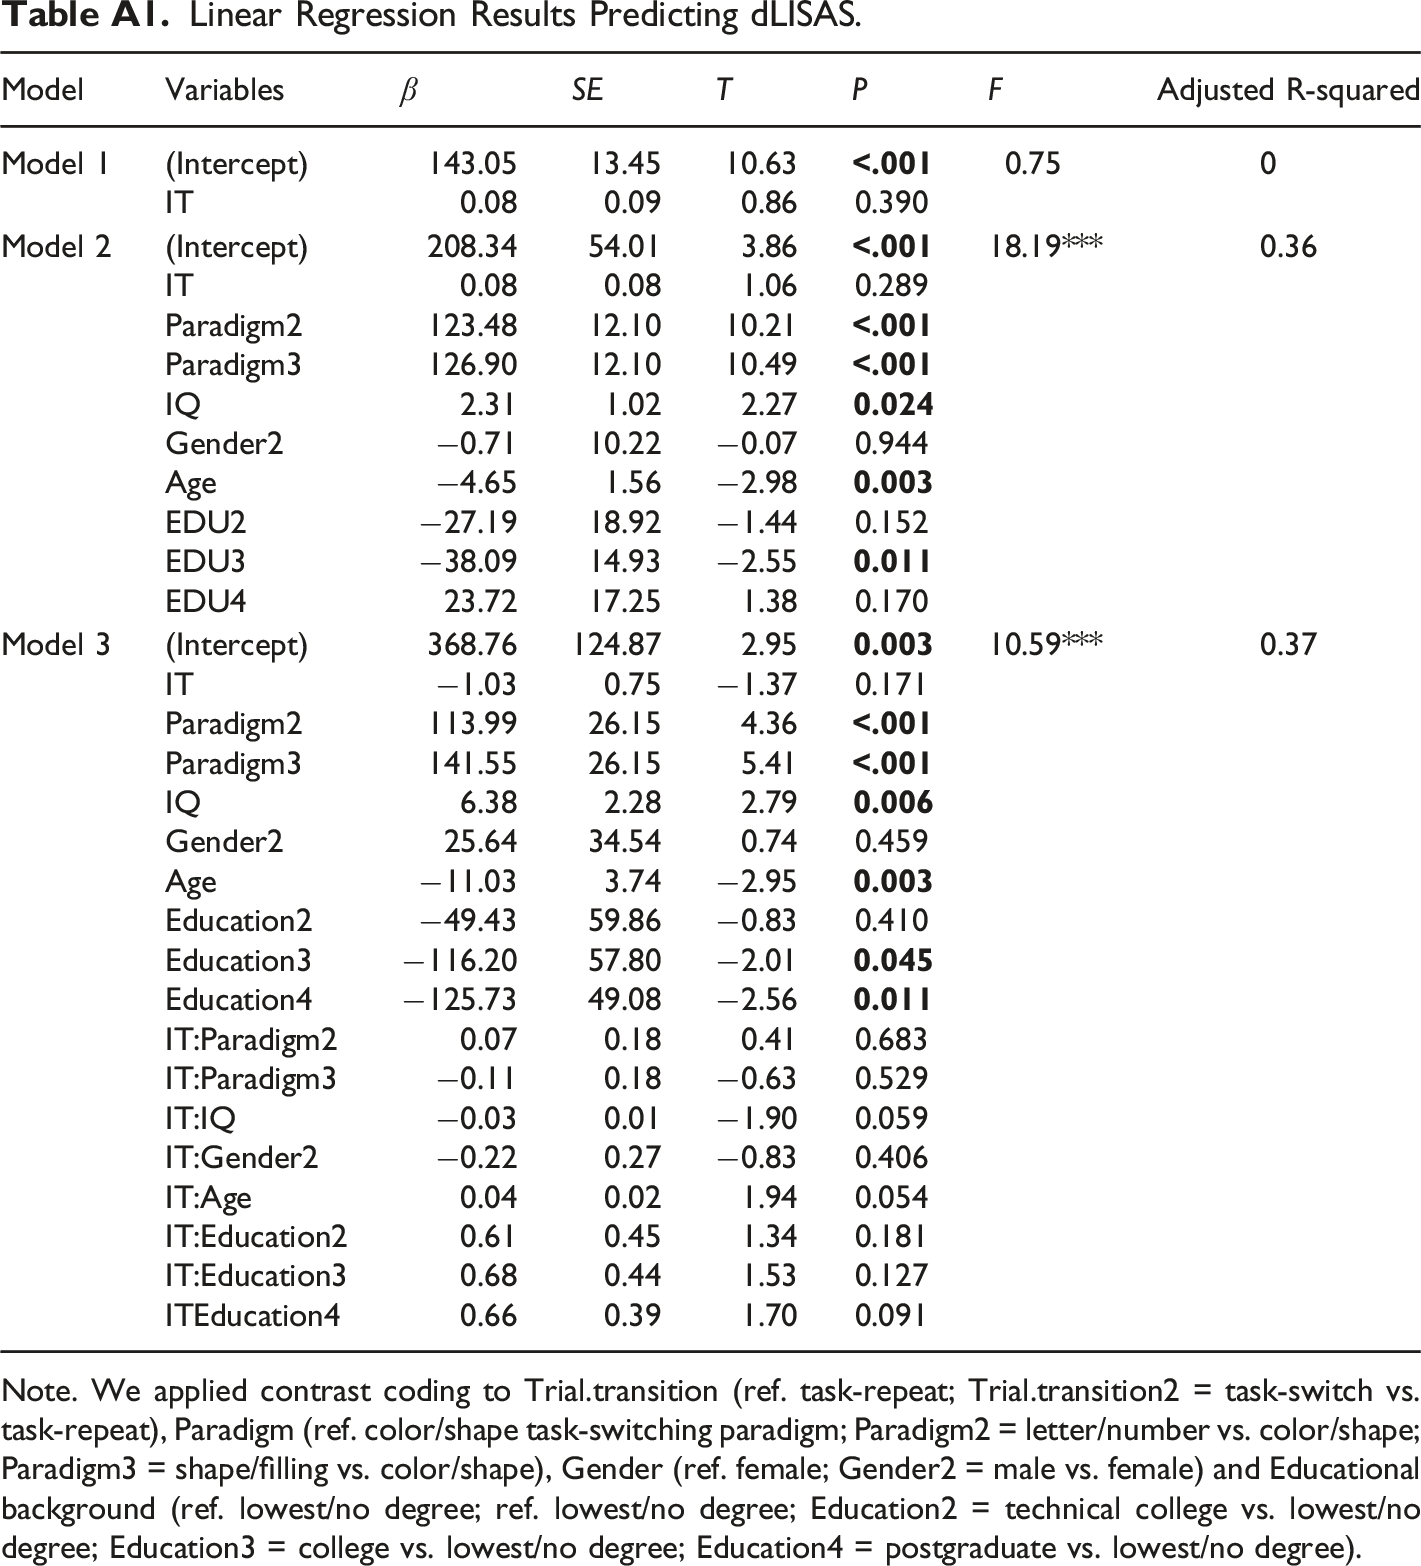
Model
Variables
β
SE
T
P
F
Adjusted R-squared
Model 1
(Intercept)
143.05
13.45
10.63
0.75
0
IT
0.08
0.09
0.86
0.390
Model 2
(Intercept)
208.34
54.01
3.86
18.19***
0.36
IT
0.08
0.08
1.06
0.289
Paradigm2
123.48
12.10
10.21
Paradigm3
126.90
12.10
10.49
IQ
2.31
1.02
2.27
Gender2
−0.71
10.22
−0.07
0.944
Age
−4.65
1.56
−2.98
EDU2
−27.19
18.92
−1.44
0.152
EDU3
−38.09
14.93
−2.55
EDU4
23.72
17.25
1.38
0.170
Model 3
(Intercept)
368.76
124.87
2.95
10.59***
0.37
IT
−1.03
0.75
−1.37
0.171
Paradigm2
113.99
26.15
4.36
Paradigm3
141.55
26.15
5.41
IQ
6.38
2.28
2.79
Gender2
25.64
34.54
0.74
0.459
Age
−11.03
3.74
−2.95
Education2
−49.43
59.86
−0.83
0.410
Education3
−116.20
57.80
−2.01
Education4
−125.73
49.08
−2.56
IT:Paradigm2
0.07
0.18
0.41
0.683
IT:Paradigm3
−0.11
0.18
−0.63
0.529
IT:IQ
−0.03
0.01
−1.90
0.059
IT:Gender2
−0.22
0.27
−0.83
0.406
IT:Age
0.04
0.02
1.94
0.054
IT:Education2
0.61
0.45
1.34
0.181
IT:Education3
0.68
0.44
1.53
0.127
ITEducation4
0.66
0.39
1.70
0.091