
Abstract
This exploratory study determined which of 14 selected predictors of autism spectrum disorder (ASD) found in individual-level research are predictive of ASD prevalence rates in the 50 U.S. states without and with statistical control for socioeconomic status (SES). Analyses used 2017 state ASD rates and SES, race, Big Five personality, IQ, urban population percent, air pollution, health care providers per population, physician shortage, per pupil spending, PN-3 policy and strategy, percent without health insurance, Medicaid-CHIP enrollment, maternal age, prepregnant obesity, and low birth weight variables based on various samples largely from 2017. ASD rates correlated significantly with each of the 15 potential predictors except for percent uninsured, Medicaid-CHIP enrollment, and air pollution (p = .051). However, when each of the 14 potential predictors entered alone on the second step of a regression equation with SES controlled, only race, personality, urbanization, air pollution, PN-3 policy and strategy, and maternal age were significant predictors. Additionally, an equation with these six predictors entered simultaneously on a second step showed that only SES and air pollution were significant. In another equation with only SES and air pollution entered as predictors, they jointly accounted for 55.7% of the variance in state ASD prevalence rates. Both higher SES and greater air pollution were associated with higher ASD prevalence. There was no evidence of multicollinearity or spatial autocorrelation in the 15 regression equations. These results suggest that considering SES and air pollution could prove beneficial in aggregate-level or individual-level analysis of factors associated with an autism diagnosis.
Autism spectrum disorder (ASD)—commonly referred to as autism—is classified as a neurodevelopmental condition characterized by “persistent deficits in social communication and social interaction across multiple contexts” and “restricted, repetitive patterns of behavior, interests, or activities” that “cause clinically significant impairment in social, occupational, or other important areas of current functioning” (American Psychiatric Association, 2013, pp. 27–28). According to recent U.S. estimates based on 2022 data, ASD prevalence is 1 in 31 among 8-year-olds (Shaw et al., 2025). This reflects dramatically increasing prevalence over the preceding two decades. Estimates for 8-year-olds were 1 in 150 in 2000 and 1 in 36 in 2020 (Maenner et al., 2023). ASD prevalence also differs across the 50 U.S. states. Dietz et al. (2020) reported that the prevalence rate for those 18 to 84 years of age ranged from 1.97% in Louisiana to 2.42% in Massachusetts.
Although the causes of autism are far from fully understood, there is a voluminous research literature reporting a wide array of correlated variables and potential causal factors that may contribute to greater knowledge regarding the development of ASD. Some of these essentially are “person” variables while others are “environment” variables. For example, there is empirical evidence that ASD is related to genetics (e.g., Sandin et al., 2017; Taylor et al., 2021), socioeconomic status (SES; e.g., He et al., 2018; Kelly et al., 2019), race (e.g., Kim et al., 2025; Strassfield et al., 2023), personality (e.g., Lodi-Smith et al., 2019; Schwartzman et al., 2016), IQ (e.g., Gardner et al., 2020; Wolff et al., 2022), urban-rural differences (e.g., Hsu et al., 2023; Lauritsen et al., 2014), air pollution (e.g., Lam et al., 2016; Volk et al., 2013), availability of health care providers (e.g., Kester et al., 2024; Mazumdar et al., 2013), physician shortage (e.g., Malik-Soni et al., 2022; Smith et al., 2025), per pupil spending (e.g., Palmer et al., 2005; Powers & Uhing, 2023), PN-3 policy and strategy (e.g., Abdelkader et al., 2024; Holland et al., 2026), percent without health care insurance (e.g., APEX, 2026; Mandell et al., 2016), Medicaid-CHIP enrollment (e.g., Mandell et al., 2010; Semansky et al., 2011), maternal age (e.g., Quinlan et al., 2015; Wu et al., 2017), prepregnant obesity (e.g., Carter et al., 2023; Li et al., 2016), and low birth weight (e.g., Ma et al., 2022; Talmi et al., 2020).
Curiously, empirical research also shows that SES, which is commonly based on income and educational attainment, is related to each of the variables just listed as correlates of ASD. For example, there is evidence that SES is related to genetics (e.g., Fieder & Huber, 2024; Hur & Bates, 2019), race (e.g., Maroco et al., 2025; McCann, 2024), personality (e.g., Jonaissaint et al., 2011; McCann, 2025), IQ (e.g., Jokela, 2022; McCann, 2025), urban-rural differences (e.g., Drescher & Domingue, 2023; McCann, 2023), air pollution (e.g., Boring et al., 2022; Do & Zhang, 2025), availability of health care providers (e.g., Davis et al., 2018; Drescher & Domingue, 2023), physician shortage (e.g., Davis et al., 2018; Lee & Kontopantelis, 2024), per pupil spending (e.g., Jang & Reardon, 2019; Soares, 2005), PN-3 policy and strategy (e.g., Prenatal-to-3, 2022; Webster et al., 2022), percent without health care insurance (e.g., Kwon et al., 2018; Molina-Salazar & Carbajal-De-Nova, 2026), Medicaid-CHIP enrollment (e.g., Gresenz et al., 2013; Zewde et al., 2021), maternal age (e.g., UK, 2025; Van Roode et al., 2017), prepregnant obesity (e.g., Driscoll & Gregory, 2020; Siega-Riz, 2012), and low birth weight (e.g., Martinson & Reichman, 2016; Okui & Nakashima, 2022).
Contrary to the commonly found association between lower SES and a greater tendency to manifest physical and mental health problems (e.g., Kivimaki et al., 2020; Rook, 2024), some research evidence indicates that higher SES is associated with higher ASD. For example, Kelly et al. (2019) found that mothers in the United Kingdom were at greater risk of having ASD children the higher their educational attainment, Thomas et al. (2012) found that ASD prevalence was greater in tracts in four counties in New Jersey with higher median household incomes, Durkin et al. (2017) found a positive association between SES and ASD prevalence among 8-year-olds in the U.S. for the period 2002 to 2010, and King and Bearman (2011) suggested that more abundant community-level resources which are generally associated with higher SES were responsible for the increased diagnosis and prevalence of ASD in California from 1992 to 2000.
However, other studies have found that SES is negatively related to the development of ASD. For example, Rai et al. (2012) reported that Swedish children of parents with manual occupations and lower income were more likely to have ASD, and He et al. (2018) found that lower SES families in China were more likely to have children with ASD. Still others have found no relation between parental SES and ASD. For example, Sun et al. (2014) found no such relation for 5–10-year-old children in Cambridgeshire, England.
Nevertheless, the preponderance of the evidence suggests a positive association between SES and ASD, at least in the U.S. (e.g., Kelly et al., 2019; Rai et al., 2012). What might give rise to this association? Some researchers, for example, have suggested that the diagnosis of ASD is more common in areas with greater access to pediatric and developmental health care services (e.g., Durkin et al., 2017; King & Bearman, 2011; Thomas et al., 2012). Such a dynamic logically is more pronounced in areas of higher SES where such services are more readily available. Durkin and Imm (2018) suggest that later parental age, which is positively associated with higher SES, is fraught with birth complications and may also predict ASD prevalence. Differences in race also have been related to ASD and to SES, and race also is related to SES at the individual and state level (e.g., Maroco et al., 2025; McCann, 2024). SES may even confound the potential effects of air pollution on ASD (e.g., Hajat et al., 2021). Similarly, it seems that the other purported factors associated with ASD here also are associated with differences in SES, as previously stated. This suggests that SES may be a key factor regarding the development of ASD, and as such it may fully account for, or at least limit, the variance in ASD prevalence that otherwise might be attributable to variables such as health care provider availability, maternal age, race, and air pollution.
The present exploratory research specifically focused on the relation of SES, race, personality, IQ, urbanization, air pollution, availability of health care providers, physician shortage, per pupil spending, PN-3 policy and strategy, percent uninsured, Medicaid-CHIP enrollment, maternal age, prepregnant obesity, and low birth weight to ASD prevalence with the 50 U.S. states as the units of analysis. Suitable state-level measures of each of these variables exist, excluding only genetics from the previously mentioned list of variables demonstrated to be related to both ASD and SES. Considering genetics as a state-level ASD predictor was beyond the scope of the current project.
The ready availability of data for each of the speculated predictors of ASD and SES facilitated the use here of states rather than individuals as the analytic units. However, this choice of analytic level also is necessary to determine which of this array of variables is related to state differences in ASD, and to determine which of these variables are the most viable predictors of these state ASD rates without and with statistical controls. The prediction and potential explanation of such rates in this state-level context are important from a basic and an applied research standpoint. The results of such an analysis may eventually have ramifications for state and federal policies and programs aimed at reducing the prevalence of ASD. As well, the results also may cautiously suggest the relative importance of the predictors regarding individual-level ASD rates.
The Theoretical Framework
The emerging field of geographical psychology (e.g., Rentfrow, 2010, 2014a, 2020; Rentfrow et al., 2008; Rentfrow & Gosling, 2021; Rentfrow & Jokela, 2016) provided the overarching theoretical framework for the present study. Geographical psychology offers a novel “perspective for understanding the ways in which psychological and environmental factors interact” (Rentfrow, 2020, p. 169). It aims “at mapping the spatial organization of psychological phenomena, identifying the mechanisms responsible for their organization, and understanding how individual characteristics, social entities, and physical features of the environment contribute to their organization” (Rentfrow, 2020, p. 165). Geographical psychology also endeavours “to bridge research across areas of psychology and other disciplines” (Rentfrow, 2014b, p. 5) such as social psychology, personality psychology, developmental psychology, biological psychology, health disciplines, epidemiology, and related social sciences “by investigating the spatial organization and geographical representation of psychological phenomena and the mechanisms guiding those processes” (p. 5).
A basic premise of the geographical psychology approach is that a geographic area’s standing on an individual difference dimension relates to the pervasiveness in that area of the psychological and behavioral tendencies associated with that individual difference dimension (e.g., Rentfrow et al., 2008). The perspective recognizes the logical independence of aggregate-level and individual-level relations, that one cannot simply assume the validity of cross-level generalization, and that such generalization ultimately demands at least empirical cross-level corroboration. One must exercise due caution to avoid the “ecological fallacy” (Robinson, 1950) which occurs when one assumes that aggregate-level relations generalize to the individual level, and the “compositional fallacy” (Pettigrew, 1997) which occurs when one assumes that individual-level results generalize to the aggregate level. However, the geographical psychology perspective also grants that judicious use of extrapolative reasoning bolstered by empirical support can draw speculative implications for individual-level functioning from aggregate-level results and vice versa.
Tenets of the geographical psychology framework guided the conceptualization, execution, and reporting of the present research. The variables pertain to the states as the geographic analytic units. However, all the variables ultimately are based on the responses of individuals (i.e., race, Big Five personality, IQ, maternal age) or the estimated experiences of individuals (i.e., ASD rate, SES, urbanization, air pollution, availability of health care providers, physician shortage, education spending per pupil, PN-3 policy and strategy, percent without health insurance, Medicaid-CHIP enrollment, prepregnant obesity percent, and low birth weight). Consequently, all these variables are inherently individual difference variables aggregated at the state level to represent the modal placement of the residents of each state on those variables. The inclusion of these 16 variables is based on existing research literature and its attendant theories. Extant literature also shows that each of the 14 variables other than ASD rates and SES is related to both ASD and SES. Most of those studies are based on individuals as the analytic units. However, although all empirical results obtained from the present state-level analyses apply directly to states rather than to individuals, the speculation is that the obtained pattern of findings stems from similar relations at the level of individuals. In other words, the speculation is that a comparable replication of the current study with individuals as the units of analysis would yield similar results.
The Present Study
Essentially, the current exploratory research determined the capacity of each of 15 variables—SES, race, personality, IQ, urbanization, air pollution, availability of health care providers, physician shortage, per pupil spending, PN-3 policy and strategy, percent uninsured, Medicaid-CHIP enrollment, maternal age, prepregnant obesity, and low birth weight—to predict state ASD prevalence, first without and then with the statistical control of SES. The study utilized Pearson correlation for the first aim and sequential multiple regression for the second. To achieve the second objective, a series of 14 multiple regressions with SES entered on the first step and each of the other 14 variables entered separately on the second step in successive equations to determine their predictive capacities while statistically controlling for SES. In a 15th equation, SES entered on the first step and those variables that emerged as significant predictors with SES controlled in the first 14 equations entered as a block on the second step. In addition, the analysis included multicollinearity and spatial autocorrelation assessment. Moran’s I residual approach (e.g., Anselin, 2003) tested each of the 15 multiple regression equations for the presence of spatial autocorrelation which, if present, potentially could pose challenges to the interpretation of the ordinary least squares multiple regression results.
Method
Measures
The analysis focused on the year 2017. Where possible, the study employed state-level measures based on data from 2017. However, the most suitable measure for personality was based on data collected from 1999 to 2005, and the IQ measure was based on data collected from 2012 to 2019. The urban population variable used the figures from the official 2020 census which only occurs every 10 years. The state air pollution index stemmed from the data obtained in 2015, 2016, and 2017. Researchers collected all the data for the PN-3 policy and strategy variable prior to mid-2020 and for the prepregnant obesity variable in 2016. All of these variables based on years other than 2017 seemed suitable for the present exploratory study.
ASD Rates
Dietz et al. (2020) estimated the prevalence of ASD among adults 18 to 84 years of age in each of the 50 states in 2017 using simulation and Bayesian hierarchical strategies. These percents serve as the state ASD measure in the current study.
SES
A 2017 SES composite was created based on high school graduation or greater, bachelor’s degree or greater, per capita personal income, and percent below the poverty line. U.S. Census Bureau (2025a) provided the percent of those 25 years of age and over with at least high school graduation and the percent of those 25 years of age and over with at least a bachelor’s degree in each state. BEA (2025) provided the per capita personal income for each state. U.S. Census Bureau (2025b) provided the percent in each state of all ages living below the poverty line. Values on the poverty rate variable were reversed (i.e., 100 minus the value) to create an “above poverty line” variable prior to the computation of the SES composite. The standardized results of the sums of the final four variables in z score metric then resulted in an SES composite with a Cronbach alpha reliability of .88.
Race
KFF (2025) provided the White, Black, Hispanic, and Asian population percent in each state in 2017. Using the common outlier threshold of plus or minus 3 standard deviations from the mean, the present analysis adjusted the White percent for Hawaii from 20.7 to 21.2, the Hispanic percent for New Mexico from 49.0 to 43.4, and the Asian percent for Hawaii from 38.2 to 21.1 to minimize potential distortions due to extreme values in relations involving race.
The race variable for the present study contained the predicted state scores based on a preliminary multiple regression equation with state ASD rates as the criterion and each of the four race variables entered simultaneously. The four race variables jointly accounted for 45.3% of the variance in ASD rates, F (4, 45) = 9.31, p < .001. The significant standardized regression coefficients (βs) were 1.55 (p < .001) for White, .52 (p < .01) for Black, .96 (p < .001) for Hispanic, and 1.06 (p < .001) for Asian population percent. Multiplying a standardized form of the ASD rate variable by each of these respective βs and computing the sum provided the race predictor profile variable that served as the single race variable in the current research.
Big Five Personality
Rentfrow et al. (2008) provided state Big Five personality z-scores for openness to experience, conscientiousness, extraversion, agreeableness, and neuroticism based on the responses of 619,397 residents to the 44-item Big Five Inventory (John & Srivastava, 1999) in an internet survey from December of 1999 to January of 2005 in all 50 states and the District of Columbia. The developers showed that the proportions of respondents reflected state census figures. They also generally reflected the American population, but somewhat less so for those in the upper and lower classes. Respondents also were younger. Each personality variable had a high mean inter-subsample correlation based on three random subsamples and a high temporal reliability based on two subsamples. Each also had a high congruence coefficient between state-level and individual-level factor structure. Cronbach alphas showed mean reliability values of .81 at the individual level and .89 at the state level across the five personality dimensions. In addition, Elleman et al. (2018) examined data from 1999 to 2015 and demonstrated that such state scores exhibited temporal stability and consistent relations to sociodemographic variables.
The Big Five personality variable for the present research contained the predicted state scores based on a preliminary multiple regression equation with state ASD rates as the criterion and each of the five personality variables entered as a block. The five personality variables together accounted for 28.5% of the ASD rate variance, F (5, 44) = 3.51, p < .01. The βs were .52 (p < .01) for openness to experience, −.49 (p < .05) for conscientiousness, .46 (p < .05) for extraversion, −.11 (p = .570) for agreeableness, and −.22 (p = .110) for neuroticism. Multiplying a standardized form of the ASD rate variable by each of the three significant βs (i.e., for openness to experience, conscientiousness, and extraversion) and computing the sum provided the personality predictor profile variable that served as the sole personality variable in main analyses of the current study.
IQ
This study uses state “IQ” estimates developed by Pesta (2022). They were derived from a combination of state-level results from the standardized reading and math tests administered to public school children in Grade 4 and Grade 8 by the National Assessment of Educational Progress (NAEP) and the adult literacy and numeracy scores from the Program for the International Assessment of Adult Competencies (PIAAC). NAEP scores were based on 2015, 2017, and 2019. PIAAC scores were based on data for nationally representative household samples 16 to 64 years of age from the years 2012 to 2017. The final state IQ scores were “derived by taking the mean of the derived PIAAC and NAEP IQ scores” (Pesta, 2022, p. 3).
Urban Percent
Dickert (2023) supplied the percent of the population in each state classified as urban in 2020 by the U.S. Census Bureau. The government only takes the census every 10 years.
Air Pollution
AHR (2018) provided air pollution values for each state based on the means for 2015, 2016, and 2017. The values pertain to the average public exposure of the general population to particulate matter 2.5 microns or less in magnitude expressed as micrograms per cubic meter.
Health Care Providers
AHR (2018) provided the number of mental health providers and the number of primary care physicians per 100,000 population in each state in 2017. ABP (2018) provided the number of certified pediatric diplomates including subspecialists per 100,000 children in each state in 2017. A composite health provider variable resulted from standardizing each of these three variables, summing the three transformed variables, and then standardizing the result. This composite has a Cronbach alpha reliability of .80.
Physician Shortage
The present study uses a physician shortage ratio for each state for 2017 developed by Zhang et al. (2020). It is based on physician demand minus physician supply divided by total population and multiplied by 105 to create physician shortage ratios that range from −183 in Massachusetts to 85 in Mississippi.
Per Pupil Spending
Maciag (2019) displayed per pupil spending on education by each state in 2017. The data for the variable included non-personnel expenses. It constituted a composite of spending for instructional and support services.
PN-3 Policy and Strategy
Based on data collected before mid-2020, the Prenatal-to-3 Policy Impact Center of the LBJ School of Public Affairs at the University of Texas at Austin released a report detailing to what degree each state had adopted and implemented policies and implemented strategies to create and sustain a robust and equitable prenatal-to-3 system of care (Prenatal-to-3, 2020). The present study used the sum of the 0-5 policy evaluation scores and 0-6 strategy evaluation scores to create a comprehensive value for each state on this PN-3 policy and strategy variable. California was at the top with 8 points, while Florida, Mississippi, and Wyoming were at the bottom with 0 points.
Percent Uninsured
AHR (2018) provided the percent who did not have health insurance in each state in 2017.
Medicaid-CHIP Enrollment
Medicaid (2026) furnished the percent of the population in each state in 2017 that was enrolled in either Medicaid or CHIP. Under a partnership between the state and the federal government, both Medicaid and CHIP (i.e., Children’s Health Insurance Program) provide free or low-cost health coverage—Medicaid to children and adults living in poverty and CHIP to children who are not eligible for Medicaid but still are not able to have health insurance through a family plan.
Maternal Age Ratio
Martin et al. (2018) provided information on which to base the maternal age ratio variable. They tabled data showing the birth rates per 1,000 mothers in each state in 2017 who were aged 20 to 24 years, 25 to 29 years, 35 to 39 years, and 40 to 44 years. The maternal age ratio variable was the mean of the birth rates for those aged 35 to 39 and 40 to 44 in each state, divided by the mean of the birth rates for those aged 20 to 24 and 25 to 29 in each state. Therefore, a higher maternal age ratio indicated the degree to which birth rates for mothers aged 35 to 44 exceeded birth rates for mothers aged 20 to 29.
Prepregnant Obesity
Driscoll and Gregory (2020) furnished the prepregnant obesity data for each state in 2016 used in the current study.
Low Birth Weight
CDC (2025) provided the percentage of babies born in each state with a low birth weight in 2017.
Results
Descriptive Statistics and Pearson Correlations
Descriptive Statistics

Pearson Correlations
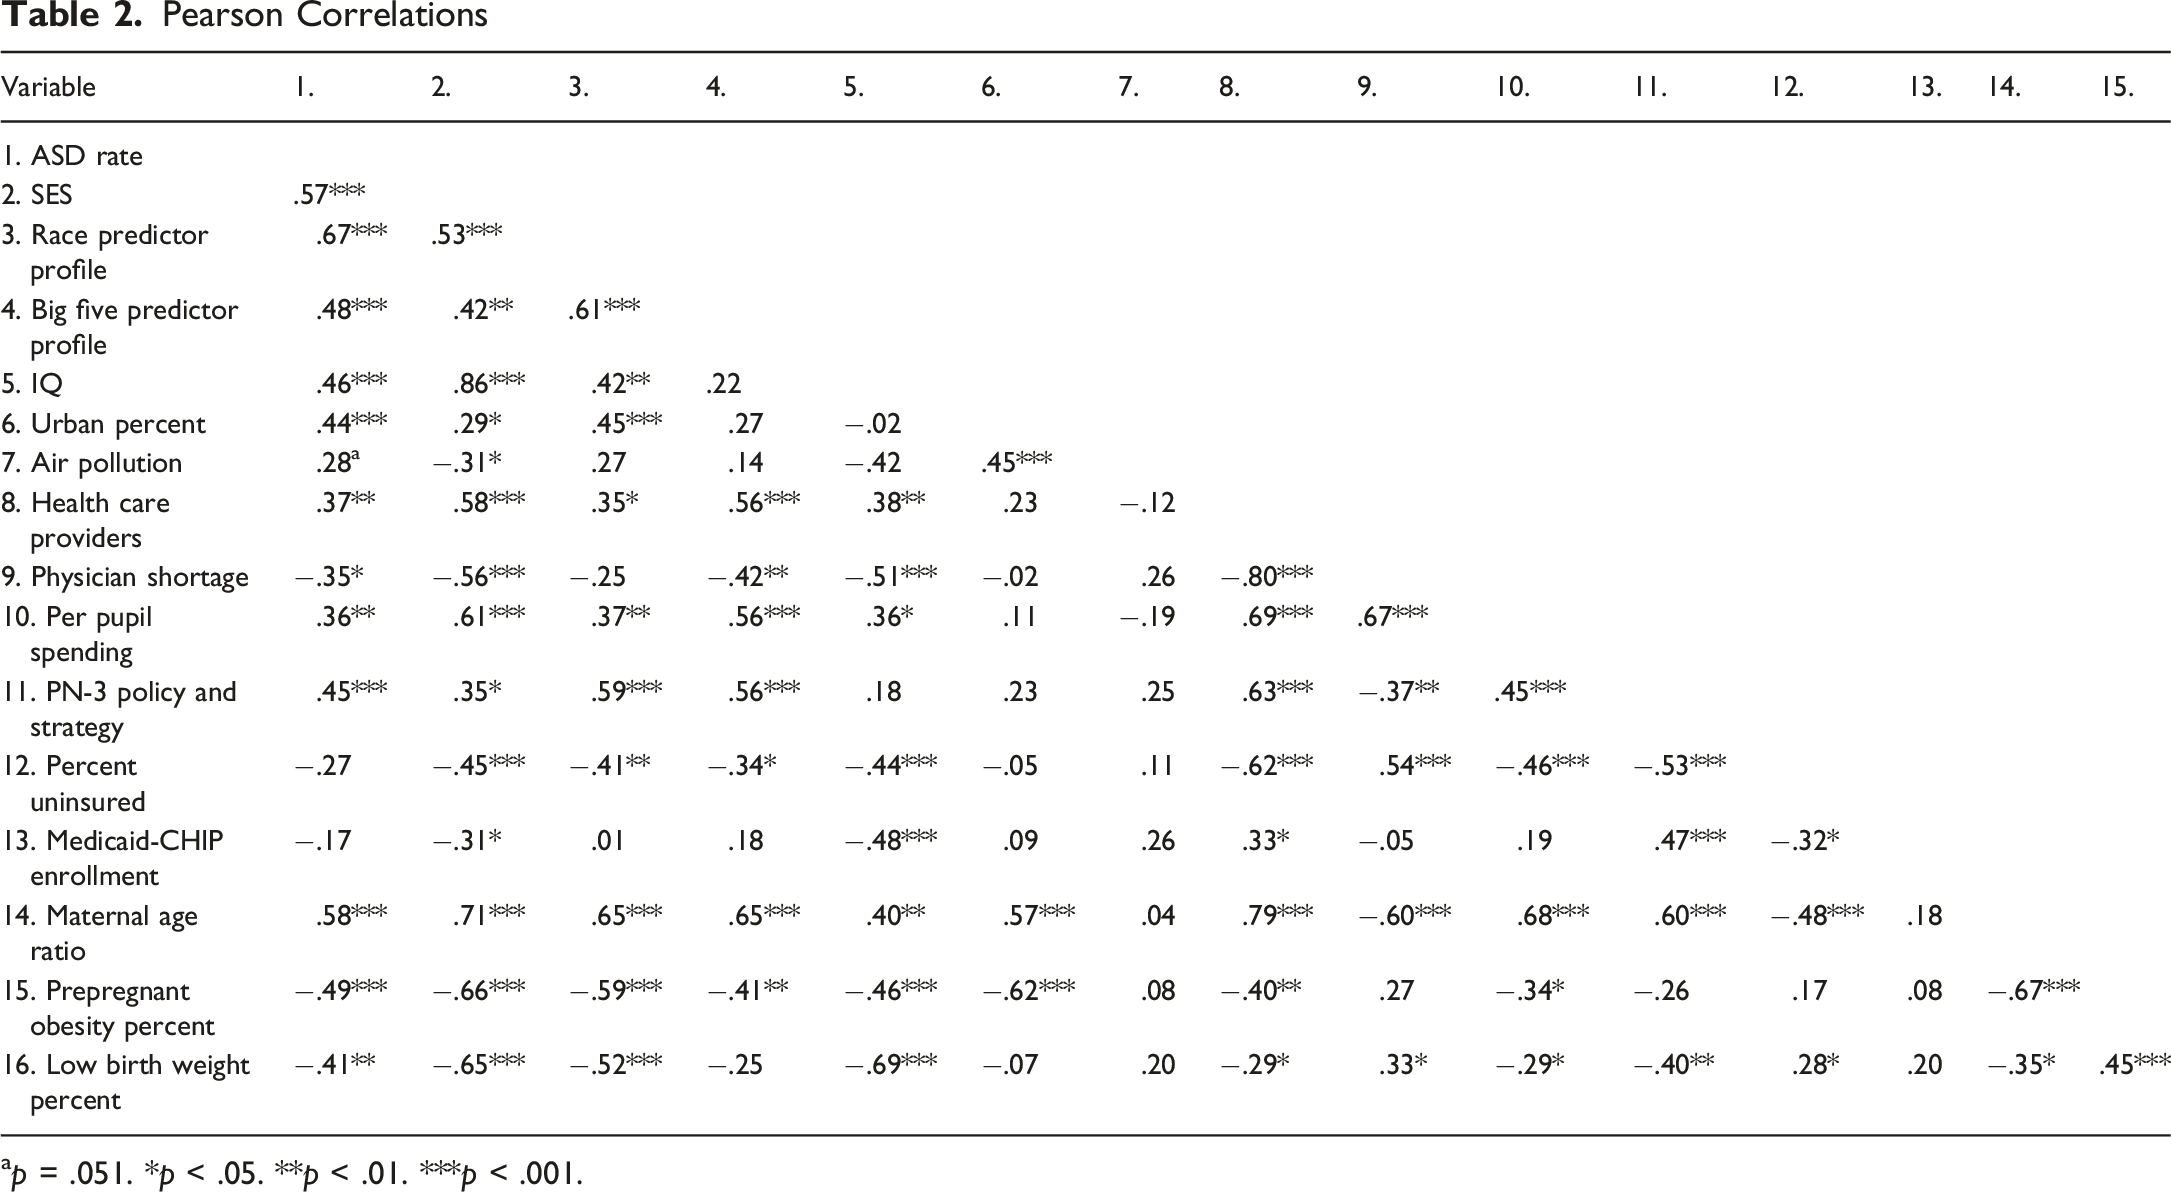
ap = .051. *p < .05. **p < .01. ***p < .001.
Multiple Regressions
Multiple Regression Equations Predicting U.S. State ASD Rates With SES Controlled
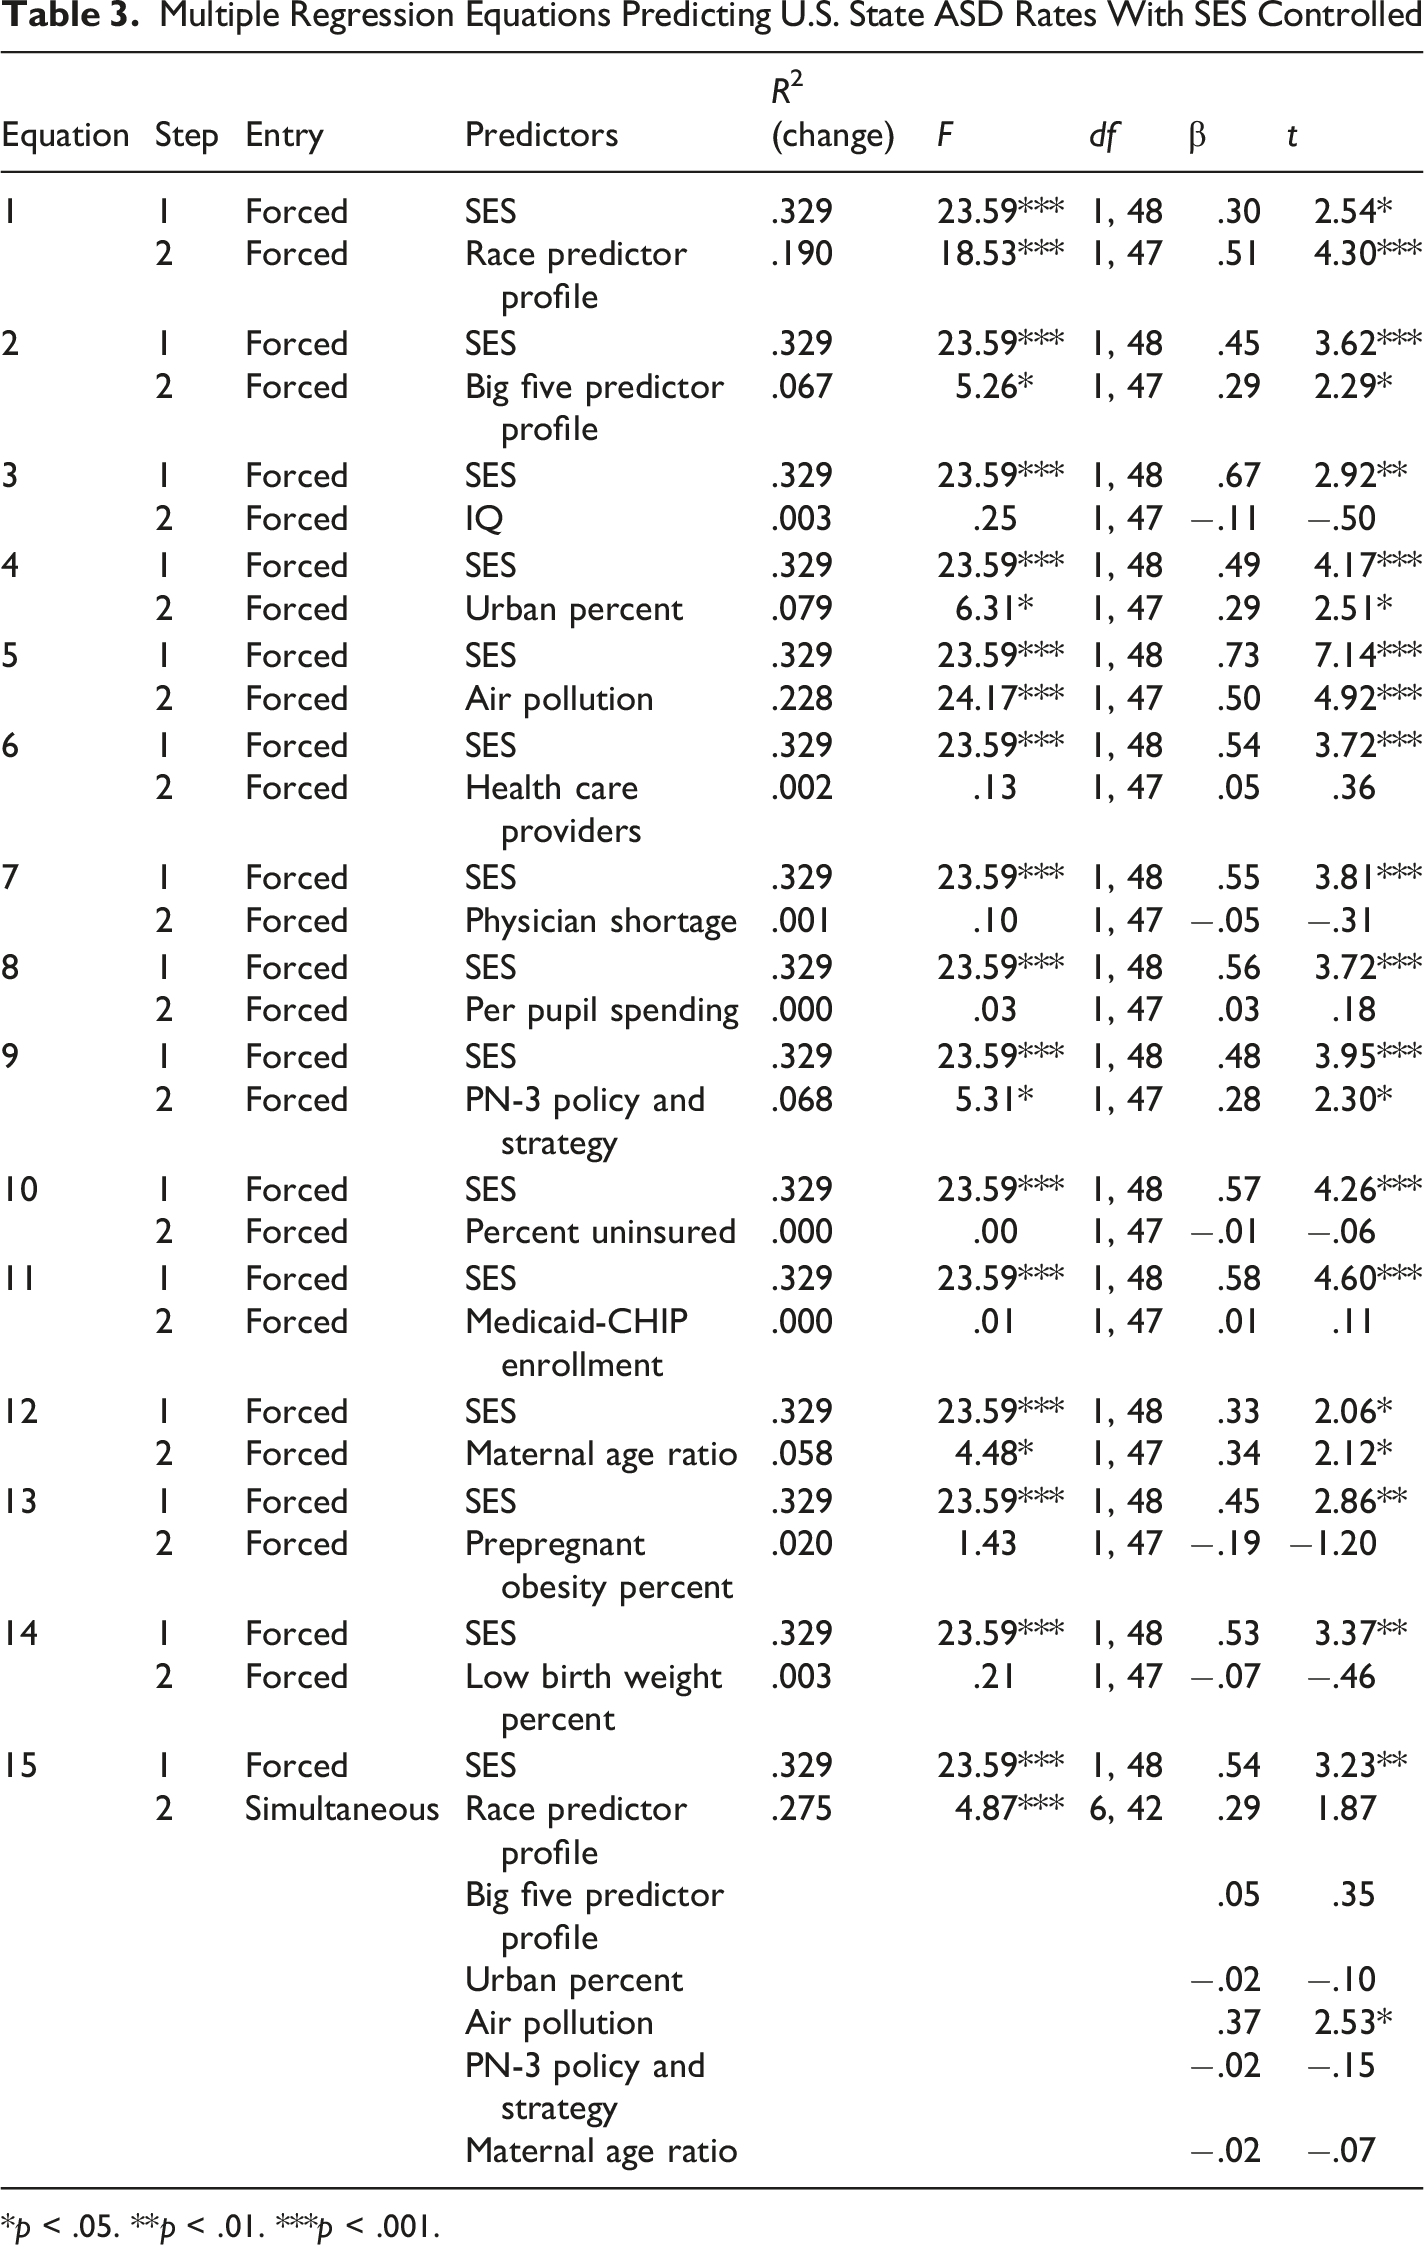
*p < .05. **p < .01. ***p < .001.
Multicollinearity and Spatial Autocorrelation
Having 15 potential predictors suggests that multicollinearity problems might arise. However, this was not the case in the present study. VIFs for the 15 equations ranged from 1.09 to 4.98. These values are well below the standard threshold of 10 and even below the more conservative threshold of 5.
Structured spatial variation on variables violates the standard assumption of independence of residuals in multiple regression. Similar or dissimilar values that cluster spatially can produce biased regression coefficients and probability values. Therefore, Moran’s I test for detecting spatial autocorrelation in residuals (e.g., Anselin, 2003) screened each of the 15 multiple regression equations in Table 3. The test using the R spdep package (R Project, 2022) required the exclusion of Alaska and Hawaii to create a 48 x 48 Queen’s binary neighborhood matrix which signified each state that touched another at any point as a neighbor. The R analysis also used standardized scores for each variable based on the 48 included contiguous states, and simultaneous entry of the variables in each regression equation. The key indicator, Moran’s I statistic standard deviate, did not attain statistical significance in any of the 15 multiple regression equations computed on the 48 states. It ranged from −1.66 in equation (1) to .76 in equation (7). Probability values were far from being statistically significant, ranging from .22 in equation (7) to .95 in equation (1). These results demonstrate that spatial autocorrelation was not problematic for the combinations of variables in any of the 15 equations in Table 3.
Supplementary Exploratory Analysis
It is important to demonstrate that the results found in the present study are specific to ASD and are not likely to hold as well for other clinical conditions. An initial test of this proposition compared the correlations of Attention-Deficit/Hyperactivity Disorder (ADHD) with the 15 potential predictors to those found here for ASD. Danielson et al. (2022) provided the “state-level estimates of the prevalence of parent-reported ADHD diagnosis and treatment among U.S. children and adolescents” (p. 1685) for the period from 2016 to 2019. This supplementary exploratory analysis used these estimates as being indicative of the prevalence of ADHD in 2017.
Pearson Correlations of ADHD Rate and ASD Rate
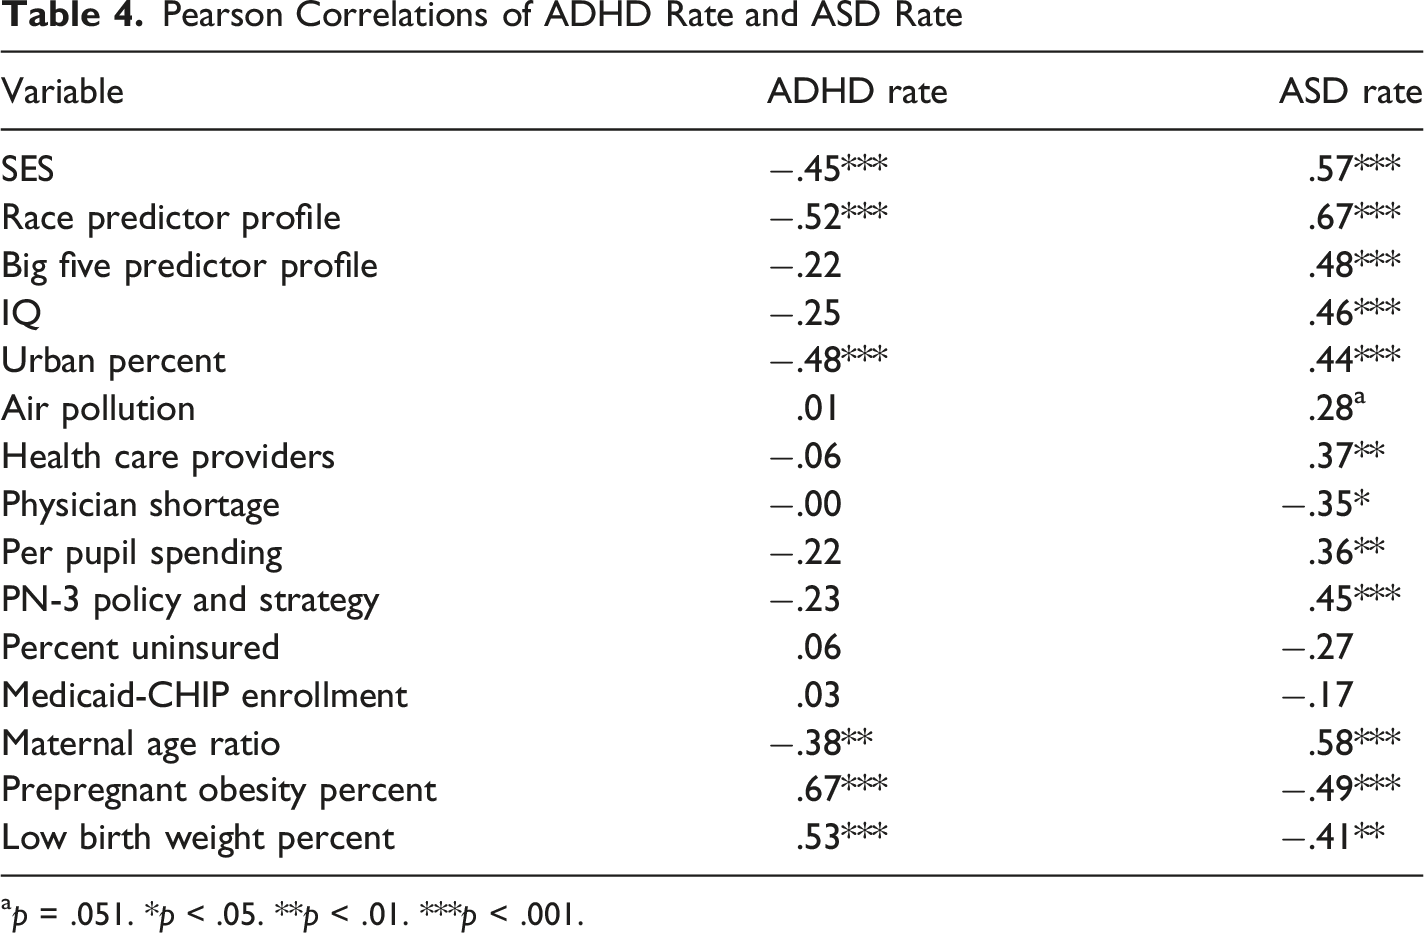
ap = .051. *p < .05. **p < .01. ***p < .001.
Discussion
SES clearly demonstrated its importance as a potent predictor of state ASD prevalence rates. Pearson correlations indicated that state SES, the race predictor profile, the Big Five personality predictor profile, IQ, urban population percent, number of health providers, per pupil spending. PN-3 policy and strategy, and maternal age ratio significantly correlated in a positive direction with ASD rates. Air pollution also did so at the marginal .051 level. As well, Pearson correlations showed that physician shortage, prepregnant obesity percent, and low birth weight percent significantly correlated in a negative direction with ASD rates. However, in multiple regression equations with SES entered first and each of the 14 other potential predictors entered alone on the second step to form a series of 2-variable equations, only the race predictor profile, the Big Five personality predictor profile, urban population percent, air pollution, PN-3 policy and strategy, and maternal age ratio retained significant predictive capacity. When these six variables entered an equation simultaneously on the second step, only SES and air pollution emerged as significant independent predictors. With only SES entered first and air pollution entered second in equation (5) in Table 3, SES accounted for 32.9% of the state ASD rate variance, air pollution accounted for another 22.8%, and the significant βs were .73 for SES and .50 for air pollution.
Pearson correlations showed that the present state-level relations of ASD to SES, IQ, urban population percent, air pollution, number of health care providers, physician shortage, per pupil spending, PN-3 policy and strategy, and maternal age are statistically significant, or extremely close to being significant in the case of air pollution (p = .051), and in the same direction as those more commonly found in individual-level research (e.g., Durkin et al., 2017; Gardner et al., 2020; Holland et al., 2026; Lam et al., 2016; Lauritsen et al., 2014; Malik-Soni et al., 2022; Mazumdar et al., 2013; Powers & Uhing, 2023; Wu et al., 2017).
The state-level correlations of ASD to the race and personality predictor profile variables were significant and positive, but one must view those results in the context of the individual relations that went into the construction of the two profile variables. The race predictor profile variable contained the predicted state scores based on a preliminary multiple regression equation with state ASD rates as the criterion and each of the four race variables entered simultaneously. The significant βs were 1.55 for White, .52 for Black, .96 for Hispanic, and 1.06 for Asian population percent. Multiplying standardized ASD rates by each of these respective βs and computing the sum produced the race predictor profile variable. Clearly, when considered together, each of the four race variables showed a significant independent relation to ASD rates. However, the only one of the four race variables to have a significant Pearson correlation with ASD rates was the Asian population percent (r = .32). It is important to recognize that the present study examines the percent of each state population that is White, Black, Hispanic, and Asian as the potential predictors of state ADS rates. This is not directly comparable to the percent of Whites, Blacks, Hispanics, and Asians diagnosed as having ASD using individuals as the analytic units. Regarding race, researchers have reported individual-level results showing that ASD is more associated with being non-White (e.g., Strassfield et al., 2023), being Asian (e.g., Thomas et al., 2012), and being Black (e.g., Nevison & Zahorodny, 2019), while ASD is less associated with being Hispanic (e.g., Kim et al., 2025).
Similarly, the Big Five personality predictor profile variable contained the predicted state scores based on a preliminary multiple regression equation with state ASD rates as the criterion and each of the five personality variables entered simultaneously. The significant βs were .52 for openness to experience, −.49 for conscientiousness, and .46 for extraversion. Multiplying standardized ASD rates by each of these respective βs and computing the sum produced the personality predictor profile variable. Clearly, when considered together, each of the three personality variables showed a significant independent relation to ASD rates. However, none of the three personality variables exhibited a significant Pearson correlation with ASD rates. Again, it is crucial to recognize that the present study uses variables based on the central tendency of the distribution of the five personality variables in each state as the potential predictors of state ADS rates. This may not be comparable to the individual-level relations of Big Five personality scores to ASD rates among the same individuals. In the present research, none of the five Pearson correlations with state ASD rates attained statistical significance. The nonsignificant correlations were all in the negative direction except for openness to experience which was in the positive direction. In contrast, individual level research reports significant negative correlations for openness to experience, conscientiousness, extraversion, and agreeableness, and significant positive and negative correlations for neuroticism (e.g., Lodi-Smith et al., 2019; Schwartzman et al., 2016).
Contrary to expectation, Pearson correlations of prepregnant obesity and low birth weight to ASD were significant but in the negative direction rather than the positive direction usually found in individual-level studies (e.g., Lampi et al., 2012; Li et al., 2016; Suren et al., 2014; Talmi et al., 2020). Negative correlations between ASD rates and prepregnant obesity and low birth weight were even higher. However, exploratory partial correlations controlling for SES reduced the two correlations to nonsignificant levels, but the direction still was negative. Reasons for these state-level failures to support comparable individual-level relations remain unknown. Also, somewhat contrary to expectation, the correlation of lack of health insurance to state ASD rates were negative but nonsignificant. Researchers have reported that not having health insurance decreases the chances of an ASD diagnosis (e.g., Mandell et al., 2016). The correlation between ASD rates and Medicaid-CHIP enrollment also was negative and nonsignificant. Previous research promoted the anticipation of a positive and significant correlation (e.g., Semansky et al., 2011). Why current results for these two variables did not fully support prior findings is not known.
The specific measure of air pollution used in the present study (i.e., particulate matter 2.5 microns or less in magnitude) was an independent predictor of state ASD prevalence with SES controlled. Although its positive Pearson correlation with ASD only closely approached significance (p = .051) with a two-tailed test, air pollution did have a significant negative correlation with SES. Similarly, previous research based on selected U.S. areas has shown that such air pollution is positively related to ASD (e.g., Lam et al., 2016; Volk et al., 2013) and negatively related to SES (e.g., Boring et al., 2022; Do & Zhang, 2025). In the present study, except for SES and the race predictor profile variable, air pollution’s β of .50 was larger than any of the other verified or potential predictors of ASD prevalence in the 2-predictor multiple regression equations in Table 3. Furthermore, with only SES and air pollution in the 2-predictor equation, the SES β attained its greatest size, .73. As well, the similarly sized race β of .51 in equation (1) in Table 3 was nonsignificant in the multi-predictor equation (15). These results underscore the importance of considering both SES and air pollution as potential predictors or statistical controls in any analysis of contributing factors to the development of ASD.
At root, the present study constitutes a multivariable exploration of selected potential predictors of state ASD rates. The array of variables chosen for analysis was not based on claims of systematic selection or that the array was exhaustive in this context. Fundamentally, readers should interpret the results of the multiple regression equations primarily in a predictive rather than an explanatory fashion. Given the 15 potential predictor variables, it is quite clear that if one considers SES as the core predictor, then the only other variables that can supplement predictive capacity when added alone with SES statistically controlled are race, personality, urban population percent, air pollution, PN-3 policy and strategy, and maternal age. Furthermore, with SES controlled and these six variables entered simultaneously in an equation, it appears that only air pollution can increase the variance in state ASD prevalence beyond that already accounted for by SES.
Whether the present pattern of results in whole or in part also may pertain to the prevalence of ASD with individuals as the analytic units is not ascertainable without additional replicative individual-level research. Although similar relational dynamics might apply at the individual level, it is inadvisable to simply assume that such extrapolation across these two levels of analysis is valid (e.g., Pettigrew, 1997; Robinson, 1950). Nevertheless, a basic tenet of geographical psychology (e.g., Rentfrow, 2014a; Rentfrow et al., 2008; Rentfrow & Gosling, 2021; Rentfrow & Jokela, 2016) holds that a geographic locale’s modal standing on a variable fundamentally based on individual-level data is related to the tendencies associated with that dimension at the individual level. Therefore, the geographical psychology approach suggests the expectation of such cross-level extrapolation in this research context.
Among the Pearson correlates of state ASD prevalence, maternal age ratio perhaps warrants special attention. As Bui and Miller (2018) have demonstrated, in the U.S. between 1980 and 2016, each mother age between 14 and 25 has seen a decrease in first-time births while each mother age between 26 and 44 has seen an increase in first-time births. Bui and Miller attribute these changes largely to SES, especially the heightened educational attainment of mothers, and to increases in urban living.
This information prompted a hitherto unreported supplementary exploration regarding the relations between ASD rates, maternal age ratio, SES, and urban population percent in the present study. Simultaneously controlling only for SES and urban population yielded a nonsignificant partial correlation of only .14 compared to the Pearson correlation of 58. Therefore, it is evident that the correlation between maternal age ratio and ASD prevalence indeed may be dependent upon state differences in SES and urban population percent. In another supplementary analysis, 14 2-variable equations with maternal age ratio entered on the first step and each of the other 14 potential predictors entered alone on the second step yielded only SES, race, IQ, air pollution, and Medicaid-CHIP enrollment as significant second predictors of state ASD prevalence. These supplementary analyses indicate the importance of maternal age in this context and strongly suggest that researchers should direct more effort toward uncovering the part played by this variable regarding the development of ASD.
It also is quite conceivable that paternal age also may have been a significant predictor of state ASD rates if the study had included it in the predictor pool. Higher paternal age has been associated with increased risk of ASD in individual-level studies (e.g., Quinlan et al., 2015; Wu et al., 2017). Researchers most often point to biological factors that are probably at the root of this relation. Some suggest that spontaneous sperm mutations resulting from cell division results in higher chances of the transmission of DNA errors to offspring (e.g., Reichenberg et al., 2006). Others suggest that epigenetic modifications resulting from differences in the sperm of older fathers may influence gene expression during the development of the embryo (e.g., Casella et al., 2025), and that the biological clock can diminish semen quality that can lead to a greater chance of genetic abnormalities such as ASD (e.g., Motluk, 2023). Unfortunately, a state-level measure of paternal age suitable for the present research could not be located.
Knowing the degree to which these relational dynamics involving maternal age, urban population percent, and SES may underly the increase in ASD in recent decades, and the extent to which these relations have the capacity to predict state differences in ASD prevalence over time, must await the findings of future research. Of course, these specific dynamics, and for that matter all of the relations found in the present study, assume that the presence of ASD and such shifts in ASD prevalence over time reflect real changes in the number of ASD cases and do not stem largely from a greater awareness of ASD among both professionals and parents, a wider definition of what constitutes ASD, and improved diagnostics (e.g., Robinson & Gassner, 2023). To strengthen confidence in the results of studies on the predictors, and perhaps eventually the causal factors involved in the genesis of ASD, one cannot overstate the necessity of further research to empirically resolve this fundamental controversy.
The reported supplementary analysis also briefly explored the issue of whether the results of the present study are likely to be specific to ASD or to also apply in blanket fashion to other clinical conditions. ADHD was the initial comparison disorder tested here, operationally defined as the “state-level estimates of the prevalence of parent-reported ADHD diagnosis and treatment among U.S. children and adolescents” (Danielson et al., 2022, p. 1685) for the period from 2016 to 2019. The correlational pattern between ADHD and the 15 potential predictors was quite different from the one obtained for ASD. ADHD rates correlated negatively with ASD rates, and in the opposite direction with the other 15 potential predictors compared to the correlations for ASD. Obviously, the correlation patterns found in the present study do not also apply to ADHD. It is possible that some other clinical condition such as anxiety, depression or developmental delay might show a pattern close to the one for ASD, but whether that is true or not is dependent upon further research.
Limitations and Issues
Of course, the common warning to refrain from drawing causal inferences from correlational analysis based on a cross-sectional research design must apply here. Variables such as SES, air pollution, and maternal age ratio might indeed have causal connections to the development of ASD. However, nothing in the present results can serve as direct evidence of such causality. The existence of reverse direction from ASD to any of the predictors employed in the present research—either correlational or causal—seems unlikely but is possible. As well, unknown third-variable explanations always remain possible. Nevertheless, it is extremely important that readers avoid misconstruing the current findings as direct evidence of causal relations between the predictors and the prevalence of ASD.
Some readers might perceive the relatively low sample size of 50 as somewhat inadequate, especially for multiple regression. However, the study is unusual because the sample and the population are the same—the 50 U.S. states. Therefore, the parameters and the relations found for the sample must also pertain to the population. Consequently, risks of regression weights from a small sample not being accurate estimates for the population do not apply. The isometric nature of the sample and the population also means that confidence intervals are logically inapplicable. Also, readers should be aware of the successful use of multiple regression strategies similarly small samples in various other studies (e.g., Barber, 2015; McCann, 1997, 2008; Simonton, 2006).
One also should exercise prudence regarding the magnitude of relations found in the present study. Aggregation tends to cancel out measurement errors, producing relations between variables that are often larger than those based on the individual cases that are used to create the aggregates (e.g., Erikson et al., 1993; Ostroff, 1993). This tendency to stronger relations applies, for example, to correlations, to variance accounted for in a criterion, to regression coefficients, and to higher chances of statistical significance.
Concern also might exist for some regarding the fact that while most of the variables were based on 2017 data, state IQ estimates were based on data from 2012 to 2019, and state Big Five personality scores were based on data collected from 1999 to 2005. However, such concerns should be allayed in large part because IQ and Big Five personality are considered to be quite stable over time and place (e.g., Deary, 2014; Elleman et al., 2018; Pesta, 2022). Also, urban population was based on 2020, air pollution was based on 2015, 2016, and 2017, PN-3 policy and strategy pertained to data collected up to mid-2020, and the prepregnant obesity data was collected in 2016. All of these variables were judged adequate for the purposes of the present study.
The lack of sample congruence on which the array of variables in the study are based also should not merit excessive concern regarding the integrity of the results. If the state-level relations stem from individual-level relations as speculated, then such sample incongruence should serve to diminish the chances of statistically significant state-level relations. But the study did produce significant relations. Therefore, such findings obtained despite sample incongruence should foster even greater confidence in the results pattern.
Some readers may have some concern about the exclusion of certain persons from the state samples of respondents whose data formed the basis for the Rentfrow et al. (2008) state Big Five scores. For example, it is especially unlikely that those with Intellectual Disability Disorder (IDD) served as online respondents to the Big Five personality assessments. However, although IDD revolves around intellectual deficits while ASD revolves around social communication deficits, IDD often coexists with ASD (e.g., Srivastava & Schwartz, 2014; Thurm et al., 2019). However, the major importance of including the personality dimensions in the present study lies not in how those with ASD might differ according to personality, but in how the parents of those with ASD might differ. Therefore, from this perspective, whether those with IDD may have been largely absent from the state respondent samples is not such a valid concern when the dependent variable of interest is state ASD prevalence.
Readers also should note that with 15 potential predictors there is a strong possibility of the existence of interactions between variables in relation to ASD rates. It also is possible that adding another variable or variables to a multiple regression equation might have a modification effect. However, the choosing of such interactions and other moderating effects would have to be based on sound theoretical rationale. The sheer number of potential first order and higher order interactions that might exist is rather overwhelming, as is the number of possibilities to include other variables that might have a moderating effect on the predictive capacities of the other predictors involved. A “shotgun” exploratory approach to their existence would present numerous and serious interpretational issues. To give the required attention to any potential interactions or moderating effects among the predictors was well beyond the scope of the present exploratory study.
Future Research
The present state-level results are important within their own context. However, as alluded to earlier in this article, researchers should replicate some or all aspects of the present study with individuals as the analytic units. Such multivariable analyses could provide cross-level validation for the present findings and further our understanding of how results at the individual level of analysis may form the foundation for the current state-level results.
Researchers also should dedicate further analysis at the state and the individual level to examination of the role of maternal age as a predictor and perhaps as a speculated causal factor regarding the development of ASD. The maternal age ratio variable had the second highest Pearson correlation (.58) of any of the 15 potential predictors of state ASD prevalence in the current study. Only the correlation of the race predictor profile (.67) exceeded it. Maternal age also was highly correlated (.71) with SES. Bui and Miller (2018) also have shown that maternal age has increased substantially over the last few decades, a change that they attribute largely to elevations in standard of living—especially the heightened educational attainment of mothers—and to the concurrent increases in the tendency to dwell in urban settings.
Arguably, one of the most pressing contemporary issues for future research concerns the reasons why there has been a rather dramatic increase in cases of ASD in recent years. Studies up to and including the present one generally assume that ASD rates and their recent increases are based on real shifts in the frequency of ASD and do not simply stem from an expanded definition of what constitutes ASD, on greater professional and parental awareness of the indicators of ASD, and on better diagnostic procedures (e.g., Robinson & Gassner, 2023). To bolster confidence in the results of studies on the predictors of ASD, the temporal changes in the occurrence of ASD, and perhaps the causal factors involved in the genesis of ASD, researchers must empirically resolve this basic controversy.
Potential Applied Implications
The present study mainly makes a basic research contribution in that it furthers our understanding of the relative predictive capacity of an array of 15 potential predictors of U.S. state ASD prevalence rates. Not initiated as an applied research project, the results can, at most, only afford speculative implications for application. Ultimately, with appropriate statistical controls, a multiple regression equation, equation (15) in Table 3, showed that only SES and air pollution independently accounted for variance in state ASD rates.
Because of the cross-sectional nature of the study, one cannot draw causal inferences from the results. Nevertheless, such causal connections between SES and ASD, probably of a distal nature, and between air pollution and ASD, probably of a more proximal nature, indeed might exist. Therefore, one may speculate that efforts to improve SES might result in a decrease in the development of ASD, and that this lowering of ASD cases might occur through the lowering of more proximal ASD risk factors such as increasing efforts to improve PN-3 policies and strategies and increase the number of health care providers that seem to fall to some degree under the SES umbrella. One also may speculate that successful reduction of air pollution, more specifically particulate matter 2.5 microns or less in magnitude, might also lead to a decrease in the prevalence of ASD. Of course, the realization of these speculated potential applied outcomes is not possible without more applied research and an extended period in which to bring about the required structural changes and wait for the expected benefits to accrue—assuming that a collective will for such modification were to exist and prevail.
Conclusion
Based on previously reported individual-level relations of SES, race, personality, IQ, urbanization, air pollution, availability of health care providers, physician shortage, per pupil educational spending, PN-3 policy and strategy, percent without health care insurance, Medicaid-CHIP enrollment, maternal age, prepregnant obesity, and low birth weight to the development of ASD, the present study determined the relations of these variables to ASD prevalence using the 50 U.S. states as the analytic units. Significant Pearson correlations were in the same direction as the reported individual-level correlations for SES, race, personality, IQ, urbanization, air pollution (p = .051), availability of health care providers, physician shortage, per pupil educational spending, PN-3 policy and strategy, and maternal age, but were in the opposite direction for prepregnant obesity and low birth weight, and negative and nonsignificant for percent uninsured and Medicaid-CHIP enrollment.
With SES statistically controlled in multiple regression equations with two predictors, only race, personality, urbanization, air pollution, PN-3 policy and strategy, and maternal age showed any evidence of relation to state ASD prevalence. Furthermore, with SES controlled on an initial multiple regression step and these six predictors entered simultaneously, only SES and air pollution emerged as significant predictors. Together, SES and air pollution accounted for 55.7% of the variance in state ASD prevalence rates.
These results emphasize the importance of considering both SES and air pollution as potential predictors or statistical controls in any analysis of contributing factors to the prevalence of ASD with aggregates such as states or with individuals as the units of analysis. Furthermore, although the current study is cross-sectional, and hence non-causal in nature, one also may cautiously speculate that at least some of the current findings might have potential causal elements that may deserve concerted attention in future research. However, readers also must fully appreciate that, although this cross-sectional correlational study provides much information that may be useful regarding an understanding of the prevalence of ASD, it is highly exploratory in conception and execution. The current findings clearly suggest the need for further research on various paths at both the aggregate and the individual levels.
Footnotes
Ethical Consideration
This article does not contain any studies with human participants performed by the author(s) and therefore did not require IRB approval.
Consent to Participate
Informed consent to participate was not applicable for this study.
Funding
The author received no financial support for the research, authorship, and/or publication of this article.
Declaration of Conflicting Interests
The author declared no potential conflicts of interest with respect to the research, authorship, and/or publication of this article.
Data Availability Statement
The data are openly available at https://doi.org/10.17605/OSF.IO/PGYH3 (McCann, 2026).
Ethical Standards
The corresponding author states all ethical standards have been followed.