




Abstract
This study examined the internal consistency, overall mean scores, and response patterns of 485 American adults, including 92 who identified as people with disabilities, on the Suicidal Behavior Questionnaire–Revised (SBQ-R). The measure demonstrated acceptable internal consistency in both groups. Participants with disabilities had higher mean total scores as well as more concerning response patterns on SBQ-R items assessing suicide attempts, plans, recent suicidal ideation, and perceived likelihood of future suicide attempts.
Suicide is the 10th leading cause of death in the United States, with over 44,000 deaths attributed to suicide in 2015 (Drapeau & McIntosh, 2016). The American Foundation for Suicide Prevention (AFSP, 2015a) estimated that there are at least 25 suicide attempts for every death by suicide (see also Drapeau & McIntosh, 2016). More broadly, the Centers for Disease Control and Prevention (2015) reported that 9.3% of American adults reported having thoughts of suicide over the past year, with 2.5% making a suicide plan.
The U.S. suicide rate has also been increasing over the past 15 years from 10.5 deaths by suicide per 100,000 Americans in 1999 to 13.5 deaths per suicide per 100,000 Americans in 2014 (Curtin, Warner, & Hedegaard, 2016). This represents an increase of 24% (Curtin et al., 2016). Furthermore, the suicide rate climbed more markedly from 2006 to 2014 than from 1999 to 2006, suggesting suicide is becoming more, not less, of an issue over time.
One important component of suicide research has been to identify groups that are at particularly high risk for suicidality, and a growing body of research has consistently found that people with disabilities experience increased rates of suicidality when compared with the general population. This has generally held true across disability groups, including multiple sclerosis (Pompili et al., 2012), spinal cord injury (Giannini et al., 2010), Huntington’s disease (Wetzel et al., 2011), autism spectrum disorders (Segers & Rawana, 2014), epilepsy (Scott et al., 2010), heart attack and stroke (Scott et al., 2010), and physical disabilities that result in chronic pain (Fishbain et al., 2012). There has been some research that also suggests that people with psychiatric disabilities may be somewhat, although, not entirely, inflating the rates of suicidality in people with disabilities as a broadly defined group (Dennis et al., 2009; Lund, Nadorff, & Seader, 2016). However, other research (Scott et al., 2010) has found that controlling for mental health conditions does not significantly impact the relative risk for suicidal ideation or attempts among those with physical health conditions. This provokes the question of whether or by how much excluding or including individuals with either comorbid or exclusive psychiatric disabilities from comparative subsamples may affect the prevalence of suicidality reported.
Measuring Suicidality
A key consideration when discussing methods of measuring, reporting, and comparing suicidality is how suicide or suicidality is defined and measured. Within the existent literature on suicide and disability, as defined broadly, methods for measuring suicide and suicidality have varied across studies. Previous studies have examined cause of death (Giannini et al., 2010; Pompili et al., 2012), hospital records (Lunsky, Raina, & Burge, 2012; Pompili et al., 2012), suicidal ideation items from a semistructured clinical interviews (Wetzel et al., 2011), dichotomous questions about lifetime ideation and attempts with and without a plan (Scott et al., 2010), and self-report measures of suicidal thoughts (Khazem, Jahn, Cukrowicz, & Anestis, 2015). However, these methods lack the degree of information that can be obtained from a multicomponent scale of suicidality. A multicomponent scale of suicidality may query dimensions such as ideation, previous attempts, attempt and ideation frequency and severity, and belief that one may attempt suicide in the future (Osman et al., 2001). Such information may help illuminate on what dimensions of suicidality people with disabilities do and do not differ from those without disabilities. For example, it may be that people with disabilities differ in their rates of suicidal ideation but not suicide attempts or differ only on items reflecting past suicidality but not current or perceived future suicidality. Understanding the specific pattern of suicidality in people with disabilities could provide potentially valuable information for research and treatment. For instance, if people with disabilities differ from those without disabilities on only past suicidality, this may reflect that disability is only a transient risk factor for suicidality, perhaps related to adjustment to disability. More pervasive risk across items, however, could indicate a more long-term impact of disability on suicide risk.
Applicability to Rehabilitation Counselors
Rehabilitation counselors, in particular, may benefit from understanding how suicidality presents in individuals with disabilities. For example, it may be clinically useful to be able to determine whether a client had previous suicide attempts but no current suicidal ideation. Alternately, it may be clinically useful to differentiate clients with current strong suicidal ideation from those with previous plans but who are currently stable and not experiencing suicidal thoughts. In addition, having a psychometrically established suicidality screening measure in individuals with disabilities may help rehabilitation counselors better assess and understand suicide risk in their clients and how that risk may compare with people without disabilities.
Relation to Gaps in the Research
Although previous research (Lund, Nadorff, & Seader, 2016) has used a multicomponent scale, the Suicidal Behavior Questionnaire–Revised (SBQ-R; Osman et al., 2001), to assess relative suicidality in individuals with and without disabilities, that study used scores that had been logarithmically transformed to yield more normal score distributions. This is common in suicide research (e.g., Khazem et al., 2015; Nadorff, Anestis, Nazem, Harris, & Winer, 2014), as scores on suicidality measures are not typically normally distributed without transformation. Thus, the actual item-by-item response patterns and rates among people with and without disabilities have not been examined in the current literature. Therefore, it remains in open question which aspects of suicidality (e.g., attempts, ideation, severity and frequency of attempts and ideation) are elevated among people with disabilities relative to their peers without disabilities. In addition, we will also examine the dimensions of suicidality among people with nonpsychiatric disabilities, in particular, to see whether or how the exclusion of people with psychiatric disabilities from the disability subsample affects response patterns on the four dimensions of suicidality assessed by the SBQ-R. Finally, the reliability of the SBQ-R has not been established in people with disabilities specifically, making its psychometric properties in this specific population unknown at this time. Thus, we will also assess the internal consistency of the SBQ-R in both participants with and without disabilities.
Purpose and Research Questions
The purpose of this study is to assess the reliability of and differential response patterns to the SBQ-R (Osman et al., 2001) in people with and without disabilities. In particular, the research questions are as follows:
Method
Participants and Recruitment
Recruitment
Participants were part of a larger study on attitudes toward suicide and disability (Lund, Nadorff, Winer, & Seader, 2016). They included 485 respondents who answered the question regarding disability status and provided complete data on the SBQ-R. Participants were recruited via Amazon Mechanical Turk (MTurk), an online participant recruitment website where participants are paid small amounts of compensation for completing surveys and other tasks online. Participants in this study were paid US$0.25 for their time and were required to be age of 18 years or older and a U.S. resident to participate. Data collection took place off MTurk via a secure Qualtrics webserver, and responses could not be linked to participant names, MTurk identification numbers, or other identifying information. All study procedures and materials were approved prior to data collection by a university institutional review board.
Demographics
Previous studies have shown that MTurk samples produce valid and reliable data (Buhrmester, Kwang, & Gosling, 2011; Mason & Suri, 2012; Thomas, Lund, & Bradley, 2015) and are generally representative in terms of age and gender. Our sample was 60% female (n = 291) and 74.8% White (n = 363). The mean age was 35.75 years (SD = 13.72, range = 18–75). Approximately, one third (36.3%; n = 176) reported working full-time with an additional 14.6% (n = 71) working part-time and 18.6% (n = 90) identifying as full-time students. Two fifths (40.9%; n = 198) had a bachelor’s degree or higher. More demographic information on the sample is available in Table 1.
Sample Demographics (N = 485).
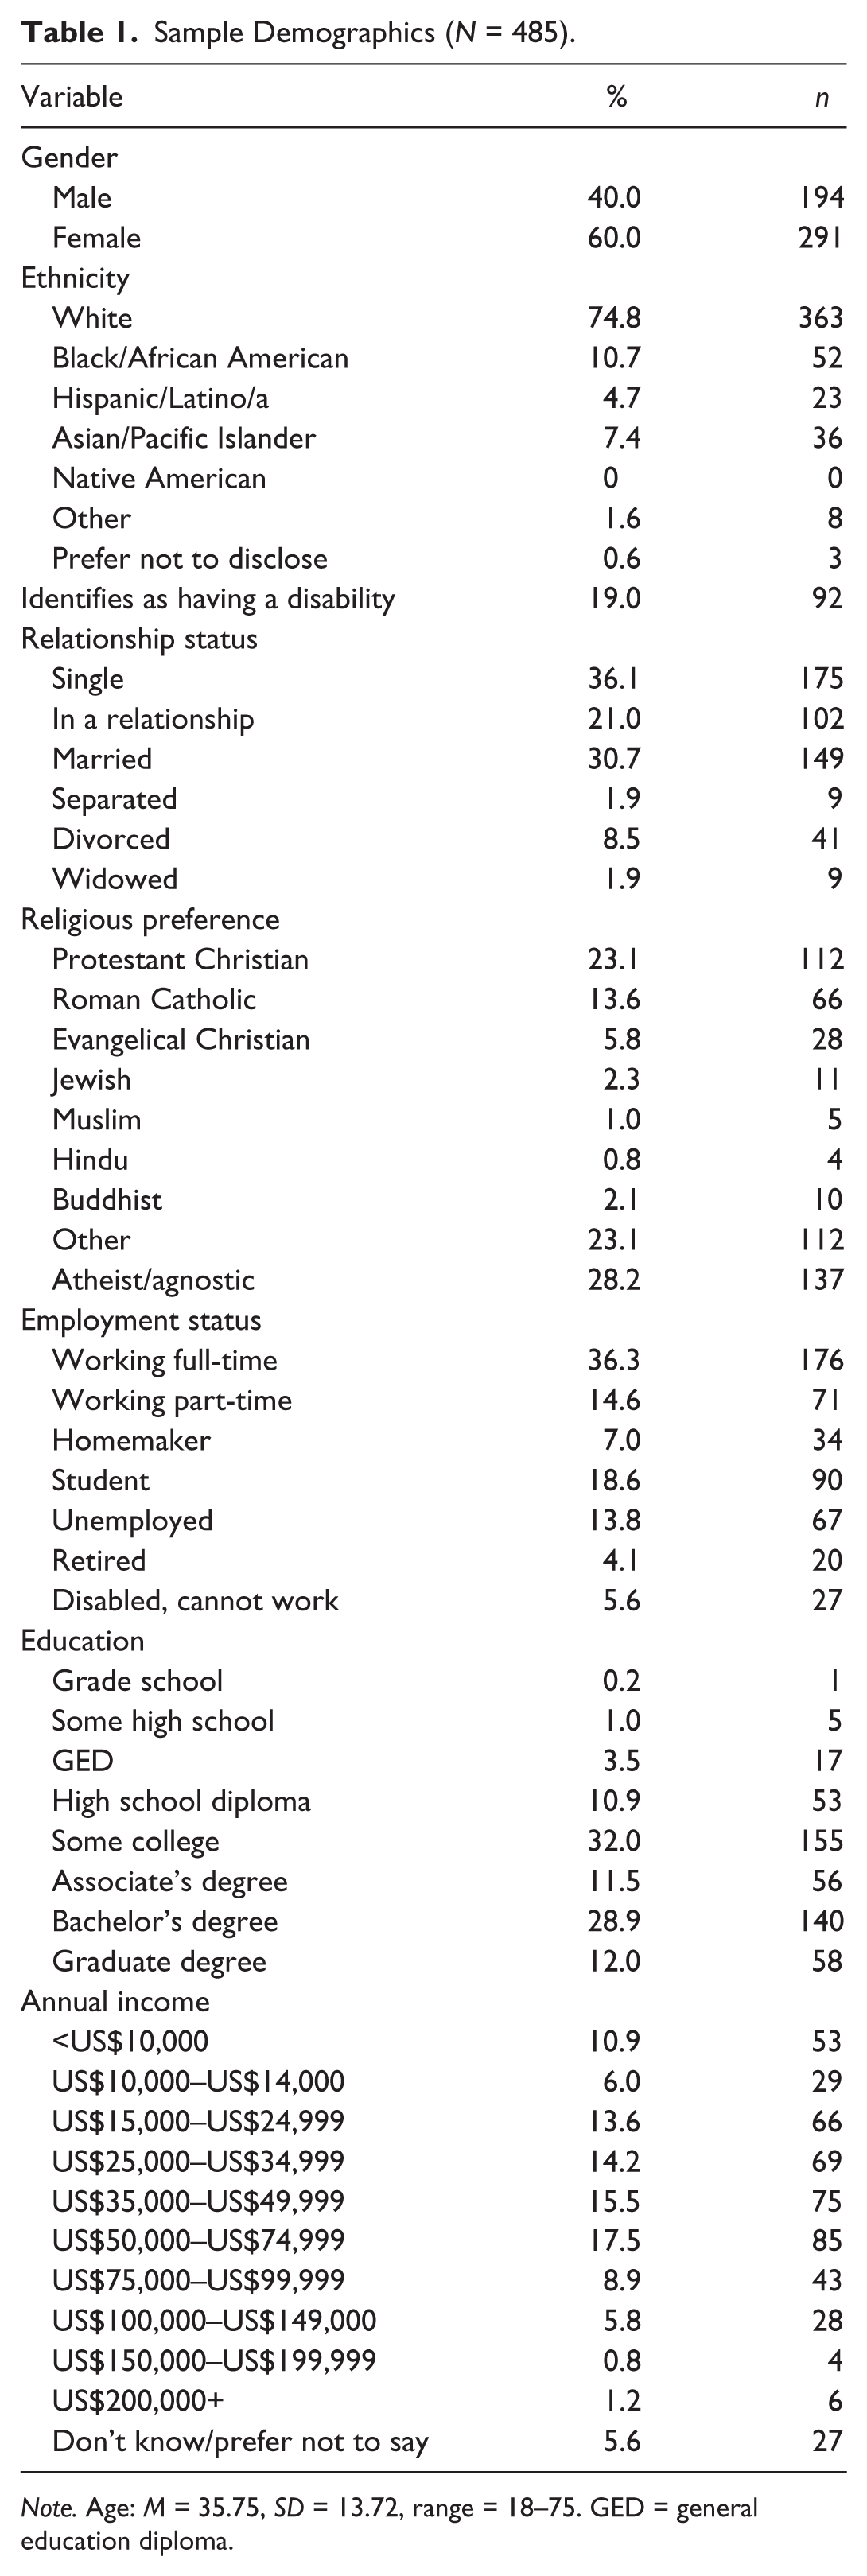
Note. Age: M = 35.75, SD = 13.72, range = 18–75. GED = general education diploma.
Ninety-two participants (19.0%) were identified as having one or more disabilities. Types of disabilities were reported via an open-ended question and responses were then categorized by the principal investigator. Eighty participants stated their type of disability, with 12 (13.0%) declining to state or providing responses that could not be interpreted. The most common types of disabilities reported were psychiatric (27.2%; n = 25), physical (23.0%; n = 23), and chronic health (22.9%; n = 22) disabilities. Less commonly endorsed disabilities included learning disabilities (4.3%; n = 4), hearing impairment (2.2%; n = 2), speech impairment (3.3%; n = 3), autism spectrum disorders (2.2%; n = 2), and visual impairment (2.2%; n = 2). Participants could report multiple disabilities.
Demographically, participants with disabilities were significantly older, t(121.22) = 3.514, p < .001, d = .39, less likely to be employed, 31.55% versus 55.5%; χ2(1) = 17.11, p = .000, ϕ = .19, and less likely to be in a romantic relationship, 40.2% versus 54.5%; χ2(1) = 6.05, p = .015, ϕ = .11. Participants with and without disabilities did not significantly differ in their likelihood of being White, non-Hispanic, 80.4% versus 74.1%; χ2(1) = 1.61, p = .228, ϕ = .06, atheist or agnostic, 26.1% versus 28.8%; χ2(1) = 0.261, p = .700, ϕ = .02, female, 64.1% versus 59.0%; χ2(1) = 0.807, p = .409, ϕ = .041, and having a bachelor’s degree or higher, 32.6% versus 42.7%; χ2(1) = 3.17, p = .078, ϕ = .08.
Depression scores
Previous studies of MTurk samples have found elevated rates of some forms of psychopathology relative to what would be expected in the general population (Shapiro, Chandler, & Mueller, 2013). This was true in our sample as well, where 219 participants (45.2%) scored at or above the cutoff of 16 on the Center for Epidemiological Studies Depression Scale (CES-D; Radloff, 1977)—the CES-D is a reliable and valid measure of depressive symptoms that consists of 20 items asking about the frequency with which participants experienced a variety of emotions, thoughts, and behaviors related to depression over the past week. However, such potentially elevated rates of psychological distress may be useful when examining a relatively low-incidence behavior associated with elevated psychological distress, such as suicide.
In addition, to account for the possibility of the advertised topic of the study (i.e., disability and suicide) may have attracted more participants with histories of suicide, we examined response rates of participants with disabilities as compared with those without disabilities, as it could be assumed that such a bias in participant self-selection would be seen in both those with and without disabilities. Finally, previous analyses with this sample (Lund, Nadorff, Winer, & Seader, 2016) found that disability status remained a statistically significant predictor of suicidality (i.e., logarithmically adjusted SBQ-R scores) even when statistically accounting for the increased depression scores. Thus, we cannot assume that higher rates of endorsement on particular SBQ-R items are solely an artifact of higher depression scores. We also analyzed the rates of clinically significant CES-D scores (i.e., clinical levels of depressive symptoms) by disability group, as described in the following paragraph.
As with previous research (e.g., Giannini et al., 2010; Lunsky et al., 2012; Wetzel et al., 2011), depression rates were higher among participants with disabilities (58.7%; n = 54) than participants without disabilities (42.0%; n = 165). This difference was significant, χ2(1) = 8.41, p = .004, ϕ = .13; however, as noted above, previous research with this data set has indicated that higher rates of depressive symptoms alone do not account for the significantly increased suicidality among participants with disabilities (Lund, Nadorff, & Seader, 2016). The rate of clinical CES-D scores among participants with nonpsychiatric disabilities was 52.7% (n = 29). This difference was not significant from the rate of 42.0% in participants without disabilities, χ2(1) = 2.27, p = .113, ϕ = .07.
Measure
In addition to the demographic items and the CES-D to measure depression symptoms, the measure of interest in these the analyses is the SBQ-R (Osman et al., 2001). The SBQ-R is a revised version of the Suicidal Behaviors Questionnaire (Linehan, 1981). It is four-item, self-report measure designed to assess levels of suicidal risk. Respondents can select only one response per item. The SBQ’s four items are summed to create a total score ranging between 3 and 18, and scores above 7 can be considered to indicate clinically significant suicide risk. It has demonstrated acceptable internal consistency, with an alpha of .88 in a clinical sample and .87 in a nonclinical sample (Osman et al., 2001).
The first item of the SBQ-R asks, “Have you ever thought about or attempted to kill yourself?” The response options and their point values are as follows: Never (1 point); It was just a brief passing thought (2 points); I have had a plan at least once to try to kill myself but did not try to do it (3 points); I have had a plan at least once to try to kill myself and really wanted to die (3 points); I have attempted to kill myself but did not want to die (4 points); and I have attempted to kill myself, and really hoped to die (4 points).
The second item on the SBQ-R asks, “How often have you thought about killing yourself in the past year?” The response options and their point values are as follows: Never (1 point); Rarely (1 time) (2 points); Sometimes (2 times) (3 points); Often (3–4 times) (4 points); and Very often (5 or more times) (5 points).
The third item on the SBQ-R asks, “Have you ever told someone that you were going to commit suicide, or that you might do it?” The response options and their point values are as follows: No (1 point); Yes, at one time, but did not really want to die (2 points); Yes, at one time, and really wanted to die (2 points); Yes, more than once, but did not want to do it (3 points); and Yes, more than once, and really wanted to do it (3 points).
The fourth item on the SBQ-R asks, “How likely is it that you will attempt suicide someday?” The response options and their point values are as follows: Never (0 points); No chance at all (1 point); Rather unlikely (2 points); Unlikely (3 points); Likely (4 points); Rather likely (5 points); and Very likely (6 points).
Analyses
Cronbach’s alpha was used to assess internal consistency, as is standard, α = .70 was used as a cutoff for acceptable internal consistency (George & Mallery, 2003). Independent sample t tests and Cohen’s d effect sizes were used to compare overall mean scores on the SBQ-R. Benchmarks of .2, .5, and .8 were used to differentiate small, medium, and large effect sizes, respectively (Cohen, 1992).
Item-by-item response differentiation involved using chi-square tests to compare the percentage of participants with and without disabilities endorsing certain responses on each item of the SBQ-R. A breakdown of responses for each item can be seen in Table 2. We also used ϕ as an effect size for chi-square analyses, with the benchmarks of .1, .3, and .5 for small, medium, and large effect sizes, respectively (Cohen, 1992).
Percentage (n) Endorsing Each Response on the SBQ-R: Any Disability.

Note. SBQ-R = Suicidal Behavior Questionnaire–Revised.
Because of the large number of comparisons conducted, we included information on effect sizes (d and ϕ) as well as p values. Effect sizes provide a nonprobability-based estimate of group differences and allow readers to assess the relative magnitude of group differences. Thus, they help protect against the probability of giving too much credence to statistically significant p values (i.e., p < .05) that may have been found simply due to a large number of comparisons, a large sample size, or chance (Thompson, 2006).
To control for the possibility that the presence of individuals with psychiatric disabilities in our disability subsample may be responsible for the higher rates of suicidality in the disability subsample, we conducted the same analyses comparing only participants without self-reported psychiatric disabilities with those with no disabilities. The nonpsychiatric disability subsample included 55 participants, excluding 25 participants with self-reported psychiatric disabilities and 12 participants who did not disclose the nature of their disability. The item-by-item breakdown on the SBQ-R for this smaller subsample can be seen in Table 3.
Percentage (n) Endorsing Each Response on the SBQ-R: Nonpsychiatric Disability Only.
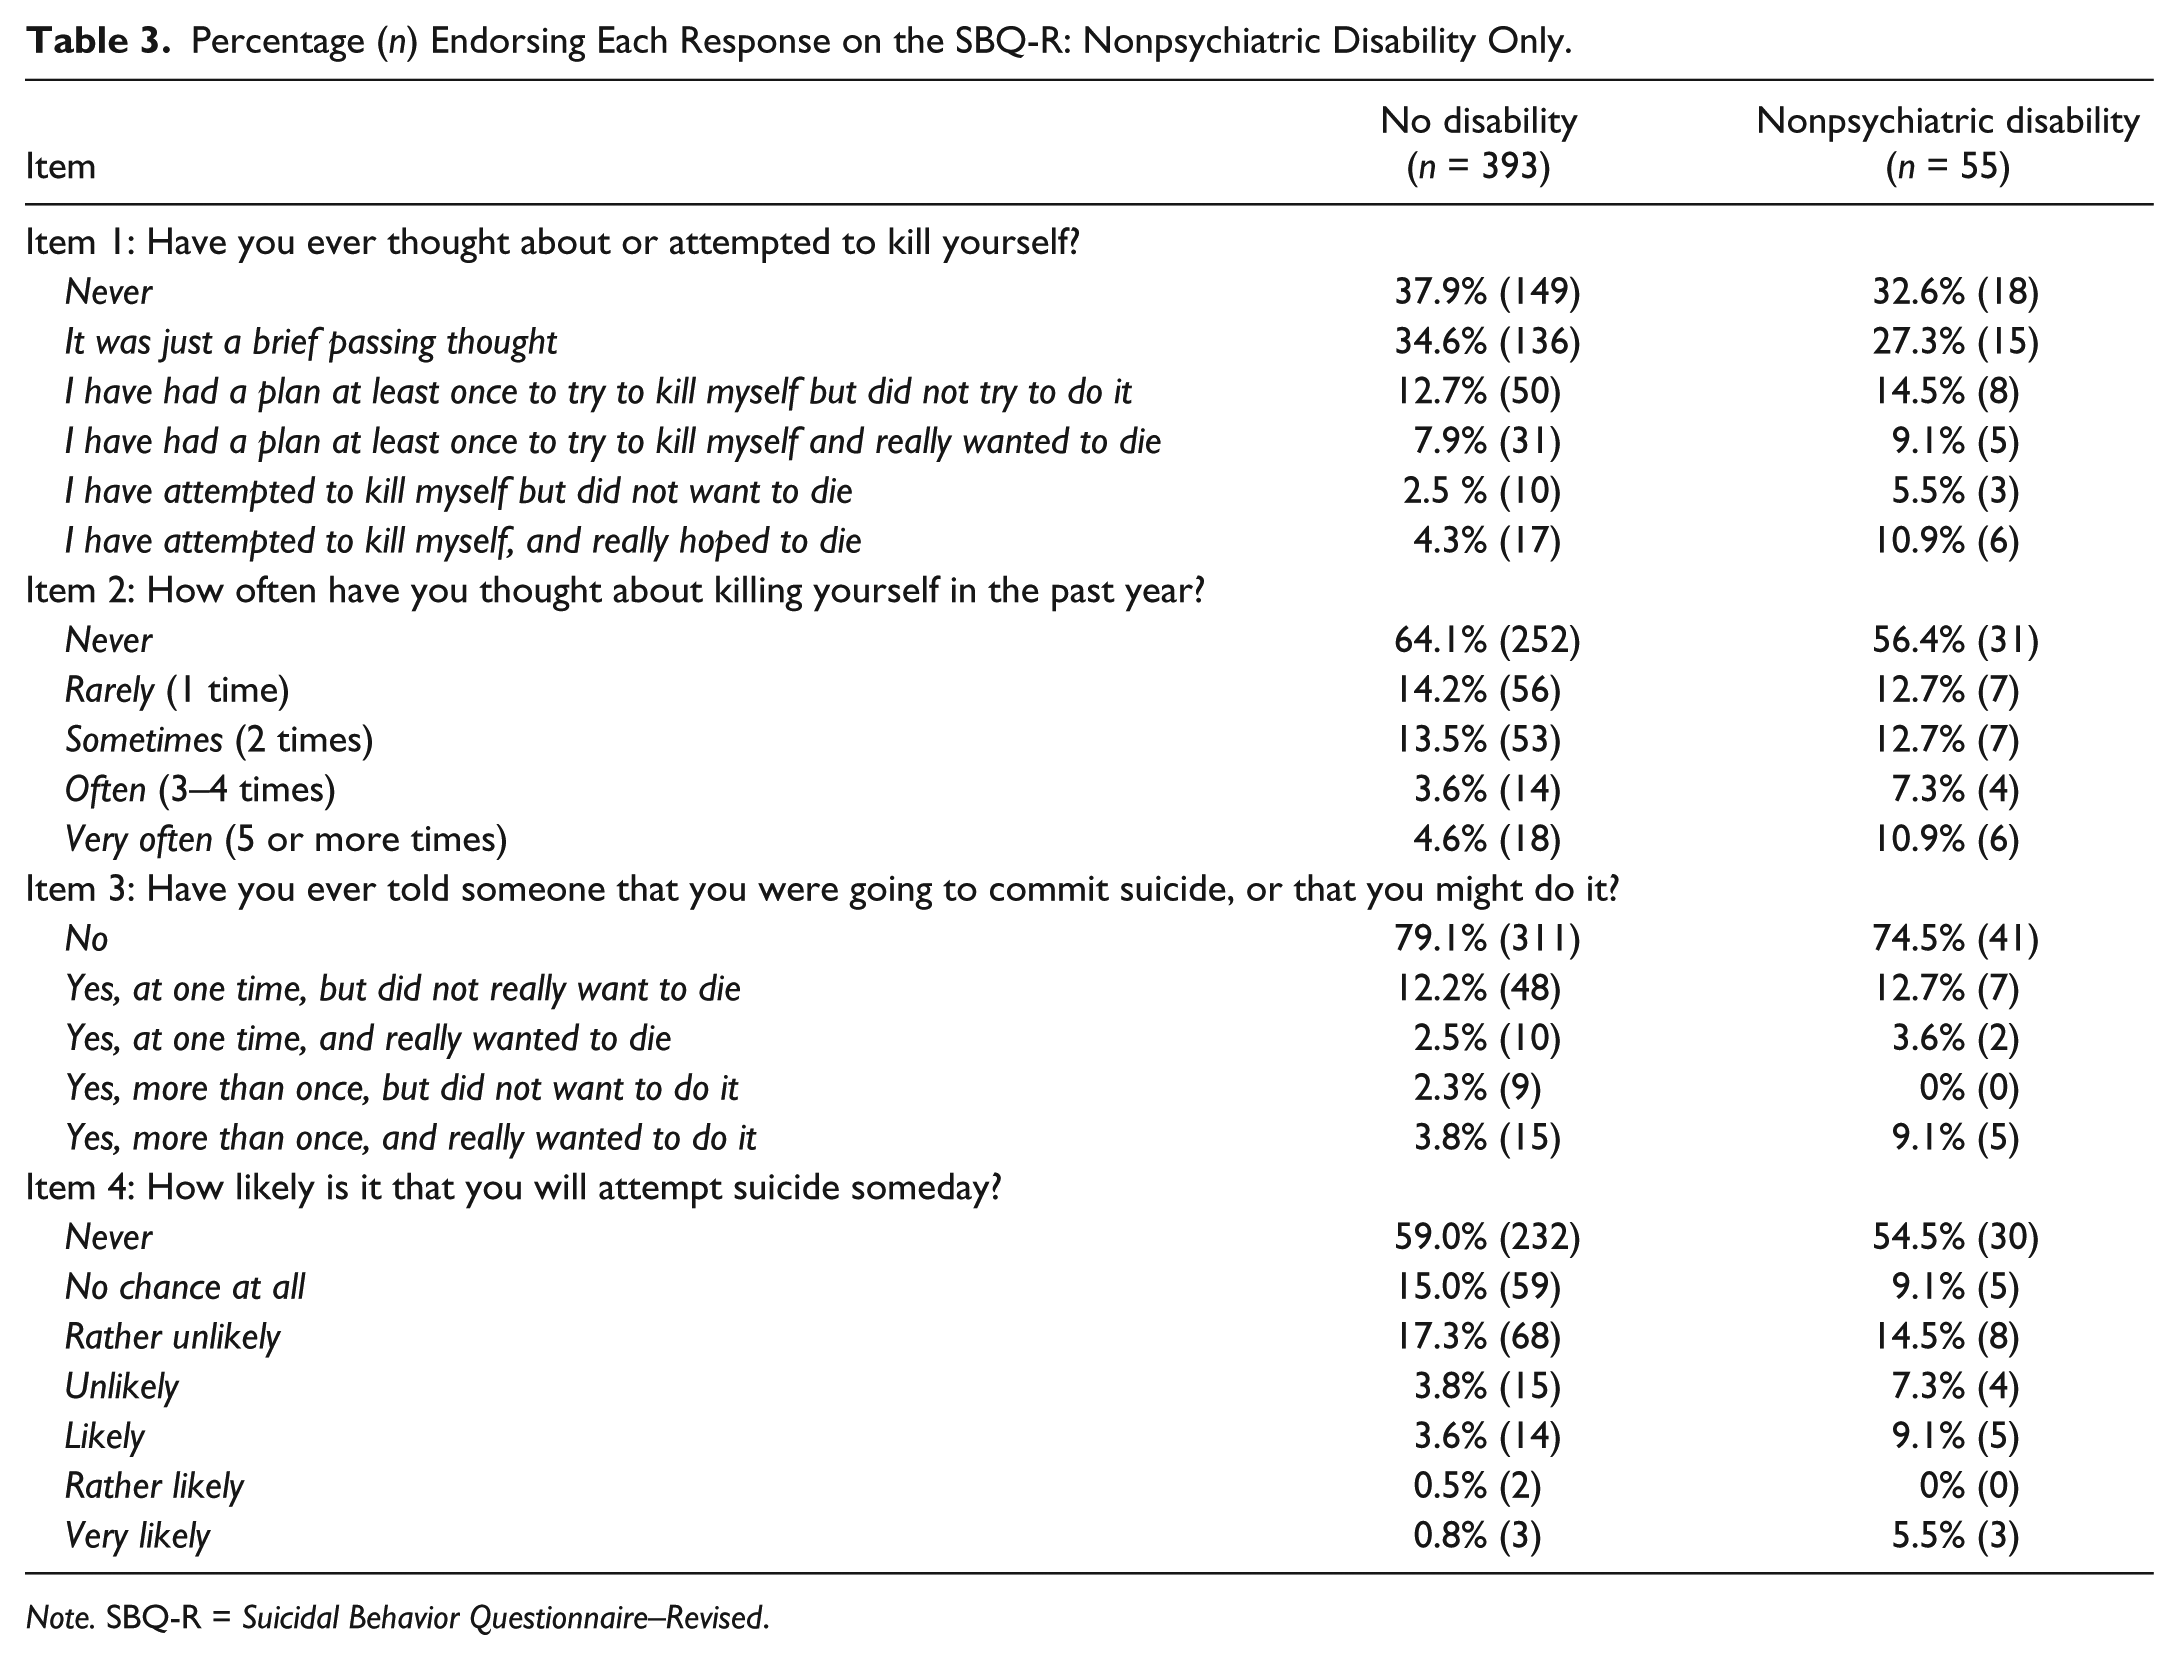
Note. SBQ-R = Suicidal Behavior Questionnaire–Revised.
Furthermore, because those who met the clinical cutoff on the CES-D could potentially be considered to have disabilities even if they did not answer “yes” to the disability question, we also ran the item-by-item analysis where both these individuals and those who endorsed the disability item were included in the disability subsample. Overall, 257 participants meet one or both of these criteria, and 228 did not. The item-by-item response patterns for each group can be seen in Table 4.
Percentage (n) Endorsing Each Response on the SBQ-R: Those With Disabilities Plus Those With Clinical Scores on the CES-D.
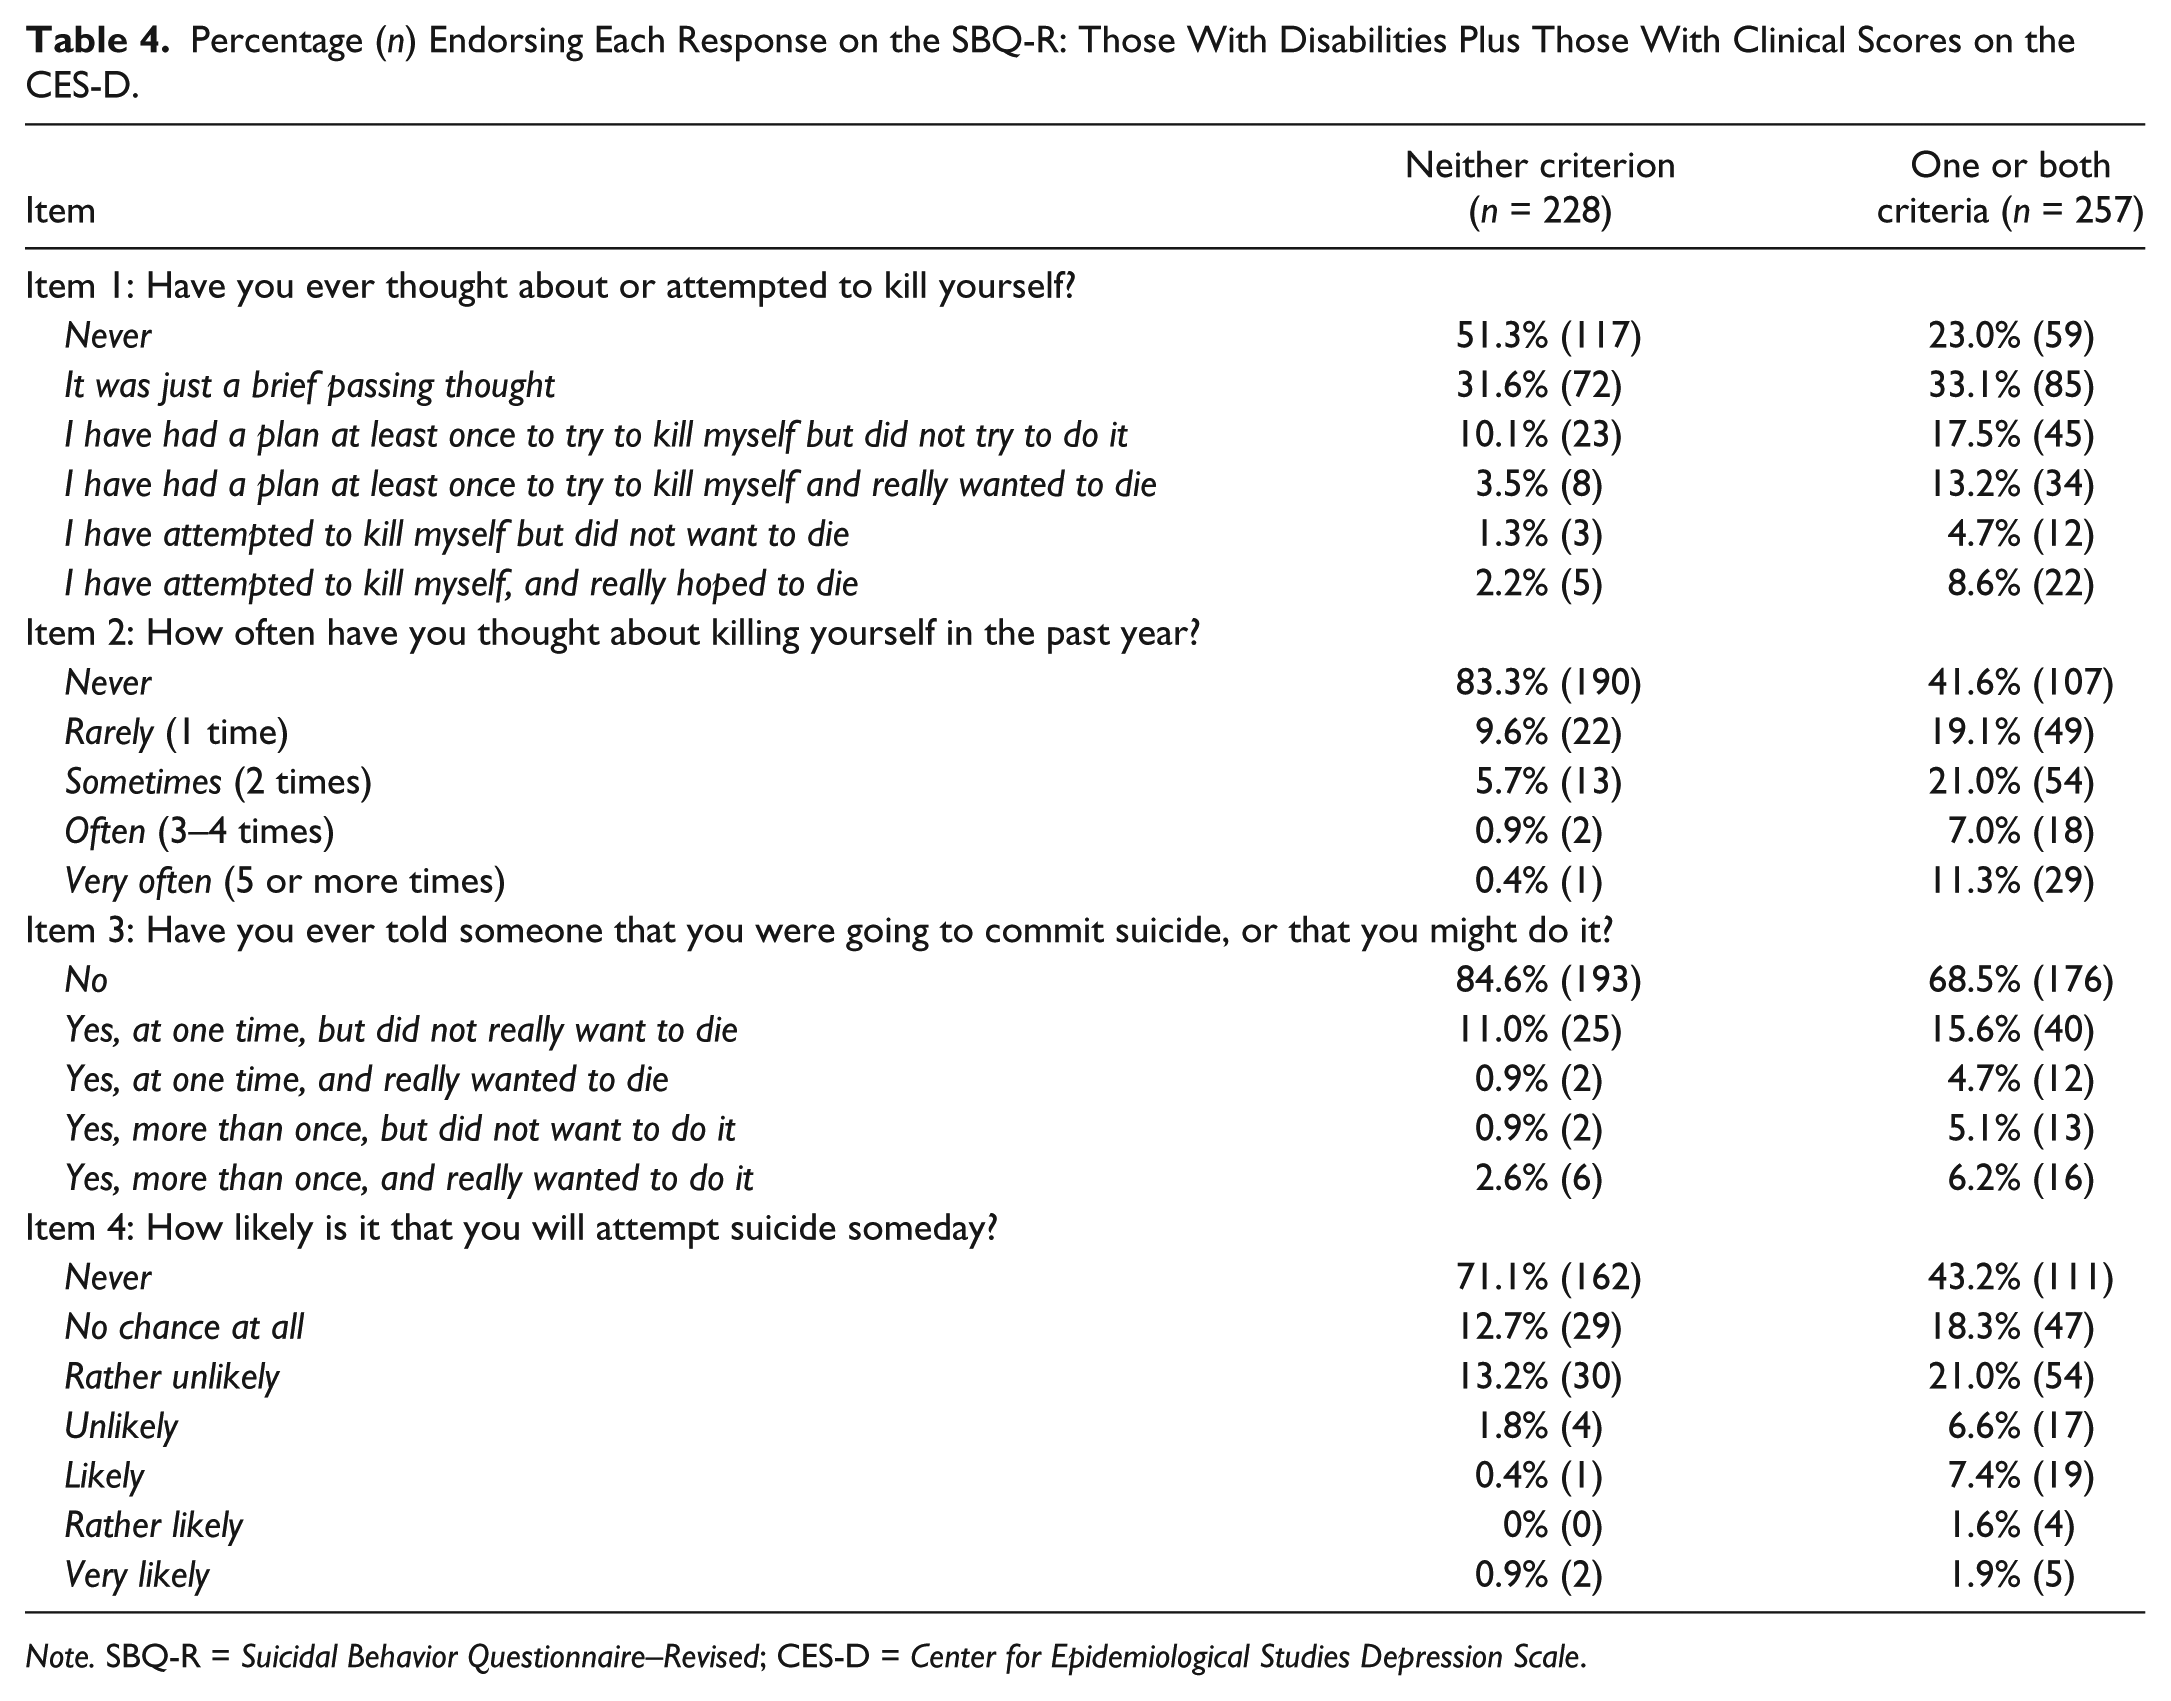
Note. SBQ-R = Suicidal Behavior Questionnaire–Revised; CES-D = Center for Epidemiological Studies Depression Scale.
Results
Internal Consistency, Means, and Sum Scores of the SBQ-R
Internal consistency of the SBQ-R
Internal consistency across the entire sample was acceptable (α = .769). Internal consistency was also acceptable among participants with disabilities in particular (α = .777) as well as those without disabilities (α = .743). In addition, internal consistency was also acceptable among participants with nonpsychiatric disabilities only (α = .722). For those with self-identified disability or a clinical CES-D score but no self-identified disability, internal consistency was good (α = .758). For those not meeting either criterion, internal consistency was lower but not alarming so (α = .610). This may have been affected by both a floor effect with the scores (Rodrigues et al., 2013) and the small number of items in the scale (Cortina, 1993).
Mean SBQ-R scores by disability status
The mean SBQ-R score for the entire sample was 6.07 (SD = 3.24, range = 3–18). The mean for participants without disabilities was 5.76 (SD = 2.97, range = 3–18). The mean for participants with any disabilities was 7.40 (SD = 3.96, range = 3–18). The difference between groups was statistically significant, t(116.02) = 3.734, p < .001, d = .47. The mean for participants with nonpsychiatric disabilities only was 6.95 (SD = 4.22, range = 3–16). This was significantly higher than the mean for participants without disabilities, t(61.71) = 2.014, p = .048, d = .33. We also examined the difference in total SBQ-R scores for those with a self-identified disability, a clinical CES-D score, or both versus those who met neither criterion. As expected, the first group (n = 257, M = 7.33, SD = 3.57) had significantly higher scores, t(416.01) = −9.90, p < .000, d = .92, than the second, n = 228, M = 4.65, SD = 2.05.
Because these scores showed nonequal variance according to Levine’s test for equality, we used degrees of freedom, t values, and accompanying p values that have been adjusted for this assumption not being met. In addition, we also provided Cohen’s d effect sizes. The differences remained statistically significant, and the effect sizes were in the small to small-to-medium ranges. This suggests a true difference between groups.
Percentage of participants meeting SBQ-R cutoff score by disability status
One hundred eighty participants (37.11%) had a total SBQ-R score at or above the cutoff of 7. Fifty individuals with disabilities (54.3%) had total SBQ-R scores at or above the cutoff, as did 130 individuals without disabilities (33.1%). This difference was statistically significant, χ2(1) = 14.45, p < .001, ϕ = .17. Twenty-five participants with nonpsychiatric disabilities (45.5%) had scores above the cutoff; this difference was not significant when compared with those without any disabilities, although it was approaching significance, χ2(1) = 3.27, p = .071, ϕ = .086. Among those with either self-identified disabilities or clinical CES-D scores, 53.7% (n = 138) had SBQ-R scores of 7 or higher compared with 18.4% (n = 42) of those who did not meet either criterion. As expected, this difference was significant, χ2(1) = 64.41, p < .001, ϕ = .36.
Item-by-Item Analysis of the SBQ-R for Those With Any Disability Compared With Those Without Disabilities
Item 1: Lifetime thoughts, plans, or attempts to kill oneself
Almost three fourths (72.5%; n = 285) of participants without disabilities denied ever thinking about killing themselves as more than a passing thought, compared with only about half (52.2%; n = 48) of participants with disabilities, χ2(1) = 14.34, p < .001, ϕ = .17. Almost a third of those with disabilities (31.6%; n = 29) reported having made a plan to kill themselves, as opposed to about a fifth (20.6%; n = 81) of those without disabilities, χ2(1) = 5.06, p = .025, ϕ = .10. Of those without disabilities, 6.8% (n = 27) reported attempting suicide, with 4.3% (n = 17) reporting that they attempted suicide and “really wanted to die.” Among those with disabilities, 16.3% (n = 15) reported making an attempt, with 10.9% (n = 10) reporting a serious attempt (i.e., one where they “really wanted to die”). Participants with disabilities were significantly more likely than participants without disabilities to report both attempting to kill themselves, χ2(1) = 8.34, p = .004, ϕ = .13, and making a serious attempt, χ2(1) = 6.07, p = .014, ϕ = .11.
Item 2: Suicidal thoughts over the past year
More than half of participants with disabilities (50.1%; n = 47) reported having thought about killing themselves over the past year, as opposed to 36.9% (n = 141) of participants without disabilities, χ2(1) = 7.26, p = .007, ϕ = .12). Of those with disabilities, almost one fifth (19.5%; n = 18) reported having these thoughts often (3–4 times) or very often (5 or more times) over the past year. In contrast, less than 10% of participants without disabilities (8.2%; n = 32) reported having these thoughts often or very often. Participants with disabilities were significantly more likely to report having these thoughts often or very often, χ2(1) = 10.52, p = .001, ϕ = .15.
Item 3: Told someone else that they wanted to or might kill themselves
One fifth of participants without disabilities (20.9%; n = 82) reported that they had told someone that they wanted to or planned to kill themselves, as compared with over a third (37.0%; n = 34) of participants with disabilities. This difference was significant, χ2(1) = 10.61, p = .001, ϕ = .15. Over 5% of those without disabilities (6.3%; n = 25) and over 10% (11.9%; n = 11) of those with disabilities reported that they had said so with true desire to die at least once. However, this difference was not significant, χ2(1) = 3.40, p = .065, ϕ = .08.
Participants with disabilities were twice as likely to report telling others that they wanted or planned to kill themselves with true desire to die multiple times than were participants without disabilities (3.8% vs. 7.6%, respectively); however, this difference was not significant, χ2(1) = 2.48, p = .116, ϕ = .07. In addition, participants with disabilities were more likely to have told someone that they wanted to die without true desire to die (25.0%; n = 23) than those without disabilities (14.5%; n = 57), and this difference was significant, χ2(1) = 5.96, p = .015, ϕ = .11.
Item 4: Perceived likelihood of future suicide attempt
Almost one fifth of those with disabilities (19.6%; n = 18) thought that it was at least “likely” that they would attempt suicide one day. In contrast, less than 10% of participants without disabilities (4.9%; n = 19) thought that they were likely to attempt suicide one day. This difference was significant, χ2(1) = 9.26, p = .002, ϕ = .14. Participants with disabilities were also more likely to think that rather likely or very likely that they would attempt suicide in the future (6.5%; n = 6) than participants without disabilities (1.3%; n = 8). Again, this difference was significant, χ2(1) = 9.27, p = .002, ϕ = .14.
Item-by-Item Analysis of the SBQ-R for Those With Nonpsychiatric Disabilities Only Compared With Those With No Disabilities
Item 1: Lifetime thoughts, plans, or attempts to kill oneself
Almost three fourths (72.5%; n = 285) of participants without disabilities denied ever thinking about killing themselves as more than a passing thought, compared with 60.0% (n = 33) of participants with nonpsychiatric disabilities. This difference was not significant but was nearing significance, χ2(1) = 3.67, p = .055, ϕ = .09. Almost a quarter of those with nonpsychiatric disabilities (23.6%; n = 13) reported having made a plan to kill themselves, as opposed to about a fifth (20.6%; n = 81) of those without disabilities. This difference was not significant, χ2(1) = 0.266 p = .606, ϕ = .025.
Of those without disabilities, 6.8% (n = 27) reported attempting suicide, with 4.3% (n = 17) reporting that they attempted suicide and truly wanted to die. Among those with nonpsychiatric disabilities, 16.4% (n = 9) reported making an attempt, with 10.9% (n = 6) reporting a serious attempt (i.e., one where they “really wanted to die”). Participants with nonpsychiatric disabilities were significantly more likely than participants without disabilities to report both attempting to kill themselves, χ2(1) = 5.88, p = .015, ϕ = .12, and making a serious attempt, χ2(1) = 4.29, p = .038, ϕ = .1.
Item 2: Suicidal thoughts over the past year
Almost two fifths of participants with nonpsychiatric disabilities (43.6%; n = 24) reported having thought about killing themselves over the past year, as opposed to 36.9% (n = 141) of participants without disabilities; this difference was not significant, χ2(1) = 1.25, p = .264, ϕ = .05. Of those with nonpsychiatric disabilities, almost one fifth (18.2%; n = 10) reported having these thoughts often (3–4 times) or very often (5 or more times) over the past year. In contrast, less than 10% of participants without disabilities (8.2%; n = 32) reported having these thoughts often or very often. Participants with nonpsychiatric disabilities were significantly more likely to report having these thoughts often or very often, χ2(1) = 5.73, p = .017, ϕ = .11.
Item 3: Told someone else that they wanted to or might kill themselves
One fifth of participants without disabilities (20.9%; n = 82) reported that they had told someone that they wanted to or planned to kill themselves, as compared with over a quarter of those with nonpsychiatric disabilities (25.5%; n = 14). This difference was not significant, χ2(1) = 0.604 p = .437, ϕ = .04. Over 5% of those without disabilities (6.3%; n = 25) and almost 10% (9.1%; n = 5) of those with disabilities reported that they had said so with true desire to die at least once. However, this difference was not significant, χ2(1) = 0.575, p = .448, ϕ = .04.
Participants with nonpsychiatric disabilities were more than twice as likely to report telling others that they wanted or planned to kill themselves with true desire to die multiple times than were participants without disabilities (3.8% vs. 9.1%, respectively). This difference was not significant but was nearing significance, χ2(1) = 3.15, p = .076 ϕ = .08. Participants without disabilities and those with nonpsychiatric disabilities were about equally likely to report than those who had told someone that they wanted to kill themselves without true desire to die, 14.5% versus 16.3%; χ2(1) = 0.133, p = .716, ϕ = .02.
Item 4: Perceived likelihood of future suicide attempt
Almost 15% of those with nonpsychiatric disabilities (14.6%; n = 12) thought that it was at least likely that they would attempt suicide one day. In contrast, less than 5% of participants without disabilities (4.9%; n = 19) thought that they were likely to attempt suicide one day. This difference was significant, χ2(1) = 21.61, p < .001, ϕ = .22. Participants with nonpsychiatric disabilities were also more likely to think that it was rather likely or very likely that they would attempt suicide in the future (5.5%; n = 6) than participants without disabilities (1.3%; n = 8). Again, this difference was significant, χ2(1) = 12.55, p < .001, ϕ = .17.
Item-by-Item Analysis of the SBQ-R for Those With Either a Disability or Clinical Scores on the CES-D Compared With Those With Not Meeting Either Criterion
Item 1: Lifetime thoughts, plans, or attempts to kill oneself
Over four fifths (82.9%; n = 189) of participants who did not meet either criterion denied ever thinking about killing themselves as more than a passing thought. This was compared with less than half (44.0%; n = 113) of participants those who met one or more criteria, and the difference was significant, χ2(1) = 77.92, p < .001, ϕ = .40. Almost a third of those who met one or more criteria (30.7%; n = 79) reported having made a plan to kill themselves, as opposed to about less than 15% (13.6%; n = 31) of those who did not. This difference was also significant, χ2(1) = 20.25, p < .001, ϕ = .20. Of those who did not meet either criterion, 3.5% (n = 8) reported attempting suicide, with 2.2% (n = 5) reporting that they attempted suicide and truly wanted to die. Among those meeting one or both criteria, 13.5% (n = 34) reported making an attempt, with 8.6% (n = 22) reporting a serious attempt (i.e., one where they “really wanted to die”). Participants who met one or both criteria were significantly more likely than participants who did not meet either criterion to report both attempting to kill themselves, χ2(1) = 21.27, p < .001, ϕ = .21, and making a serious attempt, χ2(1) = 13.64, p < .001, ϕ = .16.
Item 2: Suicidal thoughts over the past year
More than half of participants who met one or both criteria (58.4%; n = 150) reported having thought about killing themselves over the past year, as opposed to 17.7% (n = 38) of those who did not meet either criteria, χ2(1) = 132.40, p < .001, ϕ = .52. Of those who met one or more criteria, almost one fifth (18.3%; n = 47) reported having these thoughts often (3–4 times) or very often (5 or more times) over the past year. In contrast, less than 2% of participants who did not meet either criteria (1.3%; n = 3) reported having these thoughts often or very often. Participants who met one or both criteria were significantly more likely to report having these thoughts often or very often, χ2(1) = 37.64, p < .001, ϕ = .28.
Item 3: Told someone else that they wanted to or might kill themselves
Less than one fifth of participants who did not meet either criteria (15.4%; n = 35) reported that they had told someone that they wanted to or planned to kill themselves. This was compared with almost a third (32.5%; n = 81) of participants who met one or both criteria, with a significant difference, χ2(1) = 17.35, p < .001, ϕ = .19. Over 3% of those who did not meet either criterion (3.5%; n = 8) and over 10% (10.9%; n = 28) of those who met one or more criteria reported that they had said so with true desire to die at least once. This difference was significant, χ2(1) = 9.59, p = .002, ϕ = .14.
Participants who met one or more criteria were more than twice as likely to report telling others that they wanted or planned to kill themselves with true desire to die multiple times than were participants who did not meet either criteria (2.6% vs. 6.2%, respectively). This difference was not significant but was approaching significance, χ2(1) = 3.60, p = .06, ϕ = .09. Participants who met one or more criteria were also more likely to have told someone that they wanted to die without true desire to die (20.7%; n = 56) than those who did not meet either criteria (11.9%; n = 27). This difference was significant, χ2(1) = 8.43, p = .003, ϕ = .13.
Item 4: Perceived likelihood of future suicide attempt
More than 10% (10.9%; n = 28) of participants who met one or both criteria thought that it was at least likely that they would attempt suicide one day. In contrast, less than 2% of participants who did not meet either criteria (1.3%; n = 3) thought that they were likely to attempt suicide one day. This difference was significant, χ2(1) = 18.53, p < .000, ϕ = .20. Participants who met one or both criteria were also more likely to think that rather likely or very likely that they would attempt suicide in the future (3.5%; n = 13) than participants without disabilities (0.9%; n = 2). Again, this difference was significant, χ2(1) = 7.05, p = .008, ϕ = .12.
Discussion
This study examined item-by-item responses on the SBQ-R measure of suicidality by people with and without disabilities. People with disabilities were significantly more likely to endorse more concerning responses across all four items, including responses associated with past suicidal plans and attempts across the lifespan, frequency of suicidal thoughts over the past year, and perceived likelihood of suicide attempts in the future. This suggests that disability status is associated with increased past, current, and future suicide risk. Furthermore, the SBQ-R was internally consistent in a subsample of individuals with disabilities, suggesting that this measure does indeed have adequate reliability among this population.
Even when we excluded individuals with psychiatric disabilities from the comparative analysis, participants with disabilities were still significantly more likely to endorse several concerning items. These included history of suicide attempts, history of serious suicide attempts, rate of frequent past year suicidal ideation, and perceived likelihood of future suicide attempts. Although these results demonstrate that participants with disabilities tended to endorse more concerning responses across all four items of the SBQ-R, it should also be noted that these four items tended to be highly correlated, as evidenced by the good internal consistency (i.e., interitem correlation) of the measure. Thus, the intercorrelation between items may have increased the likelihood of finding significant results, a limitation that should be considered when interpreting our findings. In addition, the large number of comparisons that we conducted may have inflated our likelihood of finding significant results, although our inclusion of effect sizes allows for the interpretation of comparisons using a nonprobability-based metric (Thompson, 2006).
It is interesting to note that those with only nonpsychiatric disabilities, as a group, did not differ significantly from those without disabilities in terms of the percentage of participants scoring at or above the clinical cutoff for depression symptoms. This suggests that even individuals with nonpsychiatric disabilities report higher rates of past, current, and perceived future suicidality, including ideation and attempts, despite not being significantly more likely to be depressed than their counterparts without disabilities. The fact that these elevations were seen across the items assessing past, current, and future suicidality also suggests that suicidality remains an ongoing issue for a higher than expected number of people with nonpsychiatric disabilities and does not simply reflect, for example, a past state of depression that occurred when they acquired a disability. However, future research should examine the role of adjustment to disability in suicidality profiles in people with diverse disabilities.
It is interesting to note that those without psychiatric disabilities were not significantly more likely to report telling others about suicidal thoughts or plans as compared with those without disabilities, despite their increased reporting of actually experiencing suicidal ideation and attempts. This may suggest that individuals with nonpsychiatric disabilities are more likely to conceal suicidality from others. However, it should also be noted that some of the between-group differences on this item, while not statistically significant, were noticeable. For example, 9.1% of those with nonpsychiatric disabilities reported repeatedly telling others that they would or might attempt suicide with true intent to die, as compared with only 3.8% of participants without disabilities. Thus, it may be that the small sample size of the nonpsychiatric disability subgroup may have obscured some potentially meaningful, if not statistically significant, between-group differences on this item. Researchers should replicate this study with a large sample; a larger sample may also allow for more comparisons of suicidality between different disability subgroups or even diagnoses, such as in Scott and colleagues’ (2010) study.
In addition, including individuals who did not identify as having a disability but had clinical scores on the CES-D in the “disability” subsample did not considerably change the results. This inclusion did lead to increases in the percentage of participants endorsing items such as having any suicidal thoughts over the past year or having seriously considered suicide during their lifetime. However, it did not appear to substantially increase the rate of endorsement for very high-concern items, such as frequent suicidal thoughts over the past year, repeated disclosure of suicidality with true desire to die, or high perceived likelihood of future suicide attempts. Thus, counting individuals with clinical CES-D scores but no self-identification as disabled in the disability group seems to increase the rate of lower level suicidality risk items but not higher level risk items. Given the well-established link between depression and suicidality (AFSP, 2015b; American Psychiatric Association, 2013), this elevation on some items was not surprising. The fact that even nonpsychiatric disability was associated with higher rates of endorsement on high-concern responses—including responses related to past year and perceived future suicidality—suggests that disability itself may be a risk factor above and beyond depression symptoms or psychiatric disability.
These analyses further contribute to our understanding about the increased risk for suicidality in people with disabilities. They highlight the importance of being attentive to warning signs for suicidality in clients with disabilities in particular and assessing both past and present suicidal thoughts, plans, and behavior among people with disabilities, particularly those who may have other risk factors for suicide, such as acute depressive symptoms or a recent personal loss.
Implications for Counselors
In addition, these analyses support the use of the SBQ-R as a reliable screening measure for suicidality in people with disabilities. Because it is short and easy to administer, it may be appropriate to use to screen for suicidality. This screening could encompass either rehabilitation counselors’ client populations as a whole or specific subsamples of particularly high-risk clientele, such as those with known previous suicide attempts or recorded diagnoses of depression or other mood disorders. However, given that our results suggest that clients with disabilities a whole may be at greater risk for suicide regardless of type of disability, offices may wish to consider universal screening for suicidality. Such screening could occur during the intake process. It may provide a relatively low stress and nonconfrontational way for clients to disclose or counselors to broach the often difficult topic of suicidality. Also, because the SBQ-R does not explicitly ask about immediate suicidality, it may provide a way for counselors to broach the topic of suicide risk and to get a sense of their client’s general suicide risk without having to immediately broach current suicide risk during intake. If a client’s responses on the SBQ-R indicate an elevated risk of suicide (e.g., past year suicidal ideation, a high perceived likelihood of future suicidality) or if the client makes concerning statements during the intake process (e.g., talking about giving up, being a burden, or not being able to go on), the counselor can then follow-up with direct queries about immediate suicide risk. It is important to note, however, that it is always recommended that people inquire directly about suicide (e.g., “Have you thought about killing yourself?”) when there is any concern that an individual may be at immediate risk for suicide; doing so will not cause a person who was not previously suicidal to become so (Smith, Silva, Covington, & Joiner, 2014).
Limitations and Directions for Future Research
When interpreting the results of our study, some limitations should be noted. First, our sample had high rates of depression among both participants with and without disabilities. Although they may have given us more power by which to detect group differences in generally low-incidence suicidal thoughts and behaviors, it also may have elevated the base rates of suicidal thoughts and behaviors in our sample. Thus, these results should not necessarily be compared with those that might be found in a random general population sample. However, it should also be noted that participants with nonpsychiatric disabilities did not have significantly elevated rates of depression compared with those with no disabilities and yet still reported significantly higher rates on key dimensions of suicidality, including suicide attempts, serious suicide attempts, frequent past year suicidal thoughts, and a high perceived likelihood of future suicide attempts. This, in concordance with our previous analyses (Lund, Nadorff, & Seader, 2016), indicates that higher rates of suicidality in people with disabilities cannot be fully accounted for by increased rates of depression or depression symptoms. This is similar to what has been found in other studies that have controlled for the presence of mental health conditions when examining suicidality among individuals with disabilities (Dennis et al., 2009; Scott et al., 2010) and in our previous analyses of this data set (Lund, Nadorff, & Seader, 2016)—namely, that doing so accounts for some but not all of the increased suicidality risk associated with disability.
Furthermore, it is possible that other demographic factors that increase suicide risk, such as unemployment or unpartnered relationship status (Fiedorowicz, Weldon, & Bergus, 2010) that is more common in people with disabilities, may help explain their increased rates of suicidality. However, other studies of disability and suicide have found that accounting for sociodemographic factors in addition to depression does not fully account for increased suicidality among people with disabilities (McConnell, Hahn, Savage, Dubé, & Park, 2015; Russell, Turner, & Joiner, 2009). Although such analyses are outside the scope of the current study—that is, examining item-by-item response patterns on the SBQ-R by disability status—future analyses with this data set or others should involve examining the association between sociodemographic risk factors, disability, depressive symptoms, and suicidality.
Finally, the participants in our study completed our measures via an anonymous online survey; this may have affected their willingness to disclose suicidality and suicidal behavior. This is reflected in much higher rates of participants who reported having serious suicidal thoughts versus the percentage of participants who reported disclosing those thoughts to others. Thus, the relative safety and lack of stigma of anonymous online reporting may have made participants more likely to reveal those thoughts, plans, and attempts. In addition, having participants list out their disabilities may have introduced a subjectivity to the classification process or increased the effort value of listing all conditions, instead of a checklist format for enumerating disability type. This, along with space limitations in the entry field, may have resulted in fewer participants listing multiple disabilities.
Conclusion
Regardless of these limitations, however, the results of this study provide new and useful information on how suicidality looks in people with disabilities and how they differ in risk from people without disabilities. Participants with disabilities reported significantly greater suicidality risk across all four items of the SBQ-R, including previous plans and attempts, frequency of current suicidal thoughts, and perceived likelihood of future suicide. These results indicate that suicidality is elevated across the past, present, and future domains and that all three domains should be considered during a clinical assessment with suicidal or high-risk clients. Furthermore, these elevations remained largely the same even when people with self-reported psychiatric disabilities were excluded from the disability subsample, suggesting that current, past, and future suicidality are elevated among even those with nonpsychiatric disabilities. Thus, disability itself may be a considerable risk factor for suicidality.
Footnotes
Acknowledgements
The authors extend their gratitude to Timothy Slocum, Jared Schultz, Kathleen Oertle, Scott Ross, and Marilyn Hammond for their comments on an earlier version of this manuscript.
Declaration of Conflicting Interests
The authors declared no potential conflicts of interest with respect to the research, authorship, and/or publication of this article.
Funding
The authors disclosed receipt of the following financial support for the research, authorship, and/or publication of this article: Funding for this study was provided through startup funds granted to Michael Nadorff by Mississippi State University.