
Abstract
The literature on racial differences in vocational rehabilitation (VR) services has not been updated for over a decade. Using the 2017 individual-level U.S. national RSA-911 data, supplemented with the 2017 American Community Survey and publicly available information from the Kaiser Family Foundation, we investigated racial differences at each step of the VR process—application, eligibility, service provision, and employment outcomes at closure. At the first step, application, White individuals with disabilities were less likely to apply than their African American, American Indian/Alaska Native, and Hispanic counterparts, and more likely to apply than their Asian counterparts. For the remaining three steps, the results were inverted: the White subgroup had higher eligibility rates, service rates, and employment rates than the African American, American Indian/Alaska Native, and Hispanic subgroups, and lower rates than the Asian subgroup. These findings suggest that racial and ethnic differences continue to exist in the VR process despite several legislative acts and policy efforts. Within each racial and ethnic minority group, we also found large variation in application rates and employment rates across states, which indicates a need for developing performance measures and standardized guidelines for state VR agencies to better serve individuals with disabilities from racial and ethnic minorities.
Individuals with disabilities (IWDs) experience significant labor market inequalities compared with persons without disabilities, as indicated by lower rates of employment, lower earnings, and higher likelihood of employment in part-time jobs without benefits (Kaye, 2010; Livermore & Goodman, 2009; She & Livermore, 2009; Yin et al., 2014). The labor market inequity is more pronounced among IWDs of racial and ethnic minorities, as they face the double burden of health and social challenges (Blick et al., 2015). The joint U.S. federal and state vocational rehabilitation (VR) program has long been committed to helping IWDs gain and retain meaningful and competitive employment. It is the largest national disability workforce program, serving more than 800,000 IWDs annually, with expenditures exceeding $3.5 billion. Given the size and scope of the program, VR is especially critical for IWDs of racial and ethnic minority groups in overcoming the multitude of barriers to employment.
Racial and ethnic differences in VR service access and utilization were first documented by Wilkerson and Penn (1938), who found substantially lower rates of African Americans with successful rehabilitation outcomes than the percentage of African Americans in the general population. After an absence of related research for several decades, Atkins and Wright (1980) conducted a landmark national study that concluded that African American consumers, when compared with White consumers, received unequal treatment throughout the VR process, including not being as likely to be accepted for VR services. Consistent with Atkins and Wright (1980), several studies reported that racial-ethnic minority groups are less likely to be accepted or eligible for VR services (Dziekan & Okocha, 1993; Feist-Price, 1995; Herbert & Martinez, 1992), even when controlling for other individual differences, such as education and work status at application (Wilson et al., 2001). Specifically, Hispanic individuals are more likely to be accepted for VR services than non-Hispanic individuals (Wilson & Senices, 2005), and White individuals were approximately 1.5 times more likely to be accepted for VR services than their African American counterparts (Rosenthal et al., 2005). The existing literature also highlights racial-ethnic variation across the type and amount of VR services provided to clients. Generally, Hispanic and African American consumers were more likely to receive job training–related skills and supported employment services than White consumers and other racial minority groups, who were more likely to receive higher education–related training (Olney & Kennedy, 2002). In another study, Mwachofi (2008) indicated that, compared to African American clients, White clients were served for longer periods of time, had access to higher end services, and received more education and training services. This study also found that spending per person was significantly greater for White clients than for clients of a racial-ethnic minority.
In addition, research finds disparities by race/ethnicity for VR outcomes, including both case closure and competitive employment outcomes (Giesen et al., 2004; Moore et al., 2005; Olney & Kennedy, 2002; Wheaton & Hertzfeld, 2002). Wheaton and Hertzfeld (2002) found that in the 1998 fiscal year, African American, American Indian/Alaska Native, Asian, and Hispanic clients had lower successful closure rates than White clients while controlling for disability severity. A study by Olney and Kennedy (2002) also found that White VR clients were employed in competitive employment at a rate of 60%, compared to 46% for Hispanic clients and 41% for African American clients. A more recent study by Ji et al. (2015) used U.S. national RSA data from 2012 to examine transition-age youth with disabilities; using logistic regression, they found that African Americans had significantly lower successful employment rates and lower mean earnings per week than White or Hispanic individuals.
The prior literature, however, relies heavily on survey samples or administrative data from over a decade ago and focuses on individual-level analysis or a particular subpopulation (e.g., transition-age youth). As a result, potential state-level variations were never captured, and existing results may not generalize to the national level. Moreover, a variety of environmental factors can interact with racial and ethnic background to determine access to and outcomes of VR. For example, labor market conditions at the state and national levels (Cook et al., 2006; Nord et al., 2013), Social Security beneficiary rates, and average costs of services and administration cost rates (Chan et al., 2016) have been identified as important factors in predicting VR outcomes. However, previous studies have not explored whether such state-level characteristics could explain racial differences in VR process.
In this study, we use 2017 individual-level national RSA-911 data, supplemented with the 2017 American Community Survey and publicly available information from the Kaiser Family Foundation, to comprehensively investigate potential racial differences in each step of the VR service process: application, eligibility determination, Individual Plan of employment (IPE) development (which signifies the start of VR services), and case closure. We answer two research questions:
The results of this study provide an update on racial differences in the VR process at both state and national levels. This study also provides novel information on state-level variation in VR serving IWDs from racial and ethnic minorities in each step of the VR service process. The study’s methodology can help inform the development of performance measures for use by VR agencies to gauge and enforce equity in serving clients from racial-ethnic minorities.
Method
The VR service process consists of four major steps: application, eligibility, service provision, and case closure. Successful applicants typically go through the entire process and close their cases with competitive integrated employment. However, there is significant attrition at each step of VR. To answer the first research question, identifying racial differences at the national level and across state VR agencies, we construct four rates following Honeycutt et al. (2015) to reflect the percentage of VR clients who advance to the next step in the VR process by race and ethnicity. We focus on four racial groups (White, African American, American Indian/Alaska Native, and Asian) and one ethnicity group (Hispanic) that is not mutually exclusive and includes individuals regardless of race. Note that our analysis is descriptive, and the rates do not reflect performance of VR agencies in terms of racial-ethnic equity. State-level demographic, economic, or health care factors may differentially affect IWDs from racial and ethnic minorities, and they may be able to explain racial-ethnic differences in the VR process. For example, state demographic variables proxy for racial representation in the state population, which could influence employer willingness to hire IWDs or availability and generosity of state programs serving vulnerable populations, including racial-ethnic minorities. To answer the second research question regarding the influence of state-level factors, we calculate bivariate correlations (N = 51) between external state demographic, economic, or health care characteristics factors and racial-ethnic differences in each step of the VR process.
Data
Our main data source is the individual-level administrative data from the Rehabilitation Services Administratioin national case service reports (RSA-911 data) for all clients who exited VR with a closed case in the 2017 fiscal year. We restricted the sample to individuals between ages 15 and 64 years residing in 50 states and Washington, D.C. (N = 460,977). The national RSA-911 data include detailed information on demographics (at the time of application) for all VR applicants, including age, race, gender, education, disability type, and enrollment in public support programs. Further, the data also include self-reported labor market status at the time of application and at case closure. Finally, the RSA-911 data include a detailed record of VR services such as academic or job training, job search and placement assistance, and rehabilitation technology received by each applicant.
At the national level, the majority of clients were White (57.7%), followed by African American (24.6%), Hispanic (12.5%), American Indian/Alaska Native (1.9%), and Asian (1.8%). Note that where available, American Indians with disabilities who reside on or near federal or state reservations are served by a separate program—the American Indian Vocational Rehabilitation Services (AIVRS) program. In most states, the state VR agencies coordinate with the tribal VR system or providers to enhance the capabilities of AIVRS. Accordingly, a combination of the state and tribal VR system characteristics can affect both the composition of American Indian VR applicants and their outcomes. The average age of applicants was 33.7 years, and 38.6% of applicants were between ages 14 and 24 (see Table 1). Of all applicants, 43.6% were female, 30.3% of applicants had a high school diploma or equivalent, and 49% were classified by VR agencies as having a most significant disability. Among all VR clients with a closed case in 2017, approximately 86% were determined to be eligible to receive VR services. Among those who were determined eligible, about 66% received VR services, and 31% exited VR with competitive and integrated employment.
Characteristics of Vocational Rehabilitation Applicants by Race/Ethnicity.
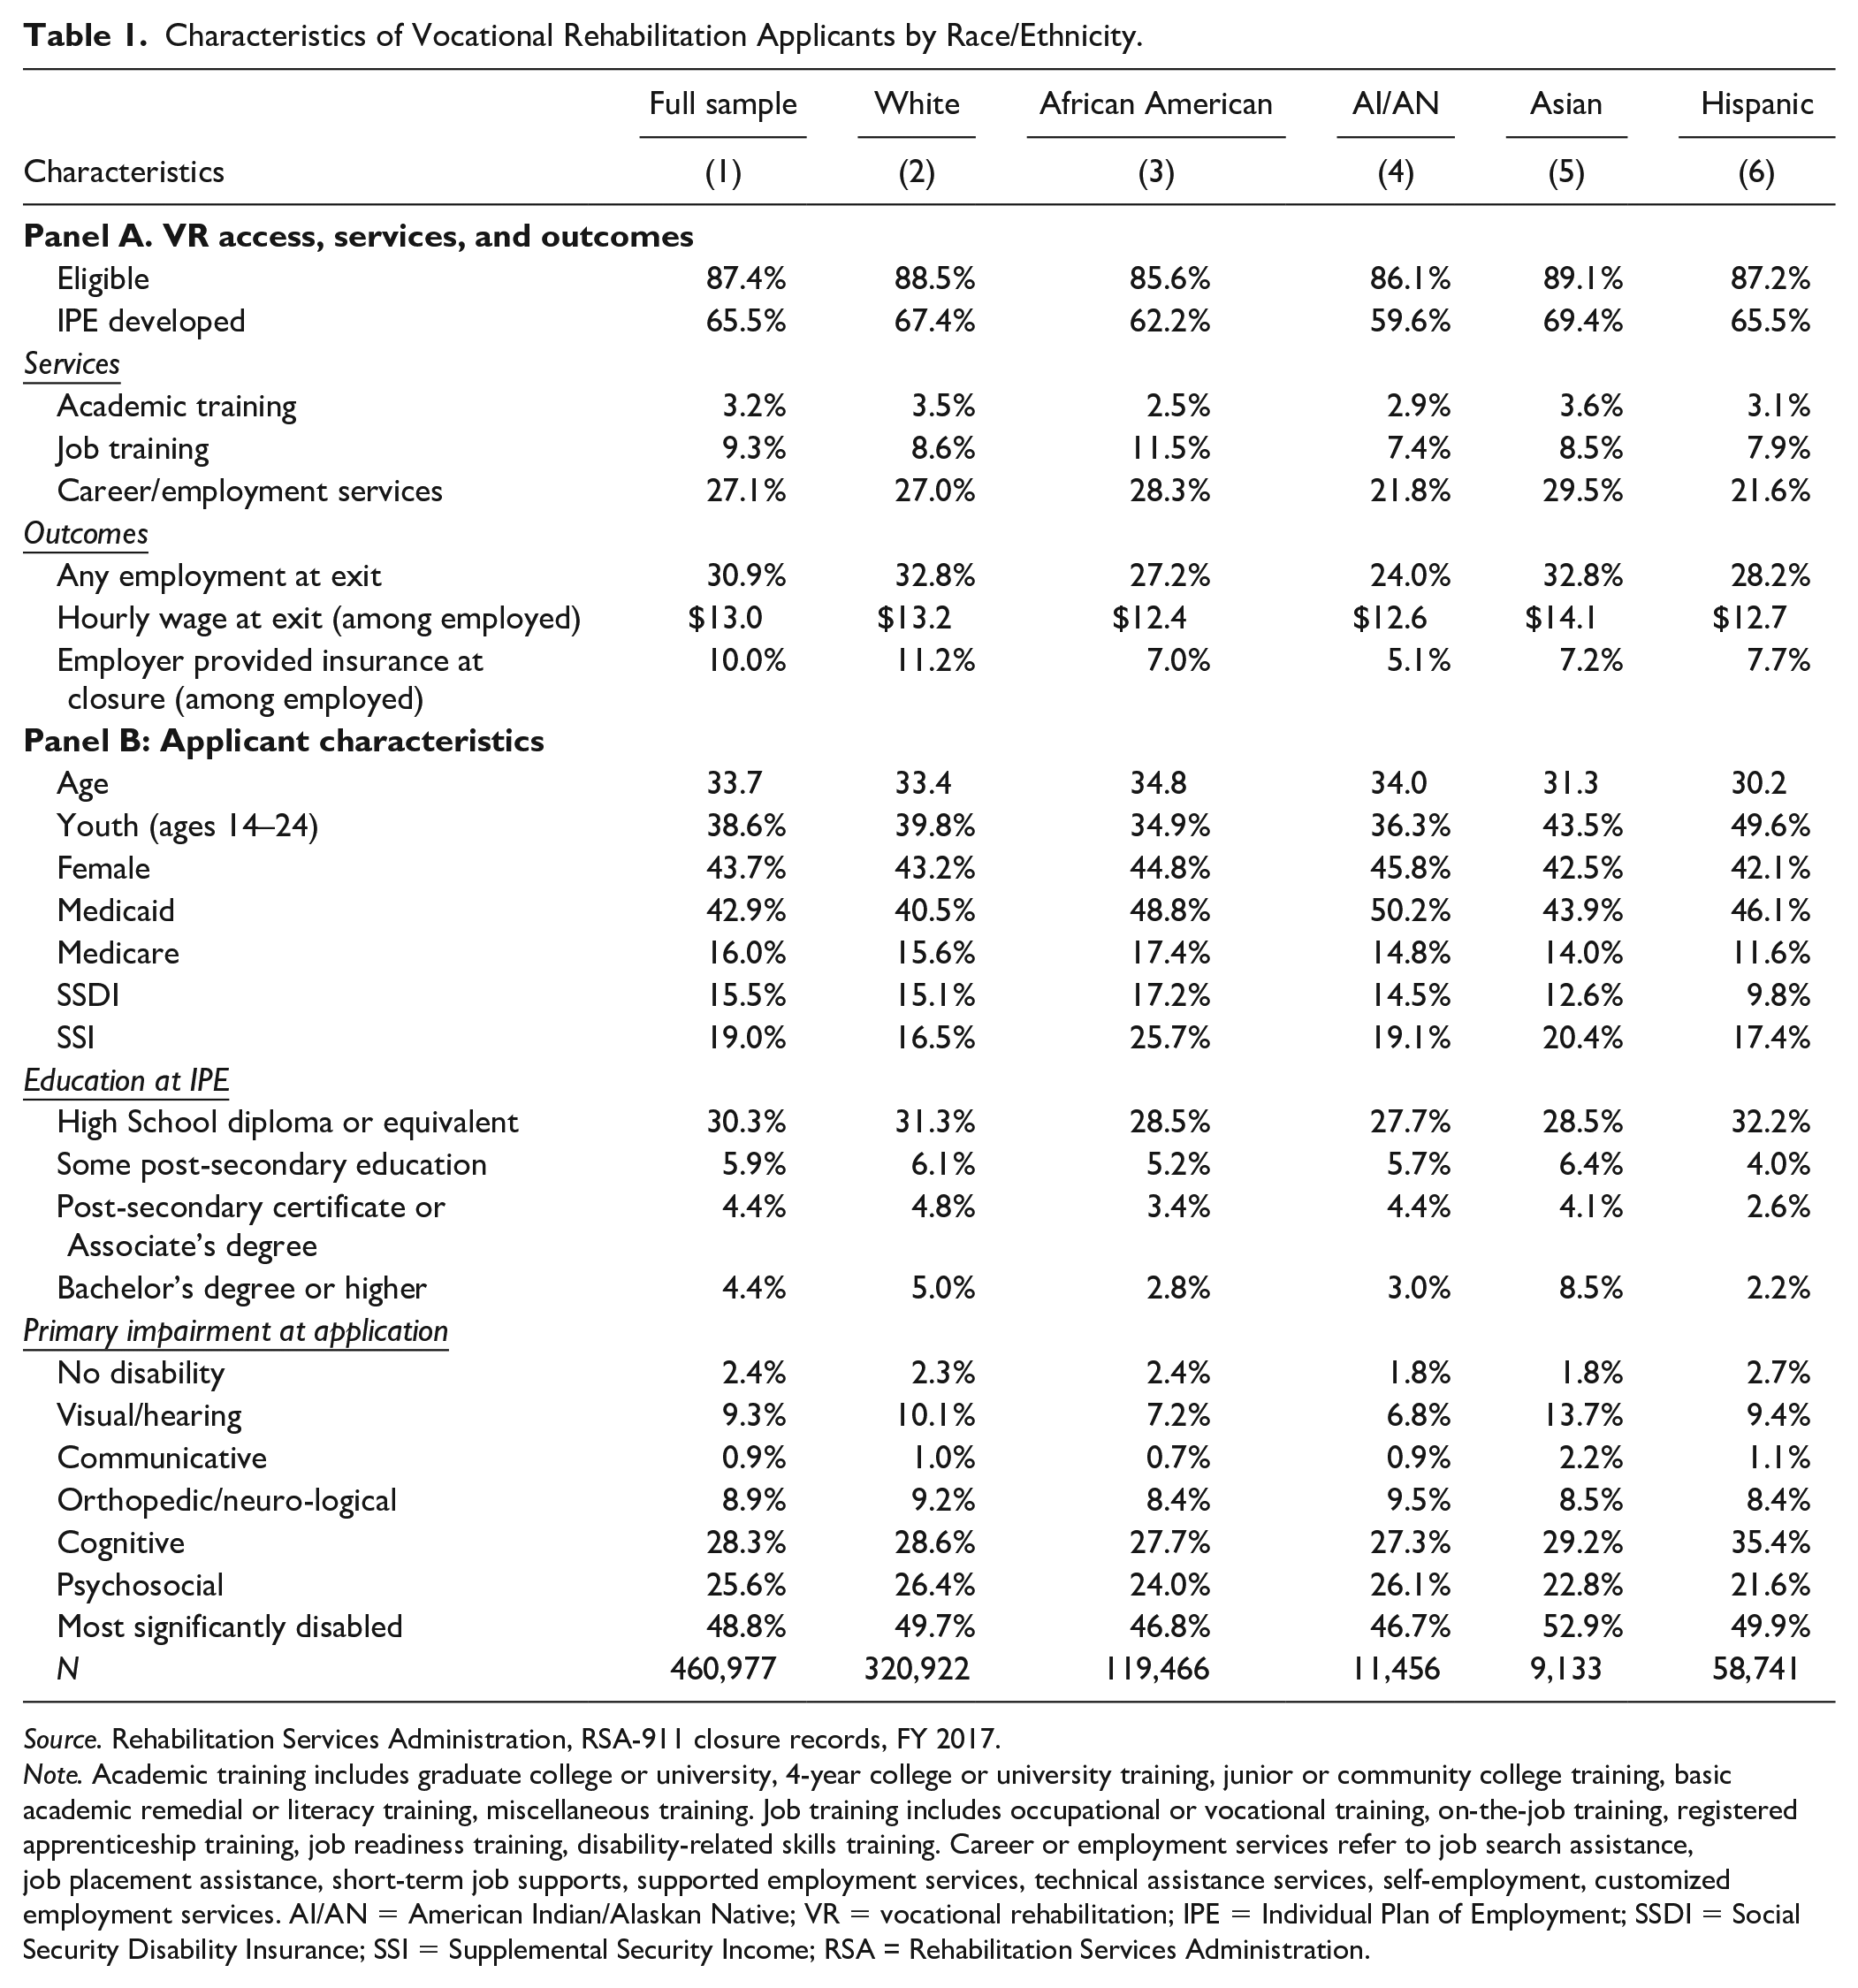
Source. Rehabilitation Services Administration, RSA-911 closure records, FY 2017.
Note. Academic training includes graduate college or university, 4-year college or university training, junior or community college training, basic academic remedial or literacy training, miscellaneous training. Job training includes occupational or vocational training, on-the-job training, registered apprenticeship training, job readiness training, disability-related skills training. Career or employment services refer to job search assistance, job placement assistance, short-term job supports, supported employment services, technical assistance services, self-employment, customized employment services. AI/AN = American Indian/Alaskan Native; VR = vocational rehabilitation; IPE = individual plan of employment; SSDI = Social Security Disability Insurance; SSI = Supplemental Security Income; RSA = Rehabilitation Services Administration.
We supplement the RSA-911 data with data from the 2017 American Community Survey (ACS) and publicly available information from the Kaiser Family Foundation (KFF). To calculate the number of IWDs who may be potentially eligible to apply for VR in each state from ACS 2017, we identified individuals between ages 15 and 64 with six types of disabilities as mentioned earlier. Next, to examine how state demographic, economic, and health care characteristics relate to VR application, service provision, and outcomes at closure, we constructed five demographic and seven economic variables from the ACS and three health care access variables from KFF. State-level demographic variables from ACS include (a) IWDs as a proportion of state population, (b) racial and ethnic composition of state population, (c) racial and ethnic distribution of state population of IWDs, (d) proportion of youth (ages 14–24) among IWDs, and (e) proportion of IWDs with a high school degree or higher. State economic variables include (a) unemployment rate, (b) poverty rate, (c) proportion of population on public assistance, (d) expenditures per capita, (e) unemployment rate by race/ethnicity, (f) poverty rate by race/ethnicity, and (g) proportion of population on public assistance by race/ethnicity. Poor health is an important barrier to employment for individuals with disabilities and may also determine whether they apply for and benefit from VR services. Due to systematic inequities in social determinants of health (U.S. Department of Health and Human Services, 2020), lack of access to health care can disproportionately affect health outcomes of individuals from racial and ethnic minorities, so we included a measure of access to health care at the state level using (a) uninsured rate, (b) number of hospital beds per 1,000 population, and (c) proportion of population residing in Health Professional Shortage Areas (HPSAs).
Application Rate
The application rate represents the flow of individuals ages 15 to 64 into a state VR agency. For each state, we calculate the percentage of VR applicants among the estimated state population of IWDs who could potentially seek and qualify for VR services from the 2017 ACS data. We restrict the sample to individuals between ages 15 and 64 who reported 1 of 6 types of disabilities: hearing, vision, physical, mental, self-care, and independent-living limitations (U.S. Census Bureau, 2017). The application rate is indicative of how well IWDs knew about and sought VR services—for example, whether communications and information about VR services and the application process are available in native languages or in culturally appropriate formats. The rate may also indicate the extent to which public program service providers (e.g., Medicare, Supplemental Security Income, and Social Security Disability Insurance) referred IWDs to VR agencies. Note, however, that not all IWDs require or are eligible to receive VR services; the VR program serves individuals whose disability poses a substantial barrier to employment but would not preclude them from benefiting from VR services in gaining employment. This implies that IWDs who are not seeking employment, who receive employment-related services from other public programs such as Medicaid, or whose disabilities are too severe to be able to benefit from VR services may not apply or be eligible for VR services. We should also note that environmental factors, such as accessibility of VR office locations across the state, labor market conditions, Medicaid eligibility requirements, and size and scope of other state programs that serve IWDs, may also affect whether individuals apply for VR services. For example, states with low unemployment rates may see lower proportions of individuals with disabilities applying for VR services. Without accounting for these characteristics, the denominator we use overestimates the potential VR clients in each state, which implies that this application rate represents the lower bound of the actual proportion of applicants to potential VR clients in each state.
Eligibility Rate
The eligibility rate measures the proportion of VR applicants who then become eligible to receive VR services. We calculate the percentage of applicants who were deemed eligible, defined as those with a non-missing eligibility determination date in the RSA-911 data, to receive services among the total number of applicants. Eligibility is determined based on presence of a disability causing impediment to work, significance of disability, and potential benefits of VR services to the applicant (Rehabilitation Services Administration, 2002). This rate is a measure of (a) the degree of alignment between applicant characteristics and VR eligibility requirements (i.e., whether IWDs who would meet eligibility criteria apply for VR services), and (b) how VR counselors screen and assess individuals’ disability severity and potential to benefit from the services. A state’s eligibility rate depends on whether information about VR services is available and accessible to the target population of the VR program. Eligibility rates may differ by race/ethnicity if information about VR services and referrals from other programs disproportionately reach and affect individuals from different racial and ethnic groups and people within these groups who are more or less likely to meet eligibility criteria for VR services. Differences in eligibility rates by race may also reflect VR counselor bias, which has been shown to be a source of determinations against African American VR applicants (Dziekan & Okocha, 1993; Wilson et al., 2001).
VR Service Rate (IPE Rate)
Next, from the RSA-911 data we calculate the proportion of IWDs eligible for VR services who had an IPE developed. The IPE signifies the beginning of formal VR services, and only those who have an IPE receive holistic services. The denominator includes only individuals who were assessed as eligible, and the numerator includes those who had an IPE developed. This rate captures whether racial differences exist during service provision. The IPE rate may depend on whether a state was operating under an Order of Selection in the 2017 fiscal year. States that anticipate not having sufficient fiscal and/or personnel resources to fully serve all eligible individuals implement an Order of Selection, which consists of priority categories assigned to applicants based on significance of disability. Under an Order of Selection, individuals with the most significant disabilities are selected first for the provision of VR services. Racial differences in disability significance among VR applicants, especially in states operating under Order of Selection, can influence differences in service rates among different groups of IWDs. In addition, differences in VR service receipt may reflect the biases and diminished expectations of service providers (Boyle, 1997; Wilson et al., 2001).
Relative Employment Rate
Calculating the relative employment rate involves two steps. We first calculate the VR employment rate from RSA-911 data, which indicates the proportion of VR clients who were employed at case closure out of those who had an IPE developed. The denominator is individuals who were assessed as eligible, and the numerator is the subset of those who obtained competitive and integrated employment at case closure. Note, however, that some VR clients may leave the system with employment without notifying VR or obtain employment after VR case closure. Therefore, this VR employment rate is likely an underestimation of positive labor market outcomes. The second step in calculating the relative employment rate is to divide the VR employment rate by the employment rate of IWDs in the state from ACS data. By comparing the employment rate for VR clients to that of all IWDs, this approach controls for the state-level economic environment, which could influence employment outcomes for all IWDs in a particular state. For example, a relative employment rate above 1.0 indicates that the employment rate of VR clients was above the employment rate for IWDs statewide, suggesting that VR services are correlated with improved employment outcomes.
Results
Descriptive Differences
The racial-ethnic differences in each step of the VR services can be observed from the summary statistics, as shown in Table 1 Panel A, columns (2)–(7). With the exception of Asian applicants, those from racial-ethnic minorities were less likely to be eligible for VR services compared with White applicants. Similarly, a lower proportion of applicants from racial-ethnic minority backgrounds received VR services, as indicated by the development of an IPE. States that were operating under Order of Selection in 2017 were required to prioritize individuals with the most significant disabilities. Higher rates of receiving VR service for White IWDs may be partially explained by higher proportion of White IWDs classified as having the most significant disabilities compared with applicants from racial-ethnic minorities.
Consistent with earlier studies (Feist-Price, 1995; Wheaton et al., 1996), we find that African Americans are more likely to receive training services while Whites are more likely to receive educational services. These differences persist in comparisons of provision of academic training within groups by level of education at application (HS diploma or equivalent, some post-secondary education, post-secondary certificate or associate’s degree, bachelor’s degree or higher), and in comparisons within age groups (youth–age at application <21, and adults–age at application >21). While American Indian/Alaska Native and Hispanic applicants received all services at lower rates, the differences were most pronounced for career and employment services (by approximately 6 percentage points). American Indian/Alaska Native applicants are more likely to reside in rural areas where geographic, economic, and cultural factors pose considerable challenges for the AIVRS program (Hopstock et al., 2002).
When comparing outcomes at case closure, IWDs from racial-ethnic minorities were less likely to be employed relative to White applicants. Similarly, among clients employed at closure, those from racial-ethnic minorities had lower wages and were also less likely to have employer-provided insurance coverage than their White counterparts. These differences may reflect the overrepresentation of racial-ethnic minorities in low-wage and often low-quality jobs (Fredericksen, 2015). Compared to White clients, Asian clients were more likely to be employed at closure, and received higher average hourly wages, but were less likely to have employer-provided insurance.
Racial-Ethnic Difference in VR Services
In this section, we present results from across-state comparisons of the four rates for five groups of individuals with disabilities—White, African American, American Indian/Alaska Native, Asian, and Hispanic.
Application rate
At the national level, the application rate for White IWDs was lower than the rates for other racial-ethnic groups, with the exception of Asian IWDs (Table 2). The application rates for the African American (10.2%) and American Indian/Alaska Native (9.2%) groups were twice as high as for the White group (4.7%). The application rates for African American IWDs were higher than the White application rate in all states, with the lowest difference in Mississippi and highest difference in South Dakota. For other states with large African American populations, including Delaware, Washington, D.C., Oklahoma, and North Carolina, the African American application rate was much higher than the White application rate—typically more than double. The American Indian/Alaska Native application rate was higher than the White application rate in all states except Vermont. State-level application rates tended to be higher for the Hispanic group than the White group, but the differences were smaller than the difference between the African American and White groups.
Application Rate and Eligibility Rate by Race/Ethnicity.
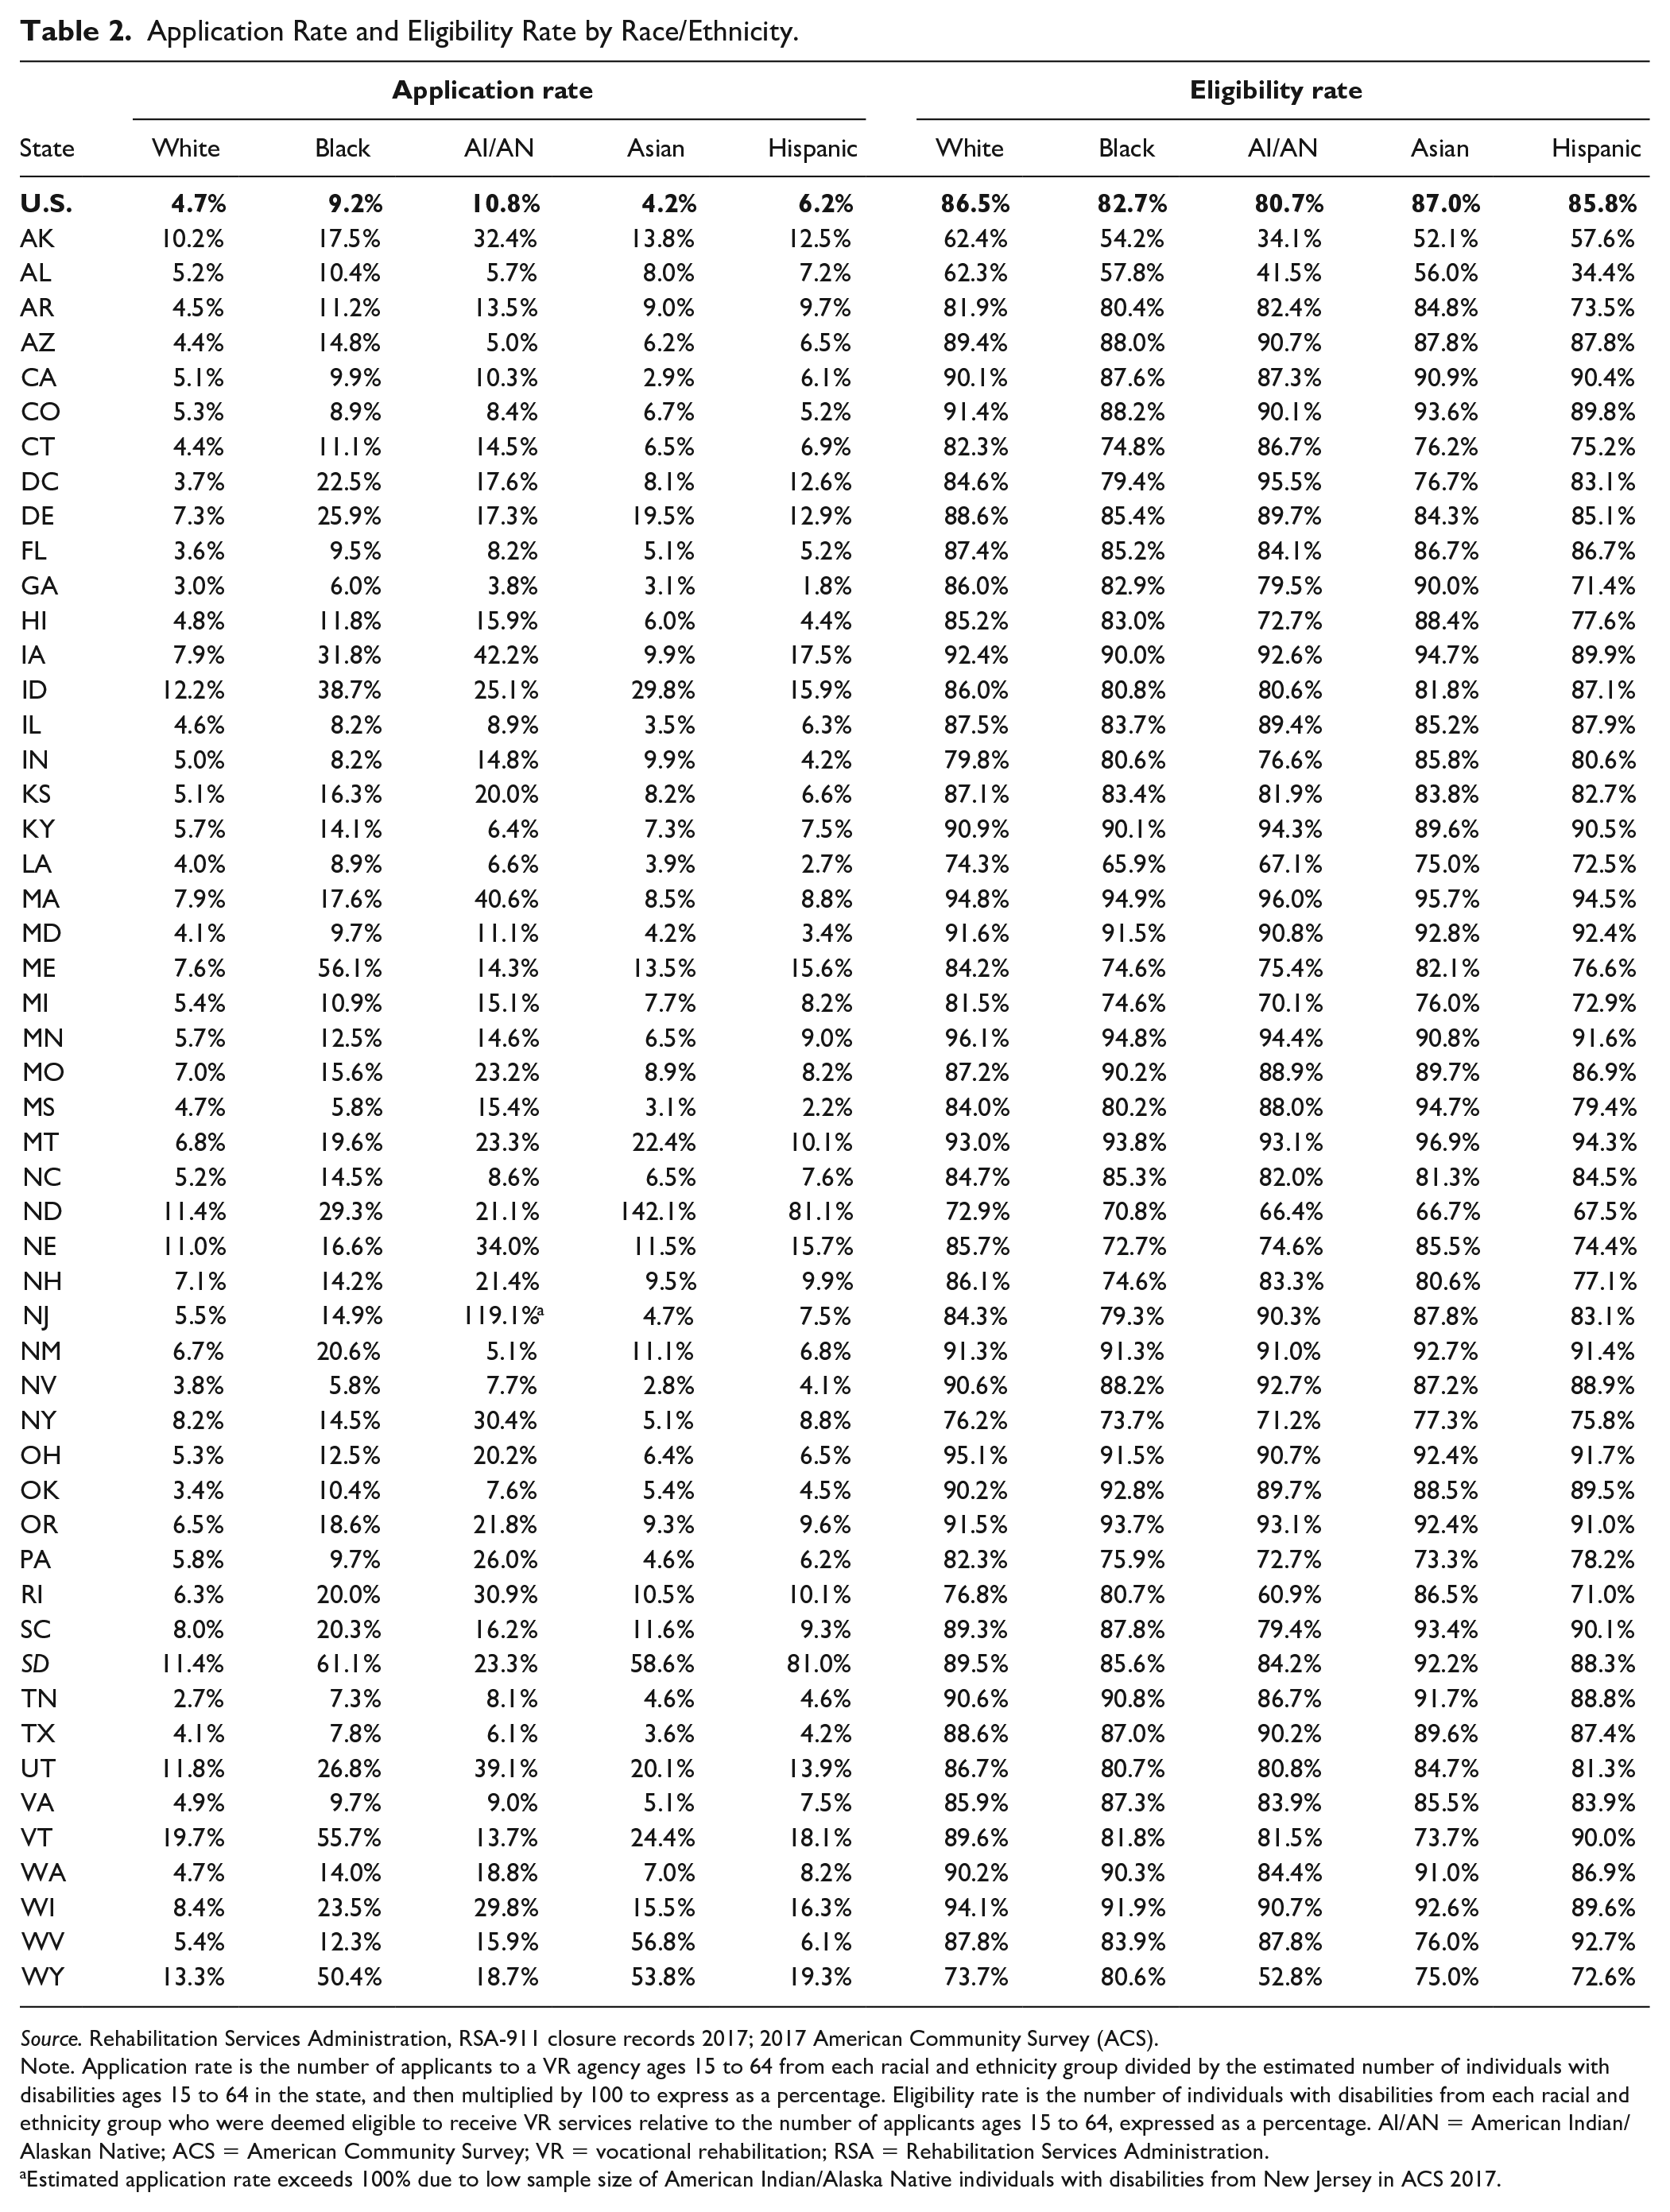
Source. Rehabilitation Services Administration, RSA-911 closure records 2017; 2017 American Community Survey (ACS).
Note. Application rate is the number of applicants to a VR agency ages 15 to 64 from each racial and ethnicity group divided by the estimated number of individuals with disabilities ages 15 to 64 in the state, and then multiplied by 100 to express as a percentage. Eligibility rate is the number of individuals with disabilities from each racial and ethnicity group who were deemed eligible to receive VR services relative to the number of applicants ages 15 to 64, expressed as a percentage. AI/AN = American Indian/Alaskan Native; ACS = American Community Survey; VR = vocational rehabilitation; RSA = Rehabilitation Services Administration.
Estimated application rate exceeds 100% due to low sample size of American Indian/Alaska Native individuals with disabilities from New Jersey in ACS 2017.
It is worth noting that, compared with White application rates, the application rates of different minority racial-ethnic groups appear to be positively correlated with each other. On one hand, we have states where the application rates for all minority groups were high relative to the White application rate, such as the District of Columbia, Maine, and Arizona. On the other hand, we have states where the application rates for all minority groups were low compared to the White rate, such as Mississippi and Indiana.
Eligibility rate
Nationally, as shown in table 2, the VR eligibility rates for African American (83%) and American Indian/Alaska Native (81%) IWDs were lower than those for White IWDs (86%). On the other hand, the eligibility rate for Hispanic IWDs (86%) was comparable to that of Whites. Across states, all minority groups except Hispanic IWDs had lower eligibility rates than White IWDs, though the differences were small. For African American IWDs, the variation in the state-level VR eligibility rates relative to Whites was small: Alaska, Nebraska, and New Hampshire ranked the lowest, and Wyoming, Rhode Island and Missouri ranked the highest. Other than in Alabama, the eligibility rates for Hispanic IWDs were more or less comparable to those for Whites, with 10 states where the eligibility rates were higher for the Hispanic group.
IPE rate
The patterns for the relative IPE rates are similar to the patterns observed for the relative eligibility rates (Table 3). Conditional on eligibility, all racial-ethnic minority groups had lower IPE rates than Whites, but the difference was small. Nationally, the VR IPE rates of African American, American Indian and Alaska Native, and Hispanic IWDs were 73%, 63%, and 75%, respectively, as compared to 75% for White IWDs. The range of variation for the African American and Hispanic groups were low, with Wyoming and Maryland as low outliers for African American IWDs and Georgia as a low outlier for Hispanic IWDs. Only a few states had higher IPE rates for African American IWDs (Alaska, Colorado, Maine, and Montana) and for American Indian and Alaska Native IWDs (Illinois, New Jersey, and West Virginia).
IPE Rate and Relative Employment Rate by Race/Ethnicity.

Source. Rehabilitation Services Administration, RSA-911 closure records 2017.
Note. IPE rate is the number of eligible applicants ages 15 to 64 who received services from a VR agency relative to the number of eligible applicants ages 15 to 64, expressed as a percentage. Employment rate is the number of eligible applicants ages 15 to 64 who closed from VR with employment outcomes relative to the number who were eligible to receive services. Relative employment rate shows the employment rate relative to the estimated employment rate of individuals with disabilities from each racial and ethnicity group in the state (as detailed in the methods section). N/A: estimated employment rate of all individuals with disabilities from the racial and ethnicity group in the state was zero, due to small sample sized in the ACS. IPE = individual plan of employment; AI/AN = American Indian/Alaskan Native; ACS = American Community Survey; VR = vocational rehabilitation; RSA = Rehabilitation Services Administration.
Relative employment rate
The relative employment rate measures how the employment rate of VR clients compares to the employment rate of all IWDs in the state within each racial-ethnicity group (Table 3). A relative employment rate above 1.0 indicates that the employment rate of VR clients was above the employment rate for IWDs statewide, suggesting that VR services are correlated with improved employment outcomes. Nationally, the relative employment rates for White, African American, American Indian and Alaska Native, Asian, and Hispanic IWDs were 1.67, 1.64, 1.22, 1.63, and 1.28, respectively, suggesting that IWDs from racial-ethnic minorities had lower improvement in employment outcomes following VR services compared to White IWDs. Four states (Louisiana, Hawaii, Montana, and Washington, D.C.) had a relative employment rate for White IWDs that was lower than 1. On the other hand, relative employment rates were lower than 1 for African American and Hispanic IWDs in 14 and 23 states, respectively. Although 16 states had relative employment rates for American Indians/Alaska Natives that were less than 1, there was a large variation across states in relative employment rate for American Indian/Alaska Native IWDs, ranging from 0.28 in New Hampshire to 14.42 in Kentucky. There are some positive correlations in employment outcomes among different racial-ethnic groups within states. On one hand, states such as Pennsylvania, Michigan, Alabama, and Mississippi rank among the highest in relative employment rates for all racial-ethnic groups. On the other hand, states such as Montana and Vermont rank among the lowest in relative employment rates for all racial-ethnic groups.
State-level factors
The correlation analysis of state-level factors and the rates by race revealed that a few factors were correlated with the application rate. Table 4 shows that a higher proportion of the White population in a state, both overall and among IWDs, is positively correlated with a higher application rate for White IWDs, but the reverse is true for African American IWDs. Access to health care services in the state, as measured by number of hospital beds per 1,000 in a state, is positively associated with application rates for Hispanic and Asian IWDs, but not for White or African American IWDs. We do not find any associations between state-level factors and eligibility rate, IPE rate, or relative employment rate across all racial-ethnic groups (results available upon request). These findings suggest that state factors may affect the decision to apply for VR services differently by racial and ethnic background. But external factors are unlikely to explain the differences in eligibility rate and IPE rate, which is reasonable, because once IWDs apply, agency characteristics such as caseload per counselor and Order of Selection may be more relevant determinants of the subsequent steps in the VR process. However, it is surprising that state economic characteristics are uncorrelated with relative employment rates for any of the racial-ethnicity groups.
Correlations Between Application Rates and State-level Factors.
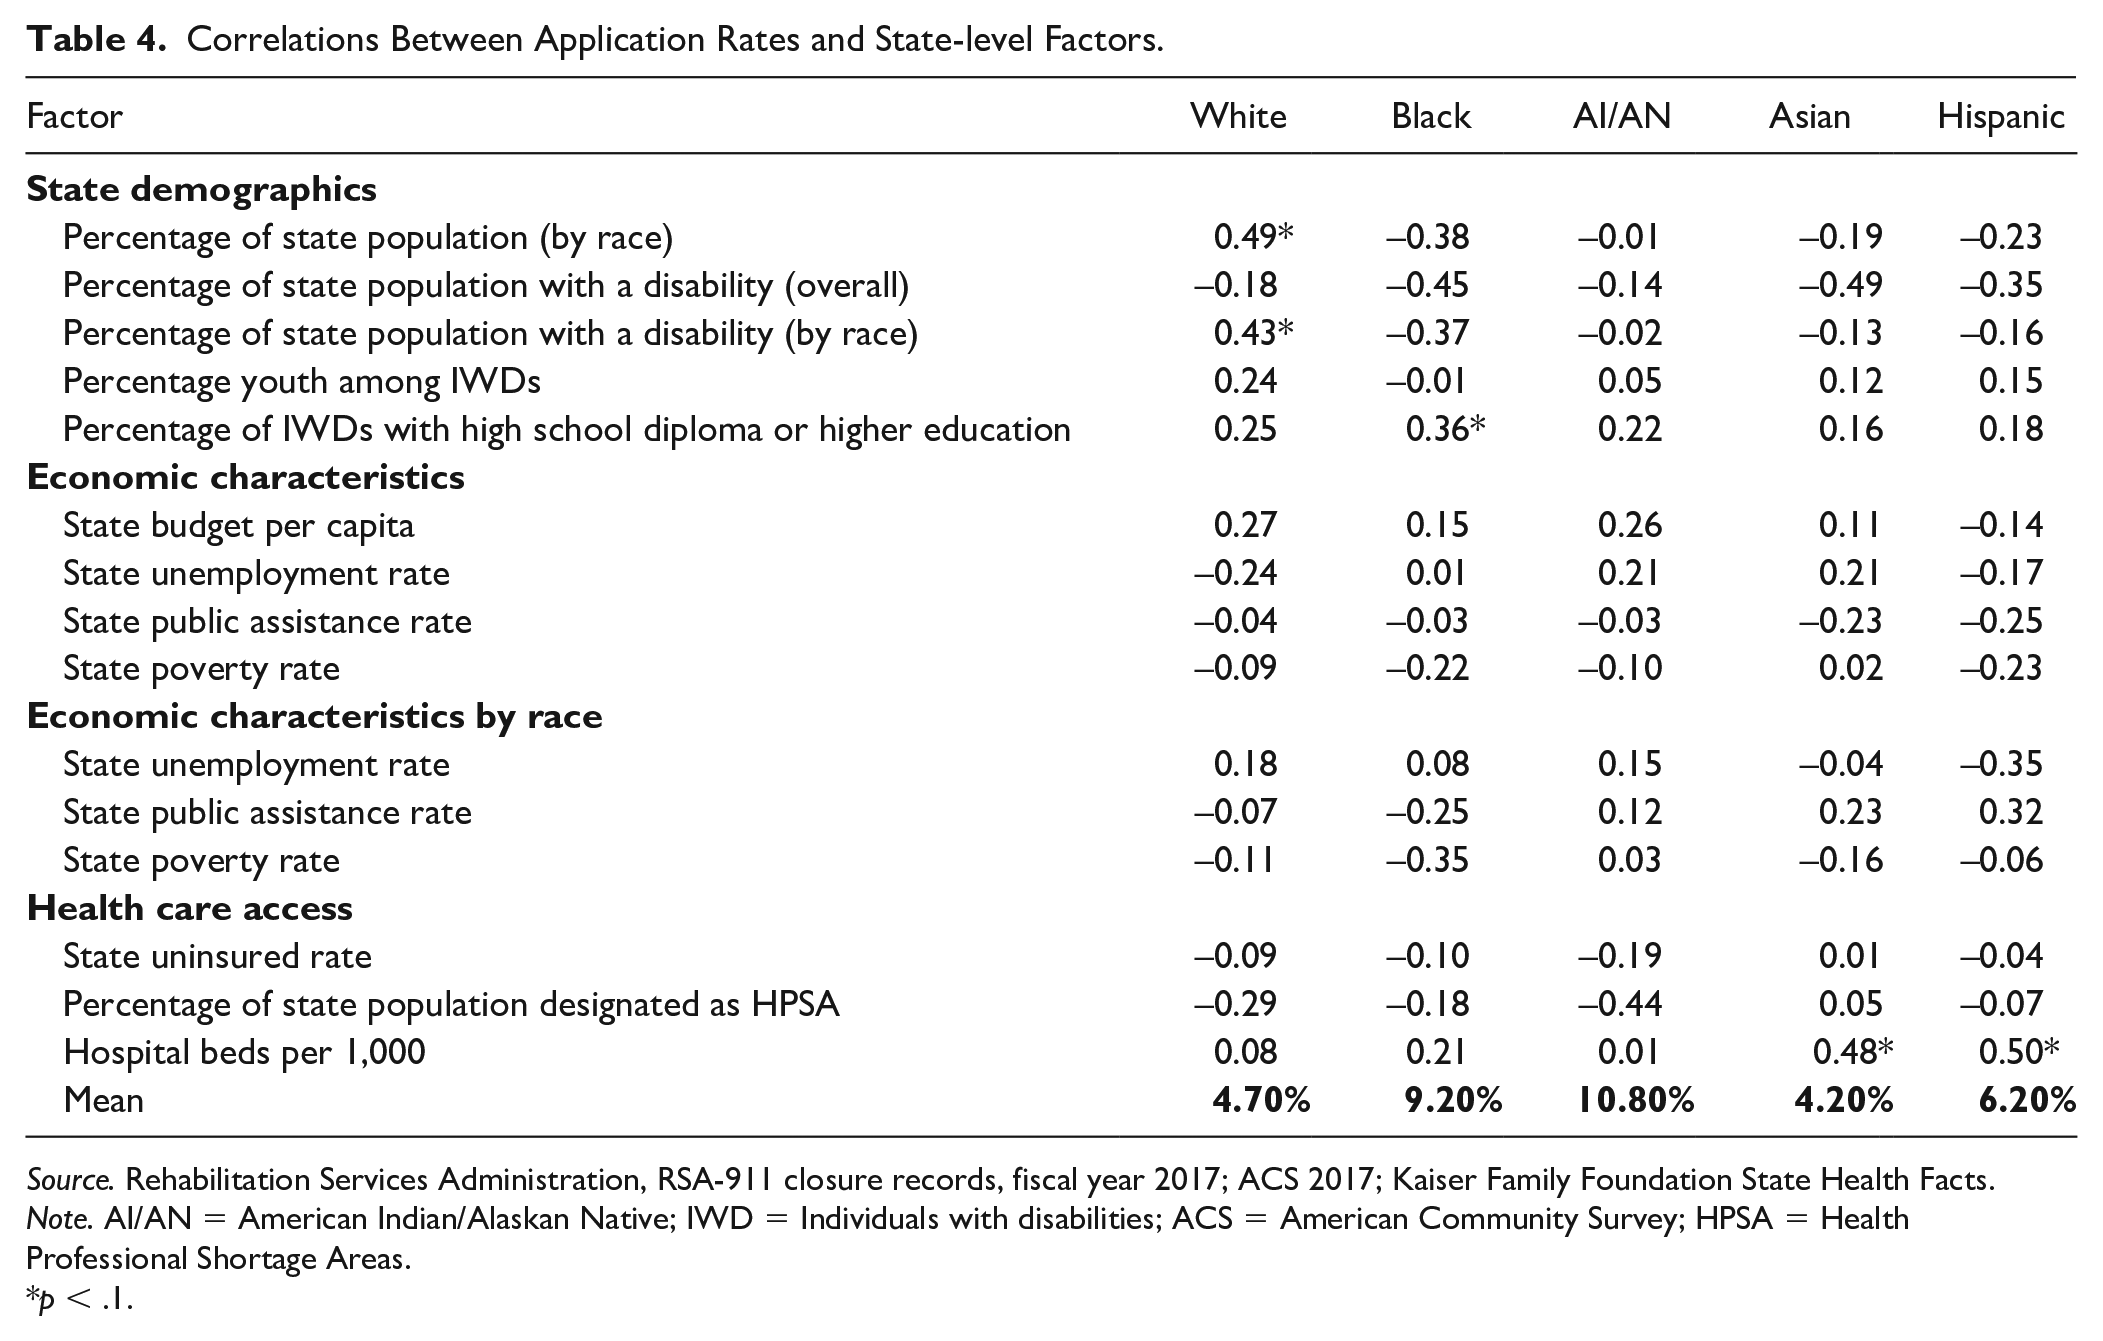
Source. Rehabilitation Services Administration, RSA-911 closure records, fiscal year 2017; ACS 2017; Kaiser Family Foundation State Health Facts.
Note. AI/AN = American Indian/Alaskan Native; IWD = Individuals with disabilities; ACS = American Community Survey; HPSA = Health Professional Shortage Areas.
p < .1.
Discussion
This paper provides a comprehensive and up-to-date investigation of racial differences in the entire VR service process. At the national level, we find that African American, American Indian/Alaska Native, and Hispanic IWDs apply for VR services at a higher rate than White IWDs but have lower eligibility rates conditional on application, and lower rates of receiving services conditional on meeting eligibility criteria. White IWDs also have much higher relative employment rates compared with all other racial-ethnic groups. Within each racial-ethnic group, eligibility and service provision rates do not vary widely across states, but we find large variation in application rates and relative employment rates.
As racial-ethnic minority groups face greater employment barriers and may be less likely to be employed without VR support, higher application rates among African American and Hispanic IWDs than White IWDs is not surprising. After VR application, however, they are less likely than White applicants to meet VR eligibility criteria and to receive services, which might reflect racial-ethnic disparity in the VR service process. First, although a higher proportion of IWDs from racial and ethnic minorities apply for VR services, the available information about the VR program may be insufficient to target the IWDs who would meet eligibility criteria. For example, a lack of culturally and linguistically relevant information can be a reason for a mismatch in applicant characteristics and VR eligibility requirements. Second, a few earlier studies point to VR counselor bias as a source of differential determinations against African American VR applicants (Dziekan & Okocha, 1993; Wilson et al., 2001). In other words, VR counselors may only select clients who are more likely to be employed at VR closure or offer more effective services based on racial bias. Furthermore, lack of racial-ethnic diversity among VR counselors could also pose challenges in serving diverse groups of IWDs, in turn leading to disparities in the VR process (Whitney-Thomas et al., 1999).
Our findings should be interpreted with the following qualifications. First, both national and state-level findings are descriptive and do not account for individual characteristics (such as educational attainment or employment history prior to VR), state-level demographics and economic characteristics (e.g., racial composition of IWDs in the state or unemployment rate), or agency-level characteristics that may affect outcomes differentially for racial-ethnic groups (such as proportion of counselors from diverse racial backgrounds). Therefore, our results do not reflect the quality of VR services or the causal impact of VR services on clients’ employment outcomes. This concern is somewhat alleviated by the fact that few state-level factors correlate with VR application, but there were no strong associations between state-level factors and VR services or employment outcomes. Second, we only observe employment outcomes for VR clients who received services and were employed at case closure. In other words, we are likely underestimating the employment rates for VR clients who were employed and exited the system before completing all services outlined in the IPE. If this occurs disproportionally for White IWDs, our rates may underestimate the magnitude of racial-ethnic differences in employment outcomes. Finally, small samples sizes for certain racial-ethnic groups within a state may influence the four rates, especially for American Indian/Alaska Native group.
Conclusion
Racial differences in access to and use of VR services have been documented since 1938. Our findings show that the patterns have not changed significantly over time, despite numerous pieces of disability-rights legislation and continuous investment in VR services. Our findings are consistent with other literature on racial differences in public and private service access and quality. For instance, racial-ethnic minorities face greater challenges in having access to medical care in the United States, partially due to disparities in health insurance coverage rates (Lillie-Blanton & Hoffman, 2005). For those who do receive care, the quality of care may not be equivalent to that for other groups. The VR program has tremendous potential to reduce disparities in labor market outcomes and the well-being of IWDs from racial-ethnic minorities. However, racial-ethnic differences in the process can hinder the effectiveness of the VR program in helping this population, which faces a double burden of disability and social challenges that poses substantial barriers to employment. These findings call for systemic reviews of VR practices and strategies in serving IWDs from racial and ethnic minorities, as well as trainings and supports for VR counselors and service providers on topics such as competent communication strategies and overcoming unconscious biases. For each racial or ethnic group, we also find sizable variations in application rates and employment outcomes across states, indicating a need for performance measures to monitor potential disparities and challenges faced by IWDs at the state level. To ensure racial and ethnic equity in the VR process, the four rates by race and ethnicity described in this study may serve as a starting point for such monitoring, along with guidelines for VR agencies to adopt culturally relevant strategies, such as communications in native languages or employer education programs.
This study makes several contributions to the literature and the field. First, we provide an updated analysis of racial-ethnic differences in the current VR service process at both the national and state levels. Second, we examine the racial differences at each stage of the VR process, including application, eligibility determination, service receipt, and employment outcomes at closure. Third, our study informs development of potential performance measures to monitor and address racial disparities in the VR process. Findings from our study point to several directions for future research. Currently, data on VR counselors are not collected systematically, which prohibits us from performing an analysis on how VR counselor characteristics affect racial differences in VR process. Future studies that collect such data can fill this gap and shed light on the mechanism behind the observed racial differences. Studies that explore the reasons for cross-state disparities in the VR process will also help VR agencies design appropriate strategies to enforce racial equity. Finally, the mechanism behind racial differences in VR services is complex in that it is not only determined by provider behavior, but also in such factors as client preferences and geographical variability. Studies that systematically examine the ecosystem of VR service provision process is much needed.
Footnotes
Acknowledgements
The authors would like to acknowledge the Data Collection and Analysis Unit at the Rehabilitation Services Administration U.S. Department of Education for providing the Case Service Report (RSA-911) data used in this study. Findings and conclusions expressed in this study are solely those of the authors, not those of RSA.
Declaration of Conflicting Interests
The author(s) declared no potential conflicts of interest with respect to the research, authorship, and/or publication of this article.
Funding
This study is supported by the American Institutes for Research as part of a research series on the topic of disability employment.