



Abstract
Recent years have seen persistent tension between proponents of big data analytics, using new forms of digital data to make computational and statistical claims about ‘the social’, and many sociologists sceptical about the value of big data, its associated methods and claims to knowledge. We seek to move beyond this, taking inspiration from a mode of argumentation pursued by Piketty, Putnam and Wilkinson and Pickett that we label ‘symphonic social science’. This bears both striking similarities and significant differences to the big data paradigm and – as such – offers the potential to do big data analytics differently. This offers value to those already working with big data – for whom the difficulties of making useful and sustainable claims about the social are increasingly apparent – and to sociologists, offering a mode of practice that might shape big data analytics for the future.
Introduction
Our article is intended to make an original contribution to the debate on ‘big data’ and social research. This is grounded in our own reflections on the ‘big data’ both as an empirical phenomenon and an emergent field of practice in which claims to knowledge are made, not least about the social world (Halford, 2015; Halford et al., 2013; Savage, 2013, 2014; Savage and Burrows, 2007, 2009; Tinati et al., 2014). The term ‘big data’ was originally coined to describe data sets so large that they defied conventional computational storage and analysis (Manovich, 2011), however the term now encompasses a range of other qualities immanent in the digital traces of routine activities – for example, as we consume utilities, browse the Web or post on social media – not least their variety and velocity (Kitchin and McArdle, 2016). These data offer insights into the daily lives of millions of people, in real time and over time, and have generated a surge of interest in social research across the academy and, especially, in commerce (Bail, 2016; Langlois et al., 2015; Mayer-Schönberger and Cukier, 2013; Watts, 2011).
In this context, it has become commonplace to identify a ‘coming crisis’ in which sociology is losing jurisdiction over the collection and analysis of social data (Frade, 2016; Ryan and McKie, 2016; Savage and Burrows, 2007). Indeed, the hyperbolic claims of early big data proponents herald this explicitly:
This is a world where massive amounts of data and applied mathematics replace every other tool that might be brought to bear. Out with every theory of human behaviour, from linguistics to sociology […] Who knows why people do what they do? The point is they do it, and we can track and measure it with unprecedented fidelity. With enough data the numbers speak for themselves. (Anderson, 2008)
Statements like this have provoked a robust response from sociologists, many of whom are deeply sceptical about approaches to data, method and theory in big data analytics (Crompton, 2008; Frade, 2016; Goldthorpe, 2016). Claims that big data can replace all other forms of knowledge are patently unfounded. These data capture only some activities, of particular people, using certain devices and applications intended to record specific information: the data are biased and partial, although often lacking in demographic detail and other information about their provenance that allow us to be clear about this (McFarland and McFarland, 2015; Park and Macy, 2015; Shaw, 2015). Furthermore, sociologists are critical of the dependence of big data analytics on computational methods, particularly speculative data mining using variants of pattern recognition and correlation. Discovering patterns in data, with little sense of meaningful questions, or means of conceptual interpretation, and reliance on ‘black-boxed’ analytical tools is linked to limited, sometimes mistaken and ethically concerning, claims to knowledge (Kitchin, 2014a; Pasquale, 2014). Not least, the emphasis on patterns and correlations by-passes theoretically informed research questions and displaces the hermeneutic and critical analysis so central to sociology (Couldry, 2015). Thus, while some sociologists are starting to make important methodological inroads into working with big data (DiMaggio, 2015; Lee and Martin, 2015; Marres and Gerlitz, 2016; Williams et al., 2017) this work has not yet had a strong influence on mainstream sociological debates and a powerful scepticism remains, crisply summarised by Goldthorpe (2016: 80–81): ‘[w]hatever value big data may have for “knowing capitalism”, its value to social science has […] [f]or the present at least, to remain very much open to question’.
Our concern is that this corners sociology into a defensive position, marginalising us from a new and increasingly powerful data assemblage that is coming to play an important part in the production of information and knowledge in the 21st century. At worst, we suggest, sociologists should engage with big data analytics because it is happening, with or without us. Better, big data may offer new resources for sociological research, resources that – unfamiliar or not – are only accessible through computational techniques (Kitchin, 2014a). At best, sociology might seek to play a central role, shaping evolution of big data analytics.
This is an opportune time to explore these possibilities, as it becomes increasingly clear that the big data paradigm is far from settled, that there is a deep uncertainty regarding how best to ‘do’ big data analytics. The early naivety of the big data evangelists has started to wane, not least in the wake of the Google Flu Trends experiment, once the poster child for big data analytics, which turned out to be better at using browser data to trace the spread of worries about the symptoms of flu than it was at predicting the spread of the virus itself (see Lazer et al., 2014 for further details). By 2013 Wired magazine (26 August) was presenting a more tempered account of big data, reporting that as ‘an increasing number of experts are saying more insistently […] Big Data does not automatically yield good analytics’ and insisting that ‘Big Data is a tool, but should not be considered the solution’. As the hype recedes and the new field of ‘data science’ seeks to build credible research, we see calls for greater engagement with ‘domain expertise’ – the traditional academic disciplines – particularly from big data practitioners whose aspirations lie beyond commercial data applications and towards deep social concerns and longer term historical problems (O’Neill and Schutt, 2014).
At this juncture there is an opportunity – perhaps a responsibility – for sociologists to show what we can offer and to explore where this might take our discipline. We are under no illusion about the difficulties (Halford, 2015; Halford et al., 2013). However, rather than rehearse these, we aim instead to develop a constructive and prospective line of thinking about future directions. We argue that sociologists might take inspiration from data innovation elsewhere in the social sciences, specifically from three of the most successful social science projects of recent years – Thomas Piketty’s Capital (2014), Robert Putnam’s Bowling Alone (2000) and Richard Wilkinson and Kate Pickett’s The Spirit Level (2009). While none of these authors use big data, their approach constitutes an innovative form of data assemblage that we call ‘symphonic social science’. This, we will argue, might pave the way for sociologists to shape future developments in big data analytics, perhaps to play a central role in setting the pace in this field as we move forward into the 21st century.
In the following section, we introduce symphonic social science and its innovative model of data analysis. Section 3 explores the potential significance of symphonic social science for debates on big data, leading to Section 4 which suggests how future approaches to big data analysis might build on this. In Section 5 we recognise that achieving this will require new forms of collaboration across the social and computational sciences and suggest that the symphonic social science emphasis on visualisation may be a key to this. Our conclusion revisits our core claim, that symphonic social science offers a potential bridgehead through which the trajectories of sociology and big data analytics might be readjusted towards a more mutually productive future.
Symphonic Social Science
Recent years have seen a shift in the cutting edge of social scientific analysis. Whereas in previous generations it was social theorists – often sociologists – such as Habermas, Giddens, Foucault and Beck who commanded public as well as academic debate, it is now social scientists of data – Piketty (2014), Putnam (2000) and Wilkinson and Pickett (2009) – who are at the fore. These authors command ‘big picture’ arguments which offer a distinctive renewal of what we, as sociologists, would term ‘the sociological imagination’. Not only have their books had a profound impact in the academic world, promoting extensive theoretical debate and establishing major new streams of research, they have also had huge popular take up and have shaped political debate and social policy around the world. These works are not a linked movement and have no affiliation to ‘big data’. Nonetheless, they suggest an innovative social scientific approach to data assemblage with potentially profound consequences for the future of big data analytics.
Taken together, these books establish a new mode of argumentation that reconfigures the relationship between data, method and theory in a way that bears both striking similarities and key differences to the assemblages of big data analytics. We call this ‘symphonic social science’. These books contain substantially different arguments and topics and have varying disciplinary homelands (political science, epidemiology and economics respectively). Notably none originates in sociology, although all have shaped sociological debates. However, our concern here is not with their substantive arguments but with the power of their analytical strategies and style of argumentation. The striking similarities across all three books are summarised in Figure 1.
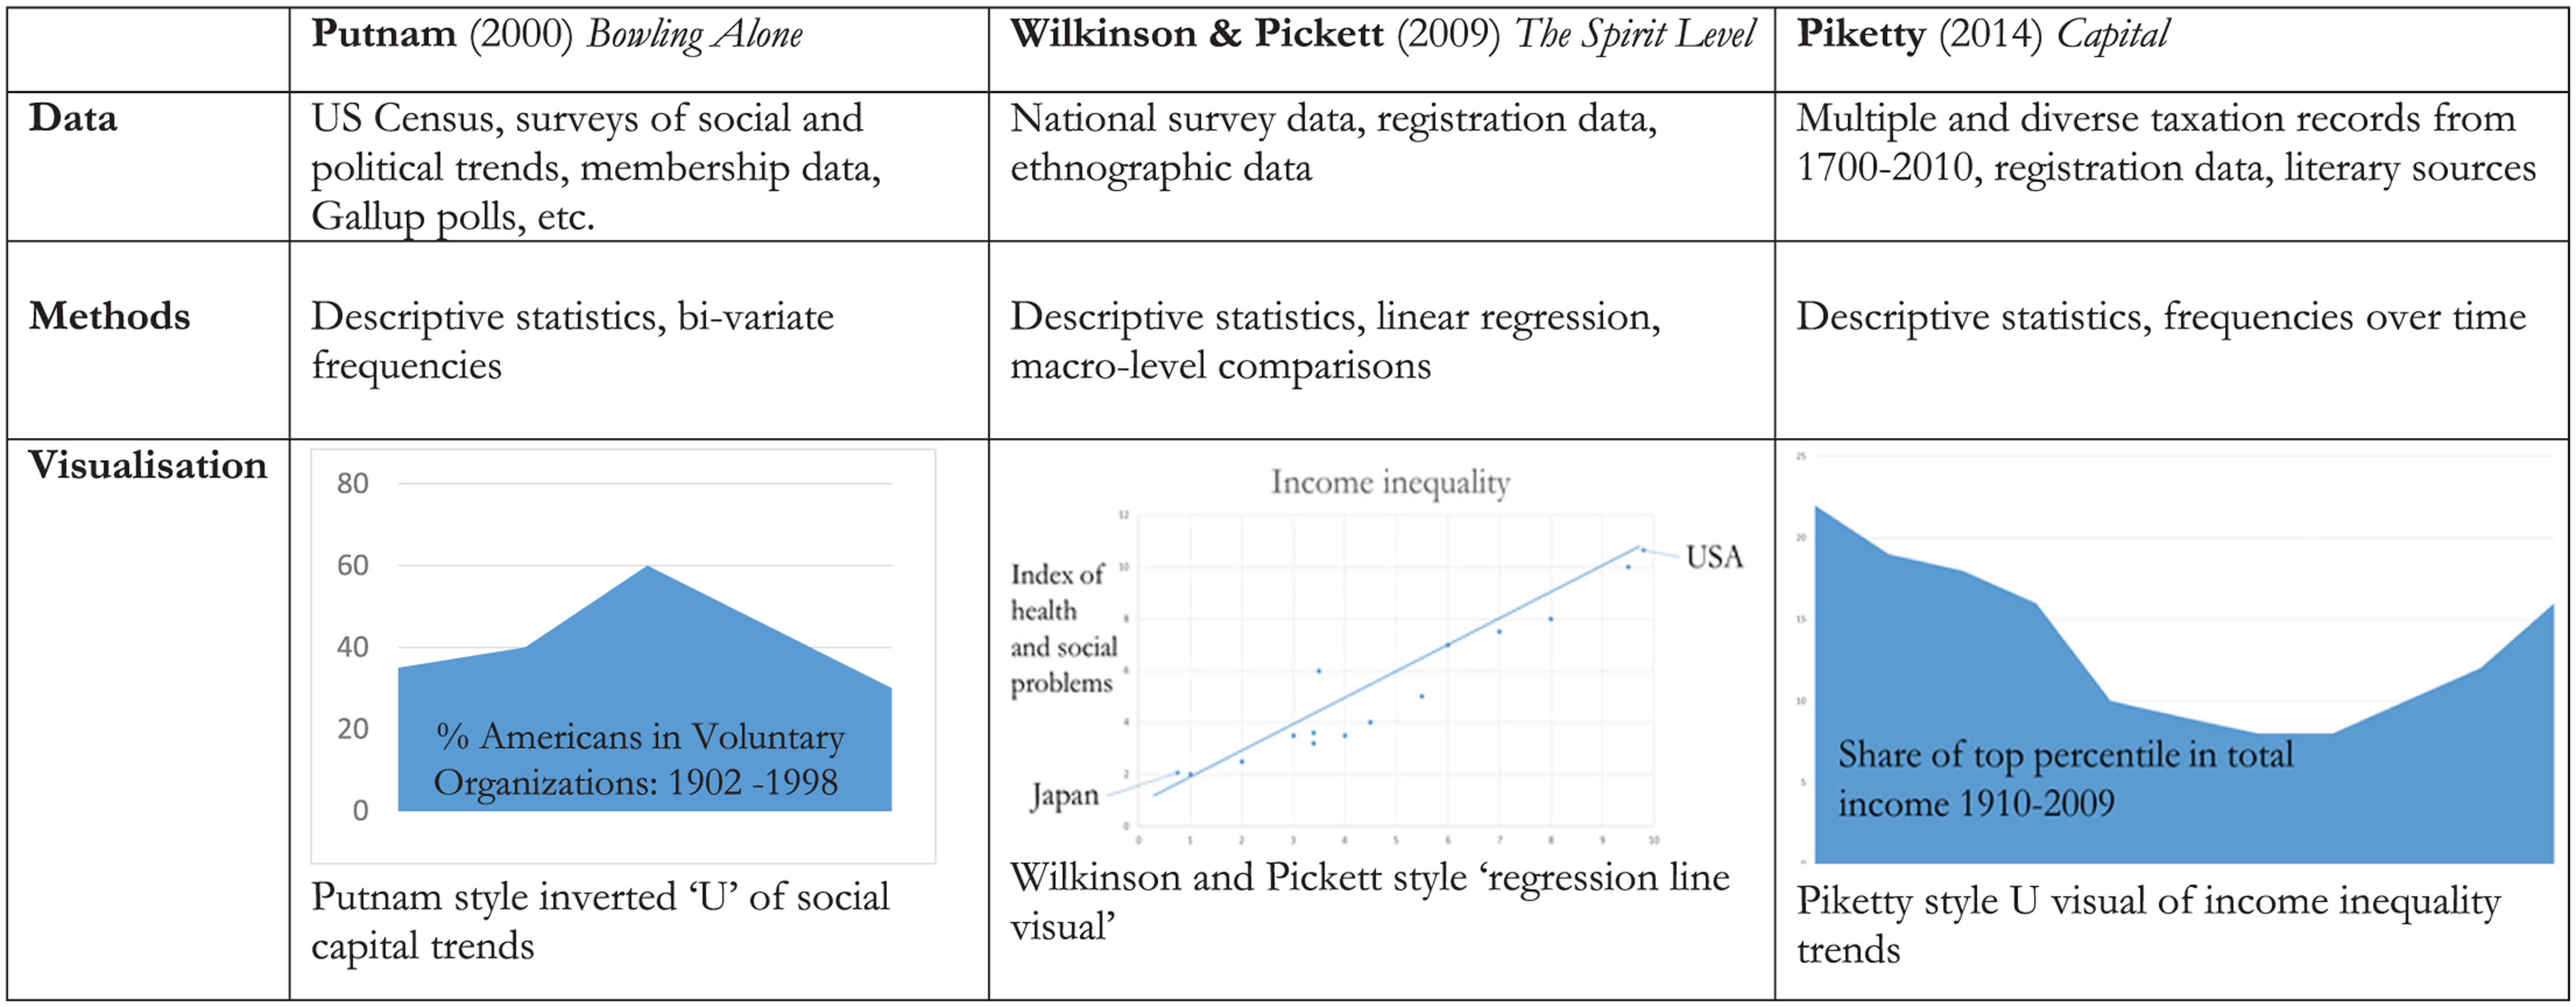
Symphonic social science.
These are all, fundamentally, ‘data-books’. Each deploys large scale heterogeneous data assemblages, re-purposing findings from numerous and often asymmetrical data sources – rather than a dedicated source, such as a national representative sample or an ethnographic case study. These works build on earlier traditions of comparative analysis, using strictly comparable forms of data (e.g. Erikson and Goldthorpe, 1992; Inglehart, 1997) but are innovative in the use of far more diverse data sources to make their comparative points. Bowling Alone uses the US Census, surveys of social and political trends, membership data from 40 organisations, the General Social Survey, Gallup polls and so on. Similarly Wilkinson and Pickett proceed by comparing very different kinds of national data sources, including surveys, but also registration data and patient records. Thus they demonstrate across numerous domains how inequality affects social ‘problems’. Similarly Piketty is critical of sample surveys, and instead deploys extensive data from the World Incomes Database – painstakingly assembling taxation data from numerous nations – to show long term trends in income and wealth inequality, most notably emphasising that recent decades have seen a shift towards a concentration of income and especially wealth at the top levels. Although the arguments of all three books have provoked heated debate about theory and methods (e.g. Goldthorpe, 2010), they have nonetheless helped to address some of the central intellectual and policy puzzles of our times. Our point is that despite all the rhetoric about big data, it is actually social scientists who have taken the lead in showing how novel data assemblages can be deployed to make powerful arguments about social life and social change that shape academic and public debate.
How have they done this? Drawing these data together into a powerful overall argument, each book relies on the deployment of repeated ‘refrains’, just as classical music symphonies introduce and return to recurring themes, with subtle modifications, so that the symphony as a whole is more than its specific themes. This is the repertoire that symphonic social science deploys. Whereas conventional social science focuses on formal models, often trying to predict the outcomes of specific ‘dependent variables’, symphonic social science draws on a more aesthetic repertoire. Rather than the ‘parsimony’ championed in mainstream social science, what matters here is ‘prolixity’, with the clever and subtle repetition of examples of the same kind of relationship (or as Putnam (2000: 26) describes it, ‘imperfect inferences from all the data we can find’) punctuated by telling counter-factuals.
Wilkinson and Pickett, for example, repeatedly deploy linear regression using multiple data sources to demonstrate the relationship between income inequality and no less than 29 different issues from the number of patents to life expectancy. At the same time they offer careful moderation of their claims, for example showing that average income makes no difference to health and well-being, under-scoring the significance of inequality in contrast to conventional economic growth models that focus on gross national product (GNP) or aggregate levels of economic development. Similarly, Piketty piles up repeated examples of the growing concentration of wealth across different nations so that the power of his arguments is demonstrated through the extensiveness of the data underpinning them (Savage, 2014). It is not that these authors are disinterested in causality – far from it – but rather that causality is established through the elaboration and explication of multiple empirical examples. Although all the authors are quantitative experts, they do not use complex statistical models but repeat the evidence of correlation in a claim to causality, underpinned by theoretical argument.
Visualisation is central to mobilising the data assemblages in each case (see Figure 1). This is unusual in the social sciences which – beyond the specialist field of visual methodology – have historically preferred text and numerical tables to make claims. In contrast, all three books use a core visual motif to link correlations from diverse data sources and present an emblematic summary of the overall argument. For Piketty, this is the U-shaped curve, which makes 26 appearances from the opening of the book onwards. These U-shaped curves are used to examine the proportion of capital compared to national income, and the proportion of national income earned by top earners, standardising across different measures through a common visual refrain demonstrating that the proportion of national income taken by the top decile of the population changes from high points in the early 20th century, falling from 1940–1980 and rising again to 50 per cent by the early 2000s. Throughout, Piketty’s key device is to standardise measures by expressing them as relative proportions to a national or global average (Savage, 2014), rather than in absolute terms.
Similarly, Wilkinson and Pickett present their linear regressions as figures, rather than tables, with a standardised x-axis – measures of inequality – plotted against a y-axis with diverse dependent variables measuring no less than 38 different social ‘problems’. While the method has been challenged (Saunders and Snowdon, 2010) our point is that these repeated visual refrains are key to the effectiveness of the argument presented. Similarly, Putnam’s argument about the rise and fall of social capital in the USA is presented throughout the book as an inverted U-shape: membership of associations rises up to the 1960s, then falls thereafter. In each case the core visual motif provides a kind of ‘optical consistency’ (Latour, 1985) that holds diverse and repetitive data sources together and summarises the argument in a far more accessible way than statistical tables, which would require individual inspection and comparison in order to distil a clear argument.
This is not empiricism. All these writers have powerful theoretical arguments. For Putnam, this is a quasi-communitarian view of the value of interaction in formal settings for generating social capital. For Wilkinson and Pickett, theory is drawn from social psychology to focus on how shame and stigma generate deleterious effects. Piketty’s economic theory is expressed in his ‘fundamental laws’ of capitalism. However, for all three, theoretical arguments are not formally or deductively laid out but are woven into the data analysis. Here, again, visuals play a key role. In each case, there is a careful consideration of how to produce visuals to a template that will render these theoretical arguments legibly. In Piketty’s case, for example, this involves his rendering of capital as a proportion of national income. More than illustration, the image is a carefully constructed analytical strategy, inscribing the evidence, method and argument in a ‘cascade’ (Latour, 1985) of repeated instantiations that insist on and crystallise the overall argument.
Overall, each book presents a skilful weaving of diverse data, combining simple statistical patterns (usually correlation) with rich theoretical awareness into repeat refrains and – ultimately – a composite whole that makes powerful arguments about social change over extended time periods. The scope of these projects demands extended presentation (as books) to allow the force of the argument to emerge across empirical and theoretical resources that have been marshalled, held together by repeat visualisation of their core claims. We describe them as symphonic because of their scale and their use of recurring descriptive motifs woven together within a complex temporal narrative – in this respect they accord with Frade’s (2016) argument regarding the need for a temporally sensitive social theory. As sociologists, we might learn from the success of this kind of work, think about how to deploy this approach in our own work and how our specifically sociological expertise might extend its range. For, impressive though they are, Piketty, Putnam and Wilkinson and Pickett are also somewhat reductive in focusing on one key factor (capital, social capital, inequality). We can do more to provide a more rounded social analysis of these processes too. But for now, let us consider what affordances these interventions might give to the big data debate.
Symphonic Social Science in the World of Big Data
Symphonic social science suggests a way to transcend some of the tensions between sociology and big data. It proposes the makings of a different kind of assemblage for big data analytics: one that might put sociology at the heart of big data analytics and – at the same time – enable us to harness big data for social scientific research. In part, this is because of strong similarities between the symphonic approach and big data analytics. These are as follows: (1) the re-purposing of multiple and varied ‘found’ data sources; (2) the emphasis on correlation; and (3) the use of visualisation (summarised in Figure 1). These not only mark a break with conventional social science approaches, they are also hallmarks of big data analytics (see Kitchin, 2014a; Mayer-Schönberger and Cukier, 2013; O’Neill and Schutt, 2014 for overviews of each point from big data, critical social science and data science respectively).
There are also important differences between the symphonic approach and big data analytics: (1) symphonic social science combines a rich theoretical awareness with (2) data carefully chosen to address ambitious and wide-ranging social questions. This contrasts with established big data approaches, which are more likely to seek out data whose primary quality is a ‘bigness’ that can be inductively mined for behavioural patterns, whatever these may be. Furthermore, (3) while big data analytics focus on micro-patterns, for instance ‘real time analysis’ over a few hours, or purchasing patterns in a particular supermarket, symphonic social science focuses on long term trends and wide-ranging comparisons. In the symphonic approach, (4) correlation displaces rather than replaces causality and the weight of causal claims is shifted from inferential statistics to sociological concepts and theories which link together recurring motifs into a symphonic narrative. Finally, (5) the symphonic aesthetic deploys visualisation as a deliberate analytical strategy rather than a technocratic method of data presentation, as is the case in big data analytics.
The similarities place symphonic social science on the same territory as big data analytics while the differences hold out the possibility of doing things differently. To date, the big data paradigm has represented a rather narrow conflation of data sources (mainly transactional data in the commercial world, Twitter data in the sociological world), specific analytical techniques (notably data mining, sentiment analysis and social network analysis) and disciplinary expertise (mathematics and computer science) directed towards limited questions and/or claims. The symphonic approach suggests a different route, a different way to do big data. Our timing is important here, given that the big data paradigm appears to have become somewhat becalmed. To be sure, there has been successful take up in business, for example in the development of online behavioural tracking and recommender systems (e.g. at Amazon or Spotify) but the application of these techniques to more complex social issues has been both less tried and less successful, much to the frustration of some in data science: ‘[t]he best minds of my generation are thinking about how to make people click ads […] that sucks’ (Jeff Hammerbacher, ex- Linked-In and Facebook, co-credited with DJ Patil for coining the term ‘data science’ in 2008, cited in O’Neill and Schutt, 2014: 352). Despite a great deal of hype, so far big data can only offer a promise of ‘jam tomorrow’, compared with the remarkable track records of the symphonic authors, whose arguments have provoked widespread public debate and become central to government policy on a global scale. Following the publication of Bowling Alone strategies to expand the stock of social capital came to be seen by governments of all hues as a means to increase social solidarity, while Wilkinson and Pickett’s take up in policy and academic communities – even a film – suggests that theirs may be one of the fundamental social science ideas of our age. Even though Piketty’s book is recent, his work has already fed into increasing demands for wealth taxation and redistributionist politics.
The Prospects
While symphonic social science is suggestive of a new approach to big data analytics, it will take significant work to make this happen. The symphonic authors do not use new forms of digital big data and their methods cannot simply be applied to these data, which demand some new and largely unfamiliar skills. Furthermore, it took years to produce the analysis for each of the symphonic projects – 15 years, famously, for Piketty and colleagues associated with the World Top Income Database. Even if the original big data paradigm is faltering, we cannot wait this long for in-depth sociological engagement with big data. While we might be sceptical about the current emphasis on real time analytics, the dynamism and velocity of big data demands more than this. In the remainder of this section we sketch a prospective agenda for how the inspiration of symphonic social science might lead to a new sociological approach to big data analytics.
A symphonic approach to big data means pursuing key social questions across multiple data streams including, but not limited to, new forms of digital data. Depending on the topic, national surveys and official statistics may remain important (and, indeed, used more widely as more data become open and published online) so too ethnographic and interview data. Not least if we aim to trace the long term we will need historical data and, of course, there are advantages in carefully designed, sampled and collected data (Gray et al., 2015), depending on the questions we seek to answer. Working with new forms of digital data, the point will be not (only) to seek specific findings in individual data sets – ad clicks, consumption patterns or flu search terms – or even to ‘mash’ together a couple of data sets. Although both may make important contributions, 1 the symphonic approach calls on us to combine the empirical power of multiple and diverse data sets, exploring their contradictions and complementarities, as we pursue the understanding of major social questions. In this sense, the symphonic approach calls for ‘wide data’ or ‘thick data’ 2 as much as ‘big data’. And instead of fetishising any particular kind of data per se, the question is: how might particular data assemblages be mobilised to address the question at hand? This requires attention to data, method and theory.
Data
Sociological take up of the symphonic approach to big data analytics requires critical data pragmatism. Like all big data analytics, working with found data depends on a willingness to think laterally, to redirect data towards new purposes. Data pragmatism should not mean data naivety. Moving beyond the early excitement of ‘naturally occurring data’ that has characterised big data analytics, and claims that the scale of big data would simply over-ride inherent biases (Mayer-Schönberger and Cukier, 2013), we need critical interrogation of these new data sources, to understand their possibilities and limits. Instead of rejecting new kinds of data because they are unfamiliar, not generated by the strict protocols that we are used to, we should seek to understand them on their own terms, for what they are, and might offer, as well as what they are not. Rather than taking the data for granted, we should consider the sociotechnical processes involved along the ‘data pipeline’, particularly as big data start to become a source of historical as well as real time data. For this we will need better records of how data have been constructed or, at least, to be clear about the blind spots, where we lack information, be willing to explore the significance of these and think creatively about how we deal with this (Driscoll and Walker, 2014; Gehl, 2015). We may also want to develop robust methods for ascertaining the demographic composition of individuals recorded in new forms of data (Sloan et al., 2015) and better understandings of how particular forms of data storage and/or different analytical tools moderate the data and, therefore, our findings and the kind of claims that we might make. Such an approach chimes with arguments made by those pursuing ‘the social life of methods’ in recognising how we should be attentive to the constructions involved when selecting data (Law, 2010).
In this respect we might stop obsessing that new forms of data are not representative samples and start exploiting the biases that they contain. Surveys in the USA, for instance, show that Twitter has a disproportionate number of young, male black and Hispanic users compared to the national population. 3 In some cases it may be vital to find methods that overcome this bias and create samples that mirror the demographic structure of the population at large (Munson et al., 2016). In other cases the bias may offer insight to an under-represented group, for example young men are poorly represented in health research not least because they are less likely to be registered with a family doctor than the population at large. For all this, however, we will not render big data into the kind of clean, sampled or easily knowable data that has been the gold standard for many in the social sciences over the past century. In this respect they will demand new methods and a distinctive methodological and epistemological approach (Marres and Weltevrade, 2013; Wang et al., 2015).
Method
It follows from the combination of data sources that symphonic social science will be methodologically pluralist. The pioneering development of mixed methods approaches in social science over recent decades chimes with the current direction of travel in sociology. However, to date, the scope for pushing forward social scientific analysis with big data has been limited by the use of conventional social scientific methods, which cannot explore many of the qualities that make these data so interesting, including their scale, dynamism and complexity. In order to engage with big data we will need to extend the social science repertoire to incorporate computational methods of data analysis.
Some of these are familiar, for example social network analysis – which has a long history in sociology (Scott, 2000) – and can be extended through computational methods to model the flow of information across online social networks and follow the emergence/dissolution of network ties, in real time and over time (Tinati et al., 2014). Other methods will be less familiar, for example ‘named entity recognition’, which can be used to search data streams for specific people, places or other entities; and sentiment analysis, which uses linguistic and textual methods to evaluate the ‘mood’ of particular bodies of data. Data mining and pattern recognition might be extended with machine learning techniques:
automated processes that can assess and learn from the data and their analysis […] machine learning seeks to iteratively evolve an understanding of a data set; to automatically learn to recognise complex patterns and construct models that explain and predict such patterns. (Kitchin, 2014a: 103)
Supervised machine learning allows us to interrogate data at scale and speed ‘training’ computational tools to recognise and classify data according to ‘known cases’ (DiMaggio, 2015) making it possible to model thousands of variables (Underwood, 2015) or apply multiple models to particular data sets (Kitchin, 2014b). Just think how this might extend the empirical weight of the symphonic arguments championed by Piketty, Putnam and Wilkinson and Pickett!
Meanwhile, unsupervised machine learning allows less structured interrogation of data sets and may be particularly appropriate here. In the past we have been used to carefully controlled data collection that usually has particular research uses – even particular hypotheses – in mind. This is an effect of earlier regimes of data generation, whereby researchers had to target scarce resources towards tightly specified empirical data collection (Goldberg, 2015). As Goldberg (2015: 1) explains, this often led us to ‘round up the usual suspects. They [researchers] enter the metaphorical crime scene every day, armed with strong and well-theorized hypotheses about who the murderer should, or at least plausibly might be’ (see also DiMaggio, 2015). However, big data are generated beyond our control, we may not know exactly what they contain or what patterns and relationships we might search for within them. Unsupervised machine learning techniques explore the ‘latent structure’ of data (DiMaggio, 2015: 1):
the model seeks to teach itself to spot patterns and find structure in the data without the use of training data. In general this is achieved through identifying clusters and relationships between the data where the characteristics of similarity or association were not known in advance. (Kitchin, 2014a: 103)
This allows us to begin to pursue broad research questions without knowing which variables matter (Underwood, 2015), broadening investigation beyond familiar repertories. Here we are suggesting that we harness the techniques of big data analytics, but use them in a distinctively sociological way, driven by research questions, shaped by iterative analysis that draws on sociological concepts and understanding. The point is to be attentive to the layering of the argument and the overall big picture that must be painstakingly constructed. The use of computational techniques for big data interrogation both demands and allows something different: exploratory analysis, rather than confirmatory analysis where the ‘understanding of the problem you are solving, or might solve, is changing as you go’ (O’Neill and Schutt, 2014: 34). This brings with it the opportunity to see things in a new way or, even, to see new things (Buurma, 2015).
None of this is to suggest that computational tools are capable of doing the analytical work in symphonic social science. Echoing recent developments in ‘software studies’ and ‘critical algorithmic studies’, sociologists will need to understand what the tools are doing, the consequences of developing software and algorithms in one way rather than another, and the kind of knowledge that they produce (Berry, 2011; Fuller, 2008; Kitchin and Dodge, 2011). Computational social network analysis, for instance, is essentially a mathematical model of network structures that must not be reified to ‘stand in’ for social structures, while sentiment analysis can – at best – tell us about the background mood of a data set, rather than the feelings of individuals (Andrejevic, 2011). Further, recent research points to the significance of the wider political economy in which new forms of data and the computational tools that analyse them are developed (Pasquale, 2014; Zuboff, 2015). As Kennedy (2012) has shown, the development of these tools is often driven by the commercialisation of new forms of data. Patterns may be found but so what? As O’Neill and Schutt (2014: 85) explain to would be data scientists: ‘[i]nterprebility can be a problem – sometimes the answer isn’t at all useful. Indeed that’s often the biggest problem.’
Theory
Numbers do not speak for themselves. We make them speak with the methods we apply and the interpretations that we make. A symphonic approach to big data demands abductive reasoning, echoing Kitchin’s (2014b) well-made call for this approach in big data analytics. Beyond inductive or deductive approaches, abductive reasoning focuses on the unfolding interplay between data, method and theory and with regard to their co-constitution. In this mode of investigation, concepts, theories and methodological expertise are (more or less tightly) used to direct the process of knowledge discovery and, in turn, data are used to direct the further investigations as well as the process of interpretation and theoretical development. In this way, ‘many supposed relationships within data sets can be quickly dismissed as trivial or absurd by domain experts, with others flagged as deserving more attention’ (Kitchin, 2014b: 6). Far from outsourcing our analysis to computational tools, abductive reasoning engages the tools and the data that they generate in a critical process of interrogation. This places more demand on theory as the analytical focus shifts from dis/proving pre-formed hypotheses to ‘figuring out how to structure a mountain of data into meaningful categories of knowledge’ (Goldberg, 2015: 3).
Overall, the mobilisation of big data with a symphonic approach calls for the self-conscious and iterative assemblage of data, method and theory addressing major social questions and informed by sociological theory.
Visualising Symphonic Social Science
Better use of big data in social science will demand more than social scientists getting technical help with the application of computational tools, or computer scientists seeking social scientific interpretation of findings. If this is all we do then the current tensions will not be addressed. What is needed is a new model for collaboration across the social and computational sciences (see also Schneiderman, 2016).
Symphonic social science suggests one way forward. Our approach suggests an end-to-end model of disciplinary integration from the investigation of data generation and provenance, to exploratory data investigations and the development of abductive reasoning: a symphonic approach to big data demands the integration of social and computational skills. Nonetheless, achieving this will be challenging. Here, visualisation may play an important role, echoing and extending the original symphonic aesthetic. Sociologists are usually seen as laggards in deploying visualisations, though Healy and Moody (2014: 124) argue that ‘the dominant trend is toward a world where the visualization of data and results is a routine part of what it means to do social science’. Symphonic social science heeds this call and takes a distinctive approach to visualisation, seeing it not just as a means of black-boxed number crunching or final display of results but rather as part of the abductive analytical process – where care is taken to explore the ways that visualisation shapes the nature of the argument – and as a narrative strategy where cumulative visualisations are used to powerful effect in mobilising diverse data sources towards an overall argument. We suggest that this distinctive approach to visualisation may provide a platform for interdisciplinary interrogation of big data and the construction of jointly owned argument across the social and computational sciences.
Rather than positioning visualisation merely as the illustration of findings, drawn up (literally) at the end of a project, visualisation offers the means to ‘see’ and interrogate the big data. Visualisations can provide an overview of large and dynamic data sets, impossible through any other inscription. Where statistical representation might be unwieldy, visualisations provide a more readily absorbable overview of the data, a means to ‘reveal and communicate the structure, pattern and trends of variables and their relationships’ (Kitchin, 2014a: 106). At best, visualisations are ‘instruments for reasoning about quantitative information. Often the most effective way to describe, explore and summarise a set of numbers – even a very large set – is to look at pictures of those numbers’ (Tufte, 1998; 9, emphasis added). We say again, visualisations do not present an unmediated view of ‘the data’. All visualisation techniques are particular inscriptions: their design shapes what we do, and do not, see. However, the capacity of visualisations to make the data intelligible means that they may become interdisciplinary boundary objects – spaces where different disciplines can look at data and bring distinctive forms of expertise to bear in interpreting what is seen and what the next steps should be. Visualisations can be used to ‘zoom in and out on items of interest, filter out uninteresting data, select an item or group of data and get details, view relationships among items and extract sub-collections of details’ (Kitchin, 2014a: 106).
Furthermore, the impact that different modes of visualisation have on data can be, literally, ‘seen’: a step towards un-‘black-boxing’ computational methods. Visualisation might integrate domain expertise and computational techniques in a new ‘meeting place’ (Latour, 1985: 10) of abductive reasoning with data, methods and concepts. Discussion on the disciplinary home turfs of social theory or algorithm design quickly become one-sided but visualisation may offer space for both social and computational expertise and for the development of shared ownership of the investigation. Specialist expertise will continue to be important – knowledge of algorithms and social theories will not become generic – but in harnessing the symphonic aesthetic for interdisciplinary big data analytics, the interrogation of visualisations may be the repeat point of connection, the familiar refrain in practice that orchestrates the whole. We suggest this in addition to the more rehearsed practice of the original symphonic aesthetic, whereby visuals are deployed within a cascading and elaborating argument which comes to have resonance through repeat motifs spliced with telling (partial) counterfactuals. This too will continue to be a powerful mode of argument for symphonic big data analytics.
Conclusion
Sociology flourished in the 20th century, positioning itself with specialist expertise in the social world, acquiring authority and status. But what future awaits? In the context of other emergent intellectual forces, specifically those linked to big data, sociologists cannot be complacent. Established approaches to big data analytics are deficient and we offer the symphonic approach as a contribution towards the reinvigoration of the ambitious, risk taking and dynamic research culture that drove sociology in the middle decades of the 20th century.
The symphonic approach is patently not only suited to sociology. Indeed, as we have made clear, its most visible proponents are not sociologists. However, we are suggesting that the extension of the symphonic approach into big data analytics – as proposed above – would allow sociologists to engage more fully and effectively with this new form of data. This is important for both big data analytics and for sociologists. New sources of digital data provide traces of a scale and granularity, in real time and over time, that offer the potential to see traces of the social world as never before. However, it is patently clear that computational and statistical methods alone will not make the most of these data. Big data analytics needs sociology (as well as the other social sciences) to provide theoretical, methodological and empirical expertise to study the social world. As new data assemblages driven by big data are, increasingly, coming to shape government policy, commercial practice and popular representations of the social world, it is increasingly recognised that sociological knowledge and understanding must form part of the assemblage, that we can bring our specific domain expertise to shape the agendas that drive big data analytics and the modes of investigation and interpretation that evolve in play. The recent growth of social analysis beyond sociology, provoked by big data, is crying out for in-depth theoretical and empirical understanding of social roles and identities, families, communities and cities, social cohesion, conflict and inequality, for instance. By being bold, and engaging our sociological contribution through the symphonic aesthetic we can help to build a more credible and robust voice for big data analytics and strengthen the impact of sociological research beyond the academy. At the same time, the symphonic approach would allow sociologists to explore the promise of big data for sociological research without compromising our commitment to thinking critically about ‘data’, to methodological rigour and to theoretical interpretation. With these elements in place, the promise of big data is that we can access different traces of social life and social change to those that we already have, in real time and over time, while the digital nature of the data may allow us to analyse at scale and speed across multiple data streams.
We recognise that the symphonic approach has its limits. While it offers far reaching arguments across the longue durée, it also raises many questions that can only be addressed through other modes of research, which may – in turn – challenge the claims made. For example, Bowling Alone energised new and critical streams of empirical research that have explored the divisive aspects of social capital (e.g. Burt, 2005; Savage et al., 2015). Similarly, Piketty, and Wilkinson and Pickett, have both provoked heated debate about theoretical interpretation and causal processes (Couldry, 2015; Savage, 2014). These books are also limited in being insufficiently sociological, with their measures being predominantly economic or political. Nonetheless, we think we have the potential to learn from the success of this kind of social science in showing how to reinvigorate the ailing big data paradigm, providing the model for a new kind of big data assemblage that reconfigures relations between data, method and knowledge in a more productive direction. To be sure, this move into new kinds of data and new methods has ontological and epistemological implications: change the tools and you change the object of knowledge (boyd and Crawford, 2011). But we should remember that sociology’s objects of and our claims to knowledge have always been shaped by the data that we have, or can get, and our methods have accommodated – quite rightly – to these data. Instead of holding up the late 20th-century settlement between data, method and theory as the gold standard for social research we need to look at where we are now – big data are not just less good at doing the same thing, they can do something different.
Footnotes
Acknowledgements
With thanks to Mark Weal, as always, for commenting in detail on an earlier draft with a critical computational eye and a passion for interdisciplinarity that improved the final version considerably.
Funding
This research received no specific grant from any funding agency in the public, commercial or not-for-profit sectors.
Notes
 .
.