
Abstract
In an era of rising college costs and stagnant grant-based student aid, many young adults rely on their parents’ resources and student loans to pay for their postsecondary education. In this study I ask how parents’ income and education are linked to young adults’ student loan debt. I develop and test two perspectives regarding the functional form of the association between parents’ income, parents’ education, and student loan debt. I have four key findings. First, the relationship between parents’ income and student loan debt is nonlinear, such that young adults from middle-income families have a higher risk for debt than do those from low- and high-income families. Second, young adults from college-educated and high-income families are relatively protected from debt. Third, the association between parents’ socioeconomic status (SES) and debt is modified by postsecondary institutional characteristics and is strongest at private and high-cost institutions. Finally, the effect of parents’ SES on debt varies across the debt distribution. Parents’ SES is strongly predictive of entry into debt, but there are few differences conditional on going into debt. This suggests that socioeconomic disparities in debt are primarily driven by the probability of going into debt rather than differences among debtors. However, compared to their more advantaged counterparts, young adults from low-SES backgrounds have a higher risk of accruing debt burdens that exceed the national average.
Introduction
In the United States, where college costs have skyrocketed and outpaced inflation (College Board 2010b), parents and students are responsible for paying the majority of these costs (Carnegie Commission on Higher Education 1973; Choy and Berker 2003; Olson and Rosenfeld 1984). The rise in college costs has not been offset by grant aid, which has failed to keep pace with rising costs (College Board 2006), leaving families and students to make up the difference. Although families’ expected financial college contributions have risen, middle-class incomes have stagnated, making it harder for many to keep up with college costs (College Board 2010a). These structural shifts have led many young people to student loans to bridge the gap between rising costs and their own and their families’ resources. Student loans are now one of the most common forms of financial aid (College Board 2010b). Aggregate student loan debt recently hit the one trillion dollar mark, surpassing credit card debt for the first time in history (Federal Reserve Board 2010).
Student loan debt is a “double-edged sword” for college-going young adults (Dwyer, McCloud, and Hodson 2012:1136). On the one hand, debt is a borrowed resource that young people can use to bridge the gap between their families’ resources and the rising costs of college. On the other hand, debt comes with inherent risks, which may limit students’ opportunities and choices after college (Dew 2008; Dwyer et al. 2012) and undermine well-being (Drentea 2000). These risks are especially high in the current economy, where young adults with postsecondary education are struggling to find high-wage jobs and full-time employment (Godofsky, Zukin, and Van Horn 2011). Although debt forgiveness programs and income-based repayment may reduce the burden of student loan debt, it cannot be erased by filing bankruptcy, and heavy financial penalties are often levied for missing payments (Atkinson 2010).
Research on college finance in the sociology of higher education is scarce (Deil-Amen and Turley 2007; Hamilton 2013; Jackson and Reynolds 2013). But the explosion of student loan debt raises questions about the role of family resources in students’ postsecondary schooling. Postsecondary education comes with the expectation of breaking the link between parents’ resources and their adult children’s attainment (Hout and Diprete 2006), 1 but debt may thwart this potential. Although I do not test the role of student loan debt in social class reproduction, I do ask whether young adults from different socioeconomic (SES) backgrounds start their post-college careers on different footings by virtue of how much they owe for their education.
In this study I develop and test two perspectives regarding the impact of parents’ income and education on the amount of student loan debt that young adults incur. Each perspective makes a unique prediction regarding the functional form of the association between parents’ income, parents’ education, and student loan debt. The reproduction of advantage perspective predicts a negative association between parents’ SES and debt. The middle-income squeeze perspective, in contrast, predicts that young adults from the top and bottom of the family income distribution have less student loan debt than those from middle-income families.
A Reproduction of Advantage: Parents’ Education and Income Reduce Student Loan Debt
The reproduction of advantage perspective, derived from status attainment and human capital theories, is rooted in the notion that parents use their financial and educational resources to protect their adult children from student loan debt.
Status attainment theory posits that family background characteristics, particularly SES, are positively associated with educational attainment because they influence children’s academic achievement, aspirations, expectations, and the amount of encouragement children receive (Blau and Duncan 1967; Hauser, Tsai, and Sewell 1983; Sewell and Hauser 1976). Parents’ SES is an important determinant of children’s academic performance, expectations, and ability to gain access to elite postsecondary institutions (Grodsky and Jackson 2009; Sewell and Hauser 1976). Once accessed, parents can use their financial (i.e., money) and cultural (i.e., knowledge) capital to invest in and help their adult children successfully navigate their postsecondary careers (Goldrick-Rab and Pfeffer 2009; Steelman and Powell 1991).
Similarly, human capital theory posits that investments in children largely depend on the resources parents command. Parents with greater financial capital can more easily invest in their children’s futures, including their educational attainment (Becker 1981). Similar arguments exist in the higher education literature. Parental income is typically conceptualized as a source of financial capital that young adults can draw from to pay for college costs. And parental education is typically depicted as a source of cultural capital that provides young people with the information, skills, and habits necessary to navigate their postsecondary schooling (Goldrick-Rab and Pfeffer 2009). These theoretical orientations suggest that parents’ income and education may both be negatively related to their young-adult children’s student loan debt.
The reproduction of advantage perspective is supported by evidence about parents’ SES and college finance. For example, higher income parents are able to contribute more money toward their children’s education (Choy and Berker 2003), are more likely to have saved money for their children’s education (Steelman and Powell 1991), and can transfer money to their children in other domains—such as money for rent and leisure (Schoeni and Ross 2005; Swartz 2008). This suggests that children from higher income families may be less likely to take out student loan debt than children whose parents have less income.
Parents’ education is also strongly correlated with college finance. Highly educated parents have a better understanding of financial aid options—such as grants and scholarships (Hossler and Vesper 1993)—that they can pass on to their adult children to help them avoid student loan debt. Even after accounting for income, college-educated parents have more accurate knowledge of college costs (Grodsky and Jones 2007), spend more time financially planning for college (Charles, Roscigno, and Torres 2007), save more for college (Steelman and Powell 1991), contribute more money (Mauldin, Mimura, and Lino 2001), and are more likely to borrow money to finance young adults’ education (Cha, Weagley, and Reynolds 2005). Young adults from socioeconomically advantaged backgrounds may also be protected from debt due to their access to merit aid. Merit aid has increased in recent years and tends to be awarded to high-performing young adults from socioeconomically advantaged backgrounds (Heller 2006).
A Middle-income Squeeze: Students from Middle-income Families Have the Greatest Risk for Debt
In contrast to the reproduction of advantage perspective, the middle-income squeeze perspective predicts that the association between income and student loan debt may not be linear. Instead, young adults from middle-income families may have greater student loan debt than peers whose parents have lower and higher incomes. This perspective is rooted in prior research about financial aid distribution and postsecondary education finance. I focus here on parents’ income, not parents’ education, because financial aid decisions tend to be based on family income rather than education.
Current financial aid policies provide a safety net for young adults from low-income backgrounds. Grant-based financial aid is largely need-based and more generous to low-income families than to middle-income families (US Congress Senate Committee on Banking 2002). Over 90 percent of Pell Grants are awarded to young adults from families with an annual income of less than $40,000 (College Board 2010a).
Middle-income families are often unable to make the expected financial family contributions as determined by the Free Application for Federal Student Aid (FAFSA), creating as much as $10,000 of unmet need per academic year for middle-income families (Choy and Berker 2003). Scholars speculate that high levels of unmet need lead many middle-income youth to take on massive amounts of debt or even drop out of college (Chen and Zerquera 2011; Clawson and Leiblum 2008).
Middle-income young adults may also have more trouble paying for college than their high-income counterparts, because their parents lack the resources of high-income parents. Children from middle-income families make too much money to qualify for student aid packages, but they do not have the financial means to cover the costs of college. Young adults from middle-income families may therefore suffer a disproportional burden of student loan debt compared to their low- and high-income peers.
Parents’ SES and Student Loan Debt: The Role of Postsecondary Institutions
The perspectives summarized previously provide different predictions about how parents’ SES influences the risk of student loan debt. Missing from this picture is the role of postsecondary institutions and college choice.
The types of institutions that students choose to attend are powerful predictors of student loan debt. Young adults who attend four-year, private, for-profit, and more expensive institutions tend to leave college with more debt than students who choose other options (Baum and Saunders 1998; Choy and Carroll 2000; Gladieux and Perna 2005). Moreover, postsecondary institutional choice is strongly linked to socioeconomic background.
Young adults from more educated and high-income families tend to get higher degrees; attend more expensive, elite institutions; and spend more time in postsecondary institutions (Alexander, Holupka, and Pallas 1987; Grodsky and Jackson 2009). Socioeconomic differences in postsecondary education therefore confound the association between parents’ SES and debt—especially because more affluent young adults tend to attend the types of institutions associated with higher debt. To account for socioeconomic differences in postsecondary educational attendance, I control for degree attained, number of years attended, type of institution, and sticker price.
Postsecondary institutional characteristics may also modify the association between parents’ SES and debt. I expect that parents’ resources, or lack thereof, exert a larger influence on debt at higher-cost or elite institutions where parents’ financial and cultural resources are likely more relevant to student success. If the growth of student loan debt has been driven by the rising gap between parents’ resources and college costs (Carnegie Commission on Higher Education 1973; Choy and Berker 2003), we would expect parents’ SES to be a stronger predictor of debt at more expensive, elite institutions. To examine this, I stratify analyses by postsecondary institutional type, comparing the association between parents’ SES and debt at (1) public versus private institutions, (2) high-cost versus low-cost institutions, and (3) for-profit versus nonprofit institutions.
Methods
Data and Sample
I draw data from the National Longitudinal Study of Youth 1997 (NLSY97; Bureau of Labor Statistics 2012), a nationally representative sample of 8,984 young men and women who were age 12 to 16 years at the baseline interview. The NLSY97 oversamples racial and ethnic minorities and followed up all respondents annually between 1997 and 2009. I draw additional data from the Integrated Postsecondary Education Data System (IPEDS) Delta Cost Project Database (2012), which provides longitudinal information on characteristics of postsecondary institutions attended by NLSY97 respondents.
My analysis is limited to NLSY97 respondents eligible for the over-25 debts and assets module, which was administered to respondents once between 2005 and 2009 near their twenty-fifth birthday (N = 7,975). Although NLSY intended to interview respondents in the first survey year after their twenty-fifth birthday, respondents were actually administered the module between the ages of 24 and 28 years. I also limit analysis to respondents who reported any postsecondary education and were therefore eligible to incur student loan debt (N = 4,789). Of these 4,789 cases, 743 respondents were missing data on study variables. To account for missing data, I use multiple imputation using the ICE command for Stata 12.0 (Royston 2005). Multiple imputation is a more efficient and less biased strategy for missing data than listwise deletion (Lee and Carin 2010). The procedure iteratively replaces missing values on all variables with predictions based on random draws from the posterior distributions of parameters observed in the sample, creating multiple complete data sets (Allison 2001). I average results across 10 imputation samples and account for random variation across samples to calculate standard errors (Royston 2005). The multiply imputed results presented here are similar to results using listwise deletion.
Measures
I obtained student loan debt from the over-25 debt and assets module. Respondents were asked about their total amount of outstanding student loan debt from all sources. I adjusted debt for inflation and standardized it to reflect 2010 dollars using the Consumer Price Index Research Series (CPI-U-RS; Bureau of Labor Statistics 2010; Stewart and Reed 1999). Accuracy of self-reported debt data is a serious concern, but recent evidence suggests borrower self-reports and official lender (credit) reports are extremely similar for nearly all forms of debt, including student loan debt (Brown et al. 2011).
Parents’ income is a measure of parent-reported 1997 household income and thus a measure of family background. It reflects total annual income from wages and salary, self-employment (business/farm income), bank account interest, AFDC, food stamps, SSI benefits, child support, and “other” sources of income. 2 I updated parents’ income to 2010 dollars using the CPI-U-RS. For most analyses, income is coded into the following brackets: less than $40,000; $40,000 to $59,999; $60,000 to $99,999; $100,000 to $150,000; or $150,000 and higher. The lowest income category—less than $40,000—represents eligibility for the vast majority (90 percent) of government financial aid (College Board 2010b). The $40,000 to $59,000 income category represents households between the second and third quartile of the income distribution in the United States (forty-first to fifty-fourth percentile), and the $60,000 to $99,000 income category represents households between the fifty-seventh and seventy-fifth percentile in household income (DeNavas-Walt, Proctor, and Smith 2013). These categories thus represent the middle of the income distribution in the United States. The findings presented here are substantively and statistically similar to models that use a linear and a squared term for parents’ income.
Parents’ education indicates the highest level of education obtained by either parent of the respondent. In the 1997 survey, parents were asked the highest grade they completed. I used this information to create attainment categories indicating parents had less than or equal to a high school degree (zero years of schooling to completed twelfth grade), some college (one to three years of college completed), or a college degree or higher (four or more years of college completed). Using a continuous measure of parents’ education does not substantively change study results.
Educational attainment is a combined measure of respondents’ postsecondary educational attainment by the survey wave at which debt was measured (no degree, two-year degree, or four-year degree or more) and the primary institution type they attended (two-year vs. four-year). The measure indicates attending a four-year institution and obtaining a degree (reference group), attending a four-year institution but no degree attainment, attending a two-year institution and attaining a two-year degree, and attending a two-year institution but no degree attainment. I also control for the number of years of postsecondary education enrollment and the proportion of years respondents were enrolled full-time. Postsecondary institutional characteristics include the proportion of years respondents were enrolled in a private (vs. public) institution, whether respondents ever attended a for-profit institution (1 = yes), and a weighted average (by year) of the sticker price of institutions that respondents attended during their postsecondary careers (in-state tuition and fees in 2010 thousands of dollars). In the final models, I test if respondents’ reports of whether they received any scholarship aid (1 = yes) or financial aid from their families (1 = yes) are mediators of the link between parents’ SES and debt.
I control for a range of sociodemographic variables that may confound the association between parents’ socioeconomic resources and student loan debt. I control for age at debt measurement to ensure that any socioeconomic differences in debt are not driven by small differences in respondents’ age at debt measurement. To account for resource depletion, I control for the number of children under age 18 in the household in 1997. I also control for and assess the effect of two additional measures of family background: race/ethnic background (white = reference, black, and other race) and family structure in adolescence (two-parent biological family = reference, single-parent family, step family, and other family structure). These measures of family background are correlated with postsecondary institutional choice and may confound the link between parents’ education, income, and debt. Including these variables also provides estimates for how family structure and race may be associated with student loan debt, net of income and education. Finally, I account for basic sociodemographic characteristics, such as sex, urban versus non-urban (1 = urban), and census region (South = reference, Northeast, North Central, and West).
Analysis Strategy
I primarily use ordinary least squares (OLS) regression to estimate (logged) student loan debt. I log-transform student loan debt because this reduces the right-skew of the debt variable, improves model fit, and reduces heteroscedasticity. I then stratify OLS models by postsecondary institution type to test if postsecondary institutional characteristics moderate this association.
OLS regression models are effective for estimating average differences in debt, but they provide no information on how the association may vary across the debt distribution. To provide insight on this, I estimate two additional sets of models. First, I use a Craggit model—a probit paired with a truncated regression model—which is commonly used to estimate censored continuous dependent variables where the bulk of the population has a zero value. I assess the effect of parents’ SES on (1) the probability of entry into debt and (2) the amount of debt accrued among debtors. Although Tobit models are also commonly used in this scenario, the Tobit model assumes that the effect of the probability of going into debt and the amount of debt among debtors follow the same functional form. Craggit models do not make such a restrictive assumption and provide a significantly better fit to the data than does the Tobit model.
An additional concern is that some young adults may be taking on very high, or higher than average, debts. Craggit models provide insight on who is going into debt and the amount of debt they take on, but they do not necessarily identify which respondents are taking on very high levels of debt. Thus, in a second set of analyses, I use logistic regression models to predict the association between parents’ SES and whether a respondent’s debt is in the 90th percentile in the sample (debt ≥$30,000).
Results
Table 1 presents weighted descriptive statistics. Forty percent of respondents reported student loan debt; among those with debt, mean student loan debt was $22,540. These estimates of debt are consistent with national estimates (Rothstein and Rouse 2008), suggesting respondents in the study are representative of student loan debtors in the United States.
Descriptive Statistics
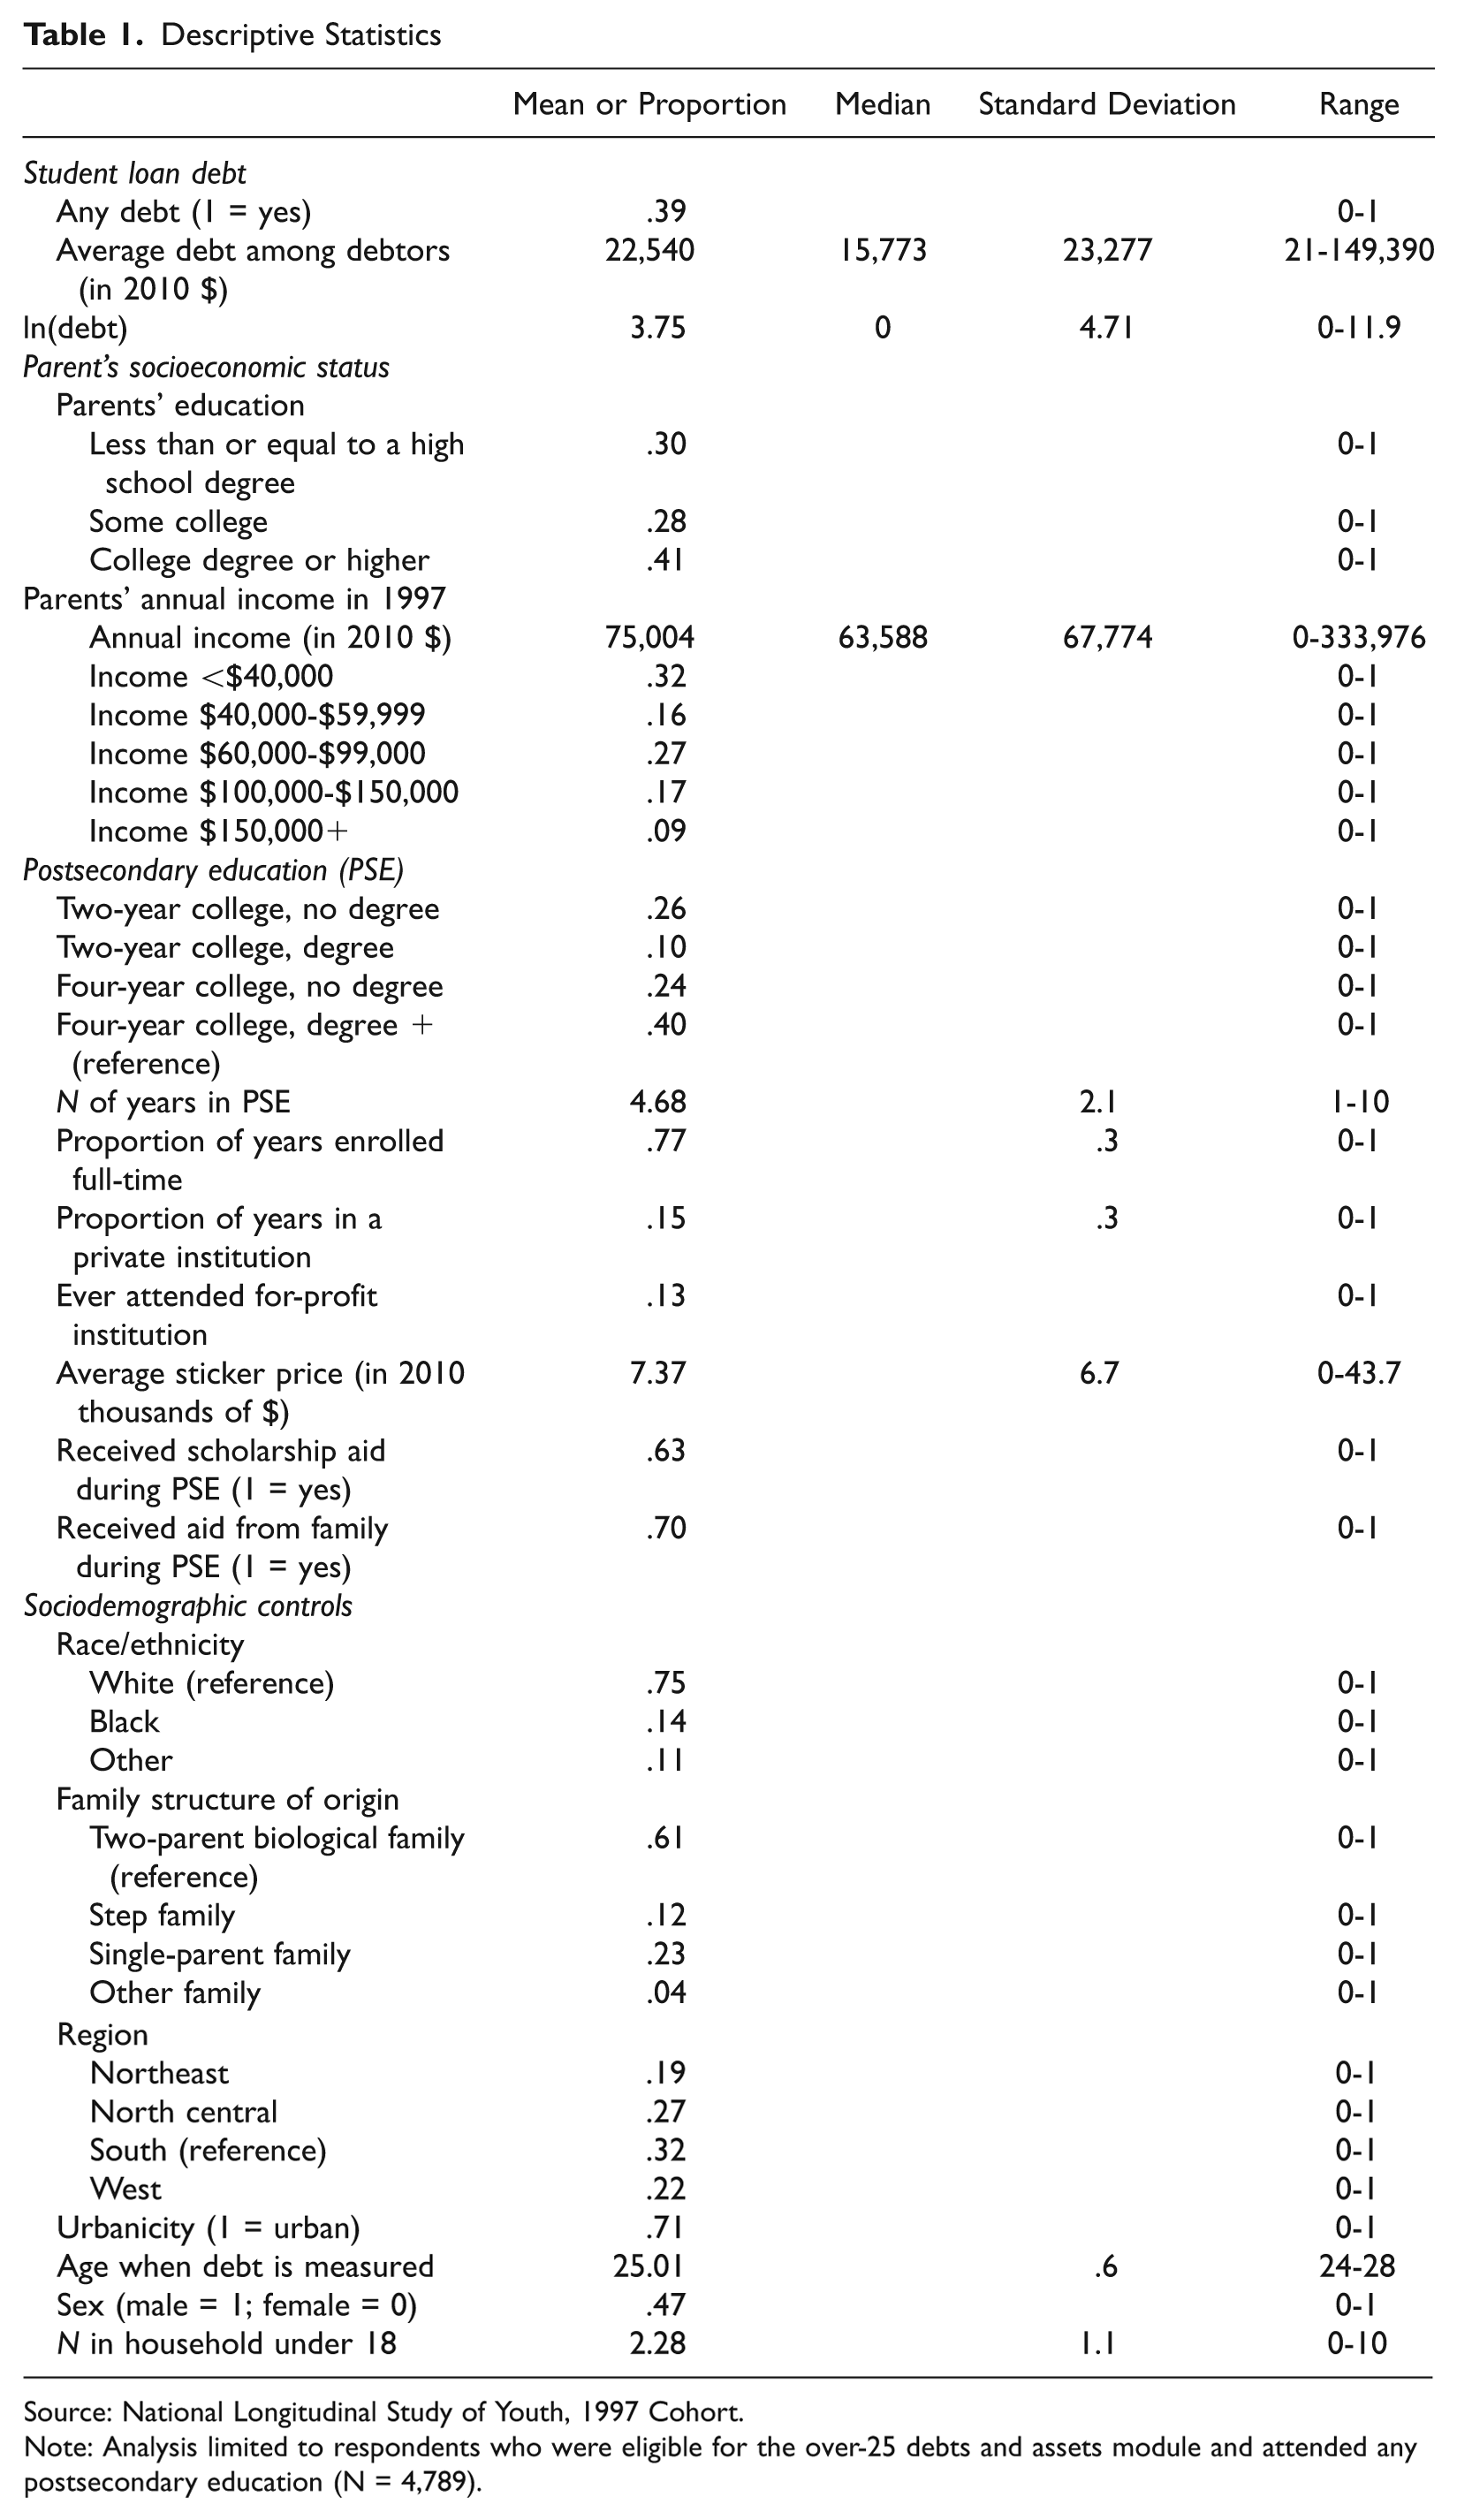
Source: National Longitudinal Study of Youth, 1997 Cohort.
Note: Analysis limited to respondents who were eligible for the over-25 debts and assets module and attended any postsecondary education (N = 4,789).
Sample members tended to have more advantaged backgrounds than the general population, as one would expect in a sample of individuals who completed some postsecondary schooling. Most respondents came from relatively educated backgrounds; 41 percent had a parent with a college degree or higher. Median parents’ income was $63,588, slightly higher than the national average.
There is also substantial variation in postsecondary educational experience. Many respondents attended four-year institutions and received a four-year degree (40 percent), but nearly half of respondents attended a two- or four-year institution but did not receive a degree. Young adults spent an average of 4.7 years in postsecondary education, most of that time as full-time students (77 percent of years enrolled), typically in a public institution (85 percent of years enrolled). The weighted average sticker price of institutions attended was $7,370.
Table 2 presents results from OLS models. Model 1 includes only postsecondary schooling characteristics and controls. Because debt is logged, coefficients approximately indicate the proportional change in debt associated with a one-unit change in the independent variables. Consistent with prior research on postsecondary schooling and student loan debt, young adults who consume more postsecondary education (e.g., spend more time in college, get higher degrees, or attend more expensive private institutions) have more student loan debt than do young adults who consume less postsecondary education. Also consistent with prior research, young adults who receive their degrees leave college with significantly more debt than do young adults who do not receive a degree. For example, respondents who did not complete their four-year degree had 68 percent less debt than respondents who completed their degree. Finally, the association between sticker price and debt is nonlinear: the positive effect of price on debt attenuates at higher price points (indicated by the negative coefficient for the squared term).
Summary of Ordinary Least Squares (OLS) Regression Models Predicting Logged Student Loan Debt

Note: Analysis limited to respondents who were eligible for the over-25 debts and assets module and attended any postsecondary education (N = 4,789). All models include the following sociodemographic controls: age, sex, number of people under 18 in household in 1997, census region, and urbanicity. Unstandardized coefficients; standard errors in parentheses.
*p < .05. **p < .01. ***p < .001.
Model 2 adds parents’ income. Consistent with the middle-income squeeze perspective, I find a nonlinear association between parents’ income and student loan debt. Young adults from the lower-middle-income bracket ($40,000 to $59,999) reported 59 percent more debt (p < .001) than did young adults from the lowest income category; and young adults from the higher-middle-income bracket ($60,000 to $99,000) reported 30 percent more debt than did those from the lowest income bracket (p < .10). Young adults from the two highest income brackets ($100,000 to $149,999 and $150,000+), however, have significantly less student loan debt than do young adults from the lowest income category. Indeed, high-income young adults have 240 percent less debt than do young adults from the lower income category.
Model 3 introduces parents’ education. Consistent with the reproduction of advantage perspective, young adults with at least one college-educated parent have 54 percent less student loan debt than young adults whose parents did not attend college (p < .001). The relationship between parents’ income and student loan debt is substantively similar when parents’ income and parents’ education are included together in Model 3, although the coefficient for the higher-middle-income category increases marginally and achieves significance at the p < .05 level. These findings show support for both the reproduction of advantage and middle-income squeeze perspectives.
Model 4 adds two potential mechanisms for socioeconomic disparities in debt—receipt of a scholarship or family aid while in college (1 = yes). These variables attenuate the association between parents’ SES and parents’ income only slightly, suggesting additional mechanisms may link parents’ SES and student loan debt. In supplemental analyses I found that controlling for self-reported high school grades—which may indicate access to merit aid and institutional choice—did not attenuate the link between parents’ SES and student loan debt.
A few additional findings stand out. First, effects for the top income bracket are substantially larger than effects for parents’ education and the other income brackets. This suggests that young adults from the top of the income distribution are especially protected from debt. Second, postsecondary educational characteristics are strong predictors across all models. Third, all models show a consistent black-white disparity in student loan debt. In the final model, African Americans have 51 percent more student loan debt than do whites (p < .001), and these differences are even greater before accounting for parents’ SES and aid from family and scholarships.
Stratified analyses by postsecondary institutional characteristics
Table 3 shows results from OLS regression models by institution type. Panel A compares young adults who spent the majority of their postsecondary careers in public versus private institutions. Panel B stratifies by sticker price (above average vs. at or below average). Panel C stratifies by whether respondents attended a for-profit institution.
Ordinary Least Squares (OLS) Regression Predicting the Relationship between Parents’ Socioeconomic Resources and (Logged) Student Loan Debt by Type of Institution Attended.
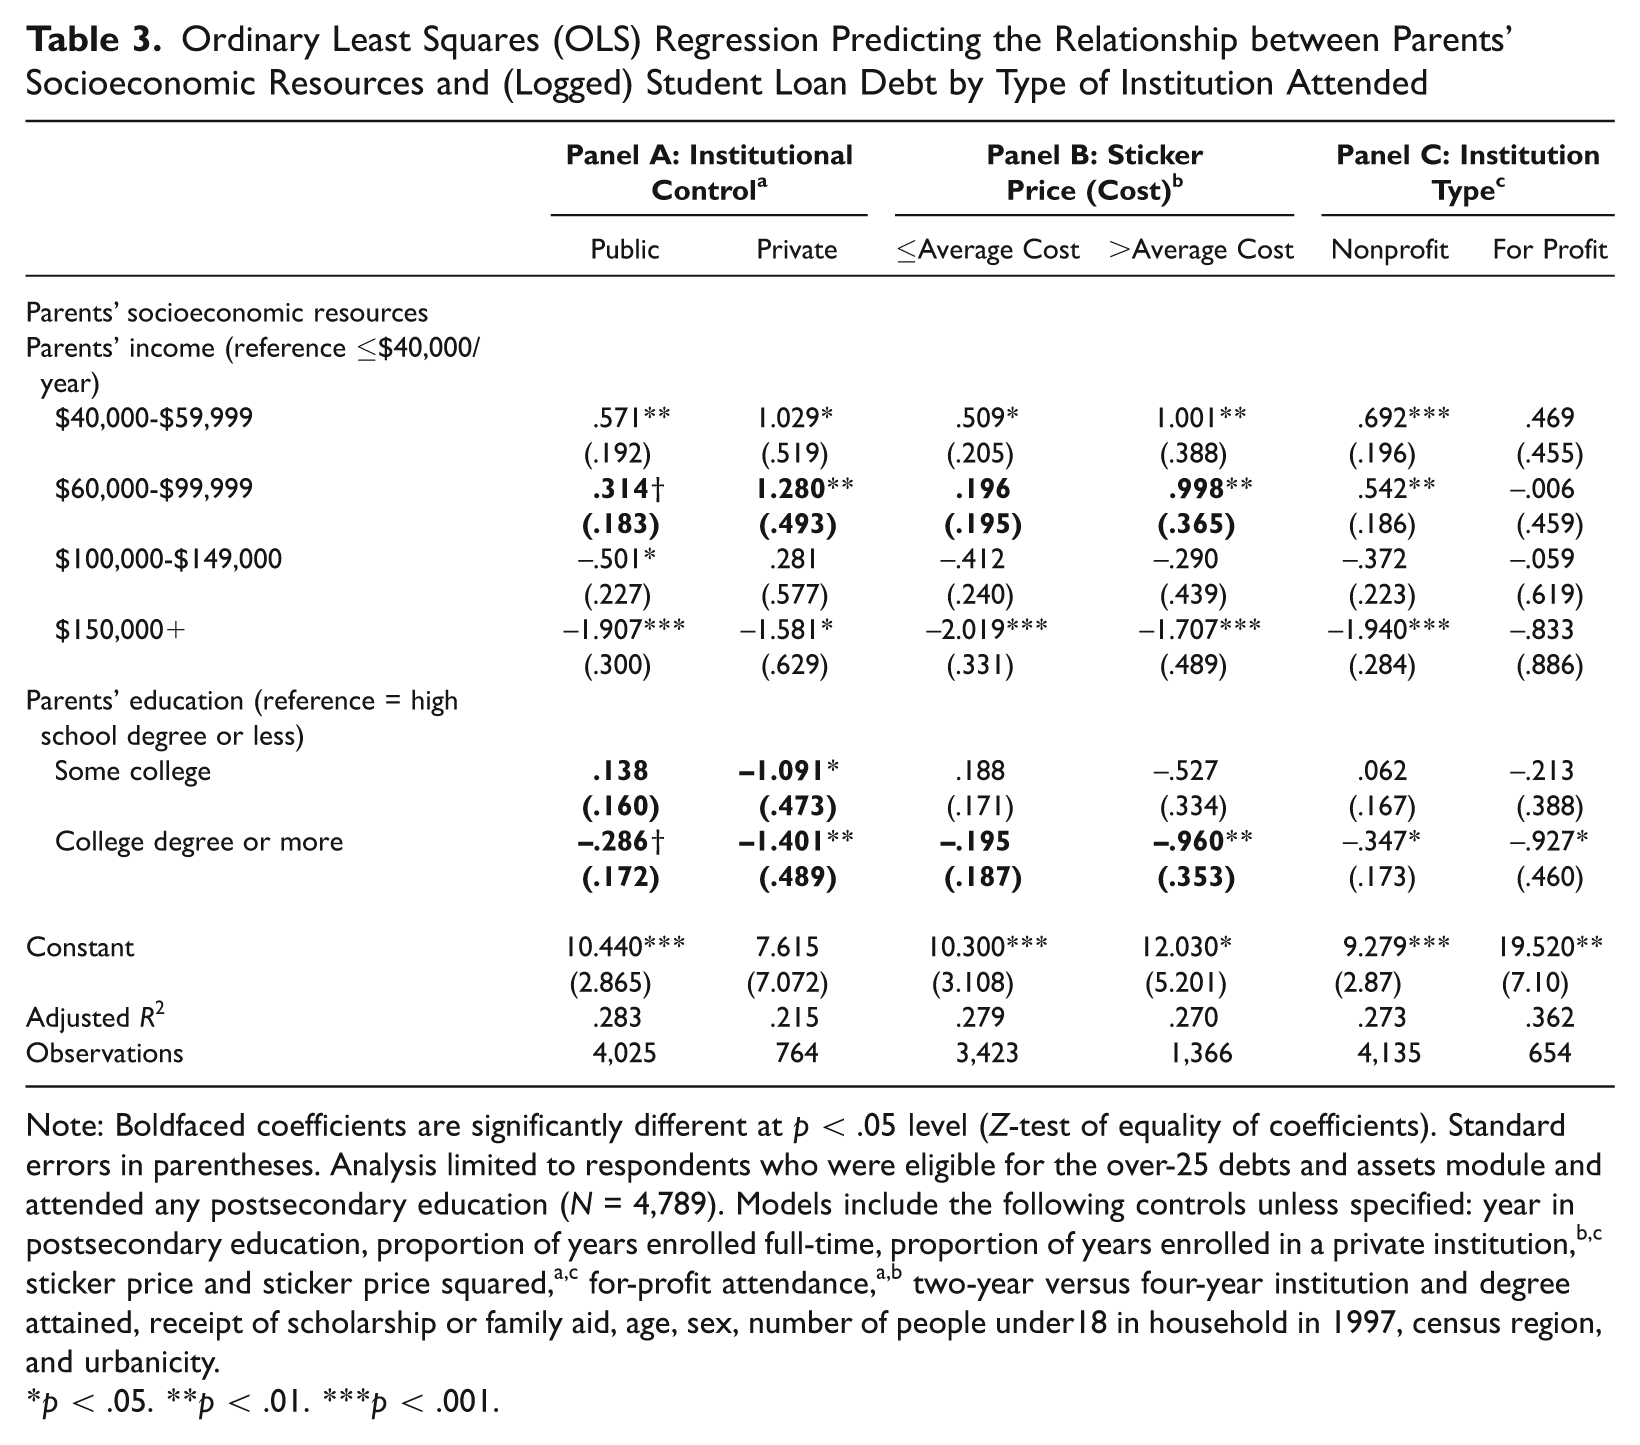
Note: Boldfaced coefficients are significantly different at p < .05 level (Z-test of equality of coefficients). Standard errors in parentheses. Analysis limited to respondents who were eligible for the over-25 debts and assets module and attended any postsecondary education (N = 4,789). Models include the following controls unless specified: year in postsecondary education, proportion of years enrolled full-time, proportion of years enrolled in a private institution,b,c sticker price and sticker price squared,a,c for-profit attendance,a,b two-year versus four-year institution and degree attained, receipt of scholarship or family aid, age, sex, number of people under18 in household in 1997, census region, and urbanicity.
p < .05. **p < .01. ***p < .001.
Results show support for the middle-income squeeze and reproduction of advantage perspectives across most institution types. However, the association between parents’ SES and debt appears stronger at private institutions than at public institutions (Panel A) and at higher cost rather than lower cost institutions (Panel B). The coefficient for the middle-income bracket ($60,000 to $99,999) is significantly larger at private than public institutions (p < .05; Panel A) and high versus lower cost institutions (p < .05; Panel B). The negative effect of parents’ education is also stronger in private than in public institutions (p < .05; Panel A) and high versus lower cost institutions (p < .05; Panel B). I find no significant differences in effects of parents’ SES on student loan debt across for-profit and nonprofit institutions, but this may be due to the small number of respondents who ever attended for-profit institutions (N = 654).
Impact of parents’ SES across the debt distribution
To examine differences in the impact of parents’ SES across the debt distribution, Table 4 presents estimates from Craggit models and Table 5 presents logistic regression models predicting very high debt. The Craggit model includes two components: (1) a probit coefficient for the association between parents’ SES and the likelihood of having any debt (p(y > 0)); and (2) a truncated regression coefficient for the association between parents’ SES and logged student loan debt among debtors (ln(y)|y > 0). The SES disparities described earlier are primarily driven by the probability of going into debt, rather than by differences in student loan debt among those who go into debt. In other words, parents’ SES is strongly predictive of going into debt, but there are few differences in debt conditional on going into debt. This suggests that disparities in the amounts of debt shown in the OLS regression models are driven by disparities in entry into debt, but not differences in debt among debtors.
Estimates from Two-Stage Craggit Models Predicting Likelihood of Any Debt (Probit; p(y > 0)) and Debt among Debtors (Truncated Regression; ln(y)|y > 0).
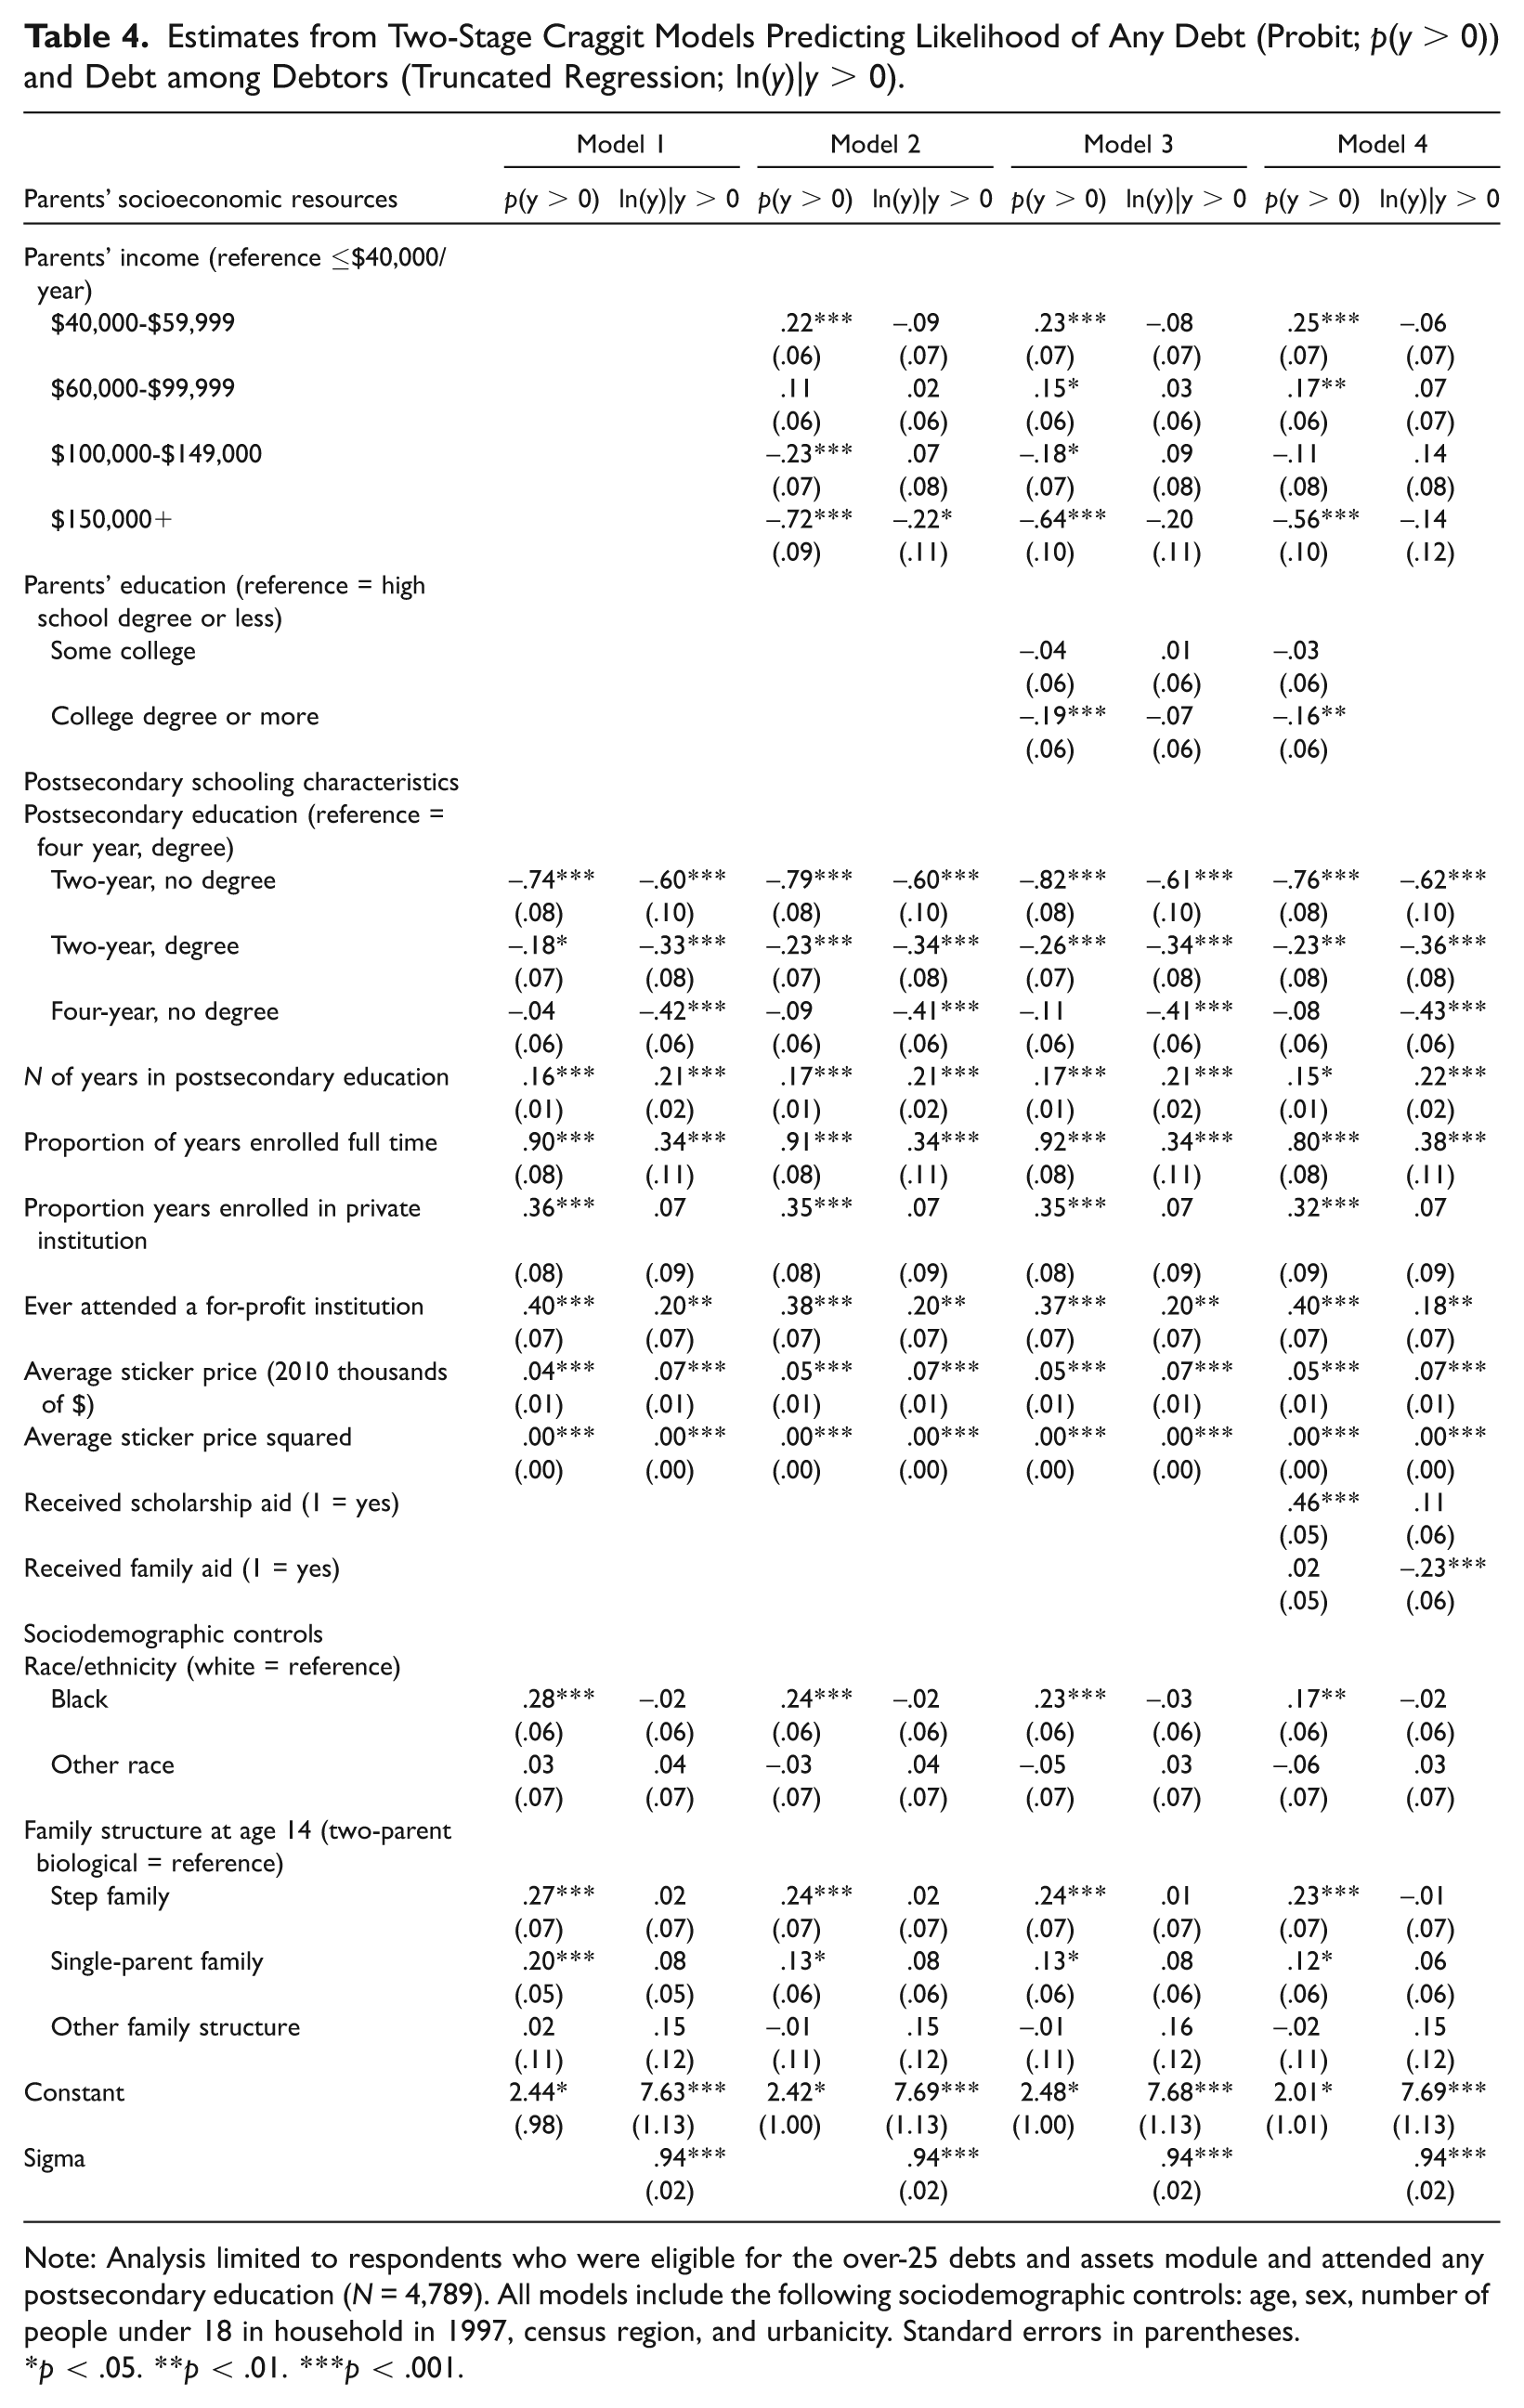
Note: Analysis limited to respondents who were eligible for the over-25 debts and assets module and attended any postsecondary education (N = 4,789). All models include the following sociodemographic controls: age, sex, number of people under 18 in household in 1997, census region, and urbanicity. Standard errors in parentheses.
p < .05. **p < .01. ***p < .001.
Estimates from Logistic Regression Models (Logit Coefficients) Predicting High Student Loan Debt (debt >$30,000).

Note: Analysis limited to respondents who were eligible for the over-25 debts and assets module and attended any postsecondary education (N = 4,789). All models include the following sociodemographic controls: age, sex, number of people under 18 in household in 1997, census region, and urbanicity. Standard errors in parentheses.
p < .05. **p < .01. ***p < .001.
Despite the fact that I find few differences in debt among debtors, the Craggit model sheds little light on who is at risk of accruing very high debt loads. To examine this issue, I turn to results from logistic regression models that predict very high (≥$30,000) debt. As Table 5 shows, parents’ SES is a strong predictor of the likelihood of having very high debt. In particular, young adults from high-income and highly educated families are significantly less likely to have high debt loads than are those from less affluent backgrounds. This pattern of findings is consistent with the reproduction of advantage perspective but not the middle-income squeeze.
Taken together, results from the Craggit and logistic regression models reveal two key insights. First, the average differences in debt presented in the OLS models are primarily driven by the probability of entering into debt—not differences in debt among debtors. Parents’ SES is strongly predictive of entry into debt, but once young adults are in debt, it is not predictive of the amount of debt they take on. Although young adults with debt display few differences in their amounts of debt, those from low-income and less educated backgrounds are more likely than their more advantaged counterparts to take on very high levels of debt.
Discussion
This study develops and tests two perspectives on the association between parents’ SES and student loan debt. I find support for both perspectives. The first perspective, the reproduction of advantage, predicts a negative association between parents’ socioeconomic resources and student loan debt. In support of this perspective, young adults from the highest income brackets and from college-educated families are relatively protected from student loan debt relative to their less advantaged counterparts. The second perspective, the middle-income squeeze, suggests that this view does not capture the whole story and predicts a nonlinear relationship between parents’ income and student loan debt. In support of this perspective, I find that young adults from middle-income families have a higher risk for debt than do young adults from lower and higher income backgrounds.
I find important nuances in the association between parents’ SES and student loan debt. First, prior work shows that postsecondary institutional characteristics are powerful predictors of debt (Baum and Saunders 1998; Choy and Carroll 2000). I confirm these findings, but I also find that postsecondary institutional characteristics moderate the association between parents’ SES and debt. Socioeconomic disparities in debt are stronger at private and more costly institutions. This suggests that lowering costs could be a lever to reduce disparities in student loan debt. Indeed, some schools are aiming to do this, such as UC-Berkeley, whose Middle Class Access Plan provides aid to young adults from middle-income families and caps annual tuition and fees at 15 percent of family income (University of California-Berkeley 2013). Alternatively, lowering costs may not be a straightforward advantage to students from middle-income and less educated backgrounds because disparities in debt could be larger in the absence of more advantaged students and families paying full price at these institutions. For example, institutions may use the revenue from high-income families paying full sticker price to provide aid for middle and lower SES groups. Thus, the disparities in debt observed here could be even greater in the absence of advantaged groups paying full price.
Second, I find the association between parents’ SES and debt differs across the debt distribution. Parents’ SES is a strong predictor of entry into debt, but I find few significant differences in average debt among those who have debt (Table 4). The clear takeaway from this finding is that observed socioeconomic differences in debt (as shown in Table 2) are primarily driven by the probability of going into debt, not by differences among debtors. However, despite the fact that I find few differences among debtors, the Craggit model does not speak to the risk of having very high debt (>$30,000). Indeed, although I find few differences in the amount of debt among debtors, young adults from high-income and educated families were much less likely to take on very high debt burdens compared to their low-SES counterparts (Table 5). I thus find support for the reproduction of advantage perspective as it pertains to entry into debt and accruing very high levels of debt. The middle-income squeeze, however, results from the fact that young adults from middle-income backgrounds are more likely to enter into debt as a way to pay for college. This may be due to their inability to get aid and their relative lack of parental resources; or, young adults from low-income backgrounds may be more debt averse (Callender and Jackson 2005), leading them to take on less debt than their middle-income counterparts.
All models show a consistent black-white disparity in student loan debt: African American young adults have a greater risk for student loan debt than do whites, net of all controls. This is an important topic for future research because such disparities in student loan debt may reproduce racial gaps in wealth among the college educated. Finally, I find that young adults from step families and single-parent families have a significantly higher risk for student loan debt than do young adults from two-parent families. These findings are consistent with research showing that parents in step and single-parent families do not contribute as much to their children’s college costs (Henretta et al. 2012).
This study provides new evidence on socioeconomic disparities in student loan debt, but it is not without limitations. First, these data lack measures of parents’ indebtedness and other measures that may mediate disparities in debt. Although I control for dichotomous indicators of aid from families and scholarships, these variables barely attenuate the association. This suggests multiple pathways and mechanisms may be at work. Future research should map out the pathways by which parents’ socioeconomic status affects young adult student loan debt. Second, I have no information regarding whether loans are low-interest government loans or high-interest private loans, and parents’ SES could affect loan type. Third, and most important, this study cannot speak to whether disparities in the probability of going into debt will affect the life chances of youth from low-SES and middle-income backgrounds. Will their debt (investment) pay off? Or, will their debt lead them to lag behind their more advantaged counterparts? Although I cannot directly assess this question, recent research and supplementary findings from this study lend support for the latter rather than the former.
First, debt may be problematic because high debt loads increase the risk for college dropout (Dwyer et al. 2012), and youth from lower income backgrounds are especially likely to drop out in response to unmet financial need (Chen and Zerquera 2011). As Table 5 shows, young adults from low-income and less educated families are considerably more likely to take on very high debt loads compared to their more advantaged counterparts (debt >$30,000) and are thus at greater risk for dropping out. This is particularly troublesome because individuals who leave college without a degree are 10 times more likely to default on their student loans than are those who complete college (Gladieux and Perna 2005), and a growing number of low-SES students are leaving college with debt but without a degree (Carey and Dillon 2011).
Student loan debtors—including but not limited to those who drop out—are also more likely to file bankruptcy, in part because they face significant financial problems trying to pay back their student loans and other debts (note that student loans are not dischargeable in bankruptcy; Porter 2012). Indeed, rising lifetime default rates among student loan debtors confirm that many young people are having difficulty keeping up with loan payments (College Board 2010b; Turner 2010). Low-SES and middle-income young adults—who have a higher likelihood of incurring student loan debt—may thus be at greater risk for defaulting on their loans and bankruptcy than are their more advantaged counterparts. Finally, among young adults age 25 and older, education debt is associated with lower levels of mastery and self-esteem, suggesting that the burden of repayment takes an emotional toll after one leaves college (Dwyer et al. 2011).
An alternative explanation for these findings is that socioeconomic disparities in debt are a trade-off that middle-income and low-SES young adults make to attend more elite institutions, get better credentials, and attain higher paying jobs than they would without taking on the debt. If this were the case, disparities in debt should disappear after controlling for sticker price or institutional type. However, disparities in debt are strong net of these factors, and supplementary analyses reveal they are barely attenuated by sticker price. Moreover, additional analyses revealed that socioeconomic differences in debt are robust to controls for young adults’ attained income and assets at age 25. This suggests that middle-income young adults and those from less educated backgrounds are not entering into debt as a trade-off to achieve higher incomes or greater wealth (results not shown, available upon request). However, I must concede that I am not able to assess long-term consequences of socioeconomic disparities in debt. This remains an important area for future research.
Getting a postsecondary education in the United States comes with the promise of upward social mobility and attainment of the American dream, and it is increasingly necessary for attaining middle-class jobs. But in an era where debt has become ubiquitous, young adults who are not from advantaged backgrounds start their careers on unequal footing by virtue of the money they owe for their education. These young adults disproportionately bear the risks that come with the burden of debt. Young adults from low-SES and middle-income backgrounds are more likely than their more advantage counterparts to turn to debt as a way to pay for college. Debt may be an especially large burden for young adults from lower income and less educated backgrounds, as they have a high risk of being saddled with very high debt loads. Future research should continue to explore how parents’ socioeconomic resources influence debt and how debt may affect young people’s future outcomes.
Footnotes
Acknowledgements
I thank Michelle Frisco, Molly Martin, Leif Jensen, Wayne Osgood, Stephanie Robert, John Mullahy, Emily Walton, Rachel Dwyer, Catherine Riegle-Crumb, and Eric Grodsky for helpful comments in preparation of this article. This work was completed while the author was a Robert Wood Johnson Foundation Health & Society Scholar at the University of Wisconsin-Madison. The author thanks the Robert Wood Johnson Foundation Health & Society Scholars Program for its financial support.
Notes
Author Biography
References
Supplementary Material
Please find the following supplemental material available below.
For Open Access articles published under a Creative Commons License, all supplemental material carries the same license as the article it is associated with.
For non-Open Access articles published, all supplemental material carries a non-exclusive license, and permission requests for re-use of supplemental material or any part of supplemental material shall be sent directly to the copyright owner as specified in the copyright notice associated with the article.