
Abstract
Pressure garments are commonly used in the treatment of hypertrophic and deformed scars. Pressure monitoring is crucial for effective pressure therapy. A new method is proposed to predict the amount of pressure acting on skin induced by pressure therapy gloves on the basis of hand curvatures extracted from three-dimensional hand images. The non-linear tensile properties of seven types of fabrics with various structures and their tension decay in relation to prolonged usage and reduction factors are examined. By taking into consideration the fabric elongation when the gloves are worn, a total of 36 pressure gloves are tailor-made by using three reduction factors. Based on the fabric tensile behavior, the corresponding glove pressure is predicted by the local strain, fabric tension per unit length and curvature of hand surface. No statistical difference at significance level of 0.05 is found between the predicted glove pressures and the measured values. In the measuring points on the dorsum of the hand, except the metacarpal site, the root mean square error ranges from 0.79 to 1.18 kPa. The investigation confirms that all pressure gloves lose tension and, therefore, pressure delivering ability upon repeated uses. It is also revealed that the pressure measuring positions and their corresponding curvature and geometry changes caused by hand movements and postures are closely associated with interfacial pressure delivered by the glove.
Scarring is part of the natural continuum of tissue repair when a wound heals. During the wound healing process, abnormal hypertrophic scars may be formed if excess collagen is produced. These scars are thick, raised, highly vascular and dark red in appearance, which may result in pain, cosmetic disfigurement, skin hypersensitivity, itchiness, etc. Since they are commonly located over areas of high tension, movement and flexor of the extremities, the outcome can comprise complications with joint contractures, limb deformities and affect cosmetic appearance. 1 In many cases, hypertrophic scars occur as the result of burns and soon after surgery.
Pressure therapy garments have played an important role in treating hypertrophic scars from burns since the 1970s. Pressure garments are non-invasive and treat scars by applying adequate pressure to increase the rate of scar maturation, prevent contracture formation and enhance cosmetic appearance. 2 Amongst the various body parts, hands are a very common site for burns and scald injuries because they are usually exposed, and are often used in a reflex action to protect the face from danger. Particular attention is always paid to the hand in hypertrophic scar management, since the finger and thumb joints are very sensitive and the range of motion can be gone quickly. 2 Edema forms rapidly and is a serious threat to hand functions. Uncontrolled edema collects on the dorsum of the hand where tissues are loose. This causes the metacarpophalangeal joints to hyperextend, stretching the long flexor tendons of the hand so that the interphalangeal joints are pulled into flexion and result in a clawed hand. 3 An appropriate pressure therapy glove therefore not only prevents fingers from deformation, but also limits wrist or finger flexion.
Prescribing a pressure therapy glove with a required pressure that could control the formation of excess wound collagen is crucial in the healing process. The literatures have indicated that a continuous pressure at the capillary level of 25 mmHg could affect the realignment of collagen bundles and might control over-exuberant collagen synthesis.2,4,5 The fabrication of pressure therapy gloves is vital, since fabric compression is induced by fabric tension when the pressure glove is stretched and worn by the patient. Traditionally, weft-knitted single jersey or warp-knitted powernet fabrics in either nylon spandex or cotton spandex were used. Patterns were then developed by reducing the circumferential hand dimensions by 10–20% in accordance with the fabric extensibility. 6 However, after a certain period of use, the fabric of the pressure glove decays and loosens, which leads to reduction in pressure and affects the glove’s effectiveness and practical use. Due to the non-linear tensile properties of textile materials, deterioration of the elasticity of the gloves and the compression performance of pressure gloves are still unknown.7–9 Traditionally, the fitting and adjustments made on pressure garments to resume pressure are subjectively assessed based on the experience of individual practitioners. Despite anecdotal and clinical evidence of the beneficial effects of pressure therapy for hypertrophic scars, there is little scientific evidence available to evaluate the fabric mechanical properties and their relation to the magnitudes of the pressure applied to skin. Some of the previous work measured and/or simulated the pressures exerted onto the limbs of the body by constructing pressure sleeves in a tubular form.10–12 Body curvatures and fabric tensile properties have both been proven to be closely related to the prediction of skin-and-garment interfacial pressures. Nevertheless, the anatomy of the hand is non-spherical and gloves are one of the most complicated engineered apparel products, with a complex construction that allows patients to freely and comfortably move their hands. In this study, a novel approach of evaluating fabric compression performance on pressure therapy gloves is proposed. Hand curvatures obtained from cross-sectional hand images are incorporated in the prediction of glove–skin interfacial pressure. The effects of fabric tension decay properties and reduction factors in pattern development, which affect the dimensions of glove patterns on the compression performance of pressure therapy gloves, are also examined. A key contribution of this study is to develop a methodology to predict the glove pressure using an empirical model for the development of pressure therapy gloves. It acts as a reference to practitioners for selecting suitable fabrics in developing pressure gloves and maintaining suitable glove–skin interfacial pressures, and thus formulating an optimal program for hypertrophic scar treatment and improving the compliance rate and efficacy of the pressure therapy treatment.
Principles underlying the calculation model
Laplace’s Law has been adopted to study and predict the amount of pressure delivered to the skin by pressure garments in several studies.13–15 Equation (1) shows the Laplace’s equation in calculating the pressure:

Equation (1) is under the assumption that human body parts are in a circular shape. It can easily estimate the pressure exerted by a pressure garment onto the human body with a short computation time. Based on Laplace’s Law and the tensile properties of elastic fabric, Ng and Hui
7
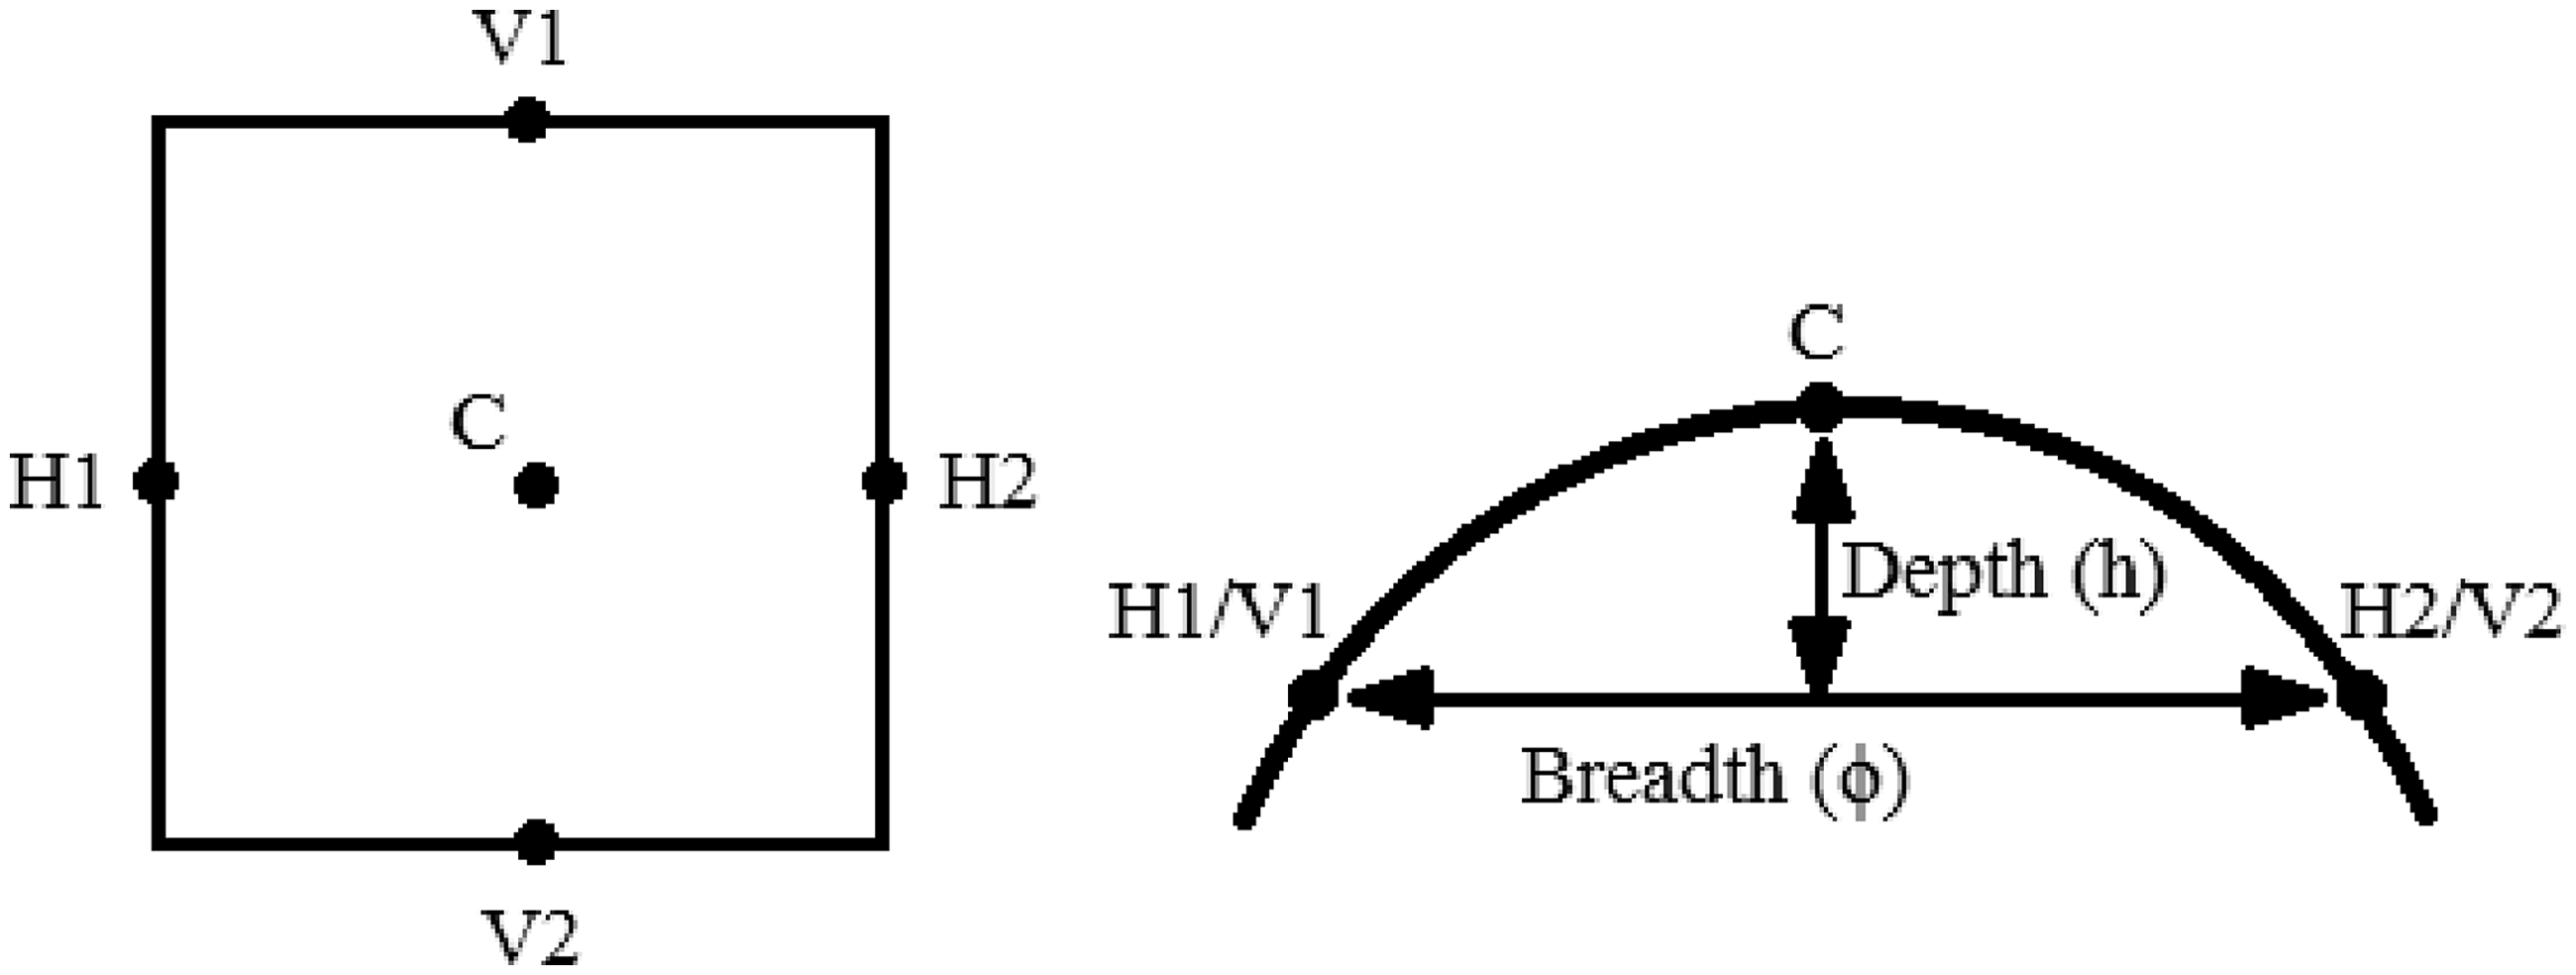
developed a pressure model with elastic fabric for the development of pressure garments for the limbs and/or trunks of the body. However, the anatomy of the hand is somewhat non-spherical, which is illustrated by the hand cross-section diagram in Figure 1. The equation might not be applicable to arbitrary body shapes. Hence, it is crucial to identify an appropriate empirical model for predicting skin pressure when pressure gloves are worn.
The cross-section of a hand extracted from a three-dimensional image analysis.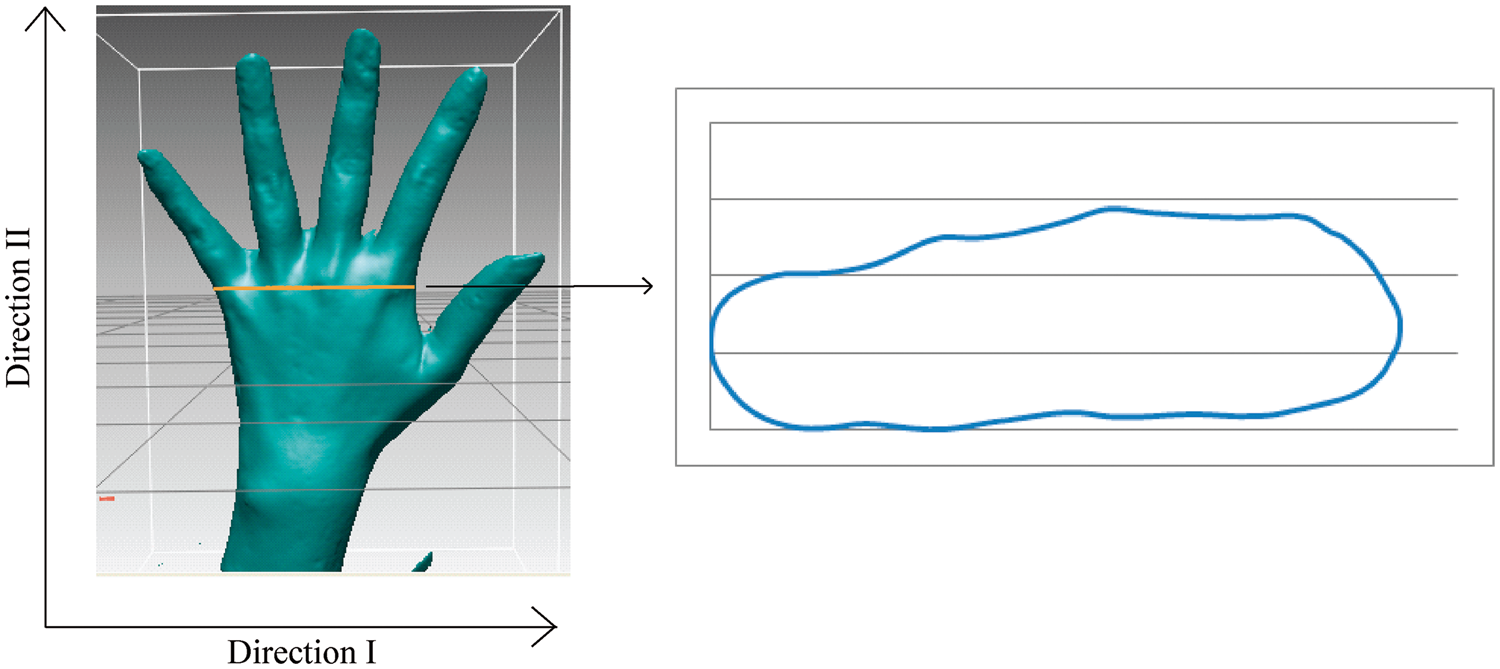
Hasegawa and Ishikawa
16
modified the Laplace’s equation into Equation (2) to take into consideration the difference in the curvature in the wale and course directions of a garment:

In a study that predicted pressure on skin induced by a tight-fitting girdle,
9
the body curvature of the pressure measuring point was determined by using Equation (3). The results indicated that consideration of body curvatures is crucial in predicting garment pressures, which can enhance the accuracy of prediction models and prevent adverse physiological hazards, bruises and/or ischemic injury to the wearer. The dome curvatures (K) of the hand in both Directions I and II, as shown in Figure 1, are determined by Equation (3). In this paper, Direction I is defined as the horizontal direction while Direction II is defined as the vertical direction:
In addition, Hasegawa and Ishikawa’s pressure model will be adopted for the determination of glove–skin interfacial pressure. Hence, to formulate a pressure prediction model for the development of pressure therapy gloves, the steps of this research study include examination of fabric tensile behavior, investigation of fabric tension decay after repeated extensions, measurement of glove–skin interfacial pressure and glove strain, and determination of hand curvatures. A flow chart diagram is illustrated in Figure 2.
Flowchart of the experimental design.
Experimental work
Fabric samples
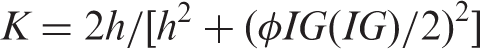
Fabrics used for pressure therapy are usually warp knitted and consist of spandex to provide elasticity and dimensional stability. Seven types of fabrics with various structures (powernet, satinnet and weftlock) that are commonly used for producing pressure therapy garments are selected in this study. The details of the fabric specifications and the fabric structural diagrams are presented in Table 1 and Figure 3, respectively. Powernet is formed by four partially threaded guide bars; the yarns are well-balanced, which provides good stability and recovery in both directions. As shown in Figure 3, satinnet is formed by two fully threaded guide bars, whilst weftlock is formed by two guided bars (including one fully threaded and one partially threaded). The dense structures of satinnet and weftlock generally possess good resistance to deformations upon repeated extensions and use, but less air permeable. Amongst the seven fabrics, Fabric G has a cotton component in addition to nylon and spandex for enhancing comfort. It is commonly used for the initial stages of treatment for less stable scars or the treatment of children to give a more gentle application of pressure.
Structural diagrams of (a) powernet, (b) satinnet and (c) weftlock fabric. Warp-knitted fabric specifications
Step 1 and 2: investigation of fabric tensile behavior and tension decay
The initial tensile behavior of the seven fabrics was firstly investigated by using an Instron tensile tester (Model 4411). As fabric tension decreases after repeated wear and deformation erodes the effectiveness of a pressure garment over time, the impact of fabric tension properties on glove–skin pressures against repeated use was investigated. A fabric extender (Figure 4) was used to simulate the repeated use of the gloves for evaluating the deterioration of fabric elasticity. This extender is actuated by a pneumatic cylinder with a diameter of 8.3 cm and length of 30 cm, which is controlled by a computer program. The specimens were cut and sewn into a tubular form with circumferences of 23.5, 22.2 and 20.9 cm in accordance with the standard reduction factors of 10%, 15% and 20%, respectively, which are commonly used for making pressure therapy garments. After a fabric tube was mounted on the extender, the fabric can be stretched when the cylinder extends and the circumference of the fabric extender increases with the cylinder stroke. The original fabric tensile behaviors and the change in fabric tension after repeated extensions in relation to the reduction factors were measured by using an Instron tensile. A fabric sample of 5 cm × 10 cm was required for each test. Fabric tensile behaviors in both wale and course directions were measured. Referring to the strain calculation equation given in Equation (4), the corresponding fabric strains of pressure gloves with the reduction factors of 10%, 15% and 20% were calculated by Equations (5)–(7), respectively.
Fabric extender.


In consideration of the possible high fabric strains when the pressure glove is worn, a 50% loading strain was also examined. Therefore, fabric tension per unit width at strains of 11.1%, 17.6%, 25.0% and 50.0% were recorded. The percentage of tension decay was calculated by dividing the decrease in fabric tension with the tension of the original fabric, as shown in Equation (8):

Step 3: measurement of glove–skin interfacial pressure and glove strain
In this step, the amount of glove–skin interfacial pressure was measured. In this study, a total of four healthy female subjects aged from 19 to 23 years old (mean: 20.25, SD: 1.89) were recruited. The inclusion criteria were that the participants: (1) are above 18 years old; (2) have no burn injury history on their hands so that they can perform the different hand postures as required in the experiment; (3) are not required to handle heavy loads in daily life, which can better simulate the life of patients who receive pressure therapy treatment; and (4) can fluently communicate in Cantonese. Ethical approval was obtained from the Human Subjects Ethics Sub-Committee at the Hong Kong Polytechnic University. Based on the hand dimensions of each subject, a series of pressure gloves were custom-made for them by using Fabrics A, D and G, respectively, which represented three different fabric structures. Fabric structure is one of the main factors affecting the fabric tensile properties, thus influencing the interfacial pressure delivered to the wearers. Amongst the five powernet structure fabrics, Fabric A was chosen for making the glove samples because it is the most common fabrication of custom-made pressure therapy gloves used in the local hospital. The left hand of each subject was first scanned with a three-dimensional (3D) laser scanner (NextEngine Inc.) to obtain a 3D hand image and hand dimension measurements for glove pattern making. The subjects were asked to relax their hand on the table with fingers spread apart. For each fabric, three pressure gloves were made with applied reduction factors of 10%, 15% and 20%. A total of nine pressure therapy gloves were therefore developed for each subject.
A Novel Pliance X system pressure sensor, which has been validated for measuring interfacial pressure generated by pressure garments, was adopted.
17
The sensor consists of a circular sensing area with a diameter of 10 mm (area = 78.54 mm2) and 0.95 mm in thickness. A non-sensing extended conductive strip, which allows insertion to the desired measuring points, is used. This is a capacitive sensor with sensing pressure ranging from 0.5 to 60 kPa; the experimental error was proven to be less than 0.13 kPa. There is high linearity between the applied pressure and sensor outputs and good repeatability with coefficients of variation less than 0.1.
18
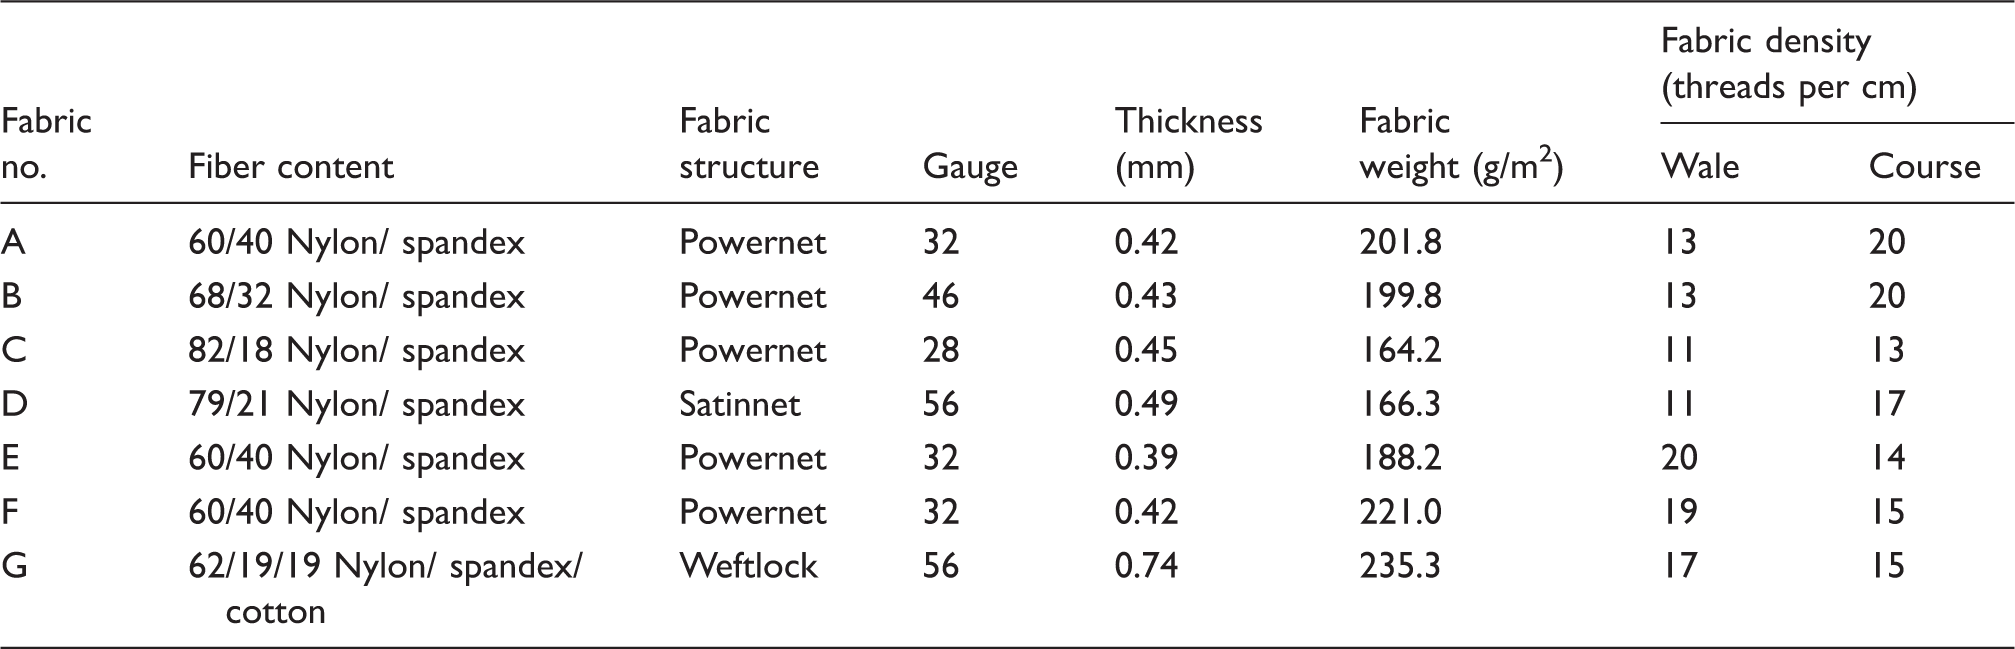
During the testing, the subjects were also asked to relax their hand on the table with fingers spread apart and a pressure sensor was placed between the glove and hand. As shown in Figure 5, interfacial pressure measurements were taken at six different points. Location P1 is on the metacarpal of the middle finger, locations P2, P3, P4 and P5 are on the dorsum of hand, whilst location P6 is on the middle finger. Location P1 is chosen as a point to represent the rigid, bony, convex region of hand. Locations P2, P3, P4 and P5 are the relatively flat and soft sites at the back of the hand, which are a common site for burn or scald accidents because clenching fists is one of the human reflex actions to protect the face from dangers. Four measuring locations were examined in this work so as to obtain a better understanding on the variation and distribution of interfacial pressure over this area. Since fingers have a cylindrical shape with a small diameter, leading to major variations of hand curvatures and glove pressure, the glove pressure at location P6 was also measured. Hence, the impact of hand variables, such as curvatures, soft tissue padding and rigidity on the glove–skin interfacial pressure, can be examined. The interfacial pressure was measured three times at each location and their mean values were calculated. To simulate the practical use of the pressure gloves, the amount of glove–skin interfacial pressures in three different hand postures, namely resting on a table, holding a cylindrical water bottle and clenching fist tightly, were also recorded.
Pressure measuring points on the dorsum of the hand.
To measure the fabric strains when the gloves are worn, 1 cm × 1 cm grid squares were carefully marked onto the glove sample. The actual sizes of the grid squares were further verified by using a digital caliper. The dimension changes of the grid squares were then measured when the glove was worn (see Figure 6). Fabric strains at the six locations (P1, P2, P3, P4, P5 and P6) can be calculated by using Equation (4).
Pressure therapy glove with 1 cm × 1 cm grid squares.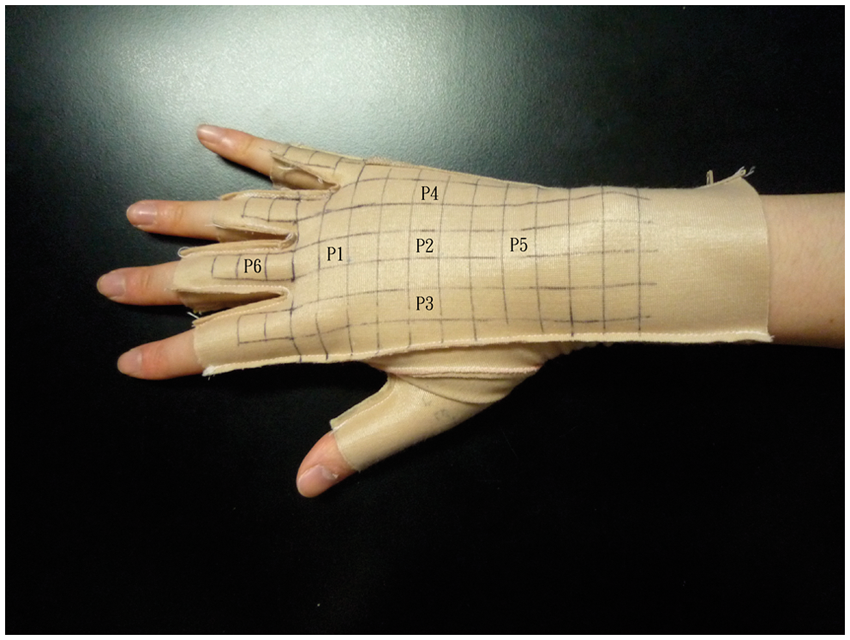
Based on the fabric strains and the measured fabric tensile behavior obtained from the Instron tensile tester, the resultant fabric tensions of the nine glove samples on each subject can be determined respectively.
Step 4: determination of hand curvatures
With the use of RapidForm 2006 (INUS Technology Inc.), which is a reverse engineering software, the 3D coordinates at any point of a 3D hand image can be determined. To quantify the vertical and horizontal curvatures of the pressure measuring point, a total of five 3D coordinates at each of the pre-defined measuring points, as illustrated in Figure 7, were recorded. The distance between points H1 and H2 and that between points V1 and V2 were taken as the breadth of the curvature ( Five coordinates on a measuring point to be obtained from a three-dimensional image.

As a result, hand curvatures in both the vertical and horizontal directions can be calculated by using Equation (3).
Step 5 and 6: formulation and verification of pressure prediction model
On the basis of the hand curvatures and the actual fabric tensions obtained above, the magnitudes of glove–skin interfacial pressures induced by the pressure therapy gloves at the six locations for each fabric and subject can be predicted respectively by using Equation (2).
The empirical glove–skin interfacial pressure prediction model and the amount of pressure decay over repeated use were then verified. The four subjects were further asked to wear each of the nine gloves (made of Fabrics A, D and G with reduction factors of 10%, 15% and 20%) for 80 consecutive hours, except during daily hygienic cleaning. The subjects were given standard written and verbal instructions on the wearing regime, as well as care and washing instructions. The amount of glove–skin interfacial pressures at the six locations in three different hand postures (resting on a table, holding a cylinder and clenching fist tightly) were measured. The extent of pressure changes obtained over the simulated wear trial was recorded and analyzed.
Results and discussion
Step 1 and 2: fabric tensile behavior and tension decay
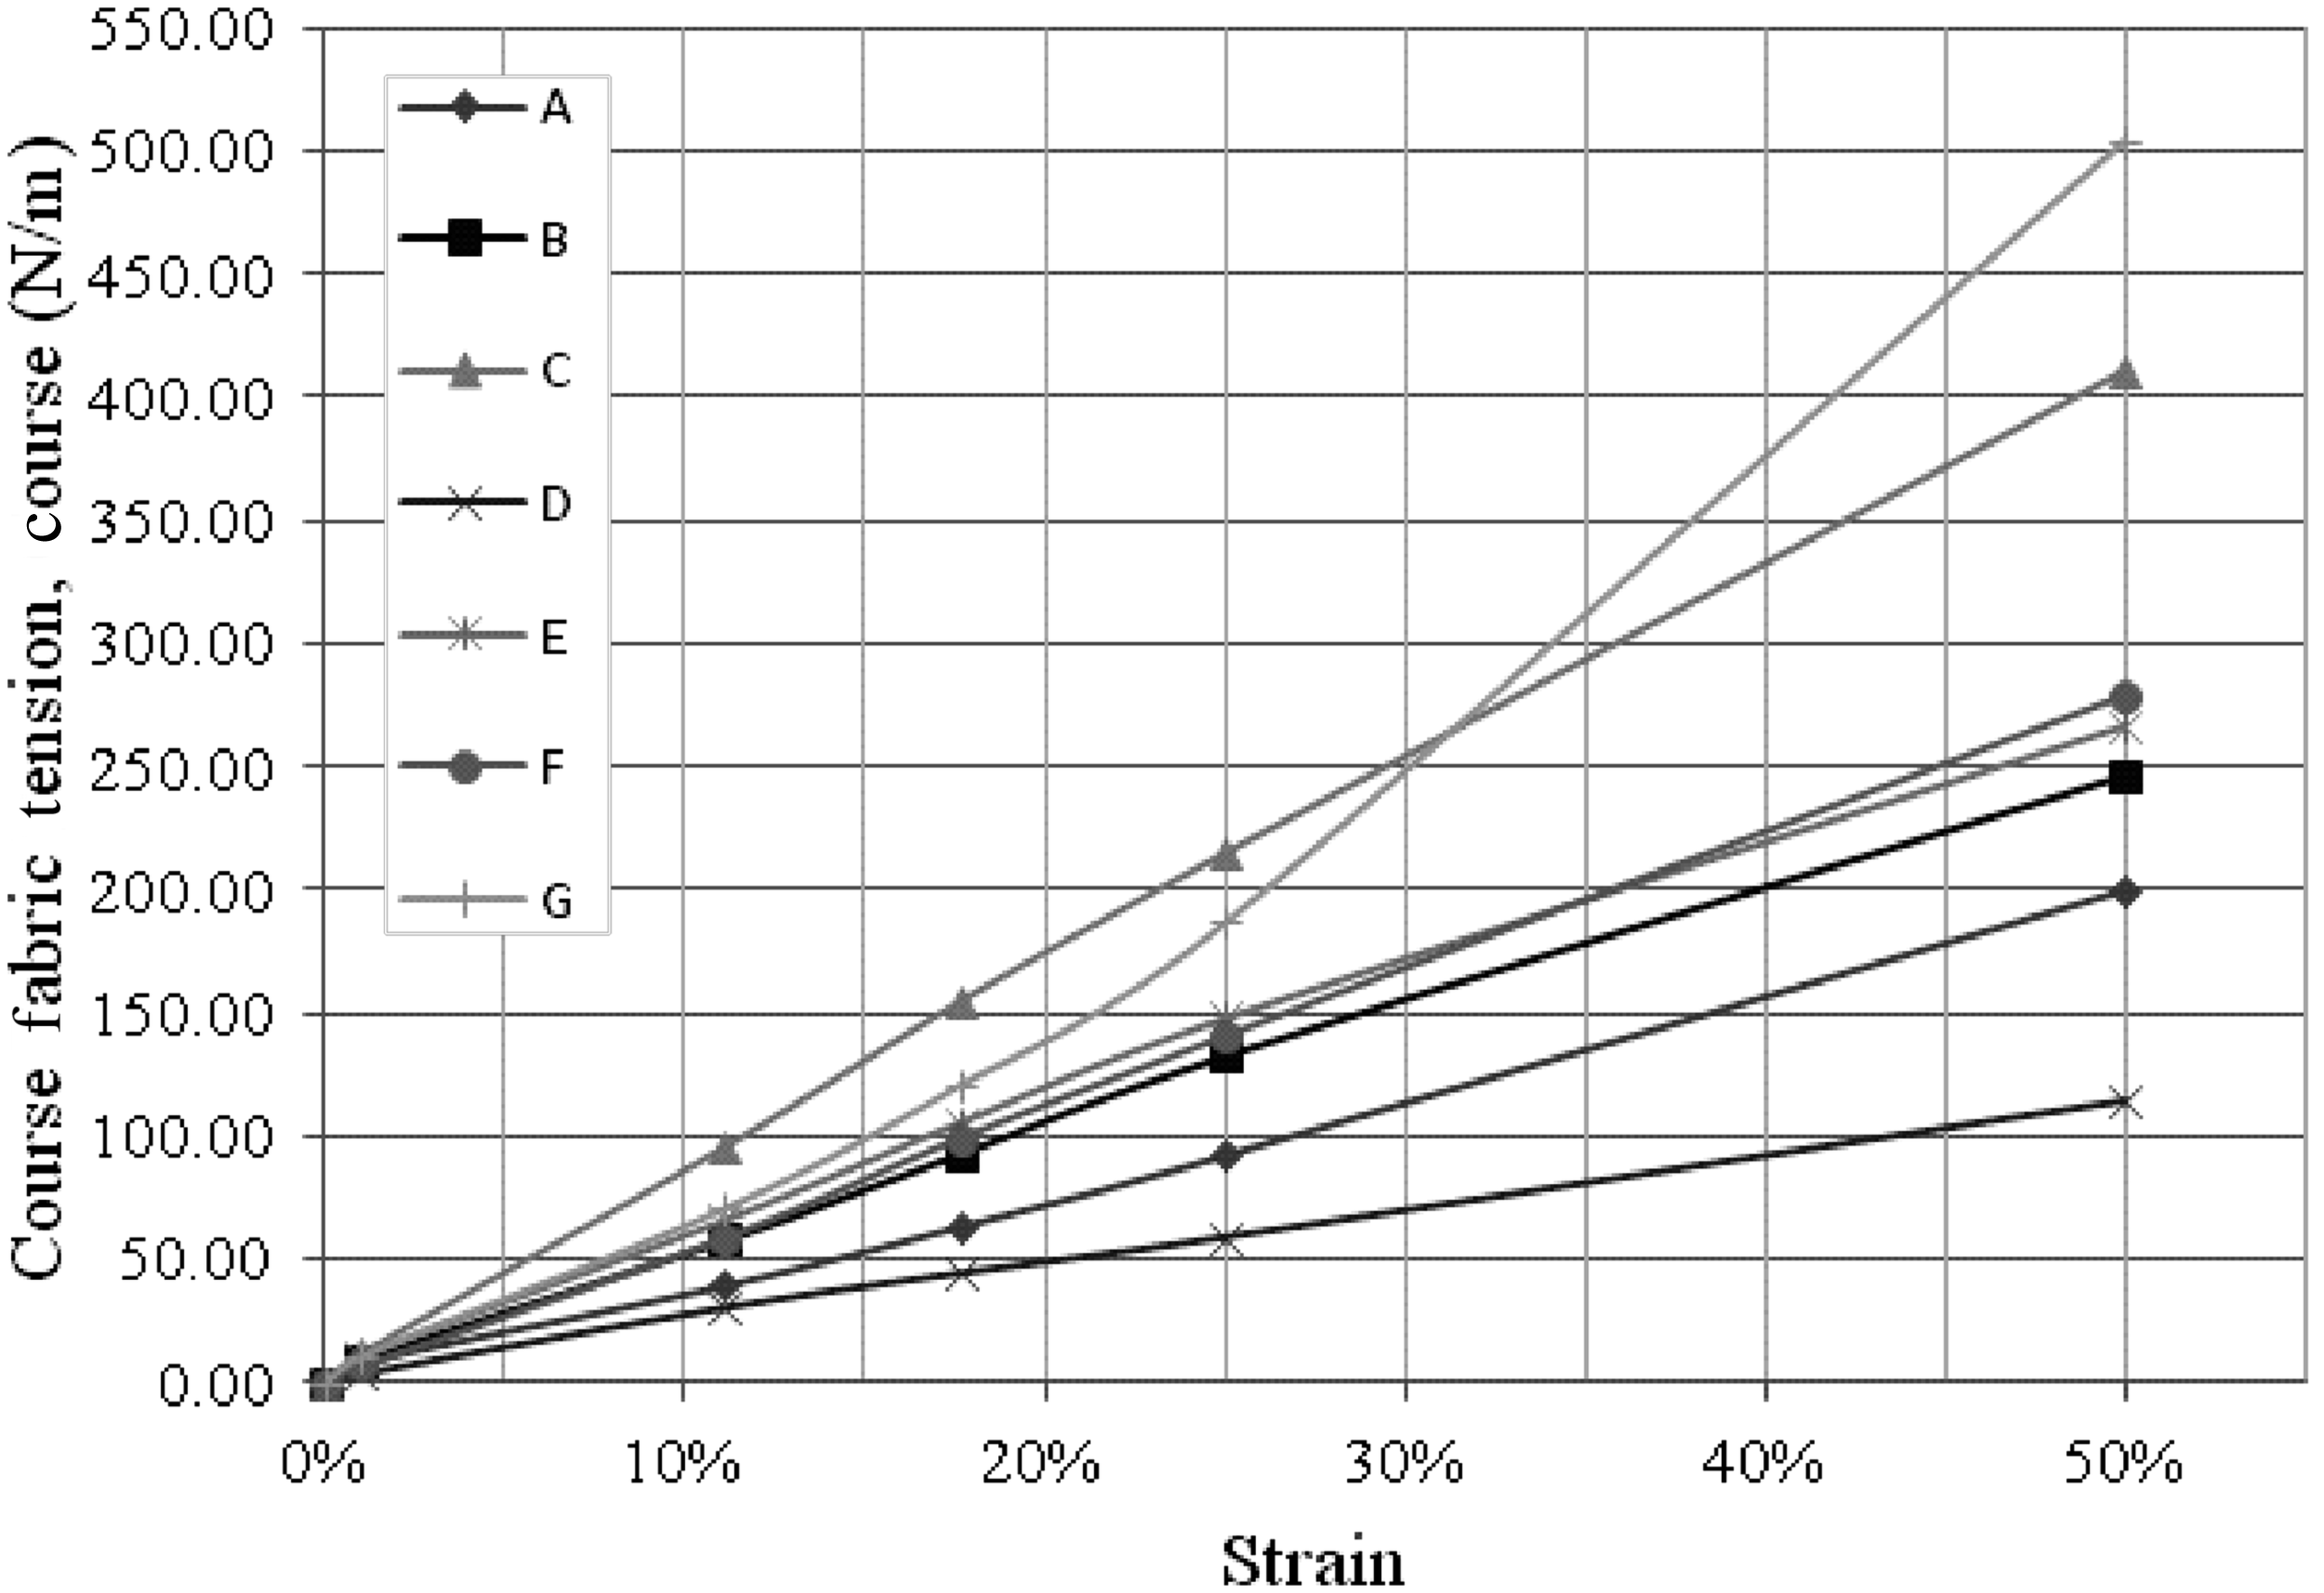
Fabric initial tensions at strains of 11.1%, 17.6%, 25% and 50% were measured by using the Instron tensile tester. Fabric tension results in the wale and course directions are shown in Figures 8 and 9, respectively. Amongst the seven types of fabrics, Fabrics A, B, C, E and F exhibit a very similar trend in tensile behavior, since they are all powernet fabrics. Except for Fabric C, fabric tensions range from 186 to 291.6 N/m in the wale direction, and from 200.33 to 279.13 N/m in the course direction at a strain of 50%. Fabric C has an extraordinary high tension of 410.67 N/m in the course direction, which is considerably higher than that in the wale direction (197.67 N/m). These high-tension results may be explained by the low spandex content and the yarn density of Fabric C, which make it difficult to be stretched in the course direction. Fabric D (satinnet) and Fabric G (weftlock) have different tensile behaviors that are attributed to the powernet fabric. The tension results of Fabric D obtained in the wale direction are remarkably higher than that obtained in the course direction. In the wale direction, the tension increases slowly with increasing strains from 0% to 10%. The fabric tension sharply increases in the wale direction when the strain is increased to 25% and reaches 388.26 N/m at a strain of 50%, which is the highest tension among all of the seven types of fabrics studied. It is also noted that the tensile behavior of Fabric G enormously varies from that of Fabric D. Fabric G has very low tension results in the wale direction, but the tension radically increases when the strain is increased to 25% and reaches 504.53 N/m at a strain of 50% in the course direction. The satinnet structure has long underlaps of inlay yarns, so it is less stable in the course direction against deformation as compared with the weftlock structure. The close laps of the weftlock structure together with its inlay yarns hold the yarns in position, increasing its stability against tensile deformation in the course direction. However, the fabric extended readily in the wale direction due to its long underlaps of yarns in the wale direction.
Initial fabric tensions in the wale direction for the seven types of fabric. Initial fabric tensions in the course direction for the seven types of fabric.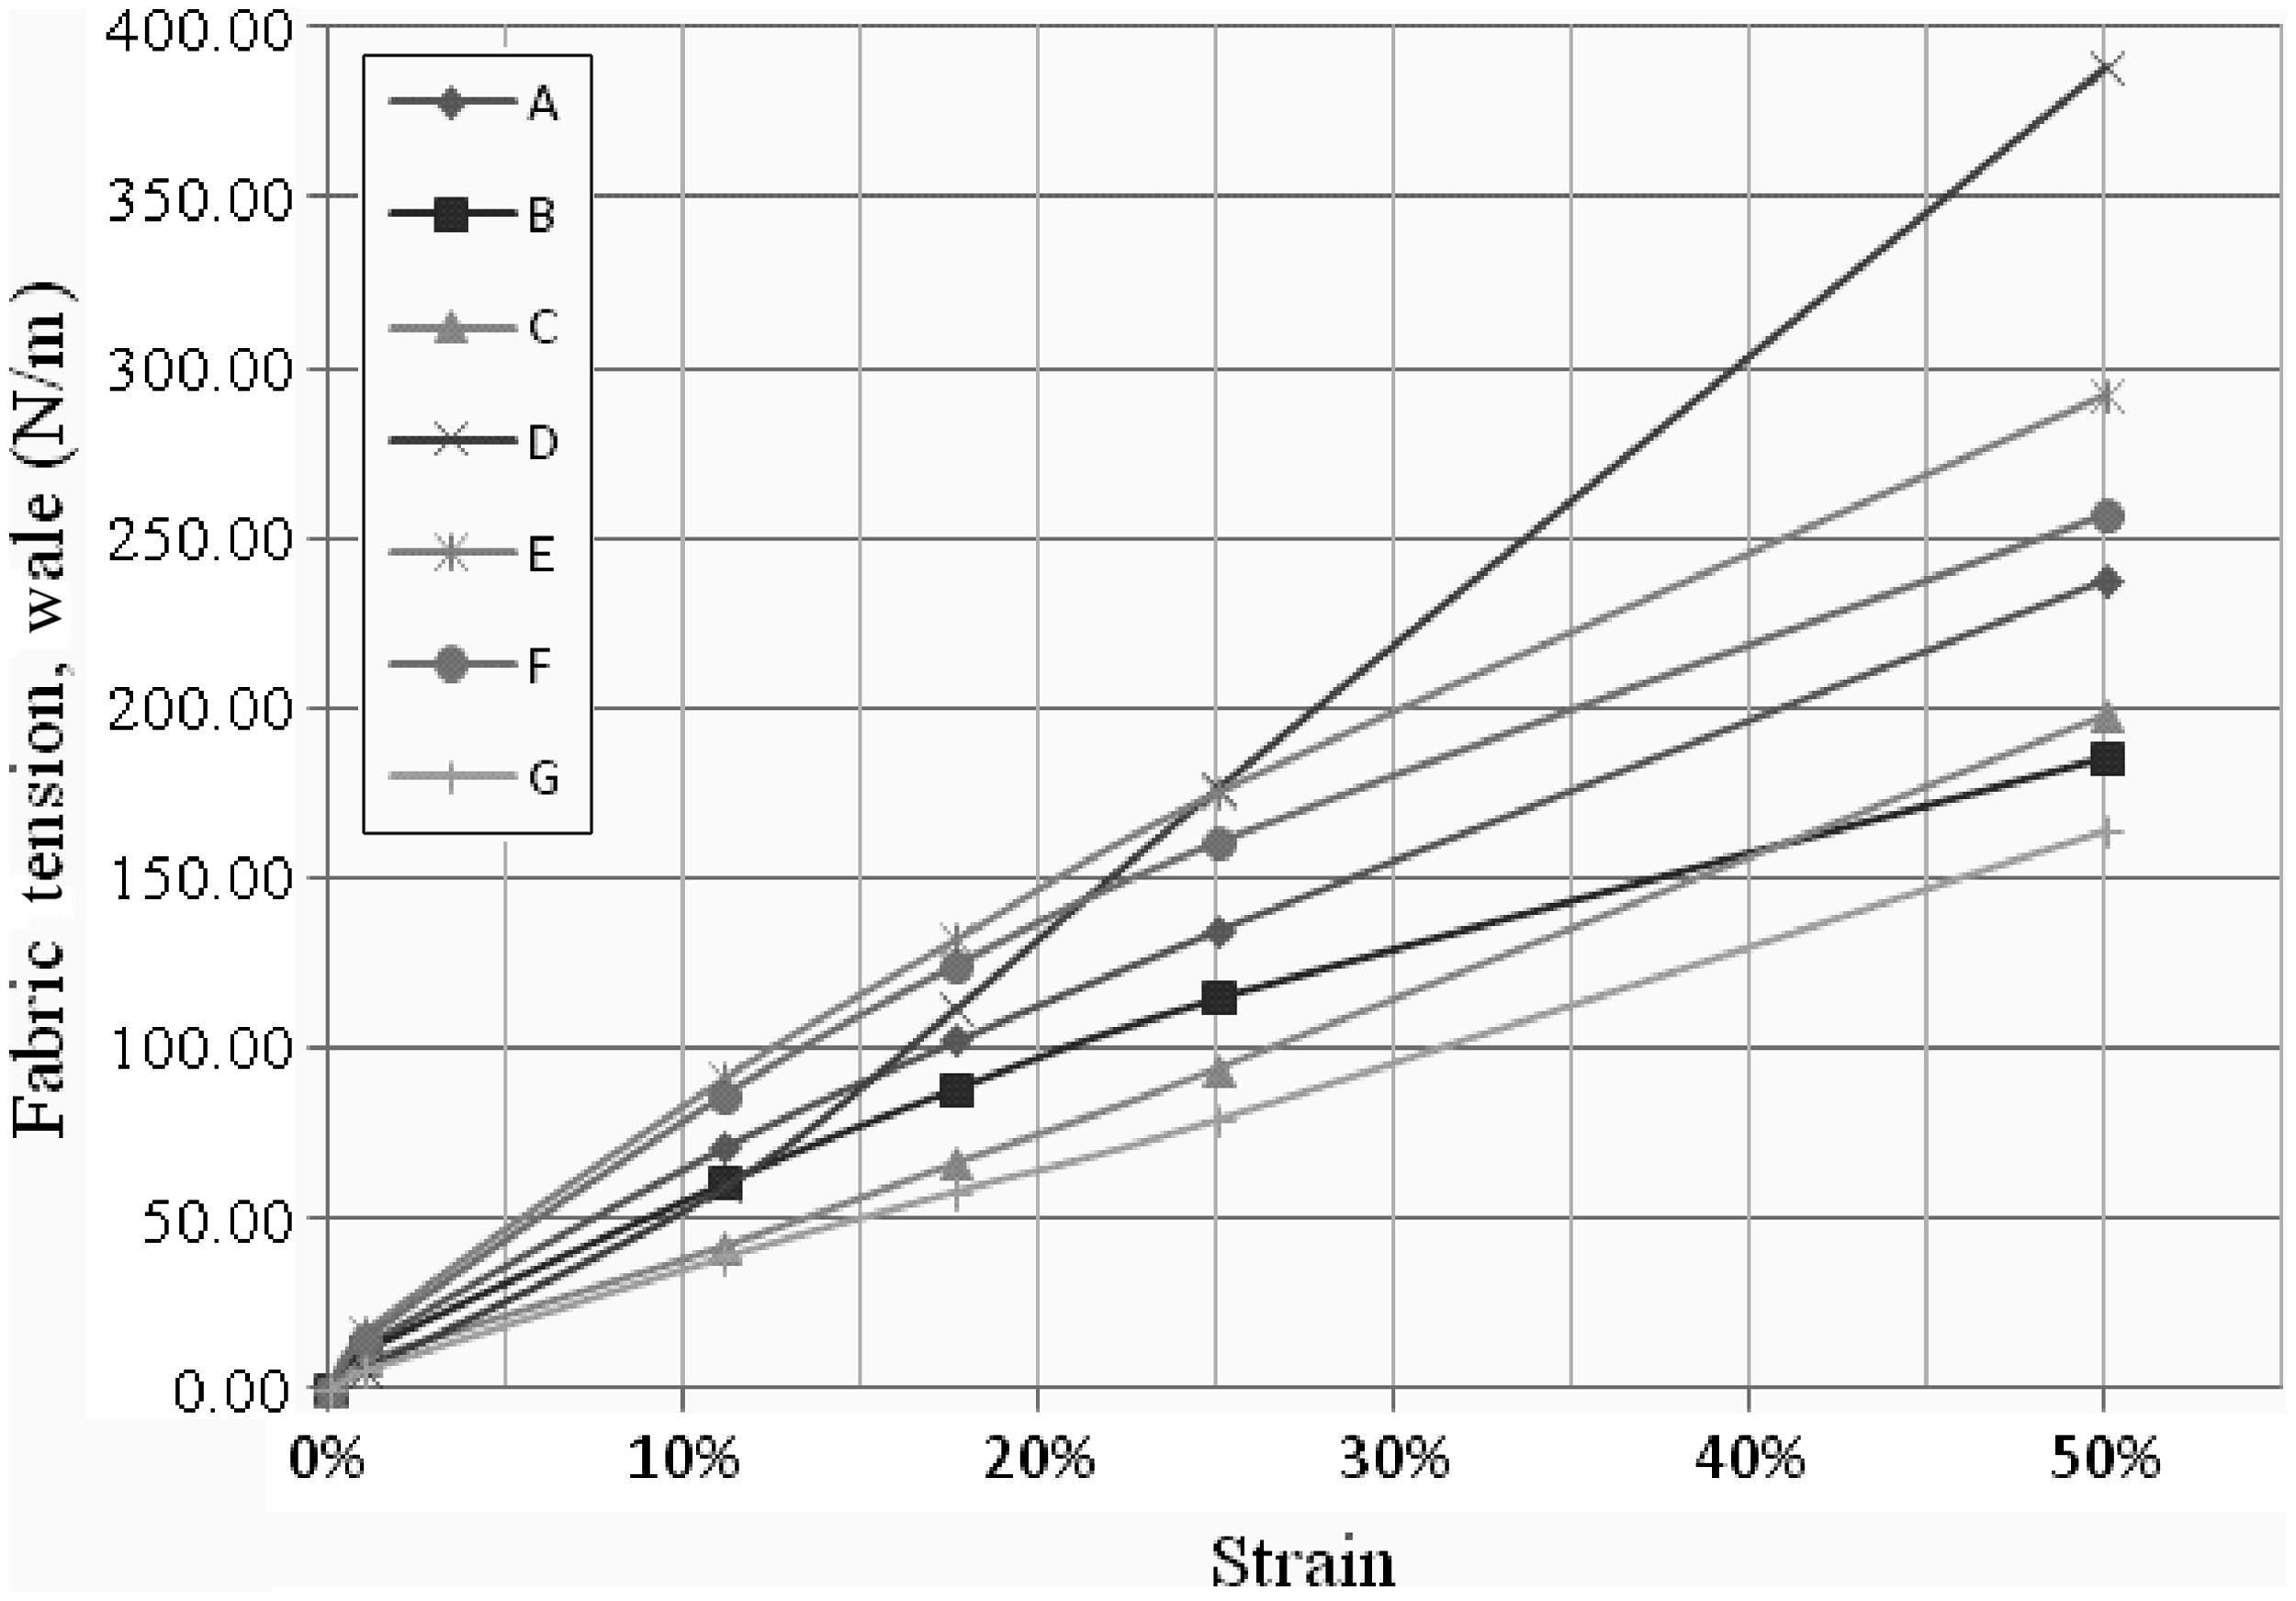
Fabric tension decay after 360 cycles of extension

Fabric structure, apparently, is one of the main factors affecting the tensile behavior of a fabric. The initial stress/strain curves of fabrics A, D and G, representing three different structures and their tension decay behavior with reduction factors of 10%, 15% and 20% in the wale and course directions, are further plotted in Figure 10. As the fabric samples are kept in a constant thickness throughout the whole study, to simplify the fabric stress calculation, fabric thickness is neglected. As shown in Equation (11), each of the stress/strain curves is fitted with a second-order polynomial. The polynomial function of each stress/strain curve and the R2 value are also given in Figure 10:
(a) The stress/strain curve of Fabric A in the wale direction. (b) The stress/strain curve of Fabric A in the course direction. (c) The stress/strain curve of Fabric D in the wale direction. (d) The stress/strain curve of Fabric D in the course direction. (e) The stress/strain curve of Fabric G in the wale direction. (f) The stress/strain curve of Fabric G in the course direction.
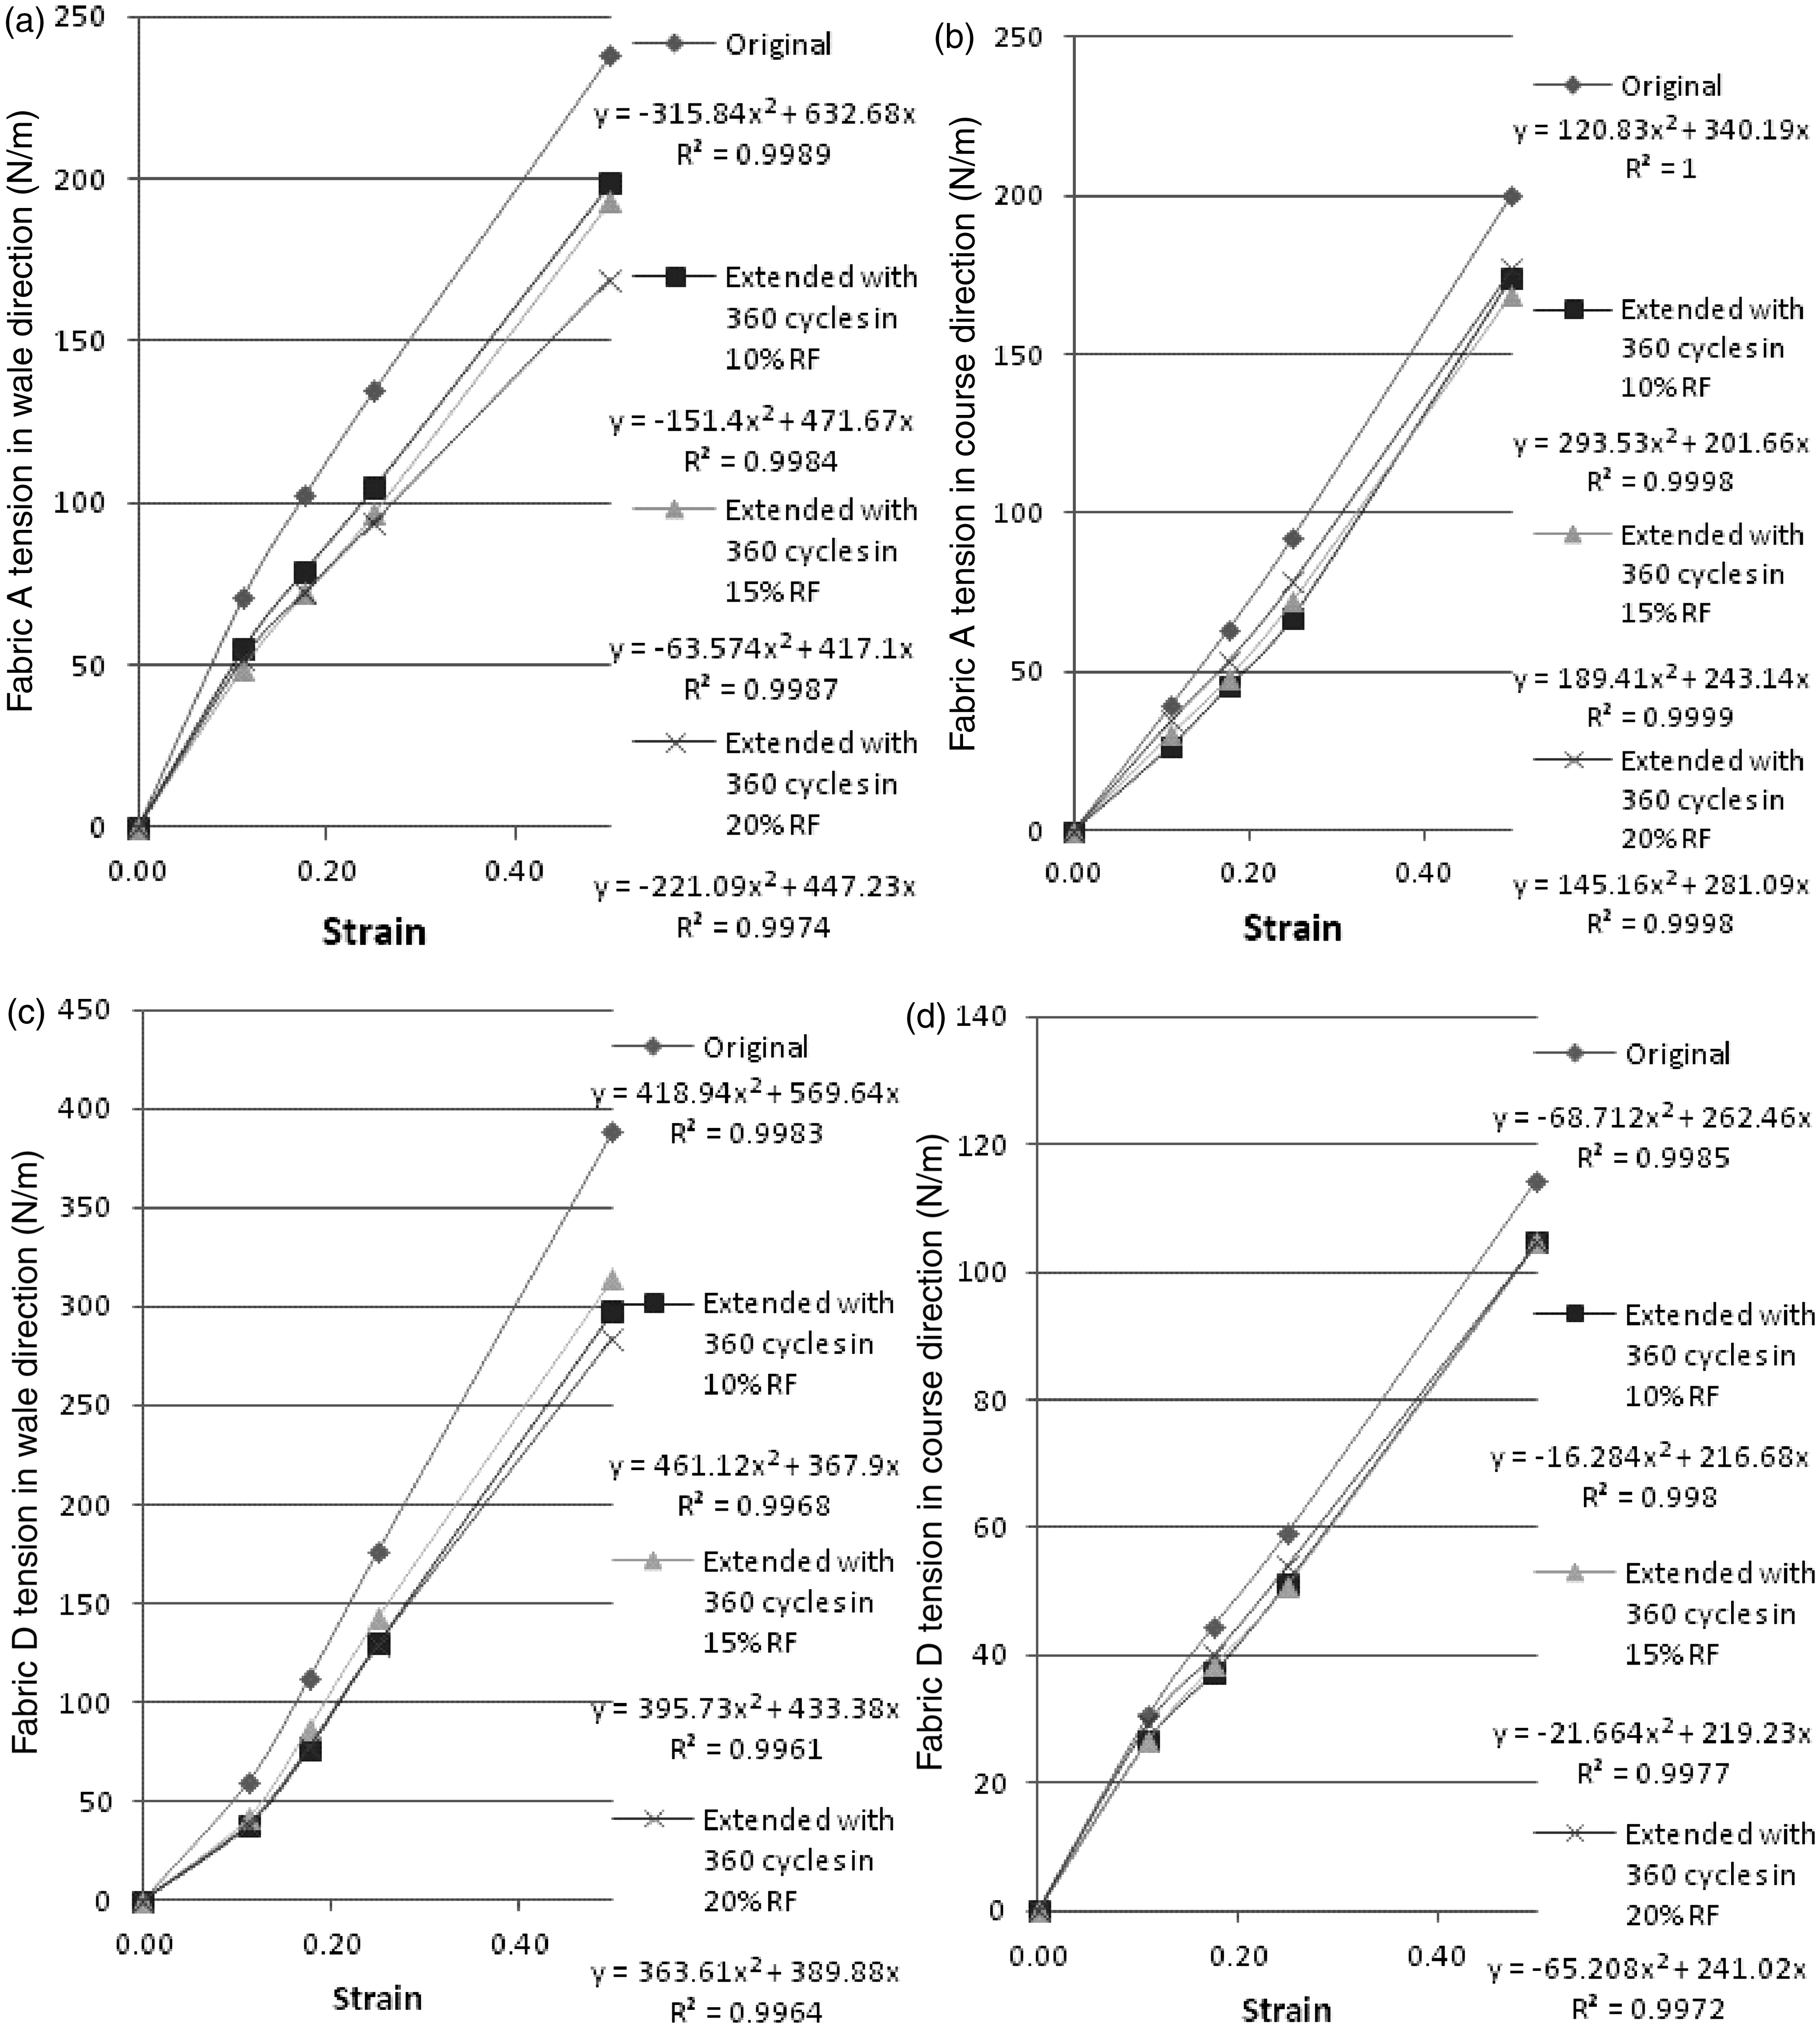
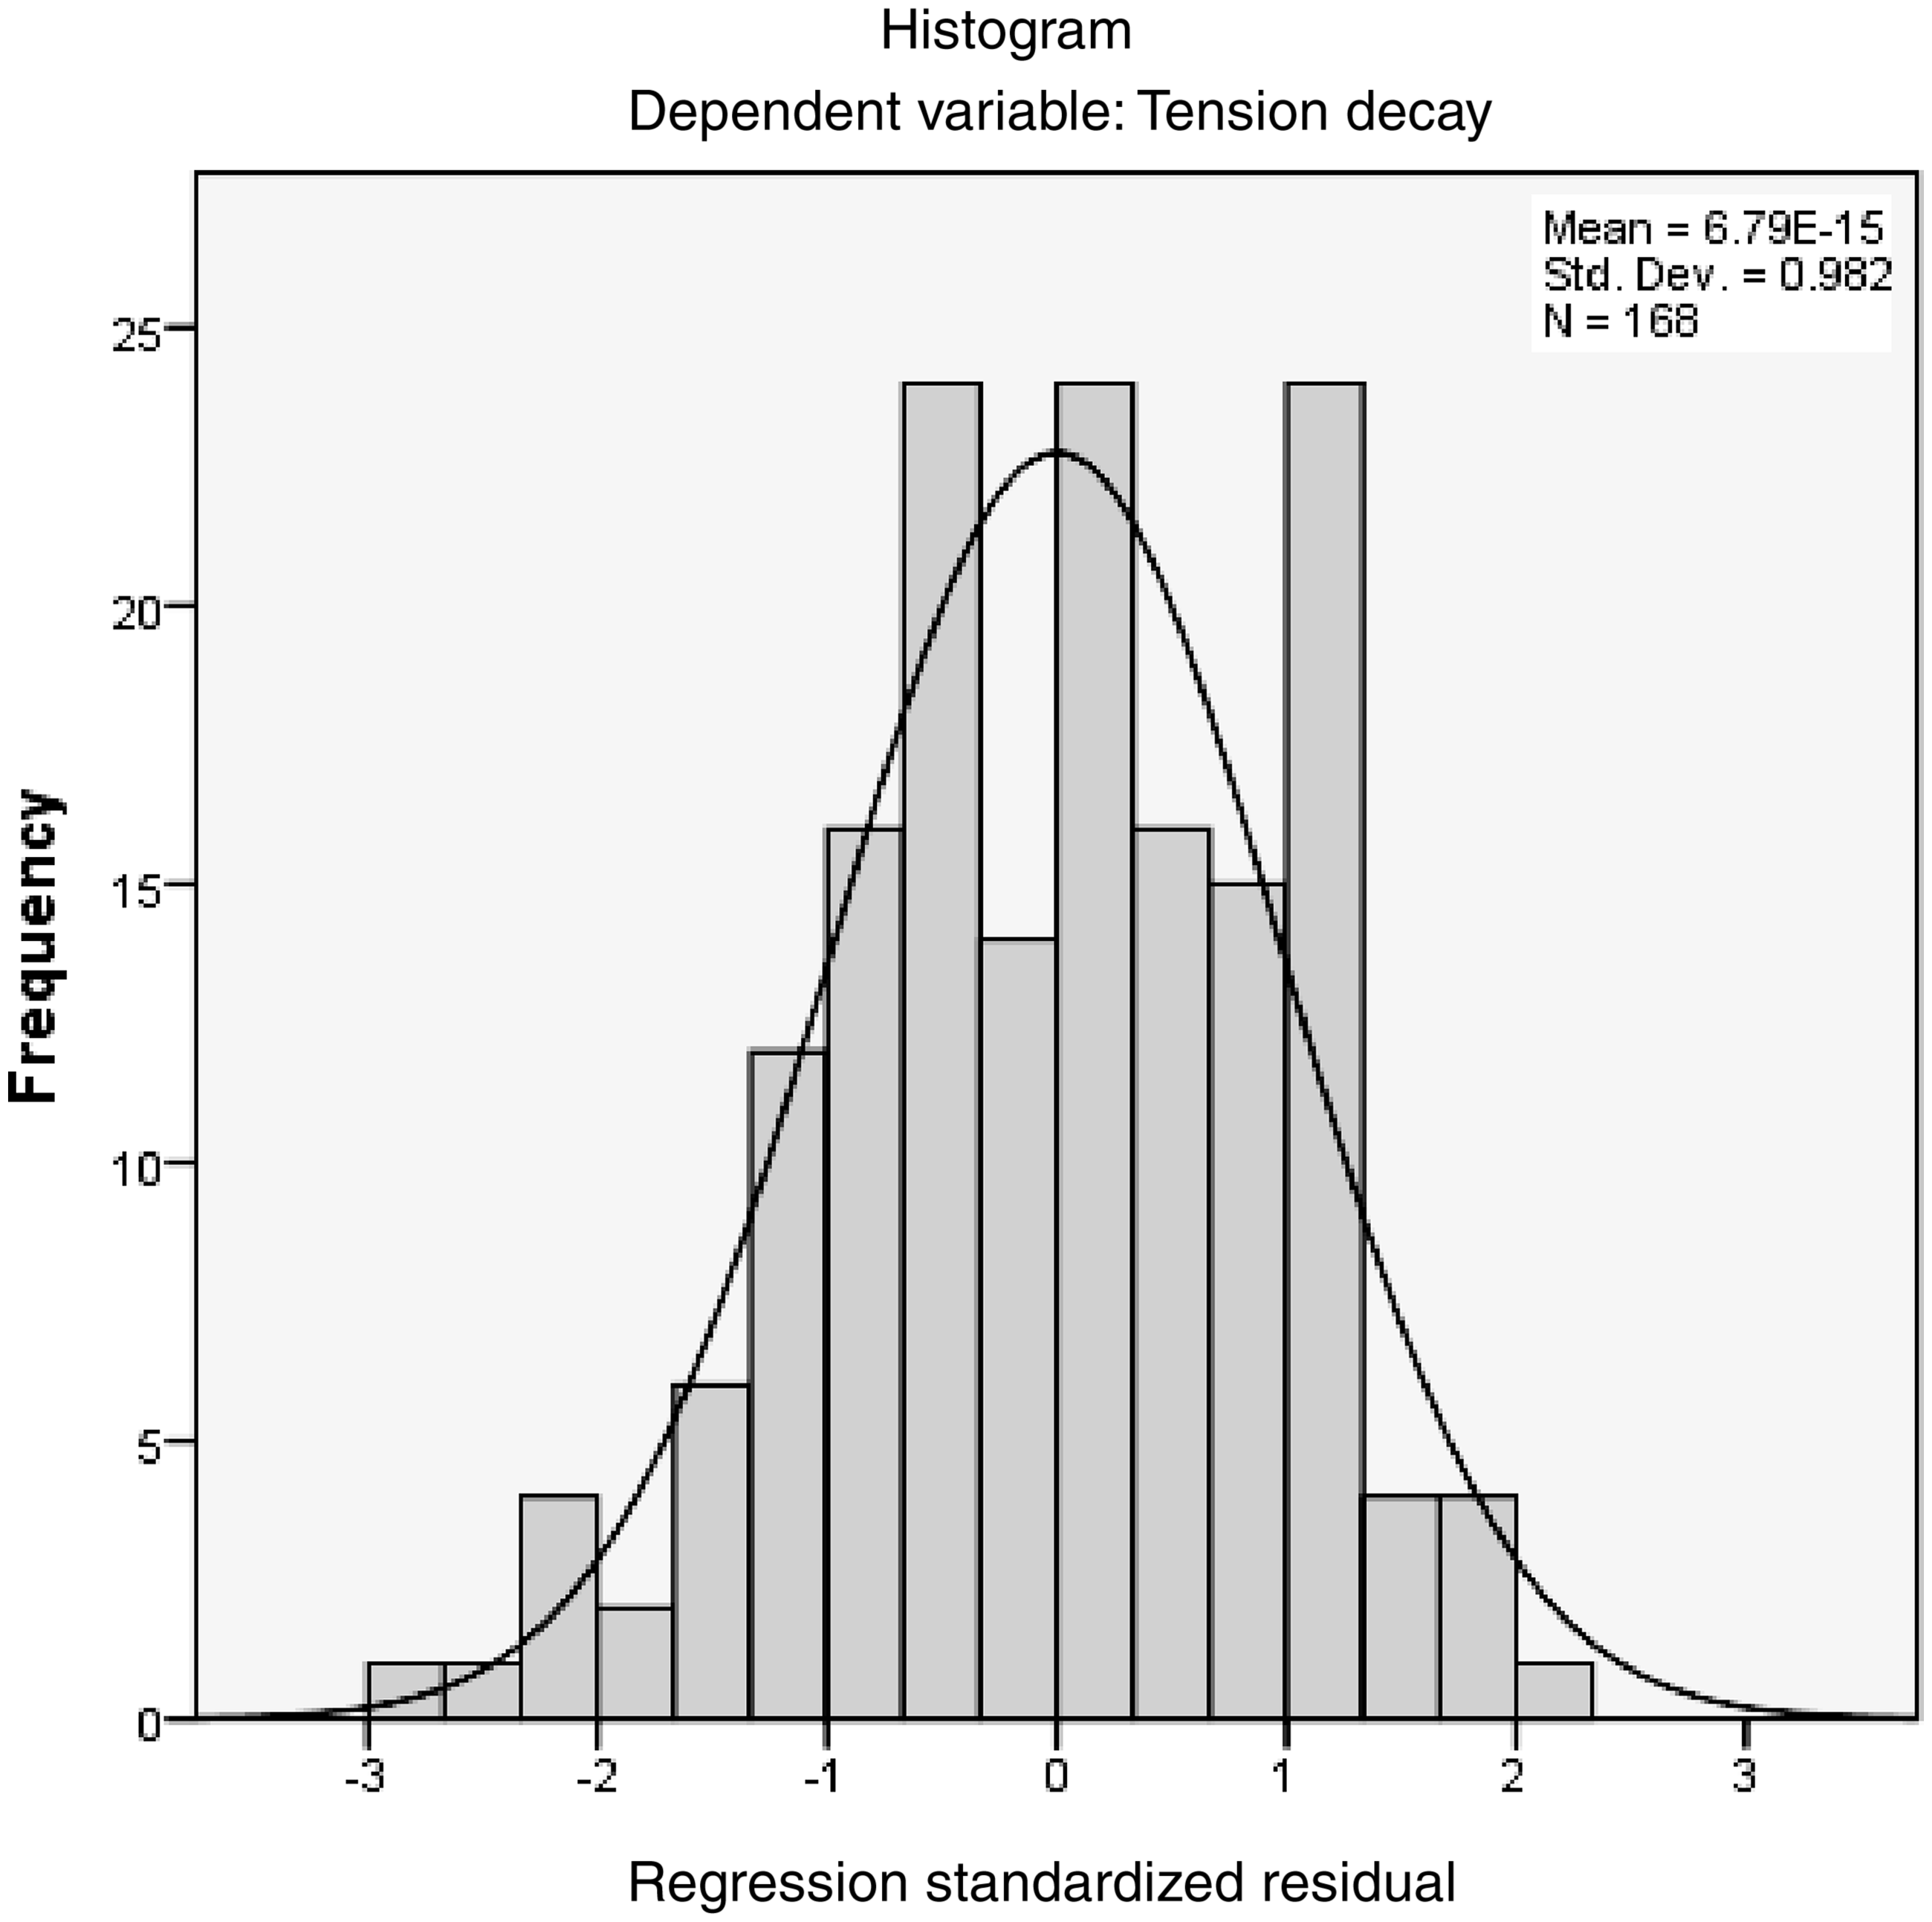
The results also reveal that there is no apparent influence from the reduction factors used in this study on the fabric decay in most of the fabrics. In order to understand the impact of fabric structural properties and the reduction factor on fabric tension decay, statistical analysis was adopted by using SPSS software. A multiple linear regression analysis was conducted to examine the influence of six independent variables, including (1) the reduction factor, (2) strain, (3) fabric thickness, (4) fabric structure, (5) fabric weight and (6) initial fabric tension, on the dependent variable, and fabric tension decay percentage after 360 cycles of extension. An informal analysis of the data by using histograms and scatterplots (Figures 11 and 12) revealed no serious threats to the assumption of linearity or to the underlying distributional assumptions of the residuals of the dependent variable.
Scatterplot for the residuals. Histogram for the residuals and predicted scores.
Results of multiple regression analysis – analysis of variance (ANOVA) b
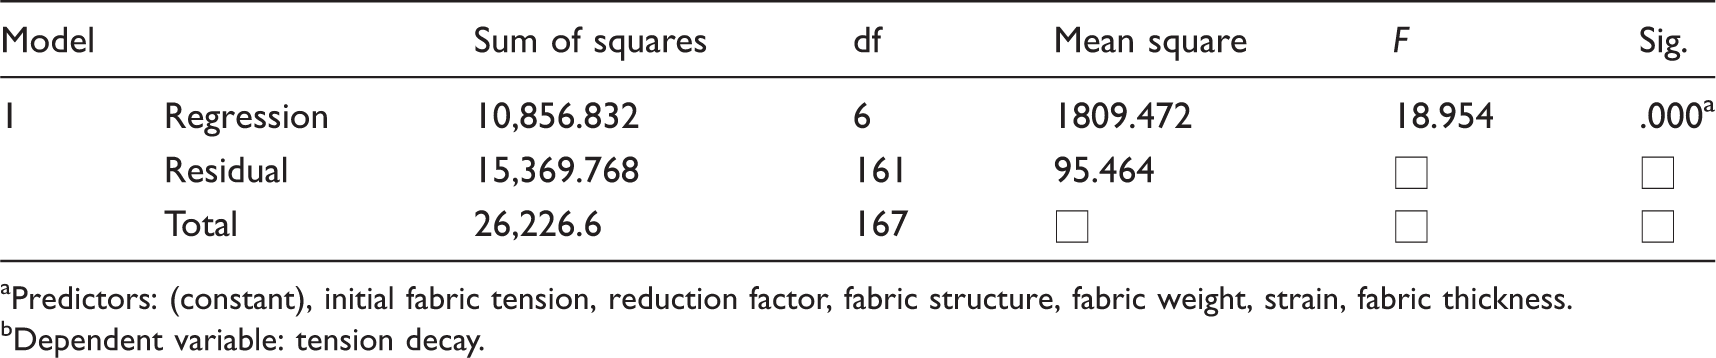
Predictors: (constant), initial fabric tension, reduction factor, fabric structure, fabric weight, strain, fabric thickness.
Dependent variable: tension decay.
Results of multiple regression analysis – coefficients a
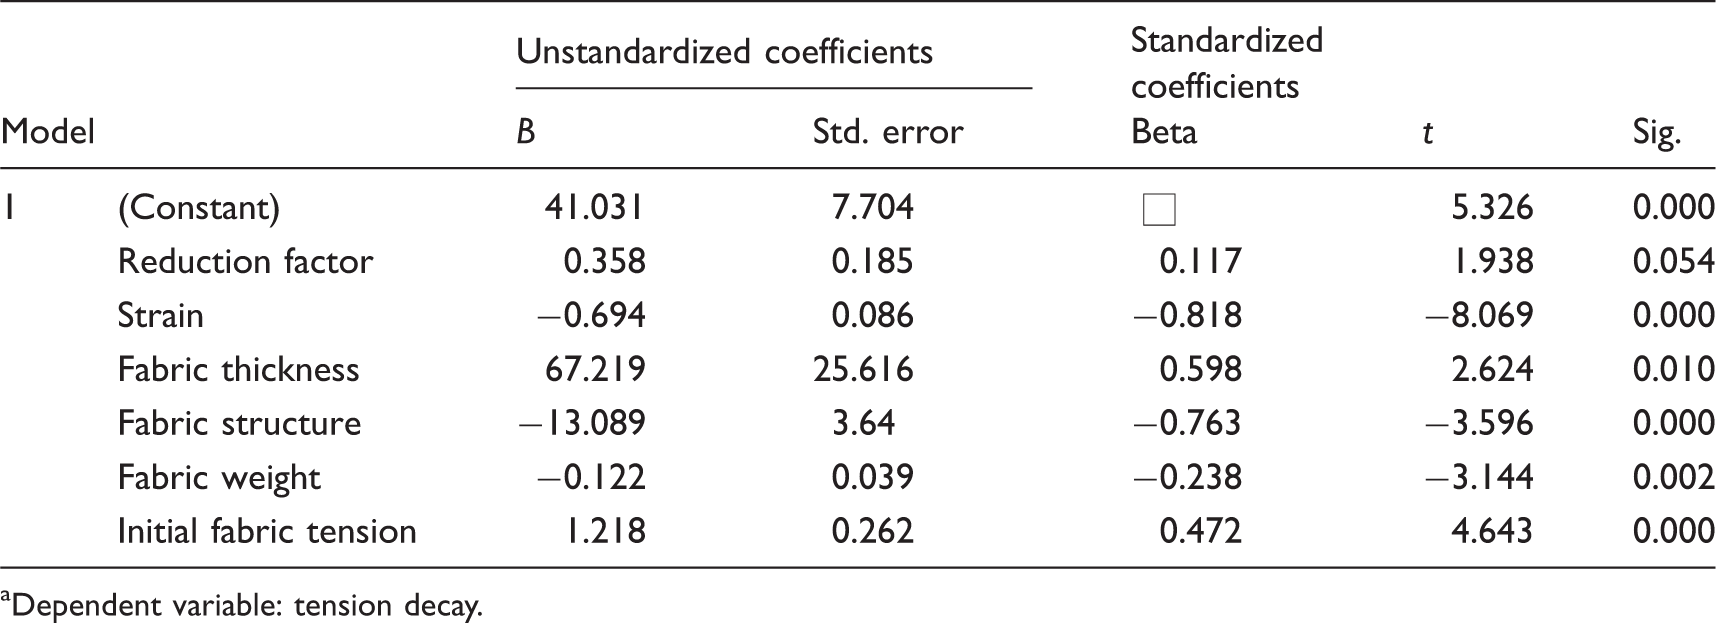
Dependent variable: tension decay.
As the relationship between reduction factor and fabric tension decay was not significant, the analysis was re-run. The reduction factor was removed from the model, whilst only the five significant independent variables were included in the model. The new regression equation is shown as follows:

This regression model has an overall significant linear relationship (F (5, 162) = 21.626, p = 0.000 < 0.01), and each of the independent variables has a significant linear relationship with fabric tension decay (p < 0.05). The R2 value is 0.400, which is only reduced by 0.014 after the removal of the reduction factor from the model. The strain used, fabric thickness, structure and weight, and the initial fabric tension are identified as the key factors that affect the percentage of tension decay in the development of pressure therapy gloves.
Step 3: glove–skin interfacial pressure
Figure 13 shows the results of glove interfacial pressures measured for various hand postures at the six locations. Consistent with the findings of Giele et al.,
19
the geometry of the anatomical zones and the radius of the anatomic curvature have major impacts on the interfacial pressures generated by the pressure garments. The glove pressures obtained at P1 are consistently higher than those obtained at the other locations, due to the large curvatures and pointy geometry of P1. The metacarpal position of P1, which is a bony and rigid surface, also bears most of the tension force induced by the glove and hence resulted in high glove–skin interfacial pressures.
Glove–skin interfacial pressures measured during three types of hand motions.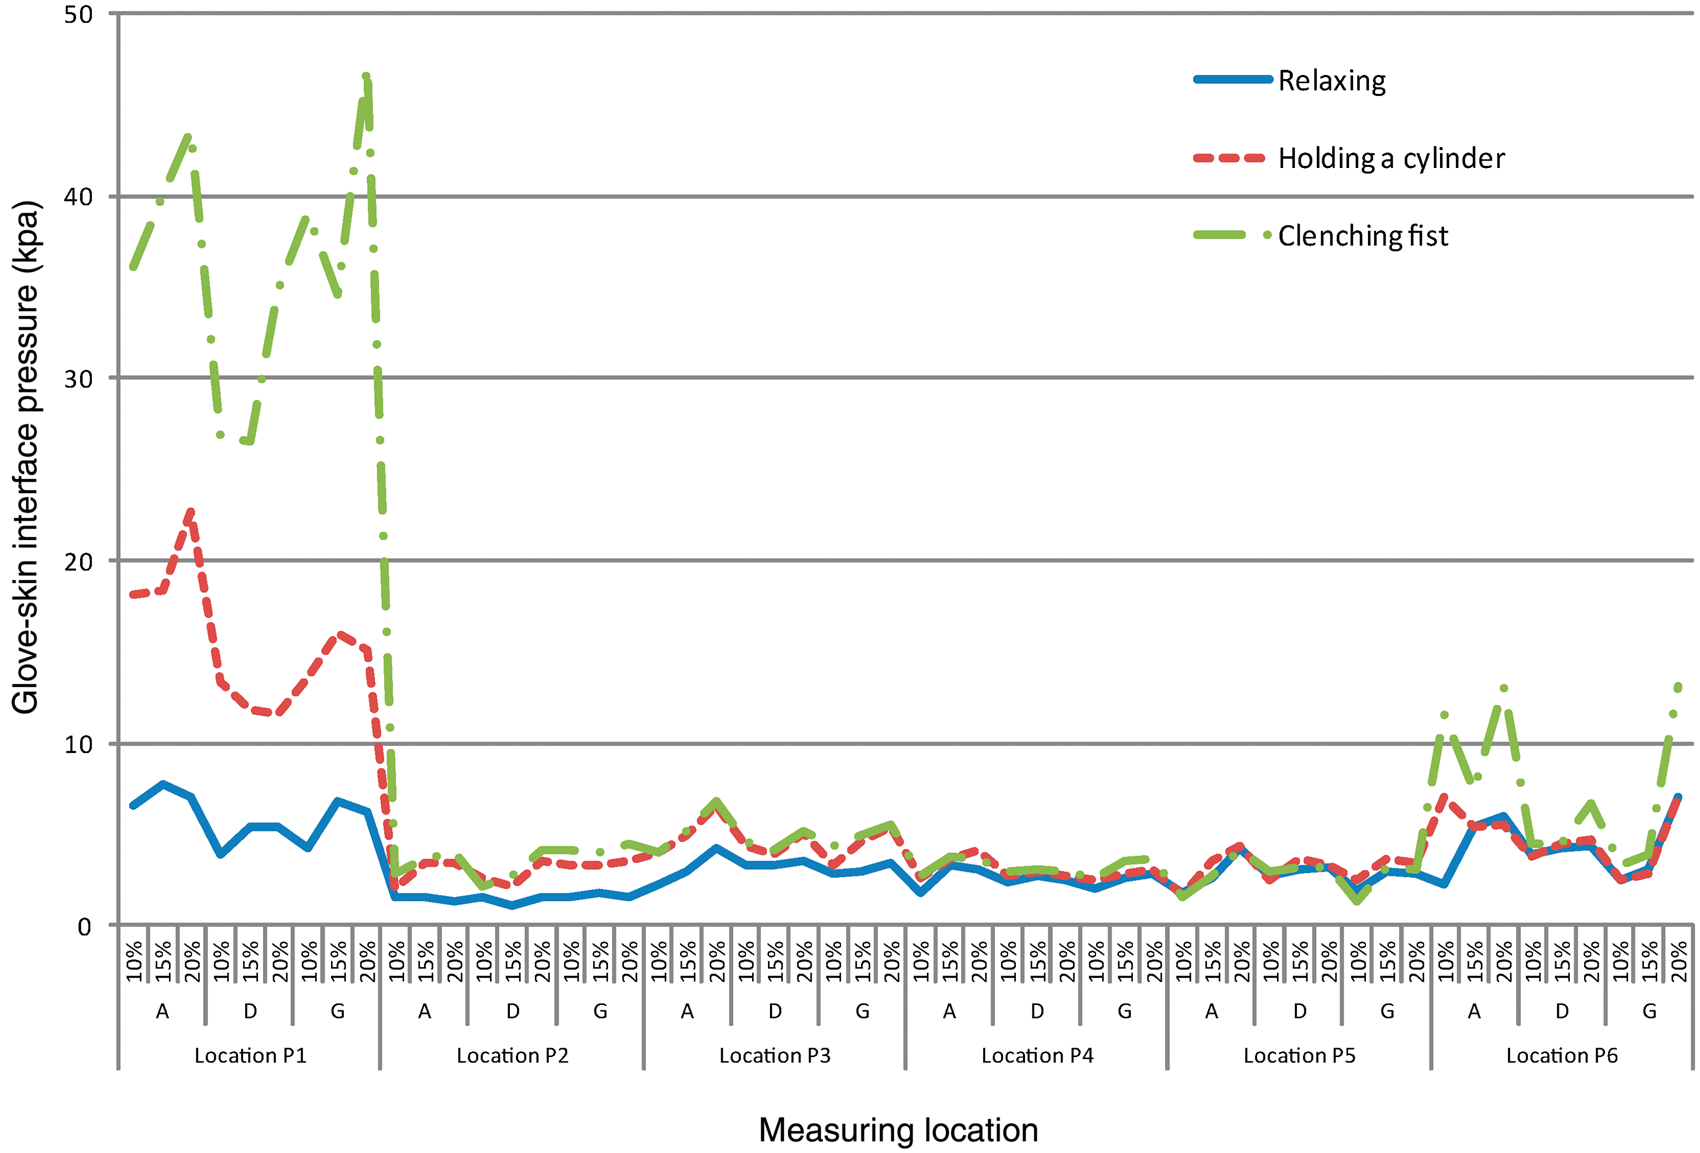
The magnitudes of the glove–skin interfacial pressures also varied with changes in hand postures. When a hand is performing different postures, the strain placed onto the fabric also changes, which directly affects the fabric tension and, hence, the converted glove pressure. The lowest glove pressures are obtained when the hand is relaxed and resting on a table, with a mean pressure of 3.4 kPa in the six locations. When the hand is clenched into a fist, the glove is considerably stretched, inducing a higher mean pressure of 9.78 kPa and an extraordinary high mean pressure of 36.51 kPa at P1. The increase of glove–skin interfacial pressure when a cylinder is held in a clenching posture at P1 is greater than that obtained from the other measuring locations. Hand postures and their range of movements, which lead to substantial shape geometry changes in the metacarpal site, result in major changes in the glove pressure. In the case of locations P2, P3, P4 and P5, the increase in glove pressure with various hand postures is not apparent. They are relatively flat and their curvatures change very slightly with hand postures and movements. The curvature on the middle finger is higher than those obtained from the center back of hand and it changes more apparently in different hand postures. Therefore, the interfacial pressure triggered at P6 is consistently higher than the measurements obtained from locations P2, P3, P4 and P5. On the other hand, the mean interfacial pressure at the metacarpal, P1, readily increased from 5.93 kPa (at rest posture) to 15.62 kPa when the hand was holding a cylinder. The interfacial pressure further increased to 36.51 kPa when the hand was clenched in a fist posture. It is also noted that the greatest interfacial pressure reached 47.11 kPa at P1 when the hand was clenched into a fist, which is much greater than 3.33 kPa, the effective pressure for treating hypertrophic scars. Considering a mean garment pressure of 8.7 kPa could have a major influence on skin oxygen pressure, leading to ischemia, 20 prolonged clenching with the use of the pressure gloves may result in bruises, ischemic injury and development of pressure ulcers on patients. The pressure induced by a pressure therapy glove at a safe pressure level when the wearer is relaxing his/her hand, nevertheless, could reach dangerous levels during various hand movements.
Steps 4 and 5: hand curvatures and predicted glove–skin interfacial pressures
The hand curvatures at the six measuring locations in both the vertical and horizontal directions were determined for each subject. As shown in Figure 14, the box plots of each location in vertical and horizontal directions are fully separated. Amongst the six measuring locations, the hand curvatures in the horizontal direction are consistently larger and show a greater variation in magnitudes than the corresponding vertical direction, with a mean difference of 55.24 m−1. The largest curvature variation between the horizontal and vertical directions is found at P6, with a mean difference of 88.40 m−1. The curvatures at P1 and P6 are relatively higher than those measured from P2, P3, P4 and P5 in both horizontal and vertical directions. The anatomic curvature variations of measuring locations indicate the potential pressure differences on various hand regions induced by the pressure therapy glove.
Box plots showing the hand curvatures measured at different measuring points on the four subjects.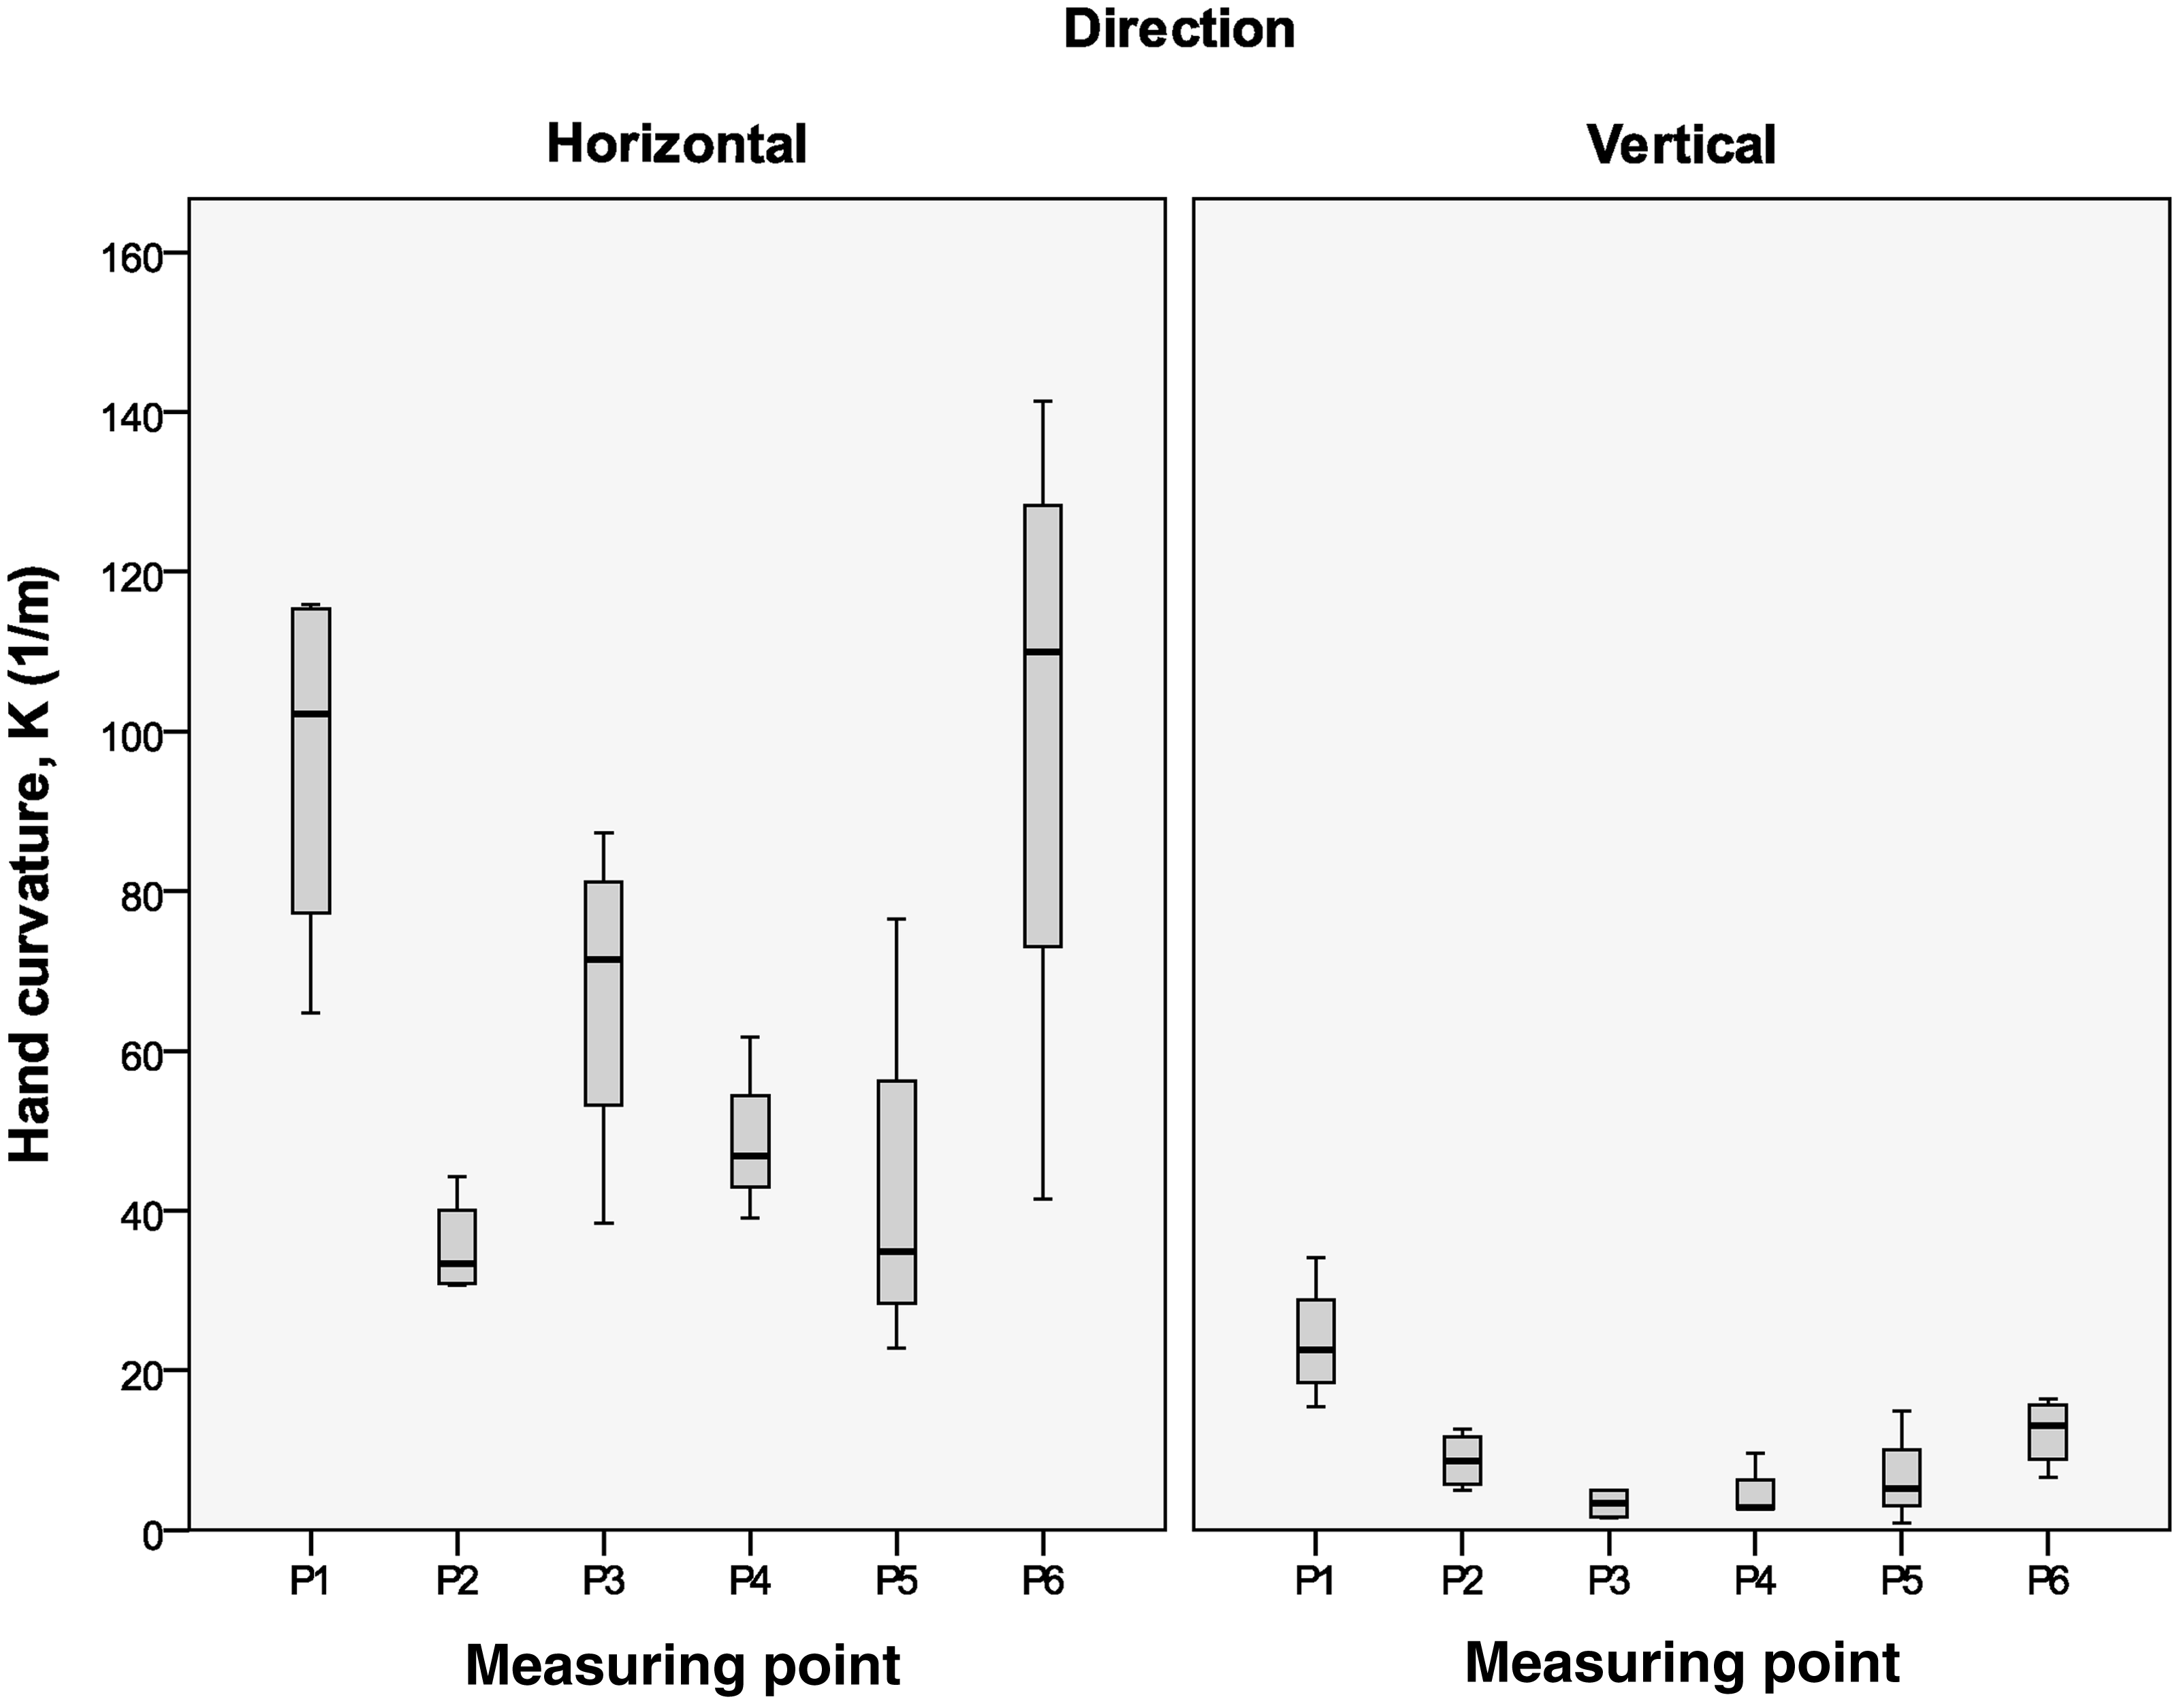
The strain of glove at the six measuring locations when worn with hand relaxing on table

The glove tensions in the horizontal and vertical directions can be calculated by fitting the glove strain into the stress/strain curve of the corresponding fabrics. By using Equation (2), the magnitudes of the glove–skin interfacial pressure were then calculated in accordance with the hand curvatures at the six pressure measuring locations. The predicted and the measured glove pressures obtained from the three fabrics (Fabrics A, D and G) and the three reduction factors (10%, 15% and 20%) in three different postures are presented in Figure 15. Small variations were recorded at locations P2, P3, P4 and P5 between measured and predicted pressures. The paired samples t-test shows that the difference between the measured and predicted interfacial pressure is not statistically significant (p = 0.298 > 0.05). The difference between the measured and predicted value is relatively larger at P1 and P6 with root mean square errors (RMSEs) of 3.48 and 3.19 kPa, respectively. The results could be explained by the pointy curvatures of P1, in which the pressure sensor failed to achieve full contact with the metacarpal site. The small circumference of the middle finger may also affect the accuracy of the sensor leading to the deviations between the measured and predicted pressures at P6. In the case of locations P2, P3, P4 and P5, the corresponding RMSEs are relatively low, which range from 0.79 kPa (at P2) to 1.18 kPa (at P5). It is also noteworthy that minor muscle contractions and/or hand posture changes had significant impacts on the hand curvatures, which affect the resultant glove tension and interfacial pressures.
The measured and predicted glove skin interfacial pressures (a) when the hand is relaxing on the table, (b) when the hand is holding a cylinder and (c) when the hand is forming a clenching fist.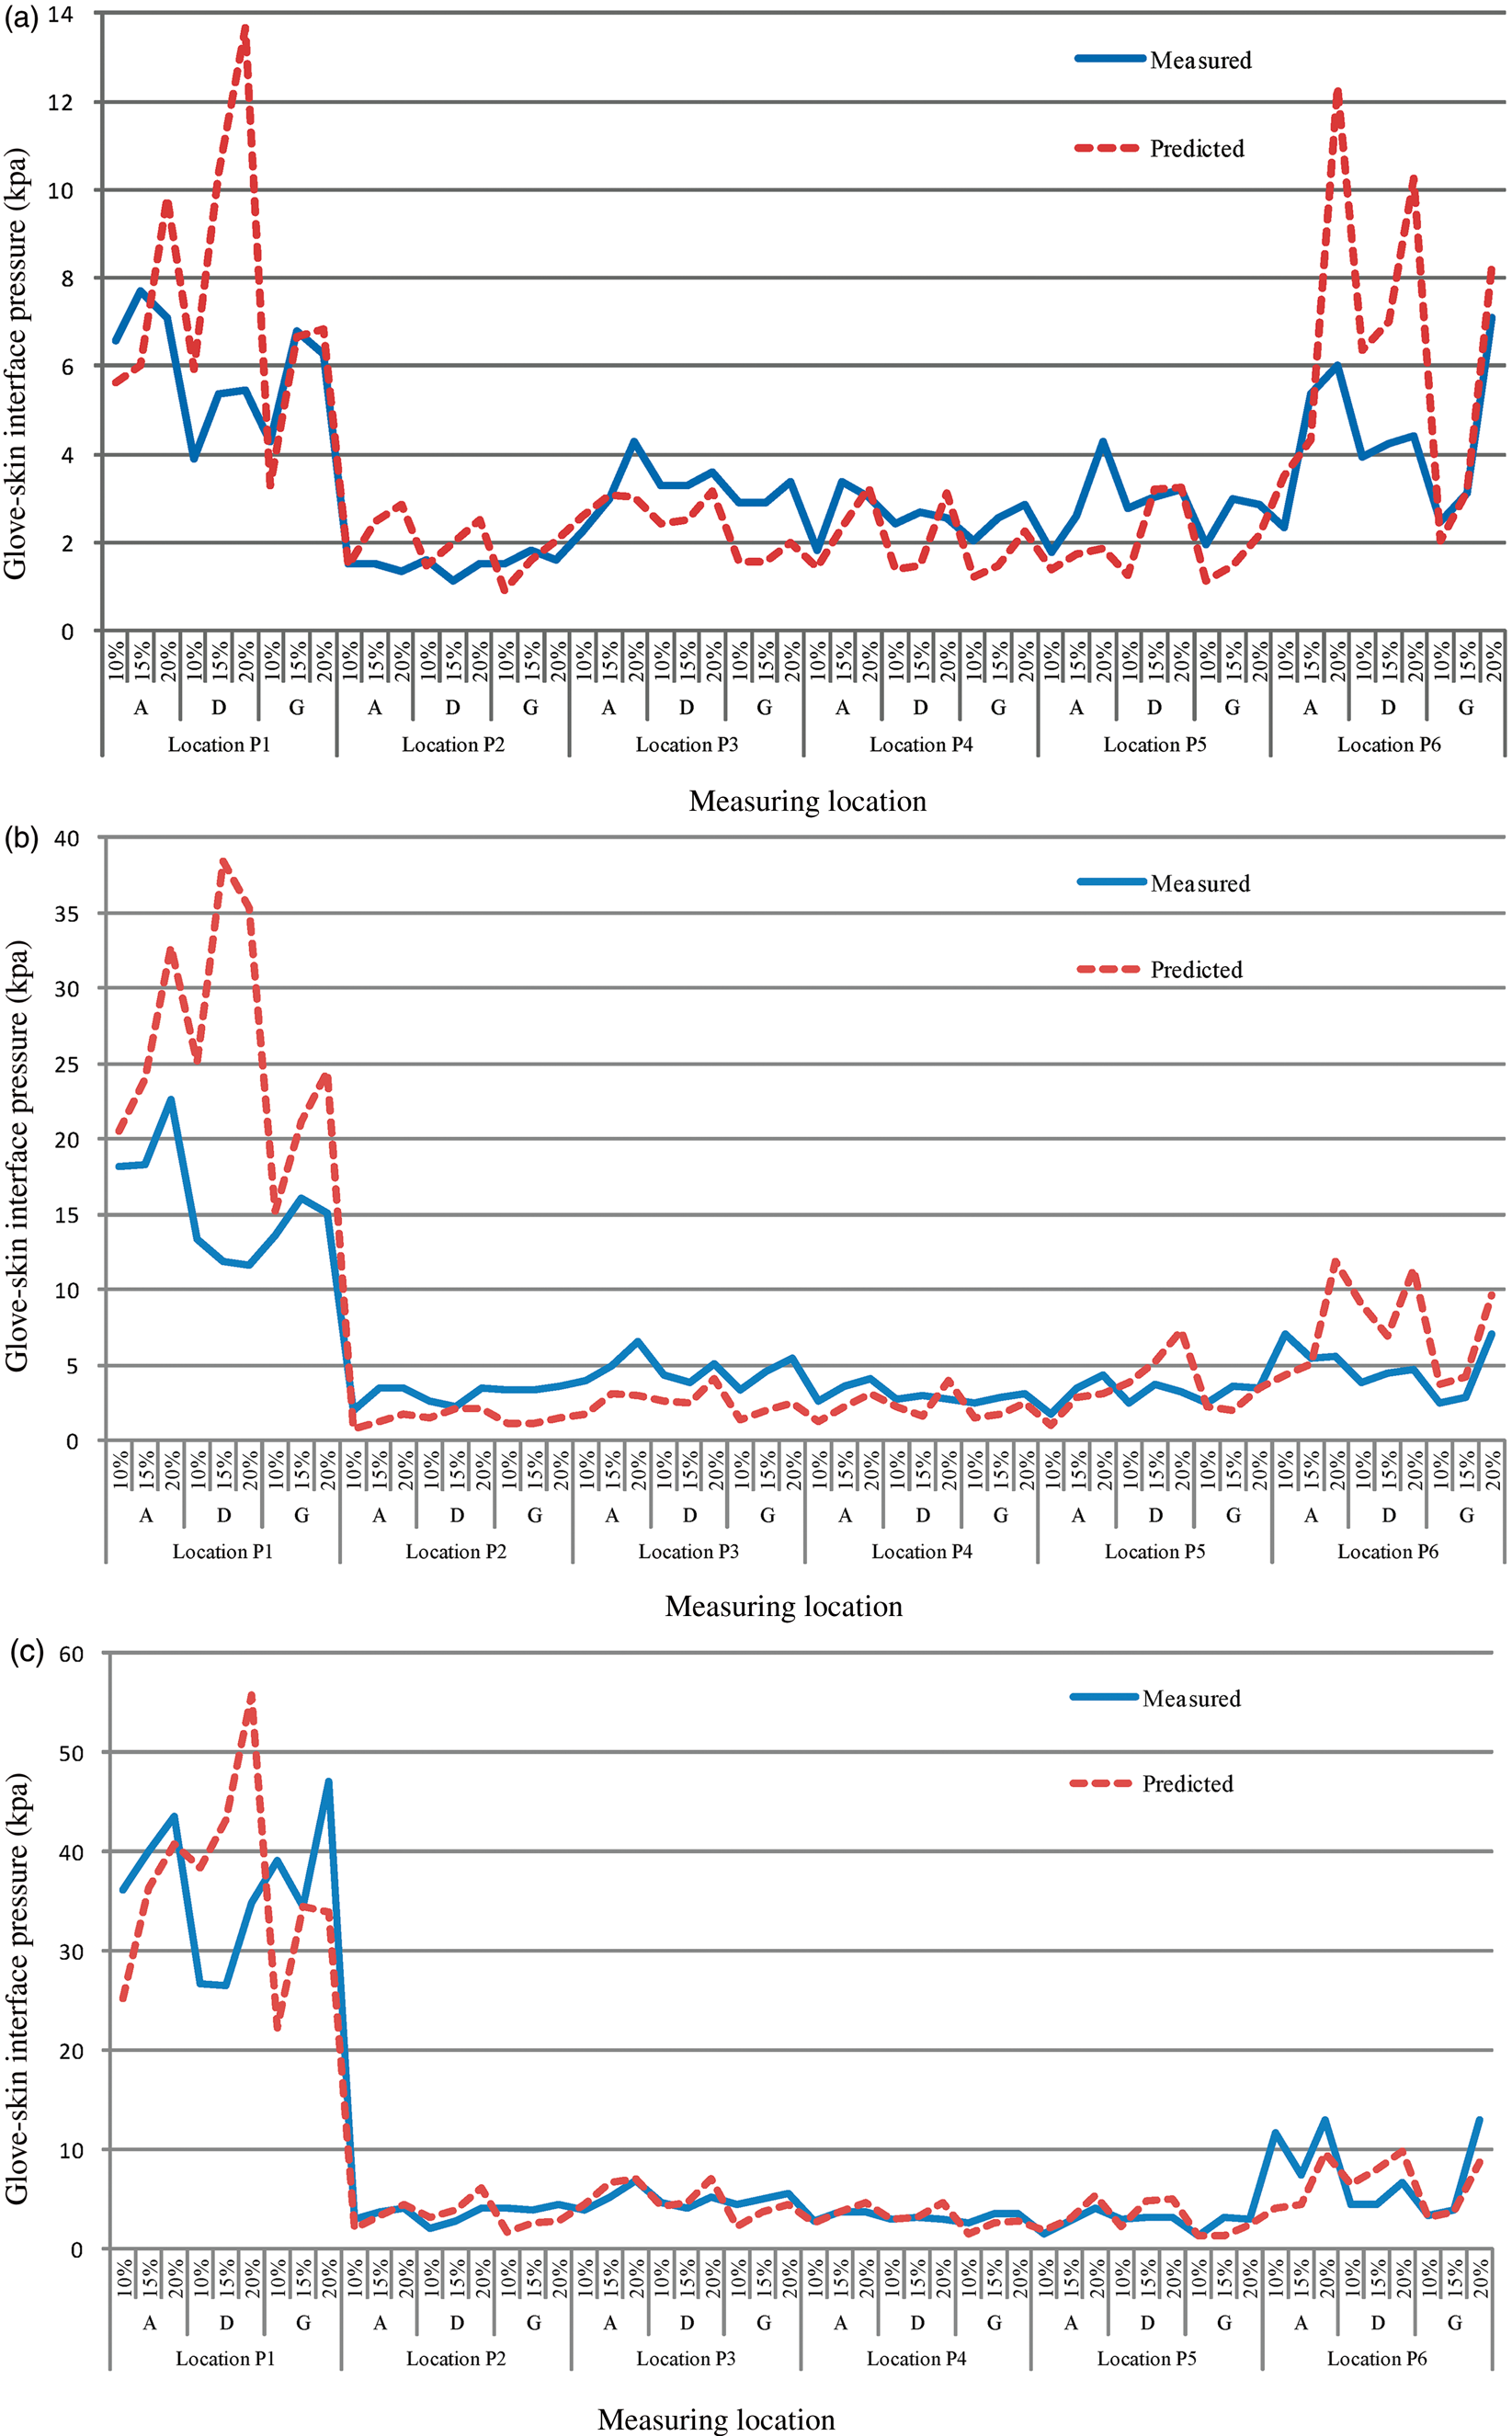
Step 6: verification of pressure prediction model
As fabric tensions are significantly reduced upon repeated extensions for all of the seven types of fabrics studied, this indicates that the predicted glove pressures would dramatically deteriorate over the course of the treatment. Based on the measured fabric tension decay and hand curvatures, the changes in the glove–skin interfacial pressures after repeated extensions can be calculated. The results were compared against the actual glove pressures measured by using the Novel Pliance-X system. The predicted and measured glove pressures at the two pressure measuring locations P1 and P2, which represent the two distinctive hand structures, are shown in Figure 16.
The predicted and measured glove–skin interfacial pressures before and after the wear trial.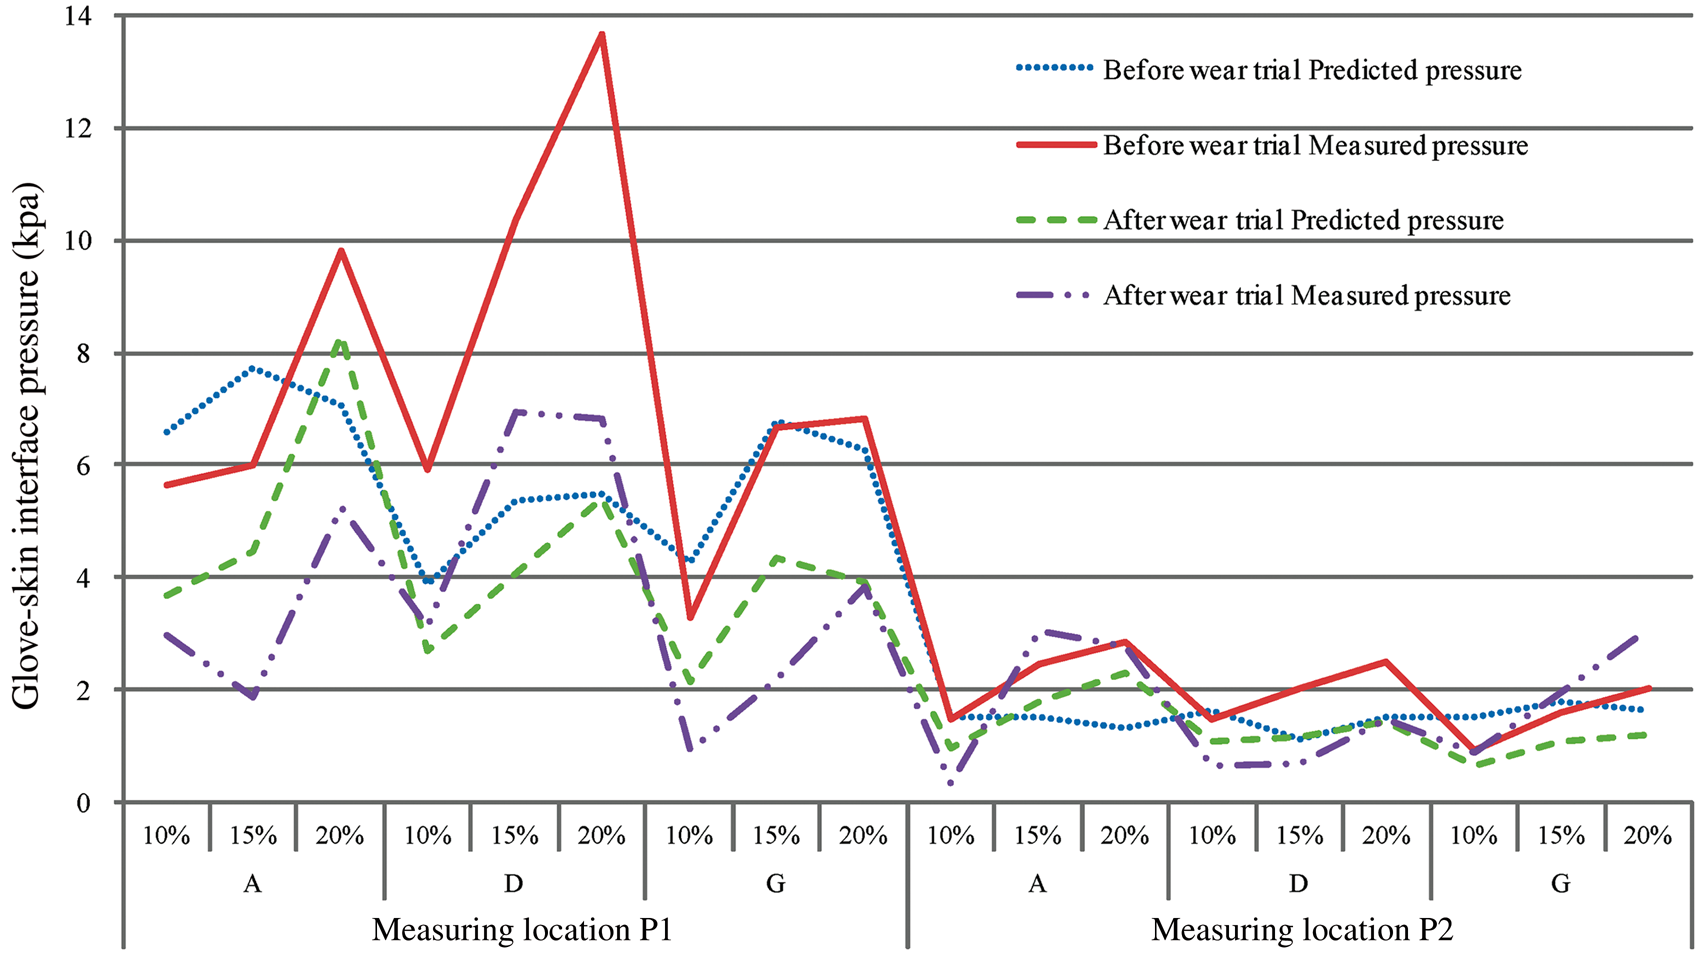
It can be seen from the results that the pressure measuring locations have a major impact on the loss of glove pressure over repeated use. The glove pressure readily deteriorated at location P1 for all of the pressure gloves, regardless of their fabrication and/or reduction factors. Continuous changes in the curvatures and geometries at the metacarpal (P1) caused by hand motions during daily activities triggered the degradation of fabric tensions. The glove fabric at P1 was subjected to greater extensions and contractions than that of P2, and therefore failed to maintain an adequate pressure during wear cycles. The amount of pressure decay obtained at P2 is relatively small, as its skin surface is flat and smooth, and the fabric was less deformed during hand motions.
Even though a research study 13 has revealed that pressure garments constructed by using higher reduction factors have greater tension loss during repeated use, the impact of reduction factors used in this study (10%, 15% and 20%) on the decay of glove pressure is not apparent. As shown in Figure 16, the measured glove pressures constantly deteriorate after 80 hours of wear trial, regardless of the changes in the reduction factors and glove dimensions. To some extent, a similar trend of pressure degradation was also observed from the predicted glove pressures. The results revealed that an empirical model that predicts glove pressure based on the measured fabric tension decay and hand curvatures can reliably realize the degradation of pressure therapy garments over the course of treatment.
Conclusions
As prolonged and excessive garment pressures have been proven to cause skin ischemia, and even pressure ulcerations, due to the lack of blood supply to any given tissue, the degree of interfacial pressure and its efficacy over the course of treatment must be carefully controlled in the development of pressure therapy garments. In previous investigations, researchers have used different indirect methods to predict the pressure-delivering ability of various pressure garments. Most of these methods did not acquire corresponding anthropometries and curvatures of the body parts being treated. In this study, the curvatures of the pressure measuring locations are realized based on 3D hand images of the subjects. In consideration of the non-linearity of fabric properties upon repeated use, the non-linear tensile properties of different materials are determined by using a fabric extender. Accompanied with fabric elongation when the gloves are worn, the skin pressure at any particular measuring point could be determined by fabric tension and body curvature. The results are compared against the experimental pressure values by using the Novel Pliance-X system. No statistically difference at significance level of 0.05 is found between the predicted and the measured glove pressures, even though the predicted values have deviations with the measured values at certain measuring points due to the sensitivity of the pressure measuring system and small variations in the hand curvatures taken throughout the measurements. The empirical model for predicting garment pressure from fabric tensions and hand curvatures is found to be satisfactory and useful for accurately evaluating the compression performance of pressure garments.
In addition to the evaluation of scar conditions and healing wounds, the tension and decay performance of fabrics used in relation to their structures and relative frequency percentages (RFs%) are vital components to determine a suitable treatment program for fitting adjustments of pressure garments. In this study, fabric tension decay is found to be influenced by fabric strain, thickness, structure, weight and initial fabric tension. The variations in the reduction factors in the range from 10% to 20% appear to have less impact on pressure glove tension than the fabric structural properties. Fabrics with high initial tension resulted in large amounts of tension loss and pressure decay. Regardless of the fabric used and reduction factors applied, high levels of pressure are found at the metacarpal joint due to its large curvature. Unlike pressure sleeves, the pressure delivered by the pressure therapy glove is not evenly distributed over the parts of the hand. Pressure measuring locations are therefore crucial in prescribing an adequate and effective pressure glove for a patient. On the other hand, the study shows that glove–skin interfacial pressure is greatly influenced by hand postures. Continuous fabric extension and contraction at the metacarpal joint due to hand movements and different postures during daily activities are closely associated with the dramatic loss of glove pressure over repeated use. Hand movements can trigger variations in the interfacial pressure. Given a suitable pressure for treating hypertrophic scars for a relaxed hand, the pressure glove can nevertheless reach a dangerous pressure level when the hand is clenching. It is believed that traditional pressure evaluation methods underestimate the perceived magnitude of glove–skin pressures in practical use. Hand postures and their range of movement, which lead to substantial shape geometry changes in the metacarpal joints, should also be carefully considered in the development of pressure therapy gloves in order to maintain adequate and consistent interfacial pressures on the scars.
Funding
This work was supported by the Research Grant Council (grant number PolyU 5329/10E) and the Departmental Grant of Institute of Textiles and Clothing, The Hong Kong Polytechnic University (grant number PolyU RPXS).