



Abstract
The association between the incidents counted by the measurement wire of the Wool ComfortMeter (WCM) and the previously published neurophysiological basis for fabric-evoked prickle have been investigated for lightweight knitted woolen fabrics. The fiber lengths and diameters capable of triggering the fabric-evoked prickle sensation were calculated using Euler’s buckling formula, and it is suggested that fibers as fine as 10 µm are capable of triggering the prickle response if they have a short enough free length protruding from the surface. Good agreement was found between the sensory assessed human prickle sensation and the wearer prickle response predicted using the WCM outputs, especially when the latter were transformed using Stevens’s Psychophysical Power Law.
Keywords
Sensory feeling or comfort is a determining factor when choosing and purchasing a garment. The unpleasant sensation of prickle is one aspect of comfort that has been studied in detail and a sensory mechanism for the cause of fabric-evoked prickle has been proposed. Garnsworthy and co-authors established the physiological basis of the prickle sensation using experiments on both animal and human participants.
1
The human sensory assessments involved 55 participants (28 males, 27 females) to evaluate 13 fabrics using the forearm test under standard conditions (20℃, 60% RH). Prior to the fabric evaluation, but not during the evaluation itself, the participants were provided with two calibration fabrics, one of which was claimed to not cause sensations of prickle and another which was regarded as very prickly. Unfortunately no technical specifications of the calibration fabrics or the test fabrics are available, so it is not possible to repeat the study or determine the reliability of either the zero calibration of the non-prickly fabric or the true nature of the reported physiological response to variation in fabric and constituent fiber properties.
1
However, the study provided a valuable understanding of the human response to fabric-evoked prickle, as it was shown that the sensory-assessed forearm prickle rating of fabrics was associated with the number of protruding fibers capable of exerting a force of at least 75 mgf (∼0.74 mN) against the skin over an area of at least 10 cm2. When these findings were fitted to Stevens’s psychophysical power law they yielded a correlation coefficient of 0.91:

A subsequent study also showed that buckling of fibers, caused when the ends of fibers protruding from a fabric surface pressed against the skin, obeyed Euler’s buckling theory,
2
the response occurring according to

Despite the development of a detailed understanding of the mechanisms underpinning the sensation of fabric-evoked prickle, and in which the wearer trial has been used as an established method to measure the next to skin comfort and sensory responses, there are two critical commercial gaps remaining in this knowledge. Firstly, the fiber and fabric specifications are missing from the initial report of Garnsworthy and co-authors on fabric-evoked prickle, and it is therefore not possible to use it to recommend comprehensive approaches for manufacturers to minimize prickle sensations in knitwear. 1 Secondly, there has been no rapid fabric-based test for the propensity of fabric to cause this undesirable sensation to the wearer. To this end, and to avoid the cost and time involved with conducting wearer trials, the Wool ComfortMeter (WCM) has been developed to provide a rapid instrumental approach for predicting a wearer’s perception of fabric-evoked prickle.7–12 In designing this device, Euler’s buckling theory, and its similarity to the bending stiffness equation of a fiber, was used to conclude that measurement of bending stiffness could provide a good proxy to the measurement of the buckling characteristics of the fibers protruding from the surface of a fabric. 7 In this case the bending stiffness is proportional to 3πEd4/L3. 12 The only real difference between the bending stiffness and the buckling models (Equation (2)) is that the bending stiffness is inversely proportional to the cube of the fiber length, as opposed to the inverse square in the case of the buckling rigidity.
The WCM uses a measurement wire mounted in a recording head and scans the surface of the fabric, interacting with fibers protruding from the fabric surface. The results are sensitive to variations in the spatial density of the stiff fiber ends protruding from the fabric surface.12–15
The characteristics of fabrics used in wearer trials to evaluate prickle including: weighted average prickle responses (prickle); mean Wool ComfortMeter (WCM) values of washed garments; mean fiber diameter (MFD) of constituent fibers; yarn properties; knit structure (SJ, single jersey); knitting machine gauge; and fabric mass per unit area (GSM)
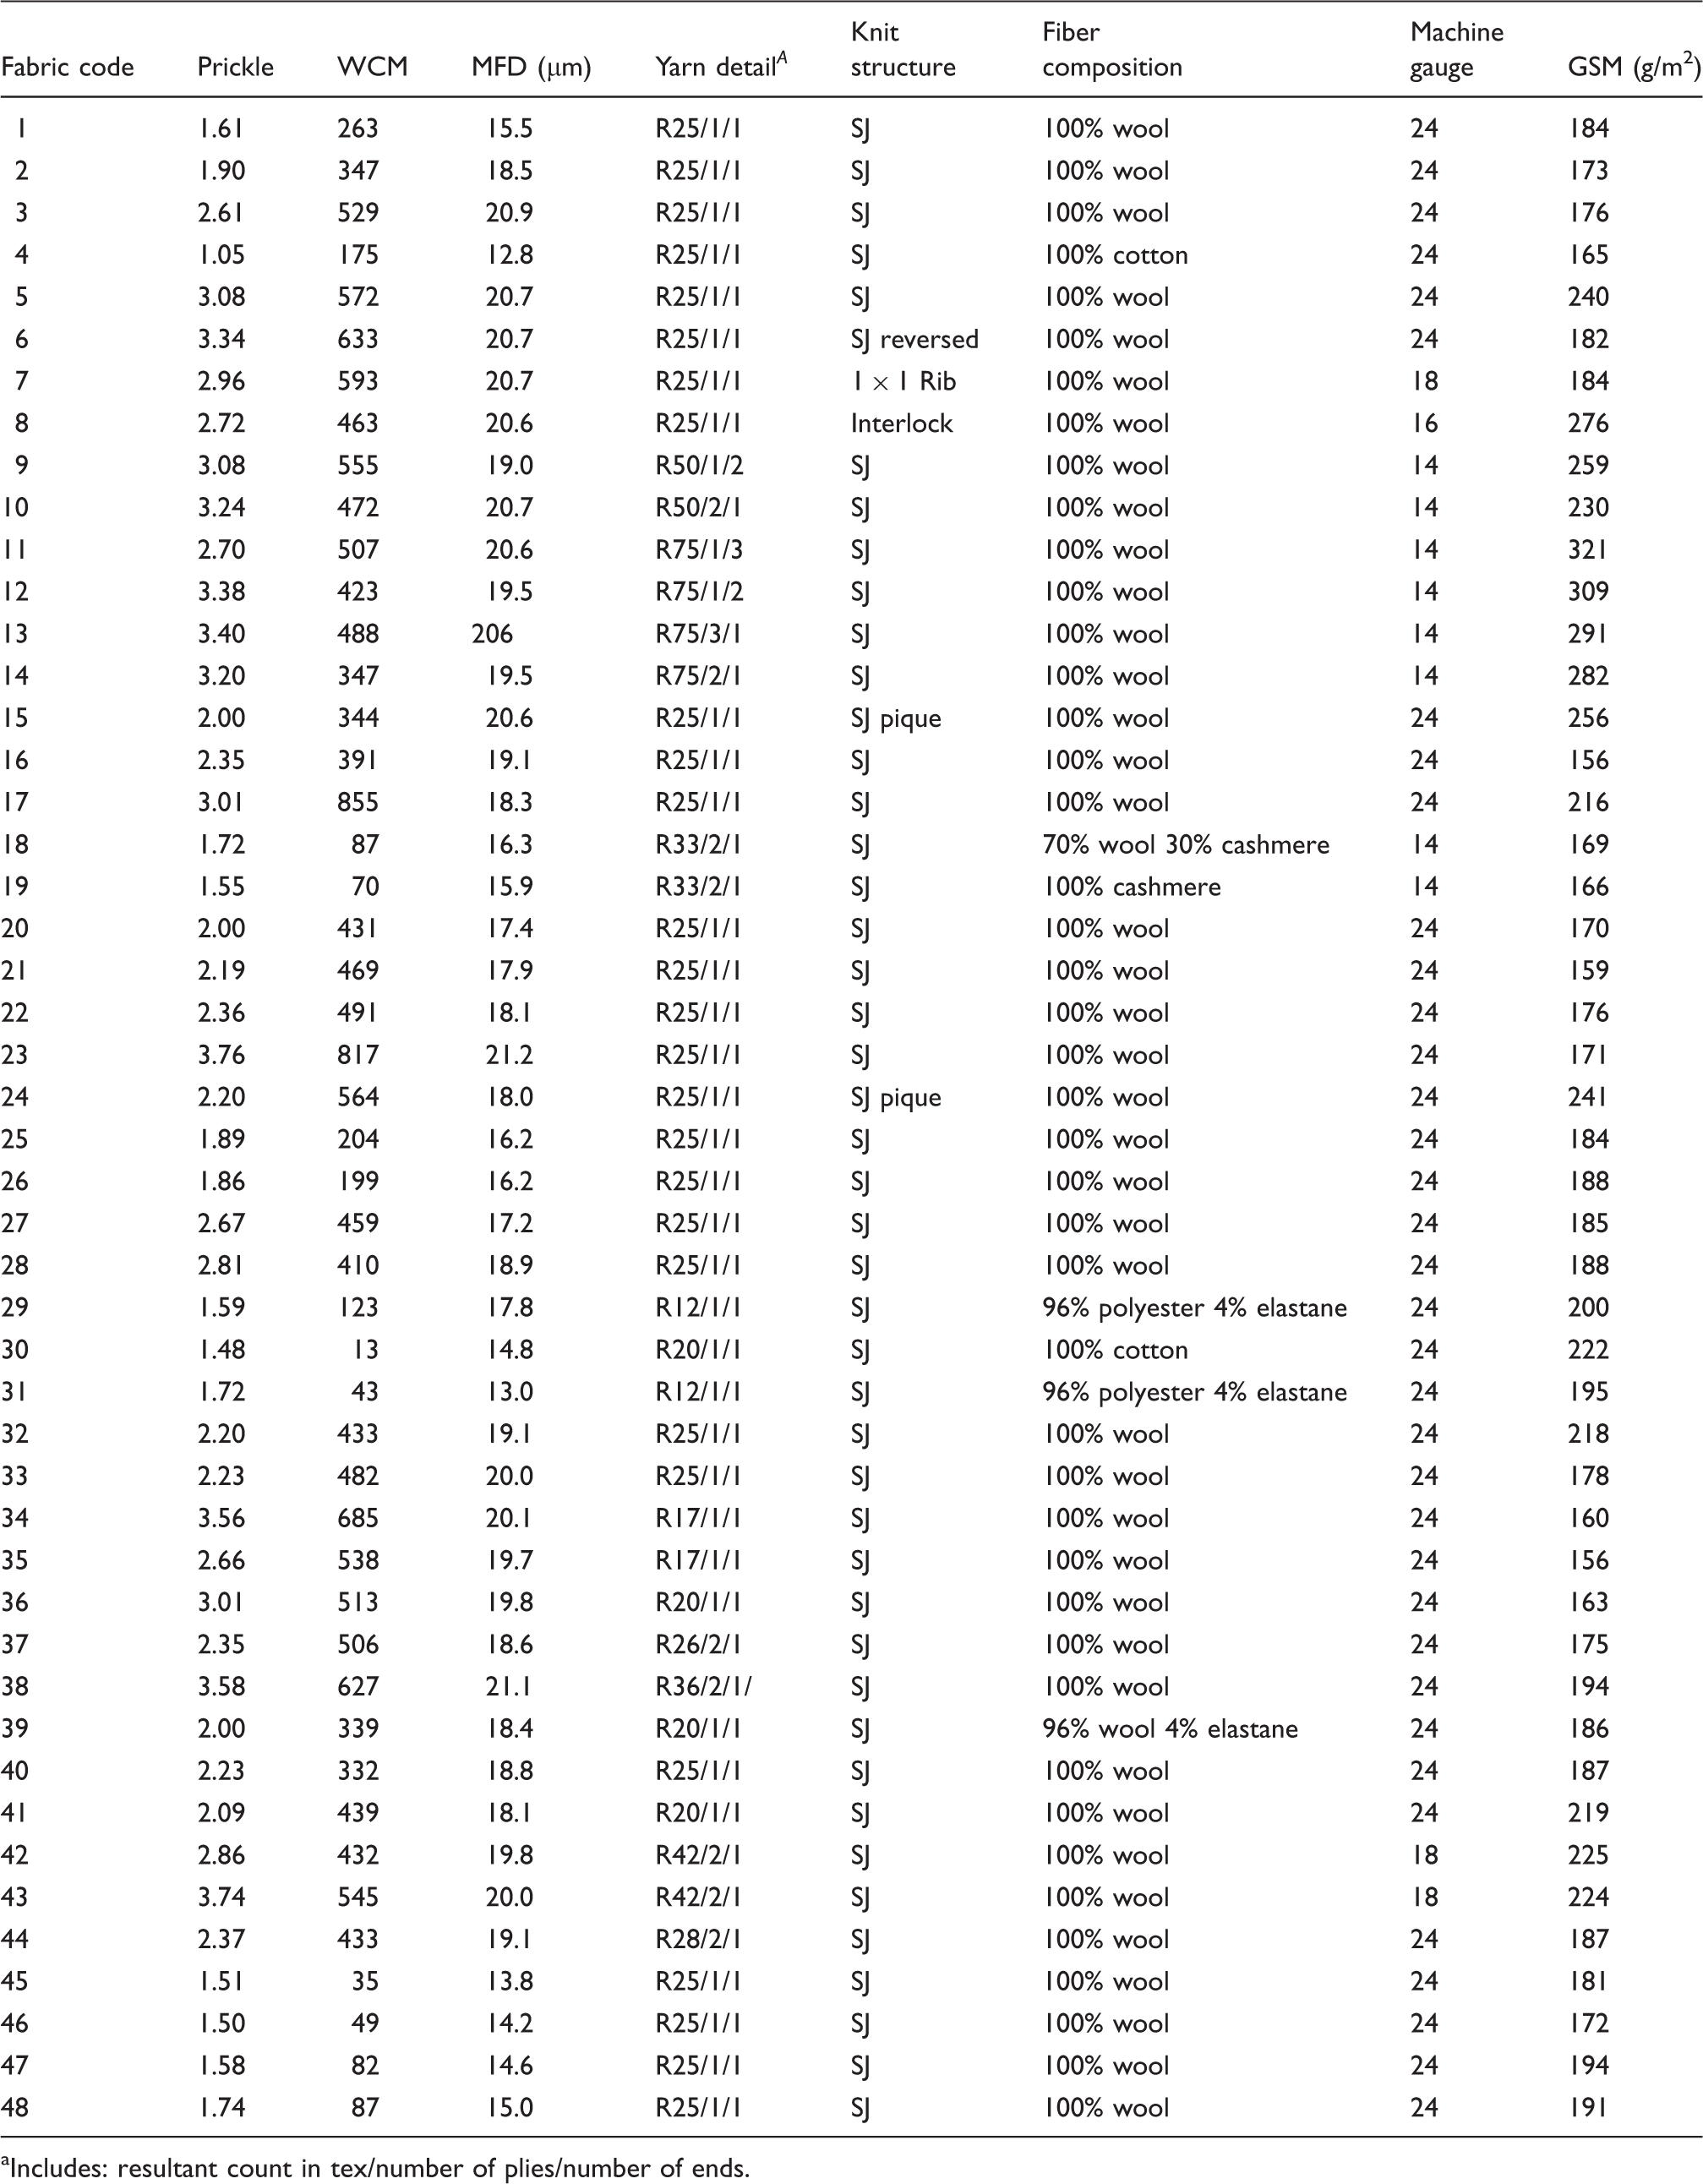
Includes: resultant count in tex/number of plies/number of ends.
The relationship between the average prickle scores from the wearer trials, the attributes of constituent fibers and fabric construction, and the WCM assessment of the full data set of 48 fabrics was investigated. 10 The WCM readings were shown to be strongly correlated with the average prickle scores assigned by wearers of the garments.10,11 However, to date the relationships between the values generated by the WCM and the earlier work on human sensory assessment have not been assessed. The aim of the present study was to investigate the relationships between the incidents counted by the measurement wire of the WCM and the previously published neuro-physiological basis for fabric-evoked prickle. In order to investigate this issue we closely examined Euler’s buckling theory (Equation (2)) and the published information2,3 relating to fibers that can activate the pain receptors. We then compared our findings from the extensive wearer trials with both the WCM evaluations and the test conditions used in these trials, and compared the results with those reported for the earlier forearm tests. 1
Methods
Theoretical analysis
Using Euler’s buckling formula (Equation (2)), calculations were carried out to determine the length and diameter of the fibers capable of achieving a threshold buckling load of 0.74 mN. Numerous researchers have measured Young’s modulus for wool fibers, estimates of which have been shown to vary from 3.22 to 5.40 GPa.2,3,17 In the present calculation two values for Young’s modulus, 3.5 GPa and 5.4 GPa, were used for wool fibers, and the results were graphed to identify the response surface at which the nerve response would be triggered.
Assuming the WCM is detecting and giving an approximate count of fibers capable of exerting a pre-buckling load of ∼0.74 mN or greater, these numbers can then be related via the relationship demonstrated by Garnsworthy and co-authors between stimulus and sensation intensity, as described in Equation (1).
A tensioned wire with a measurement length of 0.12 m is mounted in the WCM recording head. The distance the recording head travels over the fabric surface during a measurement pass is 0.20 m, and the recording head therefore interacts with fibres protruding from the fabric surface over an area of 0.024 m2 (0.12 m × 0.20 m). The mean WCM value of the 48 fabrics in the wearer trials 10 associated with a scanning area of 0.024 m2 was converted to incidents per 10 cm2 (Ip). The predicted human sensation (pSp) was then calculated using Equation (1).
Wearer trials
The design and conduct of wearer trials and the full list of garments were exactly as described previously.10,16 In brief, garments of standard sizes and known construction were evaluated using a set protocol over a range of controlled environments. The full list of garments is provided in Table 1. The test protocol consisted of five sequential stages as follows:
Pre-trial acclimatization, during which no measurements were made. Change room, not walking: 15 minutes with the test garment worn in a cool environment (23℃, 45% RH). Hot room, standing but not walking: 15 minutes at 40℃, 24% RH. Active session in hot room. While still in the hot room the participant spent 15 minutes on a treadmill, including elevated walking. After the hot room, return for the final 15 minutes to change room.
Wearers in the age group 25 to 35 were female and drawn from the local urban community. More than 1800 wearers were asked to score various sensations of the garments, including prickle, on a scale of 1 to 9 (1, not detected; 2, just detected/threshold; 3, slightly detected; 5, moderately detected; 7, very detected; 9, extremely detected). The weighted mean prickle scores from all wearer trials were used to analyze the data, and linked garments were used to remove any bias or drift which might have occurred over time or between wearer trials with variations in wearer cohorts. 16
Wool ComfortMeter assessment
WCM assessment was undertaken using the draft test method. 18 Five samples (30 cm × 30 cm) were cut from each fabric. Samples were then hung vertically and the technical rear or back (the side generally worn next to the skin) of the fabric was lightly and evenly steamed using vertical movements of a Personal Hand Steamer. The fabrics were conditioned at 20℃ and 65% RH for 24 hours prior to testing, and then placed face down on the WCM platform and the back of the fabric measured. Each sample was subjected to 10 passes of the recording head and the mean WCM value recorded.
Results and discussion
Incidents counted by the WCM measurement wire
The WCM was designed to identify and count the fibers protruding from the fabric surface that had a fiber length and diameter capable of triggering the prickle response in wearers.7,12 The length and diameter of fibers capable of achieving a threshold buckling load of 0.74 mN, based on Euler’s buckling formula (Equation (2)) and a Young’s modulus of 3.5 GPa and 5.4 GPa are shown in Figure 1. A minimum of 0.2 mm free fiber length was used for the calculation. Below 0.2 mm length the deformation of the skin is thought to lead to a bottoming out of the fabric against the skin, and as more fabric touches the skin this reduces the pressure at the fiber end.
1
The lines in Figure 1 show the response surface of wool fiber diameters and the length of fibers projecting above the yarn surface that are capable of triggering the response. The buckling load is exceeded by the fibers if their diameters and the length of their protruding fiber ends fall below the curve at a particular modulus value, whereas values above the line do not exceed the buckling threshold. The yarn surface fiber length effect is such that as the fiber diameter is reduced below 40 µm, progressively shorter fibers are required to exceed the buckling threshold. Figure 1 shows that fibers as fine as 10 µm can reach the threshold force to cause prickling if they have a short enough free length projecting above the yarn surface. This finding differs substantially from earlier reports, as discussed below.
The lines show the response surface of wool fiber diameters and the length of fibers projecting above the yarn surface which are capable of triggering the nerves. Values below the lines exceed the buckling threshold load, whereas values above the lines do not exceed the buckling threshold: buckling load of 0.74 mN and Young’s modulus of 5.4 GPa (dotted line); buckling load of 0.74 mN and Young’s modulus of 3.5 GPa (solid line). The response indicates that fibers of diameter 10 µm and shorter than 0.22 mm can exceed the buckling threshold.
The assumptions in the model are that the Euler column extends at an angle of 90° from a solid, non-deformable surface. 19 In fabrics the three-dimensional structures and yarn compressional behavior provide a moving extendable base for fibers that may project towards the skin. Furthermore, since they have variable diameter and cross-sectional shapes the fibers do not resemble rods or columns. Yarns also have thin and thick areas caused by the distribution of fibers in the roving that subsequently cause variations in yarn twist, resulting in variations in the forces holding the fibers in position.
The results show that a higher Young’s modulus results in an upwards shift of the response curve (Figure 1). This means that for any given fiber diameter, increasing the Young’s modulus results in fibers of length corresponding to the distance between the two curves for higher buckling loads. The potential therefore exists for more fibers where the wool has a higher Young’s modulus to trigger a response, but whether this occurs in practice depends upon the distribution frequency of the lengths of the protruding fiber ends, and also whether there is a difference in Young’s modulus in commercial batches during yarn construction.
In earlier studies, either the coefficient of variation of fiber diameter (CVD) or a measurement of the frequency of fibers coarser than about 30 µm were regarded as important determinants of the prickle sensation.20,21 In more recent research, however, using a much larger range of fabrics and constituent mean fiber diameters (MFD), once MFD was included in the prediction model and the prickle response of wearers was quantified in relation to MFD and other significant fiber, yarn and fabric factors, the various measurements of fiber diameter distribution became insignificant. This included CVD (P value 0.87), and measurements of the coarse edge of the fiber diameter distribution, such as the percentage of fibers >27 µm or >30 µm, none of which were significant, with P values ranging from 0.34 to 0.97. 10
If it is assumed that fibers shorter than 1.0 mm can interact with the skin when the garment is skin-tight and there is movement of fabric relative to the skin, then fibers finer than 20 µm are capable of triggering the prickle response (Figure 1). This might be the reason that fibers >27 µm in diameter were not significant in the model for wearer prickle assessment in earlier investigations using more than 1800 wearer assessments. 10 It would also explain the observations of Naylor at al., who found that to achieve comfort equivalent to knitted fabrics a woven fabric needed to be made from wool with 3 µm finer MFD. It was concluded that the length of the protruding fiber ends in woven fabrics was less than that in knitted fabrics, and that the stiffness and capacity to excite nerve endings was therefore significantly increased. 22 Thus, as a result of the higher yarn twist and the structure of woven fabrics than in knitwear, yarns are held more tightly and the fabrics become stiffer. Shorter and finer fibers in woven fabrics have less freedom to move away from the skin and they behave more like firmly anchored rods. The findings illustrated in Figure 1 thus have important applications for both knitted and woven woolen fabrics.
Estimating human sensory perceptions
The WCM incidence per 10 cm2 (Ip) against the predicted human response (pSp) calculated using Equation (1) is shown in Figure 2. The relationship between the wearer prickle response (Sp) and predicted human response (pSp) derived from Equation (2) (Garnsworthy’s model) is shown in Figure 3. pSp was strongly correlated with the average prickle rating (Sp) assigned by wearers of the garments, with low prickle scores (Sp) associated with low pSp, as expected. An Ip between 10 and 17 would equate to 2.4 < pSp < 3.4, equivalent to wearer prickle score between 2.0 and 2.5 when some slight prickle was detected. The data suggested that a fabric with around 10 incidents per 10 cm2 (Ip = 10, pSp = 2.4) would equate to a wearer prickle response of 2.0, which is equivalent to no or barely detectable prickle.
Wool ComfortMeter (WCM) outputs from woolen fabrics converted into incidents per 10 square centimetres (Ip) versus the predicted human response (pSp), based on Stevens’s psychophysical power law (n = 48).
1
Relationship between the prickle scores of wearers (Sp) and the predicted human response (pSp) of fabrics (n = 48, r = 0.81). Dash lines indicate: wearer prickle score of 2.0, equivalent to no detection or barely detectable prickle; and 2.5, equivalent to some slight detection of prickle.

In this sample of knitwear made using a variety of yarn and fabric structures and different fiber types, there is a linear relationship between predicted human prickle sensations (pSp) and average prickle rating (Sp). Garnsworthy et al. applied a 0 to 10 scale to forearm tests, in which participants were given calibration fabrics scoring 0 and 10. In the more extensive wearer trials used in the present study a 1 to 9 scale was used, without the use of an equivalent calibration fabric but with clear definitions of the perceptions relating to each score. Unfortunately, no technical details of the calibration nor the test fabrics used by Garnsworthy et al. have been indicated. 1 It appears highly unlikely, however, that the calibration fabric ‘0’ would actually produce a score of ‘1’ in the more extensive later trials,10,11 as the lowest mean scores for cotton or ultrafine wool across the linked trials always exceeded 1.0 (see Figure 3), and there were always some sensitive individuals within the trial population who reported scores greater than 1 for these fabrics. Indeed, Garnsworthy et al. reported that the least prickly fabric of the 13 tested scored about 0.4, and they too found some more sensitive individuals, even within their much smaller sample of 55 participants. 1
Figure 4 shows the observed Ip (WCM incidents/10 cm2) against the 1–9 scale score for the wearer trial under two different environmental testing situations. Superimposed on this is the Garnsworthy et al. line of best fit (Sp ∼ 0.54 Ip0.66, r = 0.91).
1
On Garnsworthy’s scale (Figure 9 in their paper), Ip values of approximately 8 or less equate to Sp scores of less than 2. The non-linearity observed in their predicted human response (pSp), based on Stevens’s psychophysical power law (Figure 4) is therefore probably related to the difficulty of scoring fabrics found to give no prickle sensation when the frequency of prickle incidents are below 8. This may reflect their practice of not providing a calibration fabric-rated zero prickle during the actual forearm tests.
1
This finding may also indicate that any evaluation of fabrics needs to have a large enough population to ensure that sensitive individuals are included in the sample. It should be noted that the prickle scale used by Garnsworthy and co-authors to calibrate the fabrics is likely to be different from the scales used in the present study.
Wool ComfortMeter (WCM) outputs from fabrics composed of wool and other fibers converted into incidents per 10 cm2 (Ip) versus the average prickle rating (Sp) of fabrics evaluated in cool and warm testing environments. Superimposed solid line is the Garnsworthy et al.
1
line of best fit for 13 fabrics which had a correlation coefficient of 0.91, calculated as 0.54 Ip0.66 based on Stevens’s psychophysical power law. Symbols: ○, evaluation in cool environment (Period 3) with line of best fit shown as dots; □, evaluation in warm environment with activity (Period 11) with line of best fit shown as dashes. See Table 2 for regression coefficients.
Regression and correlation coefficients along with the standard error (se) and residual standard deviation (RSD) for the relationships between the observed wearer prickle response (Sp) and the Wool ComfortMeter incidence per 10 cm2 in fabrics during the test protocol for different testing environments. Period 3 was a cool environment with limited movement but no walking. Period 11 was a hot environment with walking. Weighted prickle response used data from all test periods. All correlation coefficients are significant at P < 0.001

This evidence suggests that when the incidence of prickle is less than about 3 in a cool testing environment and less than about 5 in a hot testing environment the Wool ComfortMeter values may be slightly higher than the response predicted using the Garnsworthy et al. line of best fit, based on Stevens’s psychophysical power law, However, over the entire range of possible prickle incidents and wearer responses the Wool ComfortMeter values provided a reliable prediction of the average human response in all testing environments, even at a low incidence of prickle (Figure 4 and Table 2).
Conclusions
The association has been assessed between the output of the WCM for assessing the propensity of fabrics to induce the prickle sensation and human assessments of prickle, indicating that the WCM can indeed determine the incidence of prickle-inducing fibers in knitted wool fabrics. Applying Stevens’s psychophysical law over a wide range of knitted woolen fabrics, we observed a strong association between the instrumental output and human assessment of prickliness (r ∼ 0.80), consistent with the original ground-breaking research of Garnsworthy and co-workers. The non-linearity observed between the human assessment of prickliness and the instrument output at very low incidence of prickle was probably due to scale differences between the wearer 1–9 scale trial approach using garments and the Garnsworthy approach using the forearm 0–10 scale, together with the difficulty in actually having a calibration fabric with a zero score. It appears that the forearm test best mimics the human response observed in hot environments when the participants have been exercising.
In addition, whereas much of the focus in attempting to engineer prickle-free knitwear has been on the effects of fiber diameter, particularly statistical parameters associated with the coarse-edge of the distribution of fiber diameter, the influence of variation in fiber length has now been explored. Focus has typically been directed to the percentage of fibers greater than 30 µm inducing prickle, but on the other hand we conclude that much finer fibers, even those finer than 20 µm, are capable of triggering the prickle response if the free length protruding above the fabric surface is sufficiently short. Thus it is likely that yarn construction methods which influence the incidence of prickle-inducing fibers in the fabric are also likely to affect the propensity of fabrics to induce prickle discomfort. In summary, this analysis gives further credibility to WCM, as the numerical values produced are in overall agreement with the values from human responses.
Footnotes
Acknowledgments
This work was funded by the Cooperative Research Centre for Sheep Industry Innovation Ltd. The authors wish to express their appreciation to Professor Xungai Wang for his support throughout this study. We are also grateful to the staff of the Department of Agriculture and Fisheries Western Australia’s Design for Comfort Laboratory, and to Dr Jane Speijers for undertaking the wearer trials and data analysis.