



Abstract
This study investigated the relationships between the sensations of sweaty, damp, muggy and clingy, as assessed by human response from wearer trial garment assessment, and fiber type, fiber, yarn and fabric properties and instrumental fabric measurements of next-to-skin knitwear. Wearer trial assessment of 48 fabrics followed a strict 60 minute protocol including a range of environmental conditions and levels of exercise. Adjusted mean weighted scores were determined using linked garments. Instrumental fabric handle measurements were determined with the Wool HandleMeter (WHM) and Wool ComfortMeter. Data were analyzed using forward stepwise general linear modeling. Mean fiber diameter (MFD) affected the sweaty, damp, muggy and clingy sensation responses accounting for between 23.5% and 56.2% of the variance of these sensations. In all cases, finer fibers were associated with lower sensation scores (preferred). There were also effects of fiber type upon sweaty, muggy and clingy scores, with polyester fiber fabrics having higher scores (less preferred) compared with fabrics composed of wool, particularly for peak sweaty scores in hot and active environments. Attributes such as fabric density, yarn linear density, knitting structure and finishing treatments, but not fabric thickness, accounted for some further variance in these attributes once MFD had been taken into account. This is explained as finer fibers have a greater surface area for any given mass of fiber and so finer fibers can act as a more effective sink for moisture compared with coarser fibers. No fabric handle parameter or other attribute of fiber diameter distribution was significant in affecting these sensation scores.
The perception of comfort of next-to-skin garments involves a complex interaction of many individual sensations. Tactile, thermal and moisture sensations are important for the comfort of knitted T-shirts and these sensations can interact.1–5 The neural basis for the prickle sensation increases with increasing skin temperature, increasing skin moisture content and exercise-induced sweating. 3 Simply moistening the skin evokes more neural discharge from contact with the same fabric than does dry skin 4 as water softens the skin. 6 This mechanism is further supported by the early work on the mechanical properties of keratin that showed that the bending and tensile stiffness of keratin reduced as its’ regain increased.7–9 The skin does not seem to have specific sensory receptors for wetness with this sensation being described as a cooling effect on the skin. Wetness perceptions are modulated by an intra-sensory interaction between thermal and tactile (pressure) sensations. 10
Moisture has been shown to impact skin/fabric interactions in other measurable ways. Several authors11,12 reported moisture on the skin surface increased the frictional forces between woven cloth and skin. The increased friction and skin moisture altered the perception of fabric pleasantness (acceptability) and texture. Increased skin wetness decreased fabric pleasantness. Skin moisture and skin friction therefore contribute heavily to the discomfort and unpleasantness of clothing in damp, warm environments.
While wetting the skin increases woven fabric-to-skin friction more than changes to fabric properties or fiber type, fiber type is important.11,12 Cashmere has exhibited lower static friction on wet skin than wool samples tested, and silk showed lower values than wool and cotton under both low and high relative humidity (RH) testing conditions. 11
Moisture further influences the skin/fabric interaction when in a high-humidity environment or when a fabric is wet, as it clings to any surface it touches. Clinging to the skin is considered a major source of fabric-evoked discomfort. 13 This may be related to the finding that before exercise, overall discomfort was largely determined by tactile sensations such as itchiness and prickliness, whereas after exercise, overall discomfort was mostly related to moisture sensations such as dampness and clinginess. 14
All textile fibers absorb and desorb moisture vapor from the air around them as the moisture levels in this adjacent air rises and falls, a property known as hygroscopicity. When comparing wool, cotton and polyester, wool is the most hygroscopic and polyester the least hygroscopic. Wool fabrics can absorb up to 35% of their weight in moisture compared with cotton at 24% and polyester at 1% when the air around them is saturated. This additional absorption by wool and cotton will delay the onset of liquid water forming. Moisture uptake also leads to an increase in fiber diameter, with both wool and cotton exhibiting diameter increases of about 17% when moisture content increases from dry to saturation. 9 The polar groups present in the wool fiber cortex interact with water by hydrogen bonding, and up to six layers of adsorbed water molecules have been reported. 15 The mass of water absorbed by keratin fibers (the regain) shows a curvilinear response to RH (moisture sorption isotherm) and there is hysteresis in moisture absorption, with the desorption regain curve being higher than the absorption regain curve.9,16 The movement of moisture present as vapor also plays an important role in the transfer of heat from the wearer and the garment.
For garments made from animal fibers, such as wool and cashmere, there is an added effect as the adsorption of water by wool is an exothermic process and such garments are perceived warmer compared with garments composed of other fibers when they absorb moisture. 17 Alternatively, when the moisture transfer process is reversed, more hygroscopic fibers provide a coolness sensation which increases with decreasing fiber diameter. 18
Liquid water begins to build up once the environment between the skin and garment and the garments become saturated. The fiber property of hydrophobicity now becomes important for the interaction of liquid water and fibers. The surface of wool fibers are hydrophobic, as the surface of the cuticle scales, the epicuticle, is covered by a chemically-bound, extremely thin layer of fatty acid. 19 This is responsible for the natural water-repellency of animal fibers. In their untreated state polyester is also hydrophobic while cotton is not. The presence of liquid moisture will effect thermal sensations through the evaporative cooling effect. 17
With moisture being an influential determinant of perceived comfort and evidence presented that shows that different fiber types can impact the tactile, thermal and moisture sensations of next-to-skin garments it is of interest to further evaluate the role of fiber properties in the moisture sensations of next-to-skin garments. Differences in hydrophobicity and water vapor absorption should affect the moisture component of comfort. This paper looks at the role of the constituent fibers, fabric structures, and fiber and fabric properties in affecting the moisture sensations of comfort.
We have previously reported the wearer response to prickle comfort sensations as this is a major impediment to consumers’ acceptance of knitwear composed of wool.20–22 We have also investigated the relationship between the instrumental measurement of the handle of fabrics, the prickle and comfort properties of fabrics and whether consumers like the fabrics. 22 These investigations have shown that mean fiber diameter (MFD) is the major source of variation in predicting the consumer perceptions of prickle discomfort accounting for about 70% of the variance in wearer prickle perceptions.
The aims of the present investigation were to examine the influence of fiber type, fiber diameter, fabric properties and instrumental fabric measurements on the damp, muggy, sweaty and clingy sensations perceived by the wearers of next-to-skin knitwear. The physiological responses of participants and the physical changes in fabrics are the subject of further investigations.
Methods
Wearer trials
Full details of the design and conduct of wearer trials are described in detail elsewhere. 23 In brief, garments (n = 48) of standard sizes, known construction and differing in fiber type and fiber diameter were evaluated under a set protocol in a series of trials. Each trial included a link garment or, in other words, a garment which was used in more than one trial. The assumption has been made that although there might be trial effects that would cause results to be higher or lower from one trial to the next, garment differences would not differ between trials. Sweat responses, for example, may change over time but we might expect they would equally affect the response to several garments and therefore the difference between garments would remain the same. Using link garment results it was possible to calculate comparable results for garments tested in different trials. The analysis has taken into account the effects of participant in obtaining responses for each fabric. Any differences in sweat response to different garments that are similar across garments will become part of the garment effect, but we have not attempted to measure these differences here. If differences in sweat response to different garments vary between wearers this will become part of the residual error (assuming it affects their scores).
Participants were drawn from the local community. In accordance with the relevant sections of the Australian National Statement on Ethical Conduct in Human Research 2007, a basic medical questionnaire was used and wearers were restricted to those having a body mass index (BMI) between 20 and 30. Pregnant wearers and those without English as their first language were excluded. 23
In each trial a range of exercises and controlled environments were used to elicit responses to changes in activity/exercise and environmental conditions known to alter body temperature and sweating, and therefore likely to effect the sensory responses of wearers. The test protocol consisted of five stages which followed sequentially as follows.
Pre-trial acclimatization when no measurements were made. Participant relaxes for 30 minutes wearing a light cotton wrap, at 23℃, 45% RH. Change room: 15 minutes with the test garment being worn, at 23℃, 45% RH. Hot room: 15 minutes at 40℃, 24% RH. Hot active session in hot room: while still in the hot room the participant spent 15 minutes on a treadmill operating at walking speed, with 5 minutes inclined at 5°. Return to change room after hot room: the final 15 minutes spent in the change room.
Within each of the last four stages there were variations in activity: sitting, standing, limited motion, and for the hot active session, walking on a level or elevated treadmill. In total, data for 15 periods were analyzed. Further details are shown in Figure 1.
The change in average weighted sweaty scores during the test protocol for selected garments. Error bars show the s.e. For each garment their fiber composition, fiber diameter and fabric density are provided. Symbols: ▪, Garment 21, wool, 20.6 µm, 243 g/mm3; □, Garment 34, wool, 21.2 µm, 247 g/mm3; •, Garment 42, polyester and elastane, 13.0 µm, 245 g/mm3; 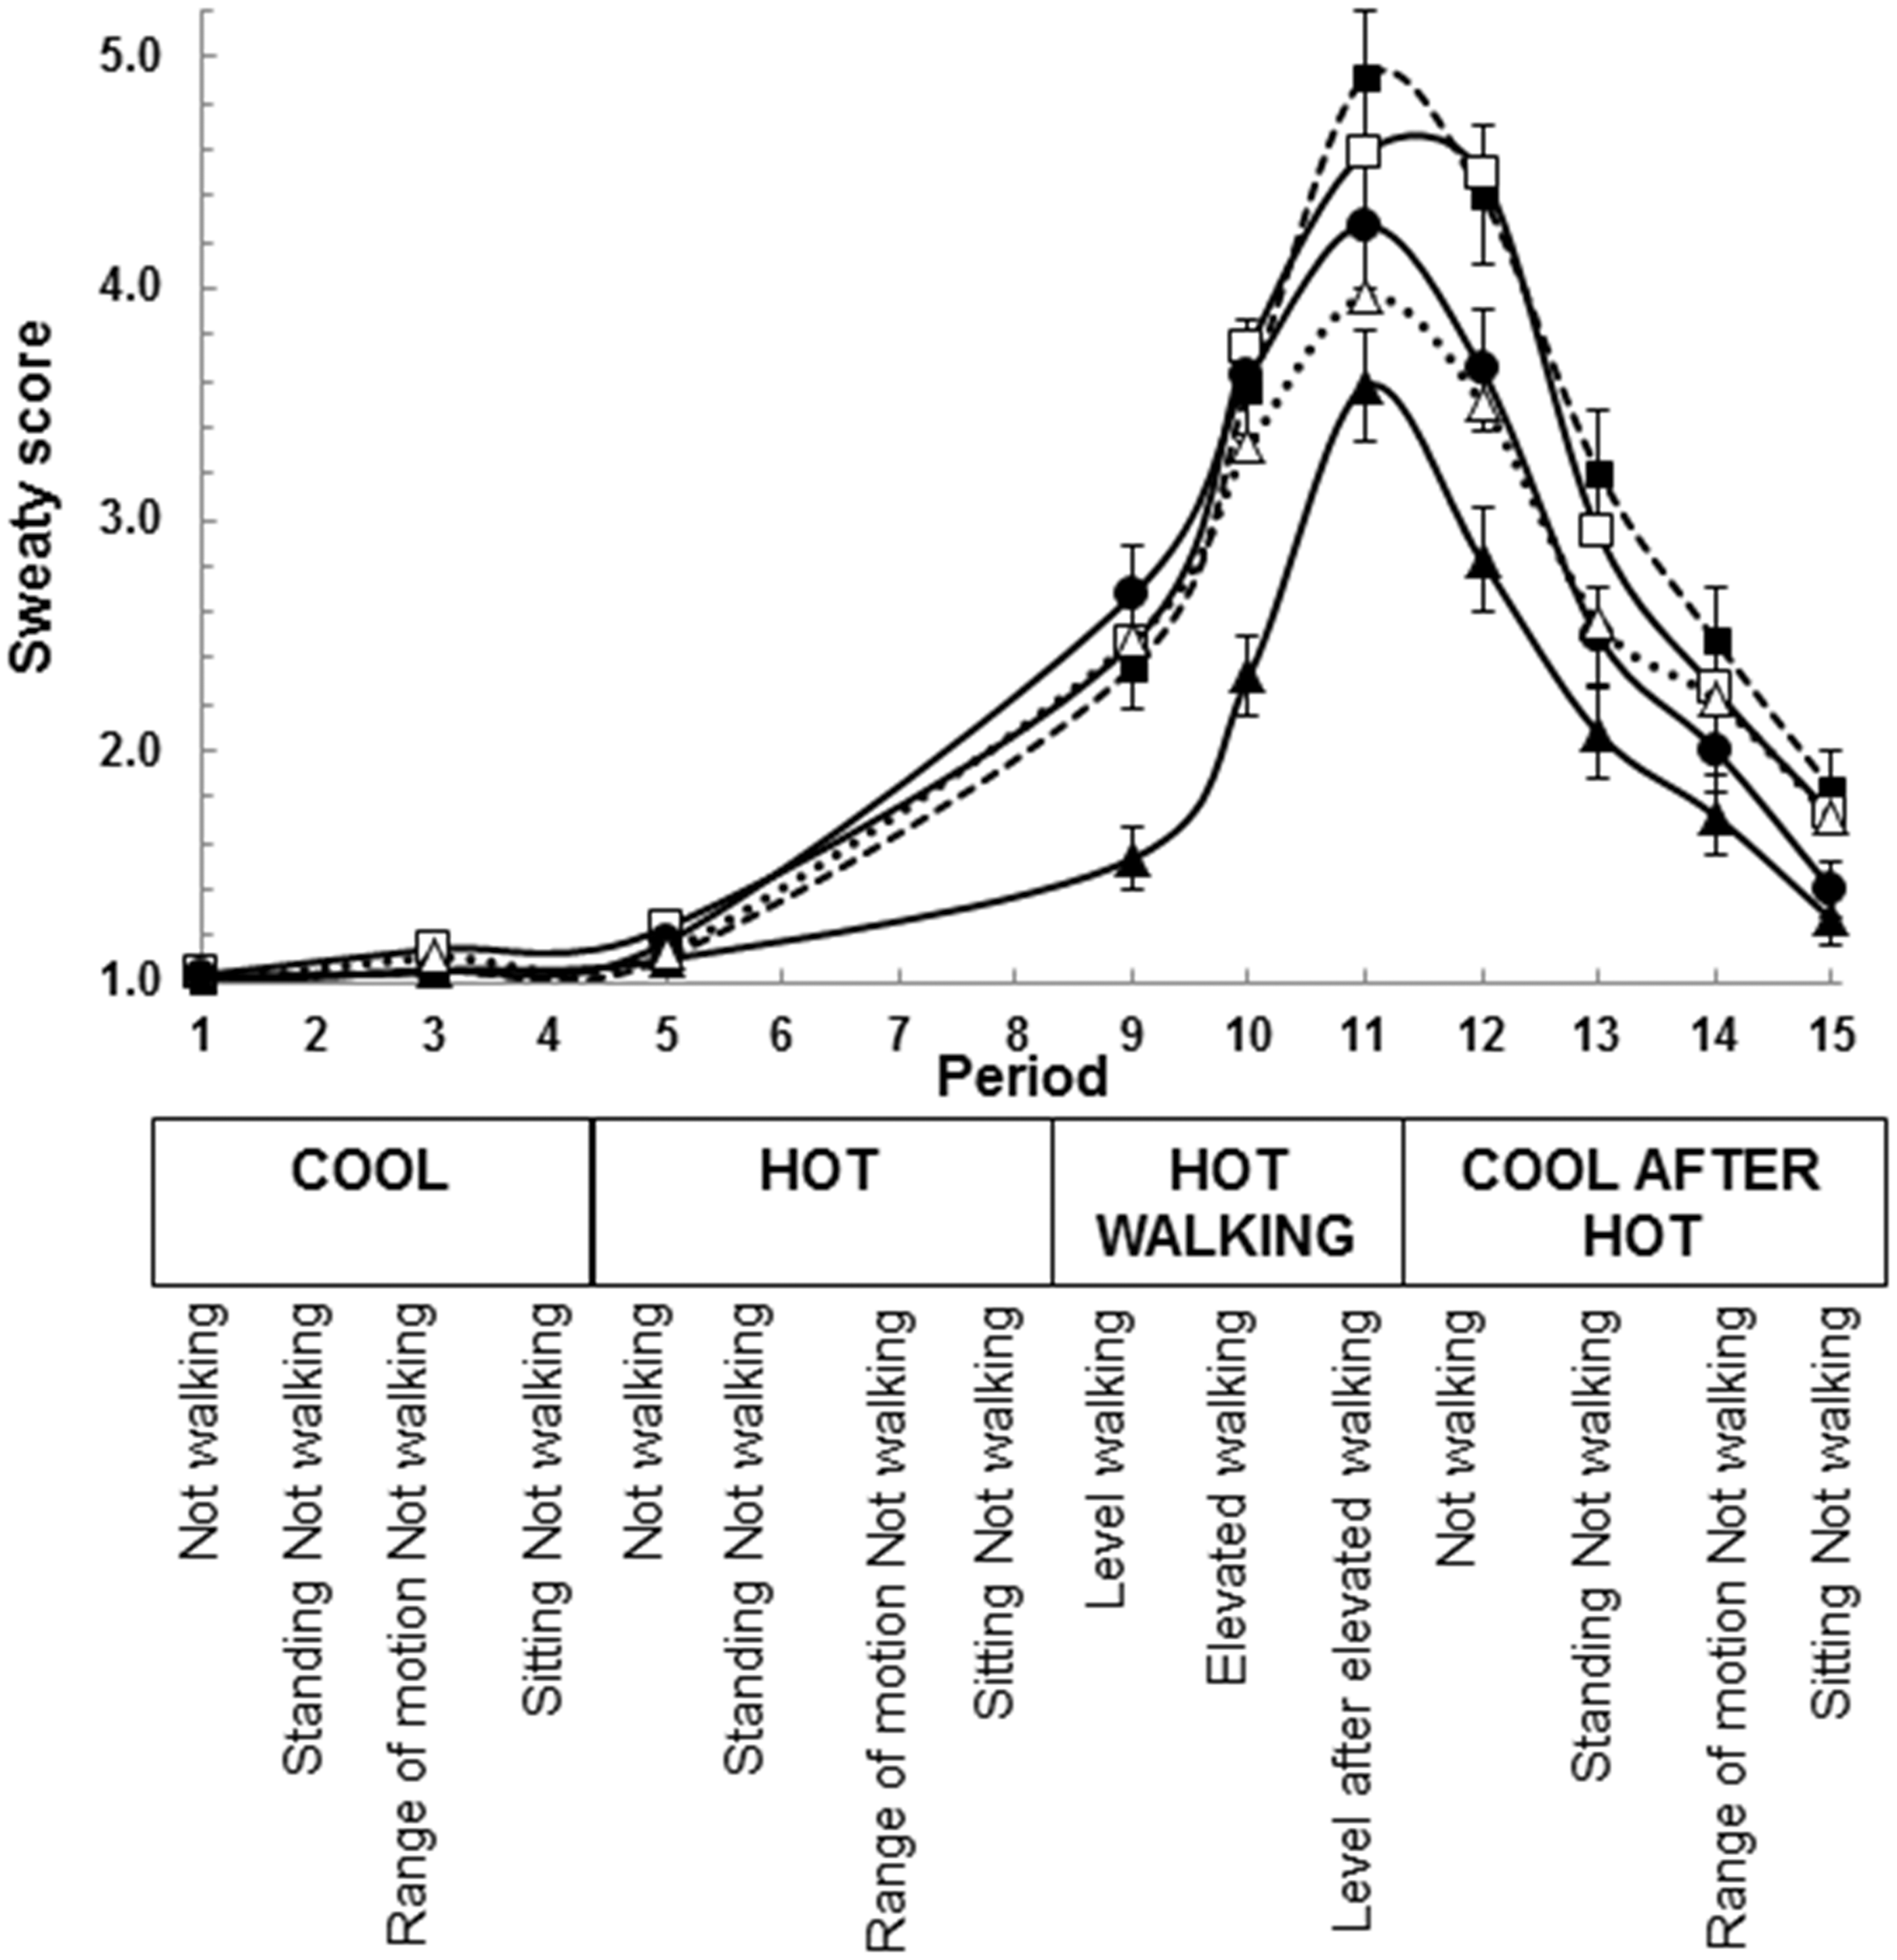
List of sensations rated along with the definition supplied to the wearer

For each garment in each trial there were ≈25–43 wearers, with the total number of assessments >1400 once account is taken of link garments. The data analyzed here, after adjustment using linked garments to remove any bias or drift which may have occurred over time or between wearer trials with variations in wearer cohort differences,
23
are:
the adjusted mean weighted scores for each period during the wearer protocol; the adjusted average weighted scores (averaged across the final four stages of the wearer protocol) from all wearer trials.
This was achieved using linear mixed models fitted to the scores using the REML procedure in GenStat. 24 This consisted of a random model, including appropriate variances and covariance structures, and a fixed model which included garment effects, period effects, trial effects, garment by period interaction effects and trial by period interaction effects. 24
Fiber and fabric evaluation
MFD (µm), diameter distribution characteristics (coefficient of variation (CVD, %)), incidence of fibers at each diameter (%), fiber curvature and fiber curvature standard deviation (°/mm) were measured using the Laserscan with 10,000 fibers counted for each sample at the Australian Wool Testing Authority. Fiber curvature measurements and the incidence of fibers at each diameter were not available for four fabrics constructed with cotton or polyester.
Fabric handle parameters were measured using the Wool HandleMeter according to the draft test method. 25 Three circular specimens 100 cm2 in area were cut from garments used in the wearer trial. Fabric mass per unit area (g/m2) and fabric thickness (mm) were measured. The Wool HandleMeter provides seven primary handle (Clean/Hairy, Cool/Warm, Greasy/Dry, Hard/Soft, Light/Heavy, Loose/Tight, Rough/Smooth,) and Overall Handle which have been shown to be sufficient to describe the primary tactile attributes of lightweight single jersey fabrics as determined by a panel of fabric evaluation experts.26,27
For each Wool HandleMeter parameter the predicted value varies between 1 and 10, with 1 associated with the first term for the parameter and 10 being associated with the last term for the parameter. The garments tested were selected on the basis that they had been worn twice during the trial. All garments were initially washed three times on a gentle cycle in a domestic washing machine according to the Woolmark Test Method TM 31, and dried flat prior to use in the experiments. Not all fabrics met the range suitable for the Wool HandleMeter which is: single jersey; fabric thickness less than 0.9 mm; mass per unit area between 140 and 220 g/m2.
Fabrics were tested with the Wool ComfortMeter, which is a rapid laboratory method to quantify the knitted fabric prickle comfort rating.20–22 The Wool ComfortMeter uses a measurement wire mounted in a recording head, which scans the surface of the fabric, interacting with fibers protruding from the fabric surface. Wool ComfortMeter assessment was undertaken using the draft test method. 28 In brief, five samples from each fabric (30 cm × 30 cm) were cut, then hung vertically and the reverse side (back) of the fabric was lightly steamed. Fabric testing was carried out under standard conditions after 24 hours of conditioning.
The surface area of fibers in each square meter of fabric was determined as follows. The length of yarn (m) in each square meter of fabric was determined as: fabric mass per unit area/yarn linear density (tex). The number of fibers in the yarn cross-section was determined as (yarn linear density in tex × 916.9)/(MFD2). The fiber surface area (m2) was determined treating each fiber as a cylinder as follows: (π × MFD)/(1 × 106) × fibers in cross-section × length of yarn in m per m2 of fabric.
Statistical analysis
The units for analysis were the individual fabric means (n = 48). Correlations between physical measurements of fabrics, wearer trial sensory scores, MFD, Wool ComfortMeter and Wool HandleMeter parameters were determined. Correlations were also determined for wearer sensation scores between different stages of the test protocol. For some correlations the data set was restricted to 19 fabrics composed of single ply wool yarns knitted into single jersey.
A parsimonious general linear model with normal errors was developed in a forward stepwise manner using GenStat 15.1 24 to determine the relationship between the weighted wearer trial sensation scores and attributes of constituent fibers, yarns and fabrics. As multiple regression models were developed, the additional significance of any attribute was tested as was the significance of any existing attribute once a new term was added. Any term identified as being no longer significant was removed. Data transformation was not required prior to analysis. For each significant variate, the square of that variate and the product of that variate with other significant variates were tested for significance. The best model was developed with terms being added or rejected on the basis of F-tests (p < 0.05). Once the final models were determined the marginal significance of each term in the final model was determined and the marginal significance of rejected terms was also determined. To test the effects of fabric characteristics, factors were defined for variations of: fiber type (wool including cashmere, cotton, polyester); knitting structure (single jersey, single rib, interlock, pique, reverse single jersey); fabric finishing (standard, raised, decatized); mercerized finish (yes, no); and total easy care finish (yes, no). General linear models, that included only prescribed subsets of the parameters in the parsimonious model, and for some terms not included in the final model, were fitted and compared using percentage variance accounted for. 24 When the data set was restricted to fabrics with Wool HandleMeter measurement (n = 33), none of the Wool HandleMeter parameters were significant determinants for any of the sensation scores (p > 0.05).
Results
Mean, standard deviation (SD) and range for wearer trial sensation scores, Wool HandleMeter measurement and selected fiber and fabric attributes for all garments (n = 48)

Fabrics showed a large range in attributes, for example MFD ranged from 12.8 to 21.2 µm, fabric thickness from 0.53 to 1.63 mm and fabric mass per unit area 156 to 321 g/m2. The low correlation coefficients between MFD and fabric thickness, fabric mass per unit area and fabric density of 0.42, 0.33 and −0.42, respectively, show the relative independence between MFD and these fabric attributes.
The correlation coefficients between average weighted wearer comfort sensation scores and between average sensation scores and mean fiber diameter (MFD), Wool ComfortMeter (WCM) or fabric thickness (n = 48)

All values significant at p < 0.01 unless otherwise indicated: ap < 0.05; bp > 0.05.
The correlation coefficients between average weighted wearer comfort sensation scores for single ply single jersey wool fabrics and mean fiber diameter (MFD), Wool ComfortMeter (WCM) and Wool HandleMeter parameters. Data set restricted to fabrics suitable for measurement on the Wool HandleMeter (n = 19)

Values significant at: ap < 0.01; bp < 0.05; all other values p > 0.05.
Sweaty sensations
Figure 1 shows the changes in the weighted sweaty score for each of the 15 periods of the test protocol for selected fabrics. During the initial cool periods 1 to 5 the sweaty scores remained very low near 1. Sweaty scores then rose in hot conditions before rapidly rising during exercise in the hot room peaking in period 11 then declining at similar rates until the end of the test protocol. Peak sweaty scores were twice the average score for the entire protocol (Table 2). The examples shown in Figure 1 illustrate the higher sweaty scores for fabrics made from coarser fiber. The polyester and cotton fabrics shown are typical for the fabrics composed from these fibers. To improve the clarity of Figure 1, standard error (s.e.) bars are shown only for the garments with the highest, middle and lowest scores illustrated.
Correlations between periods of the test protocol for sweaty score

p < 0.001; bp < 0.01; cp < 0.05.
As a consequence of this finding we first analyzed the peak sweaty scores in period 11, during the exercise in the hot room. The best linear model for the weighted peak sweaty sensations is (s.e. in brackets):
A list of the marginal statistical significance of included terms in the final model for peak weighted sweaty score

The share of variation attributed to differences in the MFD was 37.1% of the total variance in peak sweaty scores (Table 7). As shown in Figures 2–4, there was one outlier (standardized residual −4.0), which if removed increased the variance accounted for by the final model to 70.5%, and the variance explained by MFD to 46.4% of total variance and 65.8% of variance explained. The addition of a term for fabric density accounted for a further 13% of total variance (Table 7). Fabric thickness, fabric mass per unit area and fabric mass per unit thickness were not significant in the final model for peak sweaty score (Appendix 2).
The relationship between the observed (symbols) and predicted (line) weighted sweaty scores and the mean fiber diameter of constituent fibers for 48 fabrics. Symbols: ◯, single jersey, pique and rib structures, wool, cashmere and cotton fabrics; The relationship between the observed (symbols) and predicted (line) sweaty scores and fabric density. Symbols: ◯, single jersey, pique and rib structures, wool, cashmere and cotton fabrics; The relationship between the observed (symbol) and predicted (line) sweaty scores and yarn linear density. Symbols: ◯, single jersey, pique and rib structures, wool, cashmere and cotton fabrics; Variance in the peak sweaty score accounted for by terms in the final multiple regression model (abbreviation: MFD, mean fiber diameter)


The predicted relationship between the peak sweaty scores and MFD is shown in Figure 2. Lower peak sweaty scores were associated with lower MFD of constituent fibers. The outlier discussed above had a MFD of 18.1 µm and a sweaty score of 3.2.
The predicted relationship between peak sweaty scores and fabric density is shown in Figure 3. Lower sweaty scores were associated with higher fabric density.
The predicted relationship between the weighted sweaty scores and yarn linear density is shown in Figure 4. While the prediction, which is adjusted for other terms in the model, suggests lower sweaty scores were associated with lower yarn linear density, there was a large range in sweaty scores for 25 tex yarns.
Polyester fabrics had 0.4 units higher peak sweaty scores than other fabrics tested (Equation 1, p = 0.018, if the outlier is removed p = 0.006). For one polyester fabric with a MFD of about 13.0 µm, the peak sweaty score was 0.4 units above the predicted response for the effect of MFD (Figure 2), about 0.2 units above the predicted response for fabric density and both polyester fabrics were above the predicted response to yarn linear density (Figures 3 and 4). Equation (1) shows the coefficient for the effect of reverse single jersey having 0.45 higher peak sweaty scores compared with single jersey fabrics (Figures 2–4; p = 0.045, if the outlier is removed p = 0.016).
Modeling the increase in sweaty scores between periods 5 and 11 provided similar significant terms (MFD, yarn linear density, fabric density and a term for polyester fabrics) compared with the models for the peak sweaty scores (Equation (1)). MFD explained 31.1% of the variance in the increase in sweaty scores between periods 5 and 11 (p = 2.3 × 10⁻⁵) and the best model explained 55.9% of the variance in the increase in sweaty scores between periods 5 and 11.
The best model for the average weighted sweaty score for all periods is (s.e. in brackets):
The reference fabric is single jersey wool.
This model is very similar to Equation (1) for the peak sweaty scores. The multiple correlation coefficient was 0.86, the percentage of variance accounted for was 71.7% and the residual SD was 0.0906. Equation (2) shows that the regression constant and the regression coefficients for MFD (p = 2.3 × 10⁻⁵), yarn linear density (p = 0.0014) and fabric density (p = 0.0062) are approximately half the value for the same terms as shown in Equation (1). Knit structure for interlock and reverse single jersey was significant (p = 0.0031). The regression coefficient for cotton and polyester fibers in Equation (2) (p = 0.039) is one third the value for the coefficient for polyester in Equation (1). Thus, these significant terms are having a greater impact on peak sweaty scores, when the amount of liquid sweat is at its maximum, compared with their impact on the average sweaty score, whose value is tempered by the delayed onset of sweating (Figure 1) and the longer time in the presence of water vapor caused by some garments.
The share of variation attributed to differences in the MFD was 42.7% of total variation and 59% of the variation accounted for by the model. The addition of the term for fabric density accounted for a further 12.1% of total variance. The inclusion of terms for knit structure and yarn linear density accounted for a further 14.4% of total variance while adding the term for cotton and polyester accounted for a further 2.5% of total variance. While fabric mass per unit area, fabric mass per unit thickness and fabric thickness were not significant in the final model for average sweaty score (Appendix 2), as single terms fabric mass per unit area accounted for 17.0%, fabric mass per unit thickness accounted for 27.6%, fabric thickness 31.4% and machine gauge 19.9% respectively of the variance in average weighted sweaty scores.
Damp sensations
Correlations between periods of the test protocol for damp score

p < 0.001; bp < 0.01; cp < 0.05.
Peak damp scores were 50% higher than the average score for the entire protocol (Table 2). The best model for the average weighted damp score for all periods is (s.e. in brackets):
The reference fabric is single jersey wool.
The multiple correlation coefficient was 0.67, the percentage of variance accounted for was 45.5% and the residual SD was 0.075. The marginal statistical significance for included terms were: MFD (p = 0.0071); reverse single jersey structure (p = 0.020); finishing treatment (p = 0.012; decatized p = 0.025; raised p = 0.025). MFD alone explained 30.5% of the variance in mean weighted damp score and in combination with finishing treatment explained 40.1% of the variance. Fabric thickness was not significant (p = 0.97). Reverse single jersey structure and raised finishing were associated with higher damp scores. No other fabric attribute was significant in the final model (Appendix 2).
Muggy sensations
Correlations between periods of the test protocol for muggy score

p < 0.001; bp < 0.01; cp < 0.05.
The best model for the average weighted muggy score for all periods is (s.e. shown in brackets):
The reference fabric is single jersey wool.
The multiple correlation coefficient was 0.85, the percentage of variance accounted for was 71.7% and the residual SD was 0.118. Equation (4) for average weighted muggy scores contains similar terms to equation 2 for the average weighted sweaty scores. The marginal statistical significance for included terms were: MFD (p = 5.9 × 10⁻⁸), yarn linear density (p = 5.1 × 10⁻⁵), yarn ends (p = 0.00073), fiber surface area per m2 (p = 0.0030); polyester fabrics (p = 0.022). MFD alone explained 27.6% of the variance in mean weighted muggy score and in combination with yarn count explained 55.7% of the variance. If fabric mass per unit area was used in place of fiber surface area per m2, the variance accounted was reduced to 70.8% and the significance of fabric mass per unit area was p = 0.0059. Fabric thickness was not significant (p = 0.96). Polyester fabrics had 0.2 unit higher mean muggy scores than other fabrics tested. Increasing yarn count increased muggy score, while increasing yarn ends reduced mean muggy scores by 0.2 unit per end. No other fabric attribute was significant in the final model (Appendix 2).
Clingy sensations
Correlations between garment testing periods of clingy score. All values are significant at p < 0.001

The best model for the average weighted clingy score for all periods is (s.e. shown in brackets):
The reference fabric is single jersey wool.
The multiple correlation coefficient was 0.66, the percentage of variance accounted for was 43.7% and the residual SD was 0.302. The marginal statistical significance for included terms were: MFD (p = 1.3 × 10⁻⁶), yarn twist (p = 0.0032) and polyester fabrics (p = 0.0061). The share of variation attributed to differences in the MFD explained 23.5% of total variation and 53% of the variation accounted for by the model. The addition of the term for polyester fiber accounted for a further 6.2% of total variance. Polyester fabrics had 0.6 unit higher mean clingy scores than other fabrics tested (Figure 5). The effect of yarn twist related to one wearer trial (Figure 5) and needs further investigation to determine the real effects. No other fabric attribute was significant in the final model (Appendix 2).
The relationship between the observed and predicted average weighted clingy scores and the mean fiber diameter of constituent fibers for 48 fabrics. Symbols: ◯, wool, cotton and cashmere fabrics; □, polyester fabrics; 
The relationship between the average weighted clingy scores and MFD is shown in Figure 5. Low clingy scores were associated with low MFD of constituent fibers.
Effect of fiber type on sensory scores
The mean effects of fiber type on the sensation scores are summarized in Figure 6, after adjustment for other terms in the prediction models for each sensation score.
A radar plot of mean sensory scores for wool fabrics and the sensory score deviation for polyester fabrics based on the regression analyses. The center shows the lowest sensation score of 1 and the vertical axis shows the scale for the sensation scores. Symbols: ◯, mean for all wool fabrics; ▪, deviation in scores for polyester fabrics after adjustment for other terms in the prediction models.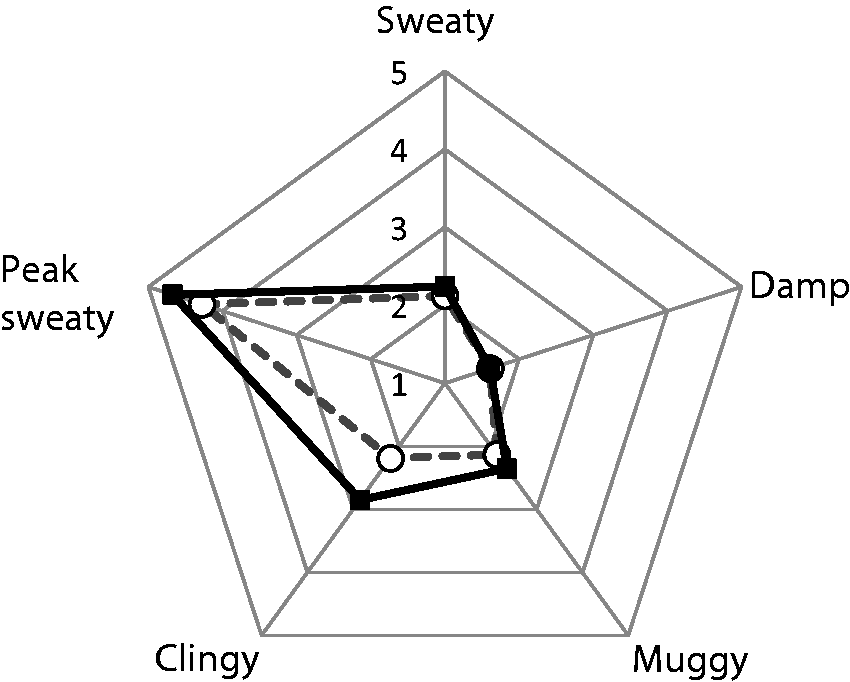
Discussion
This report concerns four sensations related to moisture and heat: two related to liquid moisture (sweaty, damp), one related to water vapor and heat (muggy) and one related to moisture and skin interactions with the fabric (clingy). In the present work, MFD had the major effect accounting for between 23.5% and 42.7% of the variance for sweaty, damp, muggy and clingy sensation responses of wearers of 48 next-to-skin knitwear fabrics. For 19 single jersey fabrics made with single ply wool yarns, MFD accounted for 53 to 56.2% of variance in damp and sweaty sensations respectively (Table 4). In all cases, finer fibers were associated with lower sensation scores (preferred) and coarser fibers were associated with higher less preferred scores. This finding does not appear to have been reported previously as it does not appear to be mentioned in Li’s comprehensive review of the science of clothing comfort. 29 Once MFD had been taken into account, fabric attributes such as thickness, mass per unit area and density accounted for little or none of the variance in these sensations. The lack of response to most of these fabric attributes in the present work differs from reports summarized by Li, 29 probably because we used a large variation in MFD as part of the design, we focused on every-day wear using a 1-hour protocol, and perhaps because in other work there is confounding between fiber type, MFD and fabric thickness thus making it impossible to separate between the effects of these variables. The present investigation also maintained a relatively high number of degrees of freedom based on the number of different fabrics tested thus enabling more precision to be brought to the analyses.
Water vapor diffusion through fabric involves phase changes at the surface of the fabrics. The largest drop in temperature and concentration of water vapor takes place at the fabric–skin boundary 30 or when the fabric touches the skin. 31 Li 29 reviewed the knowledge about clothing comfort and presented a range of models that related to human comfort interactions including moisture and heat transmission. Li 29 discussed the known aspects of clothing which affected human sensations including moisture, damp and clamminess sensations as well as coolness, warmth and physical aspects of clothing comfort. Our findings appear to support the conclusion that moisture flux occurs predominantly through the air spaces of the fabric and that the role of the fibers is to act as a moisture source or sink. 32 The effectiveness and rate of moisture transfer, whether acting as a source or sink, is a function of the fiber surface area available as the moisture transfer occurs through the surface of the fiber. This is explained as finer fibers have a greater surface area for any given mass of fiber and so finer fibers can act as a more effective sink for moisture compared with coarser fibers. This finding appears to differ from that of Markee et al. 33 who did not find any differences in wetness related to cotton or polyester fabrics of different fiber diameter. This could perhaps be explained by their small sample size or that the range in fiber diameter for cotton and polyester was small and combined with the smaller regain may not have been detectable.
We also detected effects of fiber type upon sweaty, muggy and clingy scores, with polyester fabrics having significantly higher scores compared with fabrics composed of wool (Figures 2–6). This was particularly demonstrated with peak sweaty scores (Figure 1).
The finding that fabrics composed of wool, after accounting for other significant factors, produced lower peak sweaty, muggy and clingy scores accords with previous research where wool fabric, and other fibers with strongly hygroscopic behavior, removed more moisture from the microclimate under fabrics than polyester fabric.29,31,34 Thus, wool fabric reduced the perceived discomfort caused by moisture build-up on the skin under wear trial conditions and that such fabrics feel dryer over a wider range of moisture contents than other less hygroscopic fibers. Predictions in highly favorable wear circumstances indicate that moisture transport from the skin is 30% more while wearing wool compared with less hygroscopic polyester clothing. 35 Similarly, in simulated conditions using woven fabrics, cotton fabric exhibited the slowest build-up of moisture vapor concentration, followed by a cotton/polyester blend and polyester fabric showed the greatest build-up of moisture. 36 What the present research has shown is that wearers can detect the effects of fiber type (wool, cotton, polyester) across a range of environmental and exercise conditions, and that ultrafine wool significantly reduced peak sweaty scores and lowered the sweaty scores during the build up to and following the peak sweaty scores. Until sweating occurs it is not possible to predict the degree of sweaty, damp and muggy that will occur (Tables 5, 8, 9). Thus under practical day to day conditions of travel, work and in other stressful and physiological conditions, where it is less predictable when people will experience “hot flushes” and sweating, ultrafine wool garments provide the most effective buffer to moderate the build-up of excessive moisture and consequently providing more comfortable wetness sensations.
The best prediction model for clingy indicates that there is a small proportion of the population which are affected by increase in clinginess but we cannot identify these people and the effects are small in magnitude. Markee et al. 33 also reported differences in wetness related to participants resulting in wide variance in the scores. Clingy scores for wool were less than with polyester, which is similar to the findings of earlier studies. 37 These findings can in part be explained by the known property of wool fabrics acting as a buffer in moisture transfer between the sweaty skin and the environment compared with less hygroscopic fibers such as polyester or polyamide.29,37 The generally high correlation for clingy scores between different periods of the test protocol (Table 10) indicates that the initial clingy score provided by people was a good indication of clingy sensations at other times and in other environmental conditions. This means that the more clingy a garment was at the start, the more clingy it was throughout the test protocol.
Other factors of significance in the models, and found to influence the wetness sensations, include the knit structure, yarn count, fabric density and the surface finish of the fabric. For sweaty and dampness sensations, the reverse single jersey structure differed from the standard single jersey orientation. This infers that the effect is due to a fabric surface effect and not a bulk fabric effect, as the bulk fabric is the same in both cases, a single jersey construction. The reverse single jersey, where the side arms of the knitted loop are in contact with the skin increases the damp and sweaty sensation compared with when the head of the knitted loop is in contact with the skin, is an effect probably due to difference in fabric area in contact with skin.
Yarn count is significant in the models for the sweaty and muggy scores and in each case increasing the yarn count was associated with an increase in the sweaty and muggy scores. An increase in yarn count would be associated with a greater compact mass of fibers near to the skin. The adsorption of water vapor and the subsequent release of heat of sorption by the larger mass of fibers could play a role in the increased sweaty and muggy sensation. However, as the term for fabric density is only significant in the model for sweaty and the effect is to reduce the sensation of sweaty as fabric density increases, an alternative mechanism may be required.
The two fabric surface finishes are significant terms in the model for dampness. The two surface effects result in opposing changes to the fabric surface. The raised finish increases the length and number of fibers on the fabric surface and thereby holds the fabric off the skin, while the decatizing process flattens the surface fibers and makes the fabric surface smoother allowing greater contact with the skin. It is therefore fitting that the two processes have opposing effects. The decatizing process reduces the dampness sensation while the raising process increases the damp sensation.
For most of the key fiber and fabric terms that are significant in the prediction of the wetness sensations it appears that a consideration of the rate of adsorption of moisture per unit volume of fabric is sufficient to explain these effects.
Non-significant terms
Other than MFD, no other attribute of the fiber diameter distribution was significant, such as fiber diameter CV or the incidence of coarser fibers such as the percentage coarser than 30 µm. This means that textile processors need to focus upon only one attribute of fibers, the MFD. Other attributes of the fibers removed from the fabric such as fiber curvature were also not significant.
Instrumental measurements of fabric handle determined using the Wool HandleMeter were not significant determinants of damp, muggy, sweaty or clingy scores. The Wool ComfortMeter, which is a good predictor of fabric prickle discomfort, 22 while not in the final models, was moderately correlated with these sensation scores (Tables 3 and 4) and in the absence of data on fabric MFD may provide a useful guide to these sensation scores.
Conclusions
The protocol implemented covered a range of environmental conditions over 1 hour including office conditions, hot environment, hot environment with active walking and a return to office conditions. This protocol, which also included variations of sitting, standing and limited motion in each session, was sensitive enough to detect differences in the sensation scores through a range of transient conditions including heating up, cooling down and activities. For wearers and manufacturers of next-to-skin knitwear the key findings were as follows.
Finer fibers were associated with preferred lower sensations of sweaty, damp, muggy and clingy for wool, cashmere, cotton and polyester fabrics. Polyester fabrics were less preferred as they had higher sweaty, muggy and clingy scores compared with fabrics composed of wool. Other attributes of fabrics, such as knit structure, yarn count, fabric density and fabric finishing had smaller effects on wetness sensations once MFD had been included in the models. In this study fabric thickness was not a significant determinant. There was no connection between the instrumental measurement of fabric handle characteristics and whether or not the fabric may cause wetness discomfort. There were moderate correlations between instrumental measurement of prickle discomfort and the wetness sensations studied but for muggy and sweaty sensations the correlations were similar to or higher with fabric thickness than with the Wool ComfortMeter.
Footnotes
Acknowledgment
The staff at the Design for Comfort Laboratory, Perth are thanked.
Funding
This work was funded by the Cooperative Research Centre for Sheep Industry Innovation Ltd.