




Abstract
This article proposes a testing and evaluation method for the unevenness of yarns based on measuring diameters of a series of testing points contained in the image sequence captured from a moving yarn. The address mapping table is used to achieve automatically measuring diameters of all testing points by fast addressing and locating their positions in the image sequence. Measuring the diameter of the testing point is based on the sub-image containing the testing point segmented from the captured image. In the yarn body extraction, according to the distribution character of gray-level projection, the sub-image is firstly divided into the yarn noumenon section, suspected noumenon section and image background section. Then the pixels of the suspected noumenon section are further categorized according to gray-level characters and connectivity to the yarn noumenon section. Finally, the complete yarn body image could be extracted. The diameter of the yarn testing point was represented by the average value of the neighboring point diameters in the axial direction. We compared the proposed method with the traditional measuring method by testing the same kind of yarn and performed an analysis using mathematical statistics methods. It proved that the proposed method can automatically process a continuous yarn image sequence and realize large sample statistics and unevenness evaluation.
Keywords
The unevenness of yarns is one of the main parameters of fabric structure and also the main performance index to evaluate the quality of yarn. It can cause inherent quality difference and lead to a reduction in tension, abrasive resistance and firmness of fabric. What is more, it can also result in a high fracture rate and produce cloud and shadow in appearance.1–3 The diameter of yarn is the direct index of yarn unevenness, so how to get accurate, rapid determination of yarn diameter is meaningful work in the textile industry.4–7 The unevenness of yarn diameters is one of the most important parameters for designing a textile craft, calculating tightness and thickness of the fabric and forecasting the hand feeling of the final product. In fabric design and development, fabric tightness and surface smoothness are main design indexes of the textile standard, and both of them are directly dependent on yarn diameter and the uniformity of yarn. The performance assessment of yarn diameters is also related to fabric price, classification, yarn strength utilization coefficient and the percentage of neps and trashes contained in fray fabrics of cotton, man-made fibers or their blends. With the rapid development of fiber material, an increasing number of new spinning yarns, textured yarns and blended yarns are created.8–10 The volume, weight and performance indexes have all changed significantly, so in fabric design, the traditional diameter coefficient cannot always reflect the actual situation. In currently available technology, there is a great difference between the actual diameter coefficients of frequently used yarn and the customarily used one. The trends and changes above require new methods for measuring the yarn diameter quickly and accurately. However, considering the inherent characteristic of yarn and other textile material, the irregular shape of the different yarn cross-sections in different positions along the axis of the yarn will lead to diameter variation. It is a pretty heavy work to conduct the large sample statistics and unevenness analysis.11–14 Although the optical detection method can achieve high-precision detection,15–17 the difficulties in recognizing the yarn hairiness, fiber and yarn noumenon can make the work even harder.18–21 The method using static measuring and small samples to evaluate unevenness cannot meet the requirement of scientific research and industrial production. Artificial perception easily leads to error detection and lower efficiency.
At present, the measurement and evaluation method for the yarn diameter can be divided into three categories:22–25 the first is the capacitance evenness tester, in which the air capacitor is used as a detector, for the reason that the dielectric constant of fiber material is larger than that of air; when a piece of yarn is delivered between two metal plates where an electric field exists, the capacitance should change in proportion to the fiber amount in yarn section. This is an indirect method of measuring the variation in yarn linear density (yarn count) that correlates to the yarn diameter through empirical relations from which the variation in yarn diameter can be calculated. This method is not affected by the shape of the yarn cross-section, but the unevenness of yarn moisture and the blending ratio of blended yarn can make the result unreliable. Meanwhile, this method is highly correlated to the environment and this indirect way to obtain unevenness by using an empirical formula instead of measuring the diameter directly can also lead to discrepancy between the measurement results and the actual visual effect. However, the advantage of this method is that it is easy to get the yarn evenness index and its detection results focus on yarn external quality evaluation and predict how it can affect the fabric quality. The second method is the photoelectric measuring method. By projecting a laser on the surface of yarn and analyzing the projection image on the optical sensor, we can get diameter data. Although it is not affected by the moisture content and the blending ratio, fiber and hairiness have a remarkable influence on the testing result. Particularly in the process of testing the yarn, the change of the yarn cross-section shape caused by yarn tension can easily lead to an error. Finally, the most popular method in the laboratory is using the eyepiece of an ordinary biological microscope to measure yarn diameter after proof reading the objective micrometer. Obviously, manual operation will reduce efficiency, so this method is only suitable for scientific research in the laboratory.
In this paper, using a machine vision system, we propose a testing and evaluation method of yarn unevenness based on the image sequence of moving yarn. This testing system is designed based on a computer, including the inside and outside box, yarn driver apparatus, imaging system and testing software. The designed system can completely simulate the testing environment. Once the operation begins, the yarn image sequence is captured continuously and then batch processing is executed without manual intervention. The system can automatically realize measuring the diameters of all testing points.
The paper is arranged as follows: the second part describes the system devices and image acquisition and preprocessing. The third part discusses the method of extracting the noumenon image and measuring the diameter of the testing yarn. In the fourth part, we talk about the batch processing of the image sequence and the statistical analysis method of unevenness. The yarn detection experiment and results analysis are in the fifth part, in which we compare the traditional testing instruments with the proposed approach for the same kind of yarn and analyze the results using mathematical statistics. Finally, we draw a conclusion.
Acquiring the image sequence of moving yarn and image preprocessing
System devices
In this article, we design a computer-based yarn dynamic image acquisition and processing system, which combines yarn dynamic image acquisition, image processing, diameter measurement and unevenness analysis together. In the designed system, a closed box is used as the image acquisition platform to shield the disturbance of the stray light. Meanwhile, a milky white diffusing glass is adopted as a light filter to eliminate the reflected light in order to get clearer images. In addition, a yarn motion driver and tension controller are employed to obtain better simulation and meet the requirements of measuring yarn diameter. In this paper, the statistical analysis of the large sample for yarn diameter is made and the unevenness evaluation can be realized on the basis of the continuous yarn image sequence. Figure 1 shows the integrated structure of this system.
System devices of the yarn diameter measurement and unevenness analysis: (1) shell with half-box structure; (2) charge-coupled device image sensor; (3) camera lens; (4) closed imaging box; (5) background board; (6) light source; (7) light source controller; (8) light filtering glass; (9) yarn motion driver; (10) system controller; (11) wire device; (12) tension controller; (13) monitor; (14) computer.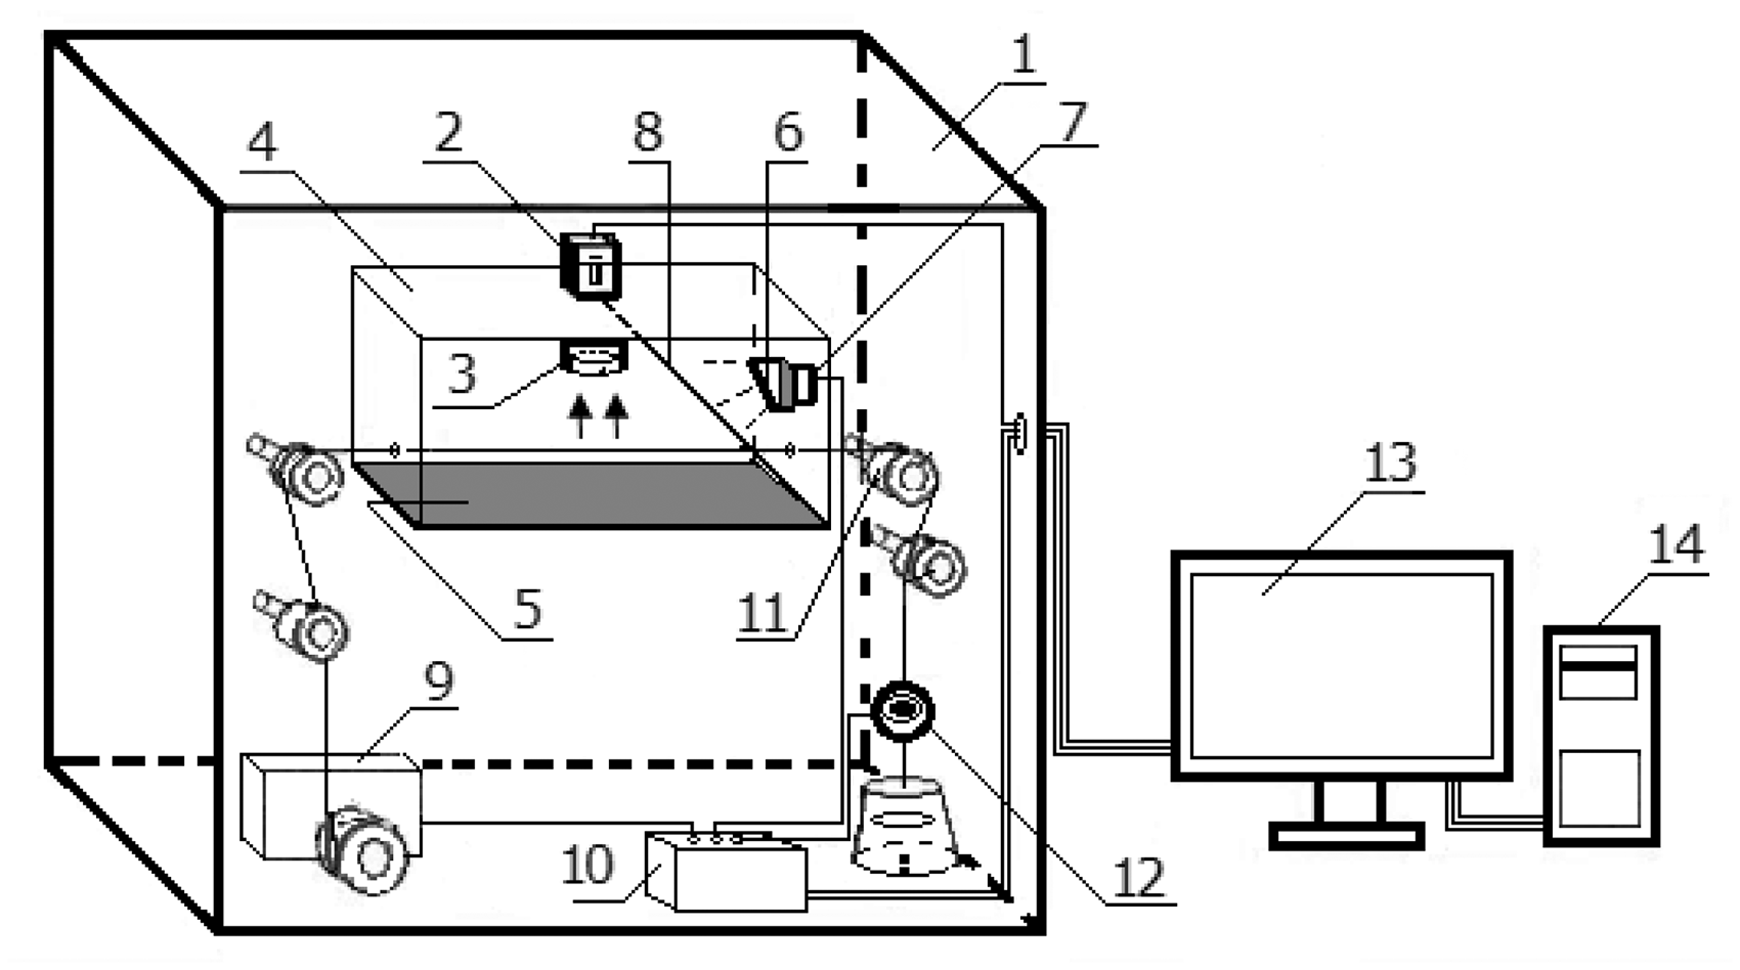
The yarn image acquisition system is mainly composed of three parts: the first part is the optical imaging system, including the charge-coupled device (CCD) image sensor, camera lens and light source, among which the CCD imaging sensor is controlled by the computer and is in charge of dynamic acquisition of the yarn image sequence. To minimize the influence of the outside, a shell with a half-box structure is adopted in which a closed imaging box is fixed. The yarn to be tested can get through the imaging box and one end of the yarn is connected to the yarn motion driver while the other end is connected to a tension controller through wire devices. The second part is the control system, including the yarn tension controller, wire devices and yarn motion driver. For the reason that the cross-section shape of the testing yarn can be different with the change of yarn tension, which can easily lead to discrepancy of testing results, we must make the yarn tension remain constant during the process of testing. The testing condition can be simulated by cooperation of the tension controller and motion driver under the control of the computer to meet the weaving condition of the yarn. The third part is the computer system and testing software. In the testing system, the computer is the control center and also the common platform for processing the image sequence, for measuring diameter and evaluating unevenness. By setting the parameters, the yarn tension and motion speed can be effectively controlled. Finally, the measurement of yarn diameter and unevenness evaluation can be realized automatically.
Image acquisition and preprocessing
The detection system is under control of a computer to realize sequence image acquisition, storage and processing. Before detection, all the yarns to be tested are numbered and the beginning positions are marked. Then the parameters, such as the interval distance between two consecutive testing points δ, are set. δ is an important parameter to decide the size of the sub-image that contains a testing point. In practice, the diameter of yarn can be affected by hairiness, cross-section shape and many other factors. In order to reduce the influence of random factors on testing results, the sub-image segmented from the yarn image is taken as the research object, in which the center point is the testing point and the yarn length is 2δ along the axis of the yarn. We take the average diameter of all the points of the axis within sub-image as the diameter of the testing point. At the same time, the tension force, the yarn motion speed and CCD acquisition speed are set. After that, yarns are sequentially installed on the testing system for measuring. When the testing yarn passes through the closed box at a certain speed, image sequences of the moving yarn are captured by the CCD and stored in a computer. All the images will be numbered in order after preprocessing.
In order to increase the accuracy of the yarn diameter measurement, image preprocessing is carried out to improve image quality. In this paper, preprocessing mainly consists of the following two steps: grayscale transformation and image filtering. The first step is easy to implement, by which the color images can be converted into gray ones. 26
The image noises are unavoidable due to the impact of the imaging environment and conditions. Hence it is necessary for the images to be filtered after grayscale transformation. Traditional average filtering and the median filtering algorithm can suppress salt and pepper noise, but details in the image are easily blurred. In this paper, an improved filtering algorithm – Average Combine Median Filtering Algorithm (ACMFA) has been adopted, which combines the average filtering and the median filtering. 27 Firstly, an improved average filtering algorithm has been used to wipe image noise. In this improved pixel disposal method, the gray value of the object pixel will be averaged only when the difference between its original value and the average value of its neighbor pixels is larger than a predefined threshold; otherwise, the value of this pixel point will not be changed. The employed algorithm maintains the sharpness of the images to the greatest extend when removing noise.
The conventional median filtering adopts the mid-gray value of pixels sorted in a filter window for a selected pixel, but the pixels in the window are not necessarily related to the selected pixel. Therefore, if a feature area in the image is too small, it is possible that no mid value exists within the filter window and this area is prone to be falsely filtered out. Similarly, to avoid losing details, we set a threshold before applying the median filter. So for a single pixel, its gray value will not be replaced by a median value if the difference with the median value falls within the threshold. The adopted algorithm is effective in filtering out the outliers caused by noises, because their gray values are prone to differing a lot from other surrounding pixels.
After filtering, we can enhance the yarn images to highlight the edge structure information of the yarn by using the generalizations of the histogram equalization method. Figure 2 shows the image preprocessing results.
Effects of the yarn image preprocessing.
Yarn noumenon section extraction and diameter measurement
In order to eliminate the influence of random factors and to improve the accuracy and stability of the testing results, we take the average diameter of all the points as the diameter of the testing point in the sub-image along the axial direction. The following method is used to extract the yarn body section of the sub-image. Firstly, the projection operation is implemented along the axial direction of the yarn, and then according to the characteristics of the gray projection curve, the sub-image is divided into the yarn noumenon section, suspected noumenon section and image background section based on the distribution character of gray-level projection. After that, the gray values of the pixels of the sub-image are divided into three intervals according to the bimodal distribution of the gray histogram and then the pixels of the suspected noumenon section are further classified according to its gray level and connectivity to the yarn noumenon section. In the end, the complete yarn body region image can be obtained precisely and quickly.
Figure 3(a) shows the sub-image segmented from the yarn image, including testing point O. As shown in Figure 3, the straight line SS' passes through testing point O and is perpendicular to the axis of the yarn. The yarn diameter of point O is considered as the average diameter of all the testing points of the straight line ZZ' whose length is 2δ and midpoint is testing point O. In this paper, the value of δ is usually 2–8 mm. By this method, the influence of many random factors, such as the yarn hairiness and the changes of cross-section shape resulted from yarn tension on the testing accuracy, can be reduced to a minimum. To accurately test the diameter of yarn points of line ZZ', the key is how to extract the yarn noumenon section from the sub-image according to the yarn appearance feature.
Preliminary division of the sub-image according to the projection curve.
In this paper, the first step is to project sub-image in the axial direction and then it is divided into the yarn noumenon section, suspected noumenon section and background section based on the characteristics of gray projection curves; the second step is to divide the grayscale of the sub-image into three intervals according to the background peak and yarn peak in the gray histogram, and then the suspected noumenon section will be further classified as the yarn noumenon section and the background section according to the constraint of both pixel gray level and connectivity to the real noumenon part. The proposed method can be explicated in Figures 3 and 4.
Schema of pixel processing of the suspected noumenon section.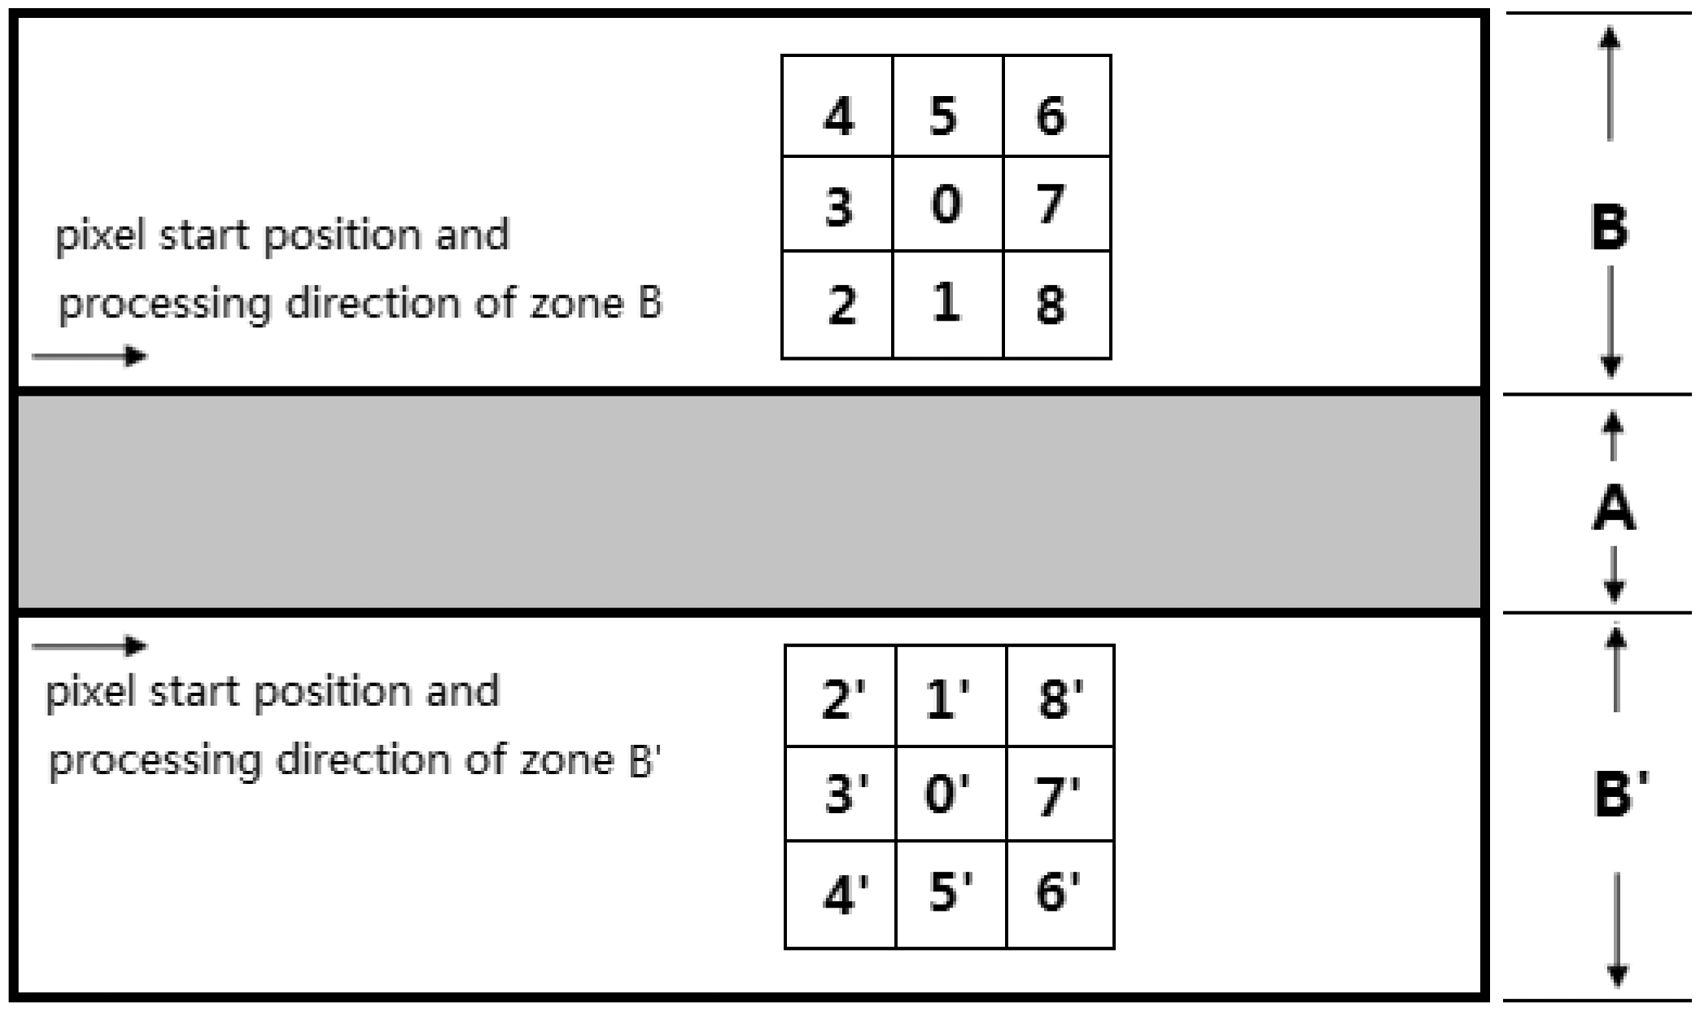
In Figure 3(a), the black part is regarded as background because the black color material is used as the background board in the imaging box, while the gray or white area is regarded as the yarn body section or transitional region from the yarn body section to background, which contains yarn hairiness, noises, etc. By projecting the sub-image in the axial direction as shown in Figure 3(b), it can be divided into five parts according to the projection curve, namely A, B, B', C and C', thereby the preliminary classification can be realized. The classification method can be described as follows: when the project curve is higher than 0.77 times (for different kinds of yarn, the threshold value can be obtained by experiments) of the curve peak, regard it as the yarn noumenon section notated by A. At the same time, we set its central line ZZ' as the axis of yarn; regions B and B' are on both sides of region A, which we can regard as the suspected noumenon section, whose project value locates between 0.15 and 0.77 times of the curve peak. In the two regions, the pixels are difficult to classify into the noumenon section or the background section because of the surface fuzz or the anomaly of the cross-section shape of the yarn, so the subsequent steps are needed to extract the noumenon body from regions B and B'. Outside of the suspected noumenon section, the project value of the curve is lower than 0.15 times of the curve peak; we call them regions C and C' and consider them as the background section.
In order to realize further pixel categorization of the suspected noumenon section, namely regions B and B', a new classifier is built to reduce the influence of yarn hairiness, fiber fines and noises. Design of the new classifier is based mainly on three constraint factors, namely pixel position, gray-level range and connectivity to the yarn noumenon section.
The gray level of the sub-image is firstly classified into three different areas according to the distribution characteristics of the histogram. Since the main part of the sub-image is yarn noumenon body and background, there will be two most significant peaks in the histogram of the sub-image; one is a yarn noumenon grayscale cluster and the other is a background grayscale cluster. So the pixels of the sub-image can be divided into three areas according to the two positions of the curve peaks: one is notated as area S in which the pixel grayscale is from 0 to the position in which the pixel level dropped by 10% of the background peak on the right-hand side of the image histogram curve. The second area is notated as T, in which the pixel level is between 255 and the position where the pixel level dropped by 10% of the yarn body peak on the left-hand side of the image histogram curve. The area M is between section S and section T. Figure 5 shows the pixel classification approach.
Schema of the pixel classification approach.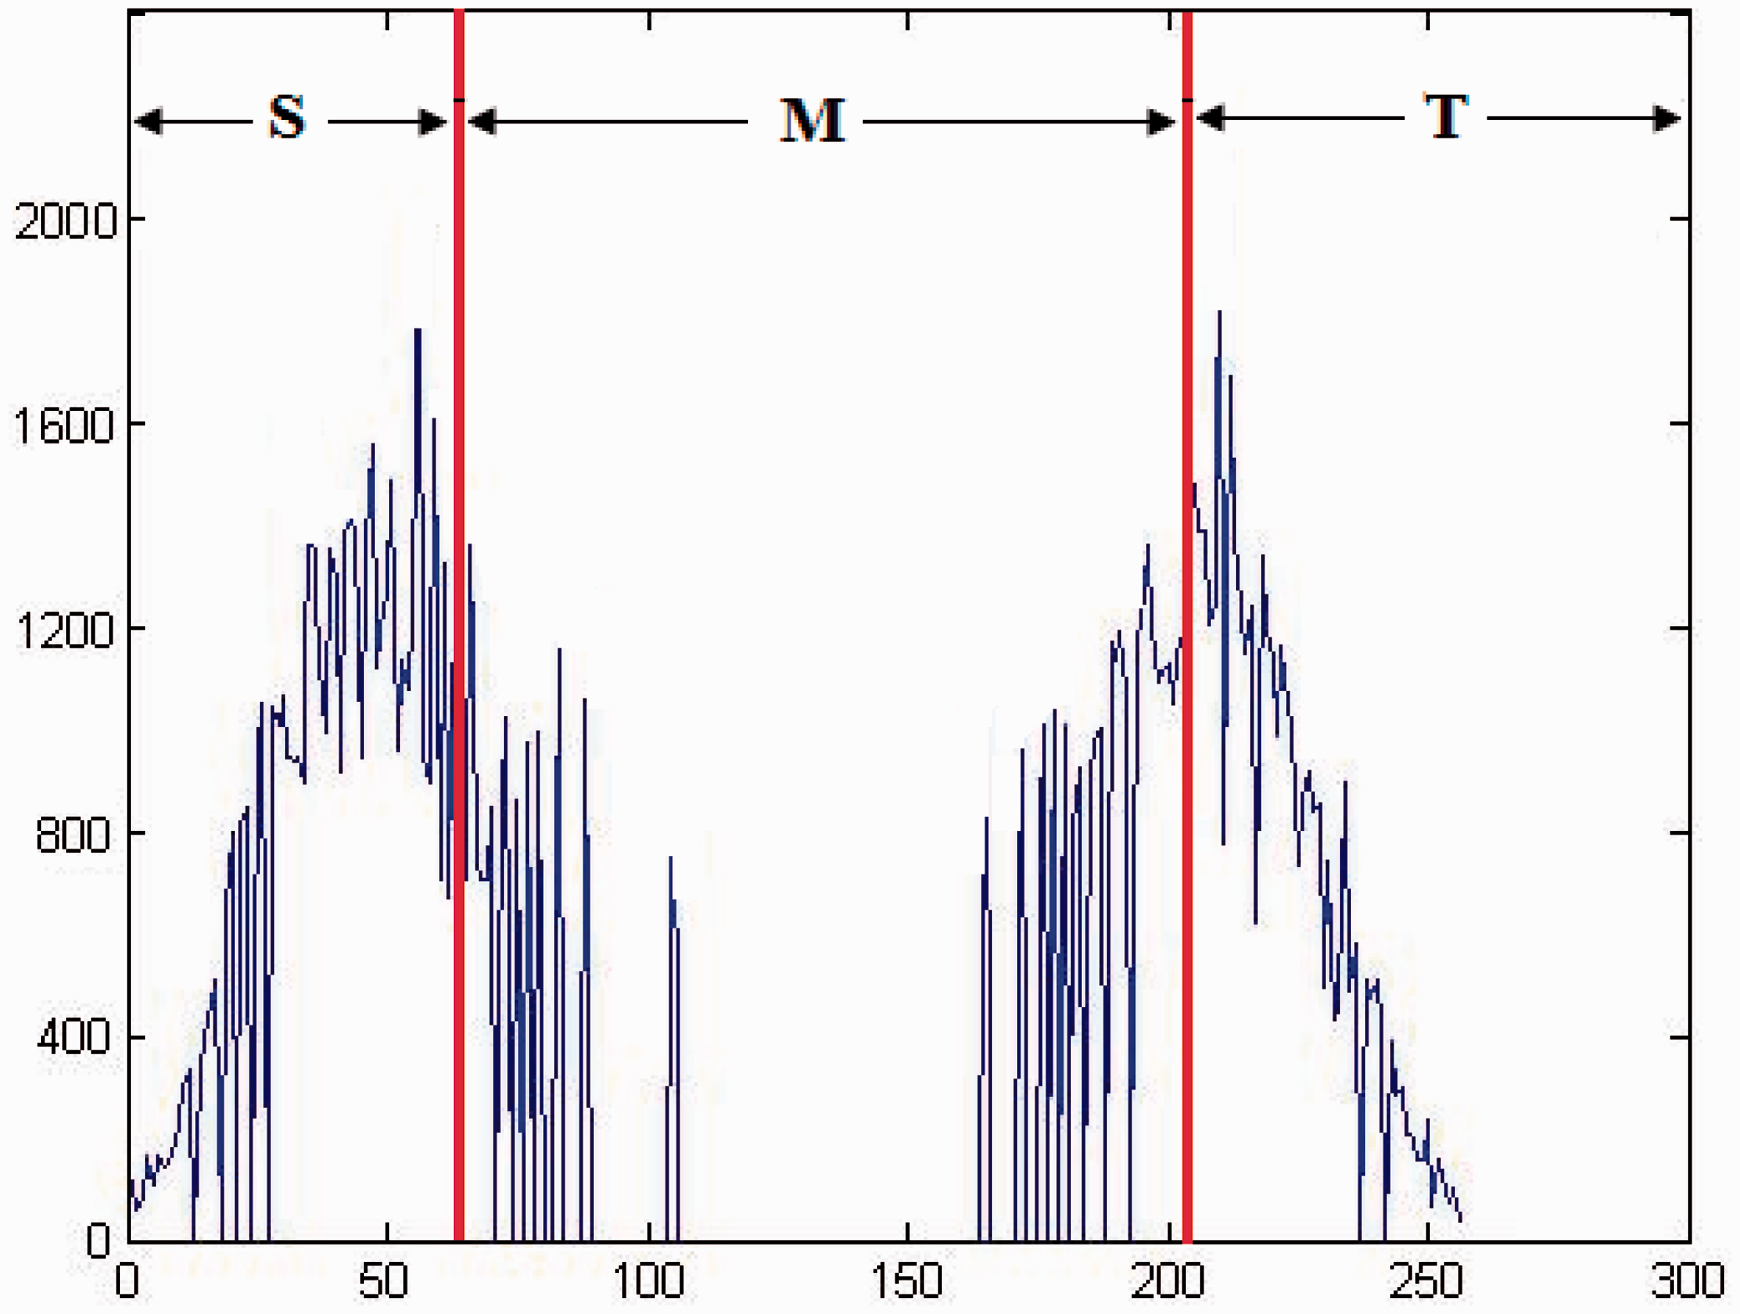
To realize further pixel classification of regions B and B', two main factors are included: one factor is image processing order. The processing of region B starts from the bottom line next to area A, line by line from bottom to top and left to right in each line; in contrast, the processing of region B' starts from the top line adjacent to area A, line by line from top to bottom and left to right in each line. Figure 4 shows the processing order. The main reason for using this order is because of the connectivity between the target pixel and the noumenon section. The other factor is the pixel processing method. We take the pixel 0 (in region B) as an example to indicate how the classifier works.
Assume pixel 0 is the object pixel. If its gray value locates in section T and it is connected to the noumenon section (in other words, pixel 1 is adjoining to section A), then we consider pixel 0 belongs to the noumenon section. If the gray value of pixel 0 locates in section S, then it belongs to background. If the gray value of pixel 0 locates in section M, there will be two cases: if the adjacent pixel (pixel 1 in region B) in the yarn noumenon direction is not adjoining to the noumenon section, we consider it as background; if pixel 1 in region B is adjoining to the noumenon section, then we need to further study the pixels in the bottom left and bottom right direction of pixel 0 (namely pixel 2 and pixel 8), as long as at least one pixel is adjoining to the noumenon section, we regard pixel 0 as noumenon pixel, otherwise, it is still considered as background.
All the pixels in regions B and B' are processed by the above proposed method and the complete yarn noumenon section of the test yarn sub-image can be extracted; Figure 6 has shown the extraction results of the yarn body. Once the effective extraction of the body image of yarn is completed, then we can get the yarn diameter of each pixel point of the axis line ZZ' by counting the number of pixels of the straight line that passes through the pixel point and is perpendicular to the axis line ZZ' within the yarn noumenon section. The average diameter of all points of the axis line ZZ' is considered as the final diameter value of the yarn testing point O.
Extraction of the yarn noumenon section.
Yarn diameter batch processing and unevenness evaluation
Method of yarn diameter measurement batch processing
For rapid implementation of large sample statistics and unevenness analysis of the yarn diameter, this paper proposed a new method that uses an address mapping table to realize fast addressing of all testing points in the image sequence. The batch processing method can make contributions to automatic measurement of yarn diameter and unevenness analysis.
Before testing the yarn, some preparatory work must be done, such as numbering the test yarns, marking the starting point and setting the interval distance between two neighboring testing points as well as testing parameters δ, etc. Parameter δ is the width of the neighborhood of testing points in an axial line, which decide the size of the sub-image. The variation of external testing conditions may lead to changes in the stress and strain forces acting on the testing yarn at different positions (longitudinal and transverse). These changes may lead to irregular yarn shapes. In addition, yarn hairiness is randomly distributed around the yarn body. All of these can bring about the instability of the testing results. In order to reduce the impact of random factors on the testing results of yarn diameter, we take the average diameter of all the pixel points of the axis line within the range of 2δ as the diameter of the testing point. Before the testing, we use the 10 μm calibration template to calibrate the CCD imaging system and then calculate the corresponding physical size of image pixels. At the same time, the tension force, the yarn motion speed and the image acquisition speed of the CCD are set up according to the testing requirement. When testing yarn passes through the closed imaging box at a certain speed, the CCD imaging system will continuously capture the image sequences of the moving yarn and store them in a computer until all the image collection of one piece of yarn is complete.
In order to realize large sample statistics and analysis of the diameters of the yarn testing sample, a large number of points need to be tested and the data processing is pretty heavy work. The method using static measuring is unable to meet the needs of actual production. Artificial perception and manual measurement can bring about differences due to inconsistent measurement standards, which can lead to measurement error and lower efficiency and do not satisfy the requirement of textile industry production or scientific research. This paper puts forward a batch processing method for the yarn image sequence that can realize fast large sample statistics and unevenness analysis by measuring the diameters of all preset points of the testing sample.
Firstly, all images in the image sequence of a piece of yarn are numbered and then the corresponding frame numbers and locations in the image of all the testing points are determined in order according to the preset parameters. If the sub-image containing testing points with 2δ in width could not get in one frame, we needed to stitch the two adjacent frames as one new big frame and assign a number to the new frame based on its order in the image sequence, and then all the subsequent frames should be renumbered sequentially. The whole image sequence is processed by the method mentioned above to ensure the sub-image with 2δ width can be segmented within a frame image. Finally, the computer will generate an address mapping table that is based on the image number and location of the testing points in the corresponding image.
The address mapping table of all testing points is made up of a two-dimensional array that can be created as follows: firstly, the number of testing point notated N is calculated according to the preset parameters, and then a two-dimensional array whose length is N + 1 is predefined. The two-dimensional address of testing points, which is composed of frame number and the coordinate position in the corresponding image, can be stored in the array, in which the subscript of the array element represents the sequence number of the testing point. For example, if the subscript is 0, the corresponding element will be used for storing the address of the first testing point; if the subscript is 1, the corresponding element is used for storing the address of the second one. Similarly, the corresponding element whose subscript is N − 1 will be used for storing the address of the Nth testing point. The reason why we design the largest array length as N + 1 is that we will store the ending mark $ in order that the computer can recognize that the testing point processing is complete. For the two-dimensional array there are two domains in each element: the frame number is stored in the X domain and the coordinate position in the corresponding image is stored in the Y domain. Figure 7 shows the structure of the address mapping table. Fast addressing of all the testing points in image sequence can be realized with the two-dimensional array.
Structure diagram of the address mapping table.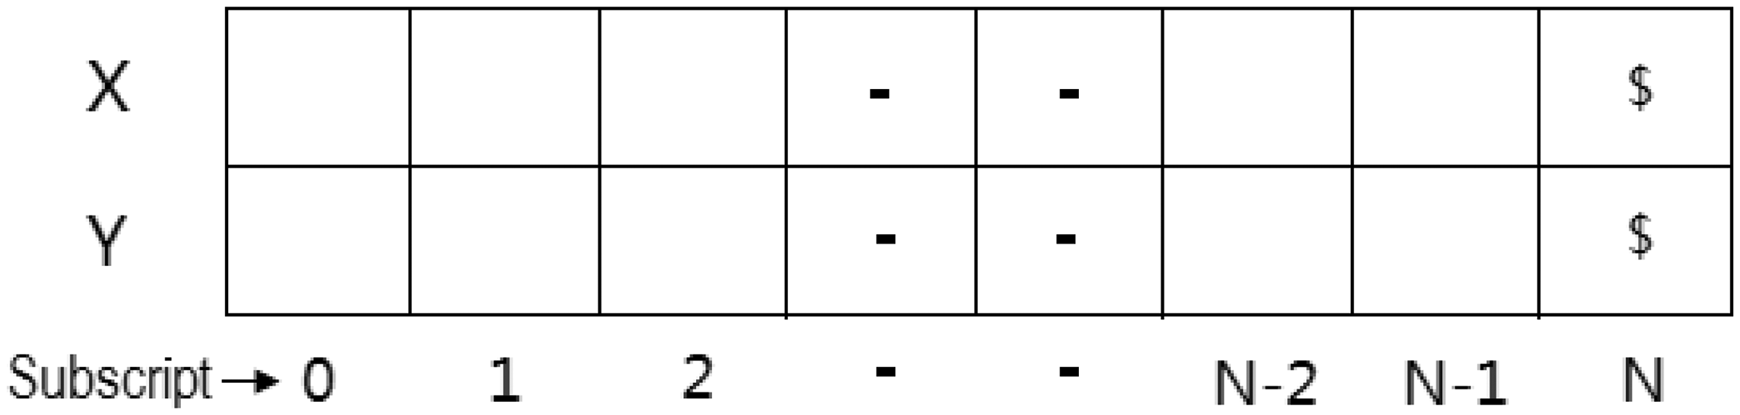
Analysis method of yarn unevenness
After all the steps above, the obtained diameters of all testing points of the yarn can be regarded as regular interval sampling results (both in space and time). Because the yarn shape information is acquired by dynamically collecting the image sequence of the moving testing yarn, the batch processing technology can be used by the time series to realize large sample statistics and unevenness analysis. In this paper, the key point of batch processing technology is how to realize fast analysis of yarn unevenness based on the image sequence of moving yarn in a statistical way. The unevenness of yarn is the nonuniformity of the cross-section along the yarn axis or inconsistency of the yarn diameters of different testing points, and it can also indicate the change of fiber number of each cross-section or the change of weight of per unit length of yarn; the main evaluation indexes are as follows.
U (absolute mean deviation)
The absolute mean deviation is the term to define the mass irregularity of yarns or the irregularity in diameter as well. It can be calculated using the following formula:

In which x
i
is the diameter of the ith testing point,
CV (coefficient of variation)
As we know, the coefficient of variation is also called coefficient of dispersion, which is the percentage of mean square error of some values; it can be calculated by the following calculation (2). CV reflects the discrete degree of yarn diameter in unit length.
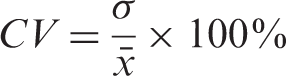
In (2), σ can be calculated by (3):

Ρ (coefficient of range)
Ρ is the percentage of difference between the minimum and maximum (also known as range R) to the average value of x. It can be calculated using the following formula:

Experiments and analysis
Yarn detection experiment
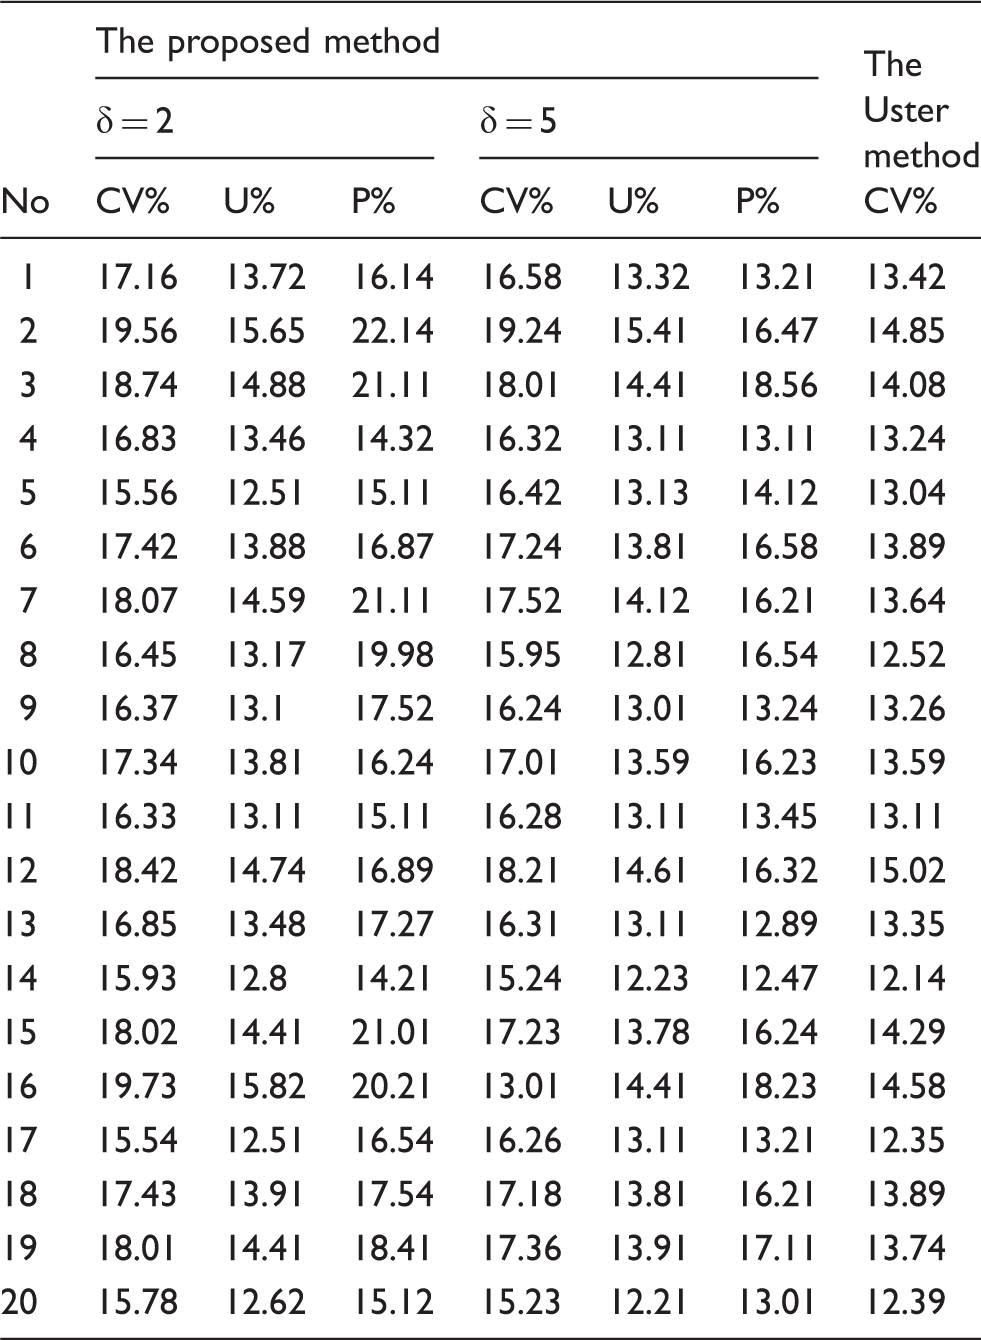
Test data from different testing methods and parameters
Analysis and discussion of the testing results
The influence of parameter δ on the testing results
Parameter δ is the valid distance on both sides of testing points in the axial direction and it is an important parameter that determines the size of the sub-image segmented from captured image. In this paper, we take the average diameter of all pixel points of the yarn axial line with 2δ length as the diameter of the testing point. In order to study the influence of δ on the testing results, we use two parameters δ = 2 mm and δ = 5 mm for the same kind of yarn sample. According to the acquired testing data, we can know that when δ = 2 mm, the average coefficient of variation CVa2 is 17.27%, the average value of the absolute mean deviation Ua2 is 13.82% and the maximum value of coefficient of range Pmax2 is 22.14%. When δ = 5 mm, these three values become CVa5 = 16.89%, Ua5 = 3.51% and Pmax5 = 18.56%. We know that parameter δ decides the size of the sub-image. The larger δ is, the more points in the neighborhood region will be involved in calculating and the error caused by the random factor will be smaller. Similarly, the smaller δ is, the fewer points will be involved. As a result, the random error will be larger. It can be noticed that CVa2 > CVa5, Ua2 > Ua5, which is a proof of the above conclusion. From the testing principle of the proposed method, we know that the larger δ is, the smaller the coefficient of range is. Figure 8 shows the curve from different parameters δ, which also reflects that the experimental values are consistent with the theoretical values.
Curves of the coefficient of range coming from different parameters.
Comparison of results obtained from two different methods
In order to validate the effectiveness of the evaluation method of yarn unevenness proposed in this paper, we use the Uster Tester 5 and the proposed method to test and evaluate the diameter variation coefficient CV of the same kind of yarn. The testing result is shown in Table 1. Differences between the two methods can be seen from Table 1. The values of CV obtained from the proposed method are generally greater than those obtained from the Uster Tester 5, but two curves of CV have the same ascend and descend trend. In order to give better analysis of the quantitative relationship between the testing results from the two different methods, the result of the proposed method is notated by X when δ = 2 mm and the result from the Uster Tester 5 is notated by Y. The average values of both X and Y are calculated by the mathematical statistics method and notated as X a and Y a , respectively. The standard deviation is notated by S x and S y . The covariance is C ov (X,Y) and the correlation coefficient is C orr (X,Y). Then we evaluate the analytical method of yarn unevenness proposed in this paper.
There are some results of these two methods working on the same kind of yarn. The mean value X a obtained by the proposed method is 17.282% and the standard deviation S x is 1.224, while mean value Y a obtained from the Uster Tester is 13.519%, and the standard deviation S y is 0.8994; the covariance C ov (X,Y) coming from these two methods is 0.944 and the correlation coefficient C orr (X,Y) is 0.844. We can see that the mean value of the proposed method is larger than that of the Uster Tester by 4.301%. In fact, the main reason for this is that the two testing methods use different measuring principles. The CV value obtained from the Uster Tester reflects the variation of the yarn volume or yarn mass while the CV value obtained by the proposed method shows the variation of external visual shape of yarn. The unevenness we get from the Uster Tester belongs to a certain length of yarn, while in the proposed method we can get diameter variation at every testing point using the CCD imaging system. So the CV value we get from the proposed method is larger than that from Uster Tester.
Paying attention to the covariance and correlation coefficient, it is noted that they have roughly the same ascend and descend trend and there is a linear relationship between them to some extent. The correlation coefficient is 0.844. The polygonal lines in Figure 9 give a clearer expression of the correlation relationship. It is easy to find that the blue line and the red one have definite correlations. So it is reasonable to assume that the CV value obtained by the proposed method can also be used to evaluate yarn unevenness because the testing results obtained from the proposed method and the Uster Tester have the same trends and only have numerical differences. So the method proposed in this paper can be used to evaluate yarn unevenness from another view point.
Curve of CV value from different methods. (Color online only.)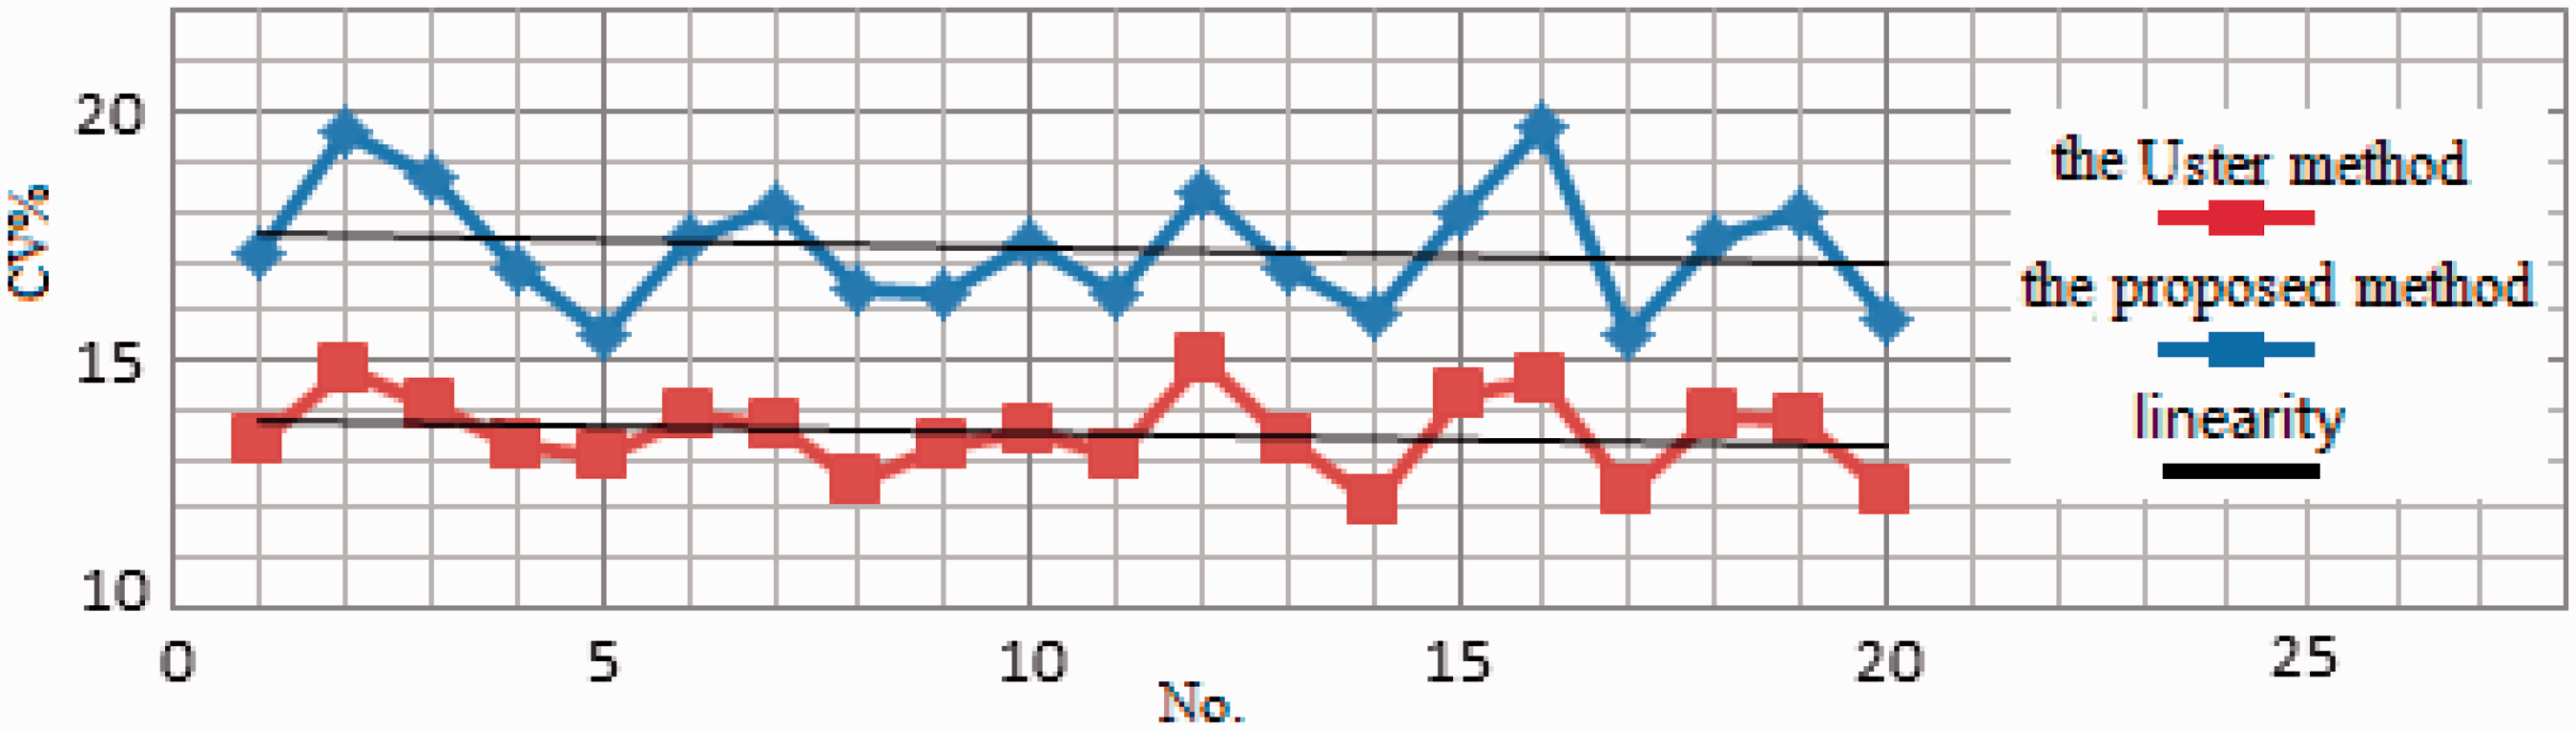
After the analysis above, we can draw the following conclusion: both of the methods can be used to evaluate the unevenness of yarn; the different results come from the different measuring principles. In fact, the results come from the Uster Tester cover up the appearances of yarn, while the results from the proposed method can directly reflect the variance of yarn diameter.
Conclusions
Modern textile enterprises call for large sample statistics and unevenness analysis on yarn diameters. Due to the inherent characteristics of both yarn and other textile materials, such as differences in diameter, irregularity in cross-section shape and difficult in separating the hairiness from the noumenon section, it is a challenging work to accurately evaluate unevenness. In fact, the static testing method by manual operation using a microscope to evaluate unevenness involves a labor-intensive task with mass data processing and requires sophisticated equipment and trained technicians. So it cannot satisfy the requirements of modern production or scientific research. Using computer vision and image processing technology, we can realize automatic batch processing on the obtained yarn image sequence and then complete the unevenness analysis of the specified length of yarn. Through the comparison of the testing results obtained from the Uster instrument and proposed method respectively, a correlation between both methods has been suggested, which can be proof that the proposed method can be used to appraise the unevenness of yarn diameter. Meanwhile, CV values of the proposed method are usually larger than those obtained by the Uster Tester, which can be explained by their different testing principles.
Footnotes
Funding
This work was supported by the National Natural Science Foundation of China (No.11275047).