
Abstract
The accurate and precise measurement of cotton maturity and fineness is often difficult, laborious, and/or expensive to perform. The Cottonscope® rapidly, accurately, and precisely measures fiber maturity and fineness with small quantities of sample (approximately 50 mg). Interest has been expressed in the use of different sample weights of fiber, especially lower sample weights by geneticists. A program was implemented to establish the capabilities of the Cottonscope to rapidly and accurately measure maturity (maturity ratio (MR), original polarized light microscopy maturity ratio (MRBF)), fineness, and ribbon width with different sample weights of fiber. The change in sample weight significantly impacted the Cottonscope results for MR, fineness, and ribbon width. Fineness was most impacted by varied sample weight. The impacts of sample weights on the cotton results were removed by re-calibrating the instrument at each sample weight. Decreasing the sample weight below 50 mg increased sample measurement times, especially at 10 mg sample weight. These results demonstrated that the Cottonscope can accurately and precisely measure the fiber’s maturity, fineness, and ribbon width with cotton fiber samples as small as 10 mg.
Maturity and fineness (or linear density) are two important, but not routinely measured, cotton fiber quality indices that can have a significant impact on the fiber ginning, downstream textile processing, and fabric quality.1–5 Maturity is the degree of fiber thickening (Θ), or secondary cell wall development, and is represented in Equation (1) as


Because the measurement of cotton maturity and fineness is often difficult, laborious, or expensive to perform, fiber maturity and fineness are not routinely measured or used by industry. Fiber micronaire, which is dependent on the fiber’s maturity and fineness, is often used as a surrogate for fiber maturity and fineness.1,5,8–11 Micronaire is the fiber’s resistance to air flow per unit mass. The relationship between fiber maturity and fineness and micronaire is quadratic in nature and can be expressed as


NIR: near infrared; FT-IR: Fourier transform infrared.
Much interest has been expressed internationally for direct measurements of fiber maturity and fineness that are not only rapid, accurate, and precise but that are also more cost effective, easy to use, require minimum sample preparation and handling and no chemicals, able to be utilized in non-standard conditioned environments, and do not require highly trained personnel to perform the measurements. A recent instrument that meets these operational and technical needs is the Cottonscope® (Cottonscope Pty Ltd, Perth, Australia), which measures the fiber’s maturity, fineness, and ribbon width (RW; as well as maturity and RW distribution) simultaneously using image analysis and polarized light microscopy on longitudinal fiber snippets.20–22 The Cottonscope is a modified combination of the Siromat™ (maturity by polarized light microscopy)17,18 and Cottonscan™ (linear density of weighed fiber by image analysis)6,19 instruments [Commonwealth Scientific and Industrial Research Organisation (CSIRO), Australia]. The components of the Cottonscope system are a fiber cutter, the Cottonscope, and a computer (Figure 1). The method consists of cutting the fiber sample into short fiber snippets or sections (with cutting gauge length of approximately 1 mm), weighing the cut sample, and adding the weighted sample to a water bowl (water medium for transport and measurement). The fiber–water mixture is stirred to transport the fibers under a submerged, water-tight lens tube connected to a color digital camera for polarized light microscopy and image analysis of the weighed snippets. Maturity is measured by polarized light microscopy, and fineness/linear density and RW are determined from the total length and width of a specified number of snippets. Standard operation consists of a 50 mg sample weight and measurement of 20,000 snippets, and the analysis time for each measurement is normally 30–40 seconds.
Cottonscope system (laptop computer, Cottonscope instrument with digital color camera/water bowl/water reservoir, and fiber cutter).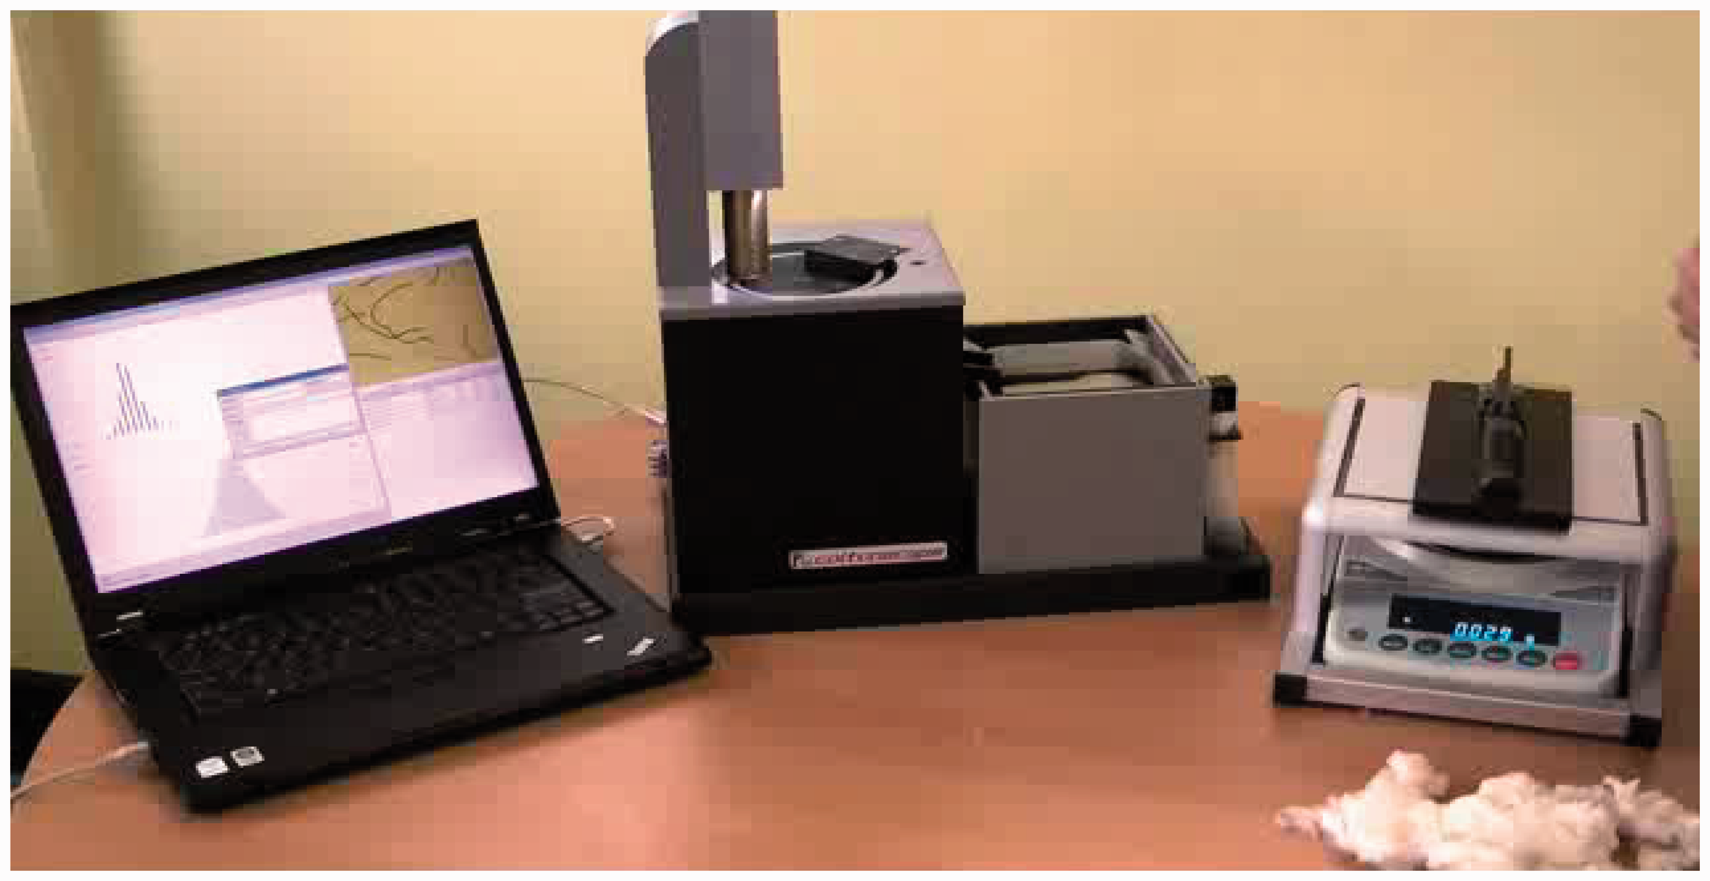
Previous evaluations have, on both routine lint and breeder variety samples, demonstrated the versatility and capabilities of the technique for fiber maturity and fineness measurements and established the Cottonscope as a rapid, accurate, precise, and user-friendly fiber quality assessment technique.22–26 For routine ginned cotton lint samples, very good method agreement was observed between the Cottonscope and the reference IAM and Advanced Fiber Information System (AFIS) maturity and fineness results and HVI™ micronaire, often with over 90% of the samples meeting or exceeding the method agreement criteria. It was shown that the Cottonscope and IAM were significantly more responsive to maturity and fineness differences between samples and more responsive to fiber development compared to the AFIS (by a factor of approximately 2). The impacts of bleach use and environmental conditions (different temperature-relative humidity (RH) conditions can yield different fiber moisture levels) on the Cottonscope maturity and fineness results were examined; the only major impact on the Cottonscope results was varying environmental conditions impacting fineness results. Methods were identified to minimize the impact of environmental conditions on fineness results. In addition, the Cottonscope was shown to be an efficient instrument for cotton breeders to monitor maturity and fineness for developing and mature fibers.
As noted above, the Cottonscope’s precision and accuracy and basic comparisons to other instruments and methods have been established. The impacts of operational and instrumental variables/parameters on the Cottonscope results are required in order to establish the full utilization and practical application of the measurement method. Recently, interest had been shown by several groups (breeders, postharvest processors, geneticists, etc.) in the Cottonscope’s versatility and ability to use both greater than and less than the standard 50 mg sample weight. Some breeders and postharvest processors wished to know if using a higher sample weight (e.g., above 50 mg) would result in a more representative measurement and different maturity and fineness results. Other breeders and geneticists were interested in the opposite—they had very small quantities of fiber sample and wished to know if using lower sample weights was feasible and its impact on the maturity and fineness results. In each case, the main question was—what impact would the non-standard sample weight have on the Cottonscope results, especially maturity and fineness (the two primary quality terms of interest)? In addition, since the speed of the analysis is also of critical interest, what impact would the different sample weights have on the speed of the Cottonscope measurement? Recent modifications and improvements have been made to the Cottonscope hardware and software, to include the use of two MR parameters—MRBF (original polarized light microscopy MR) and a new MR value calculated using a vendor supplied algorithm. MRBF is the maturity result using polarized light microscopy; MR is the MRBF result normalized by RW (improved agreement to cross-sectional image analysis maturity). The standard Cottonscope method utilizes a sample weight of approximately 50 mg and counts (measures) a minimum of 20,000 fibers (fiber count) during a measurement. A joint program between the USDA’s Agricultural Research Service (ARS) and CSIRO researchers was implemented to (1) establish the potential and capabilities of the Cottonscope to rapidly and accurately measure maturity, fineness, and RW with different sample weights of fiber and to (2) examine the impacts of the use of different sample weights on the Cottonscope MR, MRBF, fineness, and RW results and analysis time. All measurements were performed at the ARS’s Southern Regional Research Center (USDA-ARS-SRRC).
Experimental details
Cotton samples
Cotton sample descriptive statistics (n = 5 samples)

MR: maturity ratio.
Cottonscope measurements
The Cottonscope measurement has been described previously.20–22,27 Cottonscope software version 1.54 was used. Standard manufacturer-recommended calibration and operational procedures were used (except for the varying sample weight and varying fiber count or number of measured fiber snippets). For both calibration and routine fiber samples, the fiber sample was randomly selected from the total sample, aligned by hand, placed onto a guillotine/knife fiber cutter, and cut to obtain approximately 1 mm fiber snippets for the Cottonscope measurement. The cut fiber was placed into the Cottonscope water bowl that contained approximately 125 g of water (in which the water is agitated), and the measurement started. The agitated water separates the fiber snippets, and the snippets are counted and measured as they pass under the instruments’ camera system. Total sample analysis time for the Cottonscope measurement (sample preparation, cutting, analysis) is normally 7 ± 1 minute per sample (six measurements per sample). Per the manufacturer’s recommendations, the standard Cottonscope method utilizes a 50 mg cut fiber sample and 20,000 fiber/snippet count. Typically, the Cottonscope is calibrated at 50 mg sample weight and 20,000 fiber count using manufacturer-supplied calibration procedures and manufacturer-supplied fiber samples with wide maturity, fineness, and RW ranges (0.60–0.89 MR, 136.1–268.4 mtex fineness, 13.0–27.5 micron RW). In the calibration procedure and software option, the same analysis procedures used in the measurement of the routine samples are followed (fiber cutting, weighing, image analysis), except the standard value for each calibration cotton is entered. Linear equations for MR, MRBF, fineness, and RW are obtained. Total analysis time for calibration is under 2 hours. The Cottonscope need only be re-calibrated at the 50 mg sample weight when periodic checks of fiber standards indicate large movements in MR, MRBF, fineness, and/or RW (normally, approximately every six months or longer).
The fiber cutter was used to cut and prepare each loading/cutting, and each loading was weighed to the target ±1.0 mg (four decimal places were recorded and inputted to the instrument for calculation results). A total of six measurements were made for each sample (n = 6), consisting of three sub-sample loadings/cuttings, each run in duplicate. For the measurements made in this series of evaluations, at the specified fiber count, the measurement was stopped, and the Cottonscope results (MR, MRBF, fineness, RW) and analysis time for the six measurements recorded. All samples were conditioned for a minimum of 24 hours prior to measurements and measured at standard conditions of 21 ± 1℃ temperature and 65 ± 2% RH. For the fiber weight impact evaluations, the Cottonscope calibration at standard conditions (50 mg fiber weight) was used for these measurements. Measurements were made at each sample weight (10, 30, 50, 70, 90 mg), and the Cottonscope results at each sample weight compared.
Once the deviations with sample weight were observed for the Cottonscope parameters, the Cottonscope instrument was re-calibrated at each non-standard sample weight (10, 30, 70, 90 mg), and each sample re-run at each sample weight-specific calibration condition (e.g., 10 mg sample weights run on the 10 mg calibration, 90 mg sample weights run on the 90 mg calibration) in order to determine the potential to minimize any observed impacts of fiber weight on the Cottonscope results. For the Validation Set samples, Cottonscope measurements were performed on the 21 cotton samples from 10 to 90 mg in 20 mg increments, both with the standard 50 mg calibrations and the sample weight-specific calibrations.
The fiber count was examined in order to discern the potential minimum number of snippets required for stable Cottonscope results and as a means to reduce analysis time. Three of the above samples (GM-39, 34914, DM-9) were measured in 5000 count increments from 5000 to 20,000 fiber counts for each sample weight condition. The standard calibration (50 mg sample weight) was used for all fiber count measurements.
The Cottonscope results compared at each sample weight and fiber count were MR, MRBF, fineness, and RW. The primary comparison statistics were R2; mean, standard deviation, and % coefficient of variation (%CV) for each sample at each condition, and the slope of each condition for each sample. Additional statistical analyses were performed with Excel Analysis ToolPak.
Results and discussion
Impact of sample fiber weight
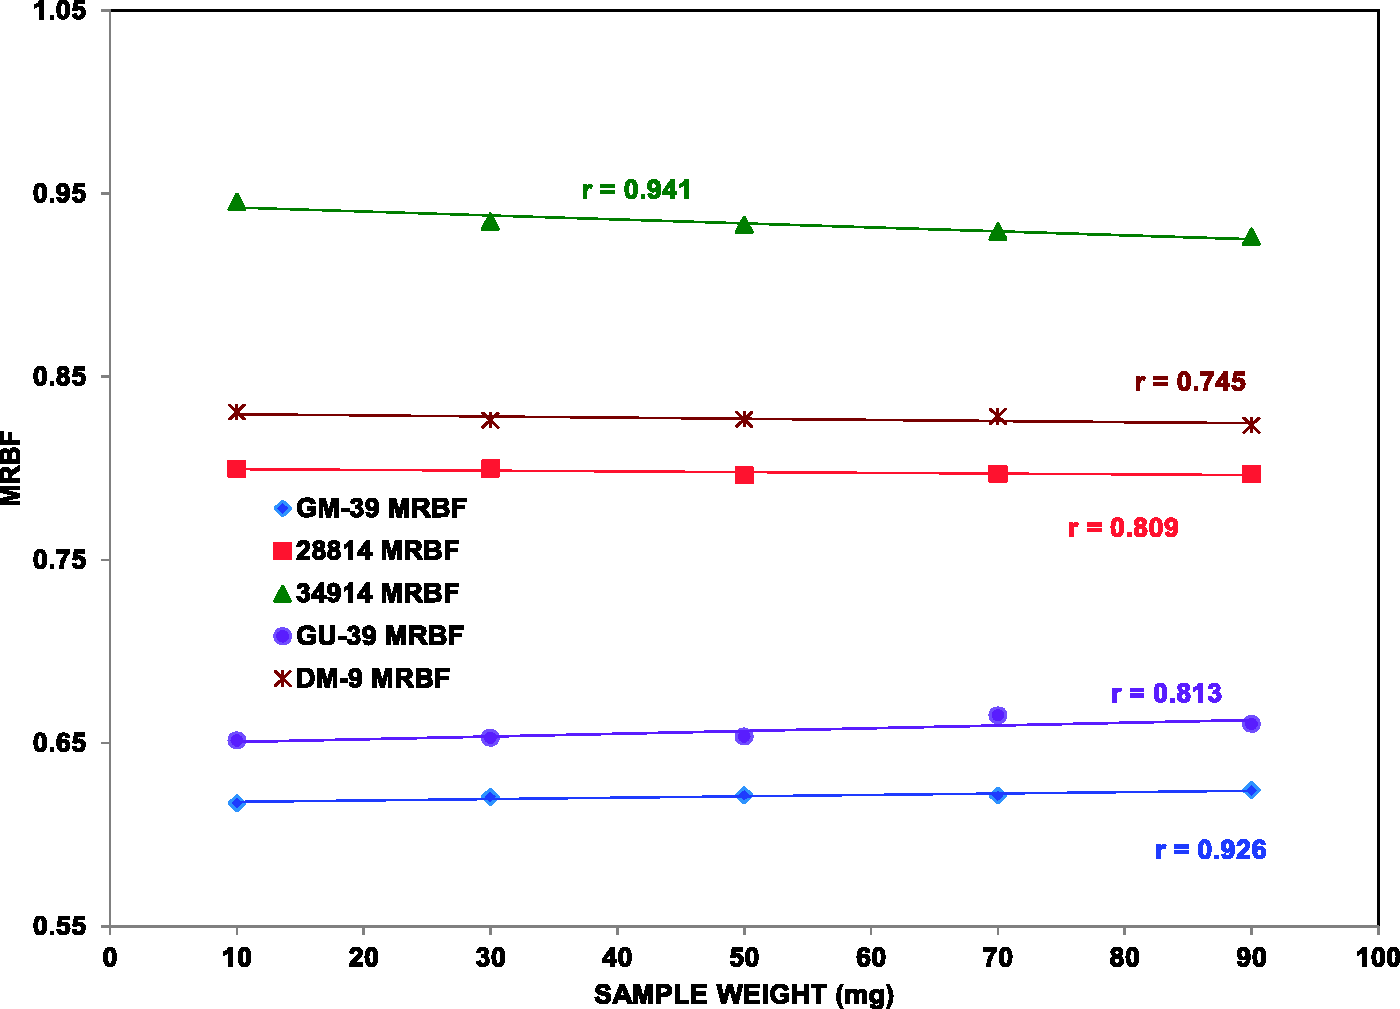
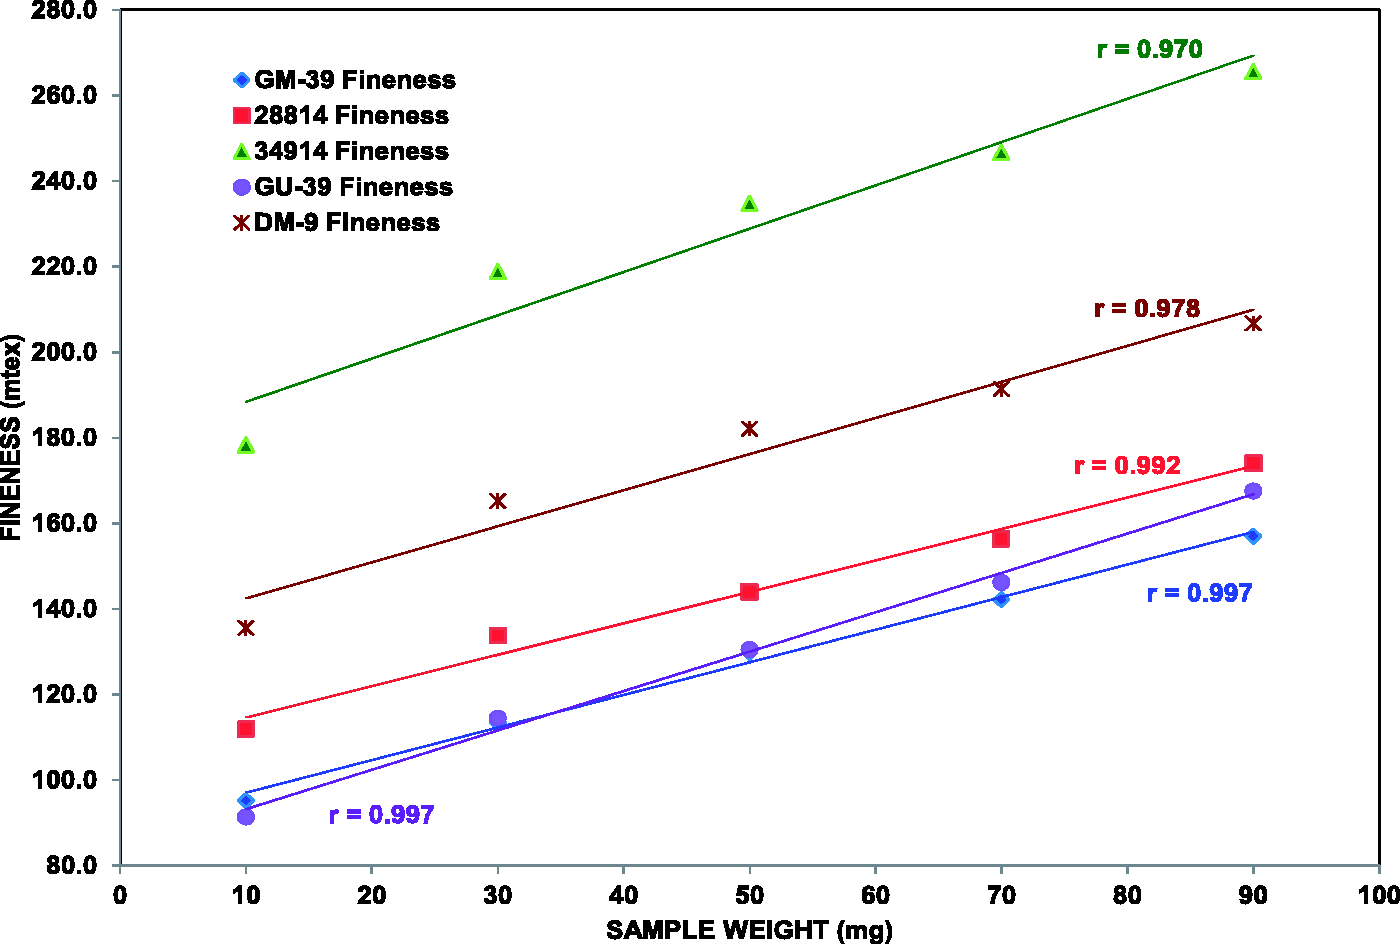
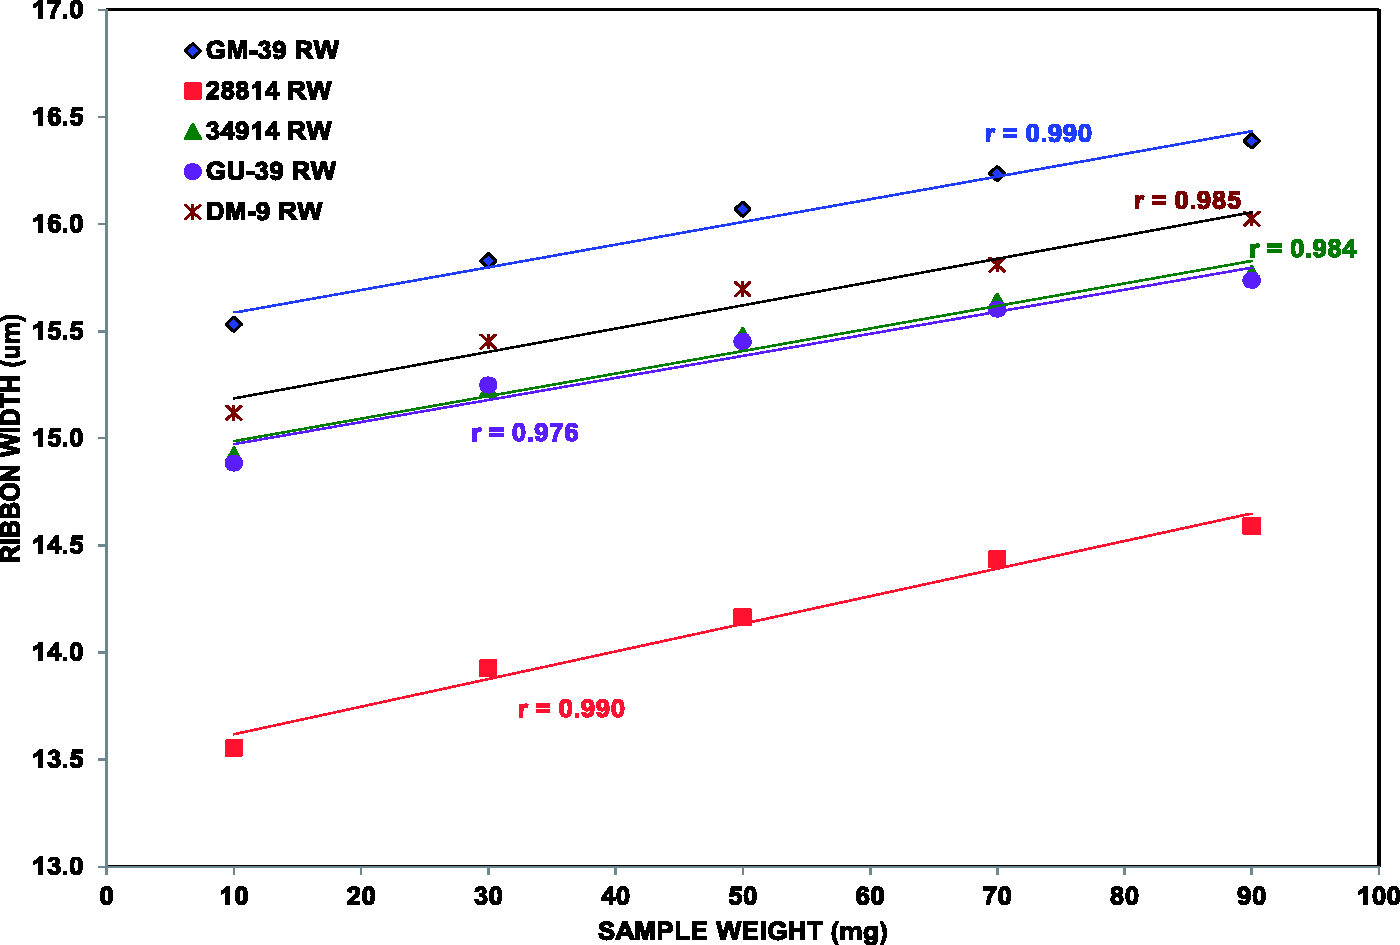
The results are presented in Tables 3 (average of five samples) and 4 (individual samples) and Figures 2–5. Readily discernible and statistically significant changes in MR, fineness, and RW as a function of sample mass were observed, with by far the main impact being on fineness. As expected, MRBF was minimally impacted by sample weight changes (slope not significantly different from zero), as it is determined by polarized light microscopy only. The MR decreased with increasing sample weight, and the slopes for the five samples were very similar and very small (<0.002 range). Although the observed increases in MR were small, they were discernible with the slope of the best fit lines in Table 4 being statistically significantly different from zero (with one minor exception) and with a %CV of 4.9%. For RW, a slight but also statistically significant increase in RW with increasing sample weight was observed (slopes significantly different from zero), and the %CV was small at 2.3%. The present MR algorithm includes RW [MR proportional to (1/RW)]. The RW increases with increasing sample weight; MR would be expected to exhibit a decrease with increasing sample weight due to the increase in RW with increasing sample weight, and this was indeed observed. Thus, the RW impact is what is impacting MR. For fineness, the slopes for the samples were also very similar but large (0.9 ± 0.2 range), indicating a similar response and larger and also statistically significant effect of sample weight on the absolute fineness response regardless of the fineness level. The fineness results were the most impacted by varying sample weight, exhibiting the largest and statically significant slopes (and only slopes approaching unity) and highest %CV (17.0%).
Impact of loading sample weight on Cottonscope maturity ratio (MR), 10–90 mg sample weight. Impact of loading sample weight on Cottonscope original polarized light MRBF, 10–90 mg sample weight. Impact of loading sample weight on Cottonscope fineness, 10–90 mg sample weight. Impact of loading sample weight on Cottonscope ribbon width (RW), 10–90 mg sample weight. Sample weight impact on Cottonscope maturity ratio (MR), original polarized light MRBF, fineness, and ribbon width; 10–90 mg sample weights, averages RW: ribbon width

Measurement analysis time evaluations were performed for six measurements per sample (three cuttings/loadings measured in duplicate) at each fiber sample weight (10–90 mg). The results are presented in Table 5 and Figure 6. Increasing the sample weight >50 mg had minimal impact on the sample analysis time (no overall decrease), with a range of only 0.6 minutes in average analysis time and similar standard deviation (approximately 0.5 minutes) for the five samples from 50–90 mg sample weights. Sufficient fibers were present at 50 mg and higher sample weights such that the camera system did not observe more fibers in a shorter time period; a plateau of fibers available for measurement by the camera was reached at 50 mg sample weight. Thus, the measurement analysis time did not demonstrate a major decrease at sample weights above 50 mg (remained ∼6–8 minutes analysis time for six measurements per sample). For sample weights <50 mg, increases in analysis time were observed, with a dramatic increase in analysis time and increased variability at 10 mg sample weight. These results were not unexpected. The fiber count (number of cut fiber snippets measured) was 20,000 fibers per measurement; fewer fibers were present at the lower sample weights versus the 50 mg sample weight, so it was expected that more time would be required to reach the 20,000 fiber count. It was interesting to note the dramatic increase in analysis time average and standard deviation at 10 mg sample weight compared to 30 and 50 mg sample weights.
Impact of loading sample weight on Cottonscope analysis time, 10–90 mg sample weight. Sample weight impact on Cottonscope maturity ratio (MR), original polarized light MRBF, fineness, and ribbon width; 10–90 mg sample weights, statistical analysis RW: ribbon width. Slope is considered statistically significant from zero at p values < 0.01.

Fiber count evaluation
As noted above, the analysis time increased significantly below 30 mg, reaching very high analysis times at 10 mg sample weight (>4-fold increase). One possible way to reduce analysis time would be to decrease the number of fibers analyzed (decrease fiber count). If the fiber count could be decreased without significant decreases in the precision of the Cottonscope results, major decreases in analysis times may be achieved. For three of the original fiber samples [high (34914)-low (GM-39)-medium (DM-9) MR and fineness], Cottonscope measurements were made at 10, 30, 50 (standard), 70, and 90 mg sample weights per loading/cutting and at fiber counts of 5000, 10,000, 15,000, and 20,000, using standard Cottonscope calibration protocols (calibration at 50 mg sample weight, 20,000 fiber count). The Cottonscope results are shown in Table 5 (averaged for the three samples).
Sample weight impact on Cottonscope analysis time (minutes); 10–90 mg sample weights, averages

Sample weight and fiber count impact on Cottonscope maturity ratio (MR), original polarized light MRBF, fineness, and ribbon width; 10–90 mg sample weights and 5000–20,000 fiber counts

RW: ribbon width.
For each fiber sample weight, the variation in MR, MRBF, fineness, and RW with increasing fiber count is given Table 6 (results in blue; below the 20,000 fiber count results for each parameter). At each sample weight (10–90 mg), only small changes in Cottonscope results with increasing fiber count were observed for MR, MRBF, and RW (all %CV ≤ 1.0%). The fineness results exhibited the largest variability in results with increasing fiber count (highest %CVs). Although the %CVs for fineness were higher than those observed for MR, MRBF, and RW, a closer review of the results indicated that only the 10 mg sample weight exhibited a consistent and small, but readily discernible, change and trend in fineness results with increasing fiber count (5.5 %CV decrease in fineness with increasing fiber count from 5000 to 20,000). Therefore, if measurement time is of critical importance, the fiber count for all evaluated sample weights except 10 mg could be decreased to 10,000 with minimal impact on the Cottonscope results for MR, MRBF, fineness, and RW, permitting major decreases in measurement analysis times. The extent of decrease in analysis time will be dependent on the sample weight used in the measurement.
In Figure 7, the slope of the fineness response with increasing fiber count was much less than the slopes observed with increasing sample weight (0.001 at 10 mg for fiber count versus 0.7–1.1 slopes for the sample weight in Figure 4). In addition, the %CVs for each Cottonscope parameter were much larger with increasing sample weight than observed for increasing fiber count. Therefore, compared to fiber count, sample weight was the major impact on the Cottonscope results (primarily fineness).
Impact of fiber count on Cottonscope fineness, 10–90 mg sample weight. 90 mg sample weight: y = (−9.4E-05 ± 0.0004) + (213.09 ± 5.04), r = 0.178, p > 0.01; 50 mg sample weight: y = (−0.0002 ± 0.0001) + (184.55 ± 2.00), r = 0.651, p > 0.01; 10 mg sample weight: y = (−0.0012 ± 0.0002) + (161.79 ± 2.40), r = 0.981, p > 0.01.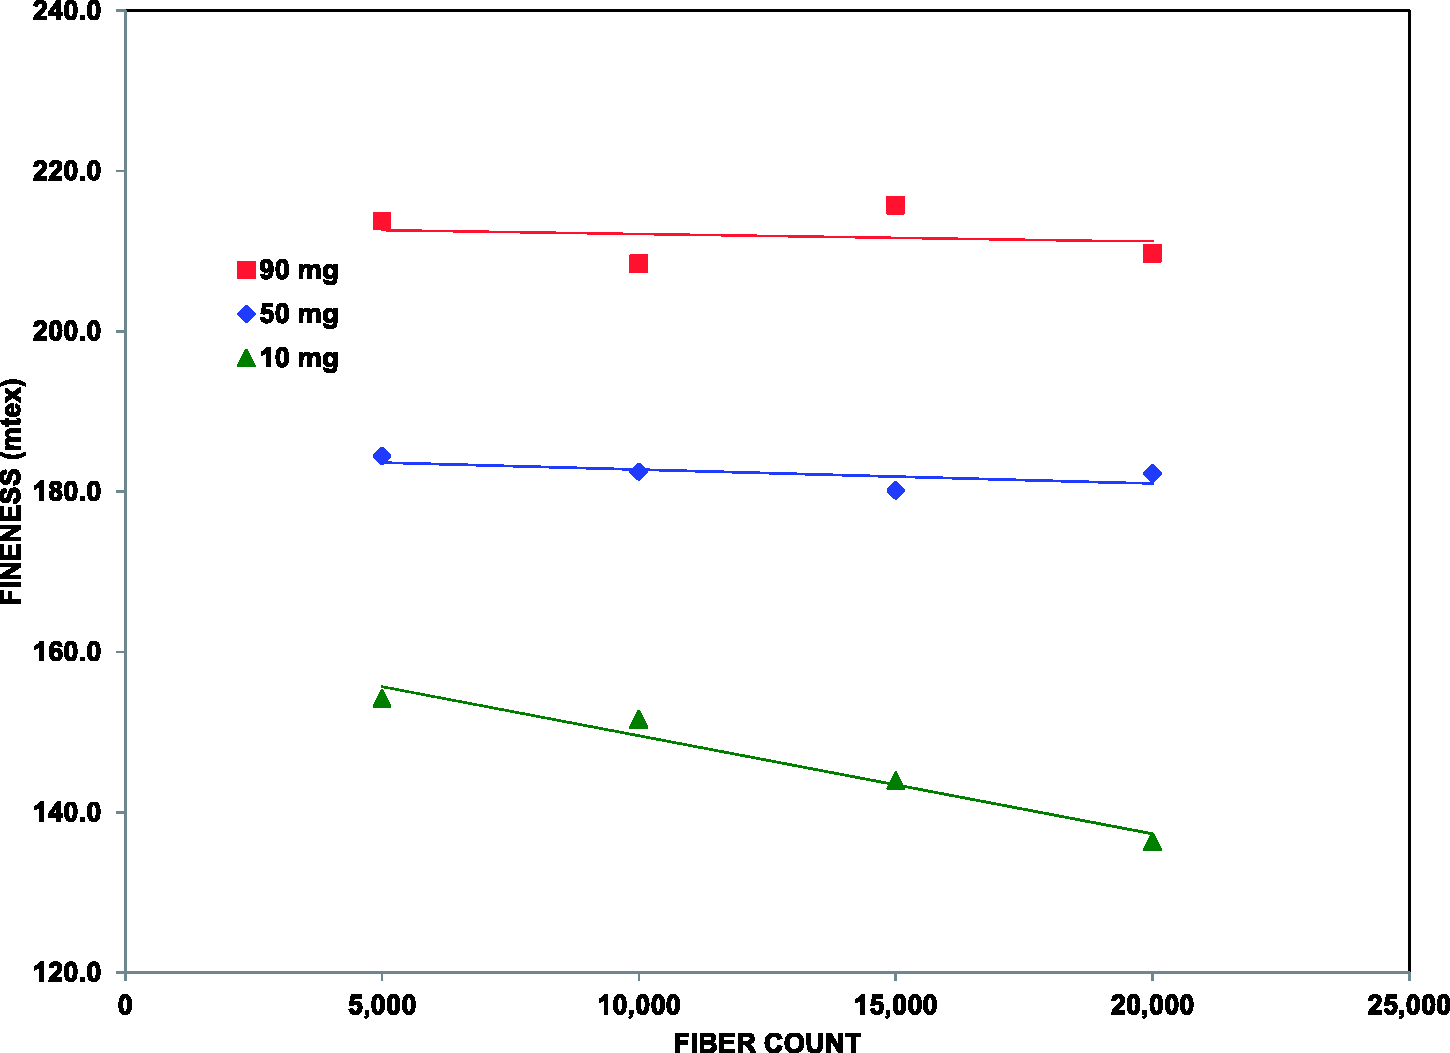
Minimization of sample fiber weight impacts
As noted in the introduction, the Cottonscope instrument incorporates the Siromat and Cottonscan technologies. In a study of the Cottonscan, Abbott et al. 19 identified that as the sample mass (e.g., concentration of suspended snippets) increased, the linear density or fineness value reported by the Cottonscan instrument decreased “due to an increased presence of overlapping snippets in the field of view of the instrument”. In the Cottonscan, pixels in the image corresponding to points of intersection of two snippets were only counted as representing one fiber snippet rather than two, and so this can potentially introduce an error into the estimation of the total length of snippets in the image and hence the estimation of the fineness of the sample. Cottonscan calibration procedures adequately compensated and corrected for this effect if the sample mass used during calibration is similar to that of the mass of the experimental samples (Naylor, private communication). The Cottonscope instrument is similar to the Cottonscan technology in that there is similar potential for the presence of overlapping snippets in the field of view of the instrument. In addition, Cottonscope fineness can be affected by the density of fibers present in the water bowl. As more fibers occupy the same space, the fibers cover each other from the camera, potentially producing an incorrect calculation of the dark spaces/areas in the images. The dark spaces are produced by a fixed number of fibers, controlled by weighing the sample, and changing the fiber density with having significantly more fibers (e.g., higher fiber sample weight) or less fibers (e.g., lower fiber sample weight) may lead to systematic errors in the fineness calculation (high fineness results for samples weights above 50 mg; low fineness results for sample weights below 50 mg). Similar fiber density impacts on the Cottonscope images may be observed with sample weight on RW. Thus it is most likely that these are the underlying mechanisms associated with the trends as a function of sample mass observed in Figures 2, 4, and 5 for the Cottonscope.
Evaluations were performed to test these ideas further and to explore means to minimize the impact of fiber sample weight on the Cottonscope results over the wide sample weight range (10–90 mg), especially for MR and fineness. Two potential impact minimization means were mathematical adjustments for each parameter from 10–90 mg sample weight and re-calibration of the Cottonscope at each sample weight. The results from Figures 2–5 indicate that different slopes were obtained for each fiber; these differences could be due to different instrumental responses between different cotton varieties due to the different fiber densities and impacts on the images of the fibers noted previously with changing fiber weights. The different slopes would indicate that a pure mathematical adjustment to the standard 50 mg calibration may not be the best approach for minimizing the results. Previously, it has been demonstrated that re-calibration of the Cottonscope instrument at specified environmental conditions (room temperature/RH) minimized the impact of changes in environmental conditions on the Cottonscope results. 22 Therefore, the re-calibration of the Cottonscope at each fiber sample weight offered the best overall approach to minimize the impacts, with changing fiber weights, of the different fiber densities and impacts on the images of the fibers from diverse varieties with changing fiber weights.
The Cottonscope was re-calibrated at each separate sample weight, and the Cottonscope results compared. The results are presented in Tables 7 and 8 and Figures 8 and 9 (for MR and fineness, respectively). The slopes of the best fit lines in Table 8 are not statistically significantly different from zero. The MRBF results were minimally impacted by sample weight, regardless of calibration used (original and re-calibrated); thus, re-calibration at each sample weight is not required nor needed for MRBF. For MR, fineness, and RW, the impact of sample weight on those results was significantly minimized by re-calibration of the Cottonscope at each sample weight. All %CVs were <1.5% except for fineness. The fineness %CV decreased from 17.0% to 4.0% for the entire sample weight and fineness ranges (very close to the analytical and sampling variability for the fineness measurement), and the slopes for each sample with changing sample weight decreased from ∼0.9 to <0.2. The impact of sample weight on MR was noticeably minimized, with the %CV decreased by a factor of approximately five and all sample slopes with changing sample weight being ≤0.0002. The stable RW with changing sample weight upon re-calibration resulted in the improved MR stability with changing sample weight. Therefore, re-calibration of the Cottonscope at a specified sample weight successfully removed the impact of fiber sample weight on the MR and fineness results. This is consistent with the explanation and mechanism presented in the previous paragraph.
Impact of loading sample weight on Cottonscope maturity ratio (MR), 10–90 mg sample weight, Cottonscope re-calibrated at each sample weight. Impact of loading sample weight on Cottonscope fineness, 10–90 mg sample weight, Cottonscope re-calibrated at each sample weight. Sample weight impact on Cottonscope maturity ratio (MR), original polarized light MRBF, fineness, and ribbon width; 10–90 mg sample weights; Cottonscope re-calibrated at each sample weight, averages RW: ribbon width. Sample weight impact on Cottonscope maturity ratio (MR), original polarized light MRBF, fineness, and ribbon width; 10–90 mg sample weights; Cottonscope re-calibrated at each sample weight, statistical analysis RW: ribbon width. Slope is considered statistically significant from zero at p values < 0.01.


Validation set
Sample weight impact on Cottonscope results, Validation Set (n = 21); 10–90 mg sample weights; standard 50 mg calibrations for each parameter

MR: maturity ratio; MRBF: original polarized light microscopy maturity ratio ; RW: ribbon width.
Sample weight impact on Cottonscope results, Validation Set (n = 21); 10–90 mg sample weights; sample weight-specific calibrations (specific for each sample weight) for each parameter

MR: maturity ratio; MRBF: original polarized light microscopy maturity ratio ; RW: ribbon width.
Conclusions
Direct measurements of cotton fiber maturity and fineness are often difficult, laborious, and/or expensive to perform, but the Cottonscope addresses these shortcomings. Interest has been expressed in the use of different sample weights of fiber for Cottonscope measurements (standard sample weight of 50 mg), especially requests by some breeders and geneticists for lower sample weights and by other breeders and downstream processors for larger sample weights. Cotton fiber samples, which covered wide maturity and fineness ranges, were measured on the Cottonscope at varying sample weights (10–90 mg fiber, in 20 mg increments) and varying fiber count (5000–20,000 in 5000 increments). With varying sample weight, discernible differences were observed in MR, fineness, and RW, with the main impact observed for fineness. Using less than the standard 50 mg sample weight did increase the analysis time, especially at 10 mg sample weight. At each fiber count increment, the impacts of sample weight on Cottonscope results were very similar to those observed at the standard 20,000 fiber count for all fiber counts evaluated, with fineness being the most impacted. If reduced analysis time is a primary concern, the fiber count could be decreased to 10,000 with minimal impact on the Cottonscope results (except for 10 mg sample weight). Compared to fiber count, sample weight was the major impact on the Cottonscope results. Re-calibrating the Cottonscope at each sample weight removed the sample weight impact on the Cottonscope results. Cottonscope measurements on a Validation Set of 21 cotton samples verified and confirmed the observed sample weight impacts on the Cottonscope results and the removal of those impacts with the development of sample weight-specific calibrations. The feasibility and versatility of the Cottonscope to accurately and precisely measure the cotton fiber maturity, fineness, and RW were demonstrated for small samples, down to 10 mg sample weight. Although the standard sample weight remains 50 mg, the “optimal” sample weight for the Cottonscope measurement (e.g., from 10 to 90 mg fiber) will be dependent on the needs/experimental requirements of the researcher and the mass of sample available for measurement.
Footnotes
Disclaimer
The use of a company or product name is solely for the purpose of providing specific information and does not imply approval or recommendation by the USDA to the exclusion of others.
Funding
This research was partially supported by Cotton Incorporated (Cary, NC) under project number 58-6435-2-671.
Acknowledgments
The authors wish to acknowledge the outstanding work by Ms Jeannine Moraitis in preparing and testing all samples.