
Abstract
A key cotton fiber property is micronaire. Micronaire can impact the fiber’s quality, textile processing efficiency, and fabric dye consistency. Fiber micronaire is normally measured in a laboratory under tight standard temperature and relative humidity (RH) environmental conditions (21 ± 1℃, 65 ± 2% RH). Near infrared (NIR) measurements have been performed both inside and outside of the laboratory, but measurements outside the laboratory have at times demonstrated reduced predictive capability, possibly due to the lack of standard environmental conditions. A program was implemented to determine the impact of non-standard conditions of temperature T and relative humidity RH on NIR micronaire results for bench-top and portable NIR instruments. Non-standard T and RH resulted in varying fiber moisture, which impacted the NIR spectral response. The NIR micronaire results were impacted by the non-standard conditioning for all instruments, with the lower wavelength region (∼910–1680 nm) portable instrument impacted the most. The impacts and deviations were greater at high temperature/RH compared to low temperature/RH conditioning. These results provide a rationale for the deviations observed previously in NIR micronaire results for outside the laboratory micronaire measurements with portable NIR units.
Micronaire (mic) is a key quality and processing parameter for cotton fiber. Differences or deviations in micronaire can impact and lead to variations in fiber quality, processing productivity and efficiencies, yarn and fabric quality, and yarn and fabric dye consistency and final product quality.1–5 Micronaire is an indirect measurement of and a function of the fiber’s maturity and fineness.3,6–9 Maturity is the measure of the fiber’s development or thickening of its secondary wall relative to the overall perimeter/circumference of the fiber, and fineness is a measure of the fiber’s linear density or size. A traditional laboratory method for measuring micronaire is the compression of a specific mass of fiber and measurement of air flow resistance per unit mass, as used by the Uster® High Volume Instrument (HVI).1–3,10
In the USA, the United States Department of Agriculture (USDA) Agricultural Marketing Service (AMS) performs the assessment of cotton quality (classification) for commercial cotton using the HVI.1,2 The HVI fiber properties reported by AMS include fiber strength, length, length uniformity, color, trash, leaf grade, and micronaire. All HVI measurements are performed in a laboratory under tightly controlled environmental conditions of temperature and relative humidity (RH), and the standard environmental conditions for cotton are 21 ± 1℃ and 65 ± 2% RH. 11 Although fast and accurate measurements are obtained for micronaire, limitations of HVI and similar instruments include laboratory-only measurements, the need for controlled environmental conditions, the need for trained operators, and/or high instrument and operating costs.
Near infrared (NIR) spectroscopy is one technology that has been investigated for its potential to measure fiber micronaire, both inside and outside the laboratory (warehouse, field, greenhouse, etc.). NIR methods and techniques have been used widely in fiber and textile applications primarily using bench-top, laboratory instruments, to include natural and synthetic fibers and undyed and dyed fabrics.6,12–19 The NIR spectral region is located between the visible and infrared spectral regions, primarily between 800 and 2500 nm.20–22 The NIR absorbances are often broad, and advanced mathematical modeling is often required to calibrate the NIR spectra to a reference method and to predict the sample’s properties of interest. For cotton fibers and other solids, light from the instrument is shone onto the sample’s surface, and the diffuse reflected light at different wavelengths (λ) is collected by the detector and converted to absorbance (A). The NIR absorbance spectrum is composed of the plot of A versus λ. NIR absorbances in this region are due primarily to the overtones and combination bands of fundamental absorbances found in the infrared spectral region. These NIR absorbances are due primarily to CHn, NHn, and OH groups present in the sample, but carbonyl (CO), sulfhydryl (SH), and amide (CONHn) groups can exhibit moderate absorbances. Chemical specie assignments for cotton fiber have been assigned to several NIR bands/regions. For example, Liu et al. 19 and Rodgers et al. 23 assigned the region from ∼1150 to 1300 nm to the second overtone of CH stretching modes; from ∼1675 to 1860 nm to the first overtones of CH stretch; from ∼1300 to 1400 nm to various combination bands of CHn; and from ∼1400 to 1500/1900 to 2000/2050 to 2200 to OH overtones and/or CHn and OH combination bands. The major NIR absorbance peak at 1900–2000 nm was shown to be due primarily to water and was denoted as a moisture peak. 23
Cotton fiber micronaire measurements using NIR instruments have been studied extensively by several researchers, primarily as laboratory measurements with bench-top, research grade NIR instruments.6,19,23–28 Research by Rodgers et al. 23 has demonstrated the “universal” nature of the NIR measurement of fiber micronaire by bench-top, research grade, laboratory NIR instruments. Much interest has been expressed in methods that can measure key fiber properties both in the laboratory and outside the laboratory. With the advent of improved light dispersing elements/devices, minimization, and portability, scanning NIR instrument measurements of fiber micronaire for laboratory and outside the laboratory applications have been explored. Rodgers et al.29,30 and Zumba and Rodgers 31 have demonstrated the capabilities of portable NIR instruments to measure micronaire in a laboratory under controlled environmental conditions. For outside the laboratory measurements, Rodgers et al. 32 performed measurements in or near the cotton field in Mississippi and Louisiana over two crop years, in which NIR measurements were made directly on the cotton boll. Distinct micronaire differences (low-medium-high) were verified for over 80% of the samples, but impacts due to non-laboratory environmental conditions were observed. A possible rationale for the observed impacts was that the non-standard and variable non-laboratory environmental conditions lead to differences in fiber moisture for the fiber, which could impact the NIR spectrum and resulting NIR micronaire results. However, Vogt et al. 33 did not observe a moisture impact resulting from the water band at 1900–2000 nm.
As noted above, outside of the laboratory NIR measurements for micronaire could sometimes lead to more variable NIR results and to a higher number of outliers (greater deviation from the reference method) compared to measurements performed in the laboratory under tightly controlled environmental conditions. Thus, a key concern for non-laboratory NIR measurements of fiber micronaire (field, greenhouse, etc.) is the impact of temperature, relative humidity, and potential moisture differences due to varying environmental conditions on NIR micronaire results. Previous evaluations have noted the possibility of the above impacts on the NIR results, but a detailed study of these parameters on NIR measurements made outside of the laboratory has not been performed. In order to provide new information and to provide insight into the sometimes conflicting results from previous evaluations, a program was implemented with the objective of determining the effects and impacts of non-standard environmental conditions (temperature (T) and relative humidity (RH%)) and their potential condition interaction (T × RH) on the fiber moisture level and NIR measurement results of fiber micronaire, using both bench-top laboratory and portable NIR instruments with different wavelength ranges. A diverse set of cottons with a wide micronaire range were used in this evaluation. All measurements were performed at the Southern Regional Research Center of the Agricultural Research Service of the United States Department of Agriculture (USDA, ARS, SRRC) in New Orleans, LA.
Experimental details
Cotton fiber samples and treatments
Cotton samples

Each fiber sample was subjected to 13 temperature (T)-relative humidity (RH) condition treatments that were the combination of five different temperature conditions (T oC) (15℃, 18℃, 21℃, 24℃, and 27℃) with five different relative humidity conditions (RH %) (45%, 55%, 65%, 75%, and 85%; Figure 1). The five T and 5 RH conditions were selected to represent equal distance T and RH changes and to represent T and RH conditions that are readily observed in outside the laboratory measurements. Prior to NIR measurements, all samples of each variety were conditioned for 24 h under each specified treatment condition.
Thirteen T*RH treatments.
Instrumentation
Near infrared (NIR) instruments
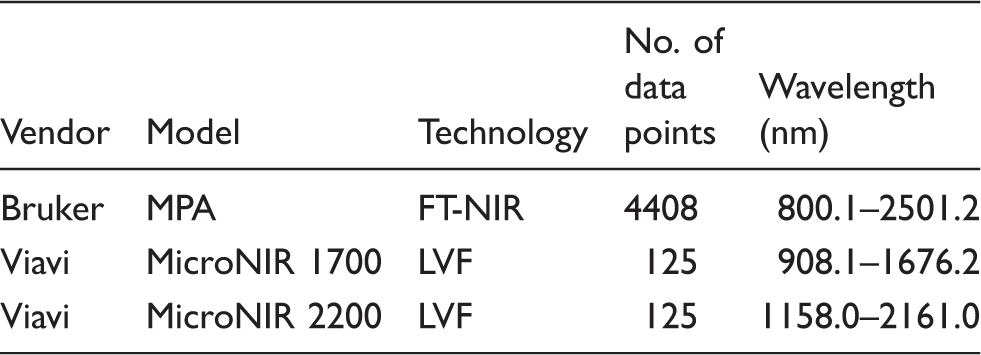
MPA: MultiPurpose Analyzer; FT: Fourier transform; LVF: Linear Variable Filter.
NIR and fiber moisture measurements
The fiber samples were placed in the Mesdan Climatest under the specified treatment condition for 24 h. The fiber moisture measurements were performed first with the Strandberg M400 instrument, and then five NIR measurements per sample were performed with each NIR instrument. The five NIR measurements and two moisture content measurements were averaged for each sample at each condition. Fiber samples were not re-utilized for a different treatment; new fiber samples were utilized for each of the 13 conditioning combinations.
Chemometric and data analysis
The NIR spectra data was analyzed using three software programs. For the Bruker MPA, the OPUS Chemometric software (Version 5.5) was used to develop quantitative calibrations, using first derivative (FD) Partial Least Square (PLS) calibrations. The NIR spectral data from the handheld MicroNIR instruments were analyzed using the Camo Unscrambler software (Version 10.3, Camo Software AS, Woodbridge, NJ). Calibrations and predictions were performed using NIR results with FD PLS calibrations. The NIR spectra were analyzed by treatments and by samples, and both were bias corrected based on the standard laboratory-controlled conditions data results (T = 21℃ and RH = 65%). 11
Fiber moisture content and NIR projections were analyzed using SAS PROC GLIMMIX, with estimates of means and standard errors generated using LS MEANS. Cotton sample, temperature, and relative humidity were the treatment classes, with NIR predictions and fiber moisture as response variables (Version 9.4; SAS Institute, Cary, NC) and HVI micronaire as each sample’s reference value. Initially, all 13 treatments were analyzed using three main interaction factors effects as follows: sample (S) by temperature (T) or S*T, sample (S) by relative humidity (RH) or S*RH, and temperature (T) by relative humidity (RH) or T*RH. As will be presented in more detail later, the initial effect analysis demonstrated that T*RH was the only statistically significant interaction effect present. Once it was demonstrated that T*RH was the primary interaction effect, a second analysis was performed utilizing the S variable by itself without the interaction of other variables, together with the only interaction effect, as follows: S, T*RH.
To determine the effect of RH by itself and the effect of T by itself on NIR measurement results for each instrument, the fiber moisture content data was also analyzed either at a constant T (21℃) with five different RH levels (45%, 55%, 65%, 75%, and 85%) for the RH effect evaluations or at a constant RH (65%) with five different T levels (15℃, 18℃, 21℃, 24℃, and 27℃) for the T effect evaluations. It is important to note that the data for the treatment T = 21℃ at RH = 65% was the same for both analyses.
Results and discussion
NIR spectral data
NIR evaluations were performed with three spectrometers—two handheld portable Viavi Solutions, Inc. MicroNIR instruments (MicroNIR 1700 or P1 and MicroNIR 2200 or P2) and the bench-top research grade Bruker Optics MPA (B1). For the purpose of data interpretation and explanation of the experimental results, the NIR spectral data for S6 (4.5 mic) and/or S2 (2.6 mic) were presented herein. Very similar NIR absorbance spectral responses were observed for all three NIR instruments, with all major cotton bands present and distinct in the spectra. The spectral similarity in common spectral regions established that very good spectral agreement exists between the different instruments (Figure 2).
Comparisons of near infrared (NIR) absorbance spectra for the three NIR instruments, S6, 21℃/65% relative humidity treatment.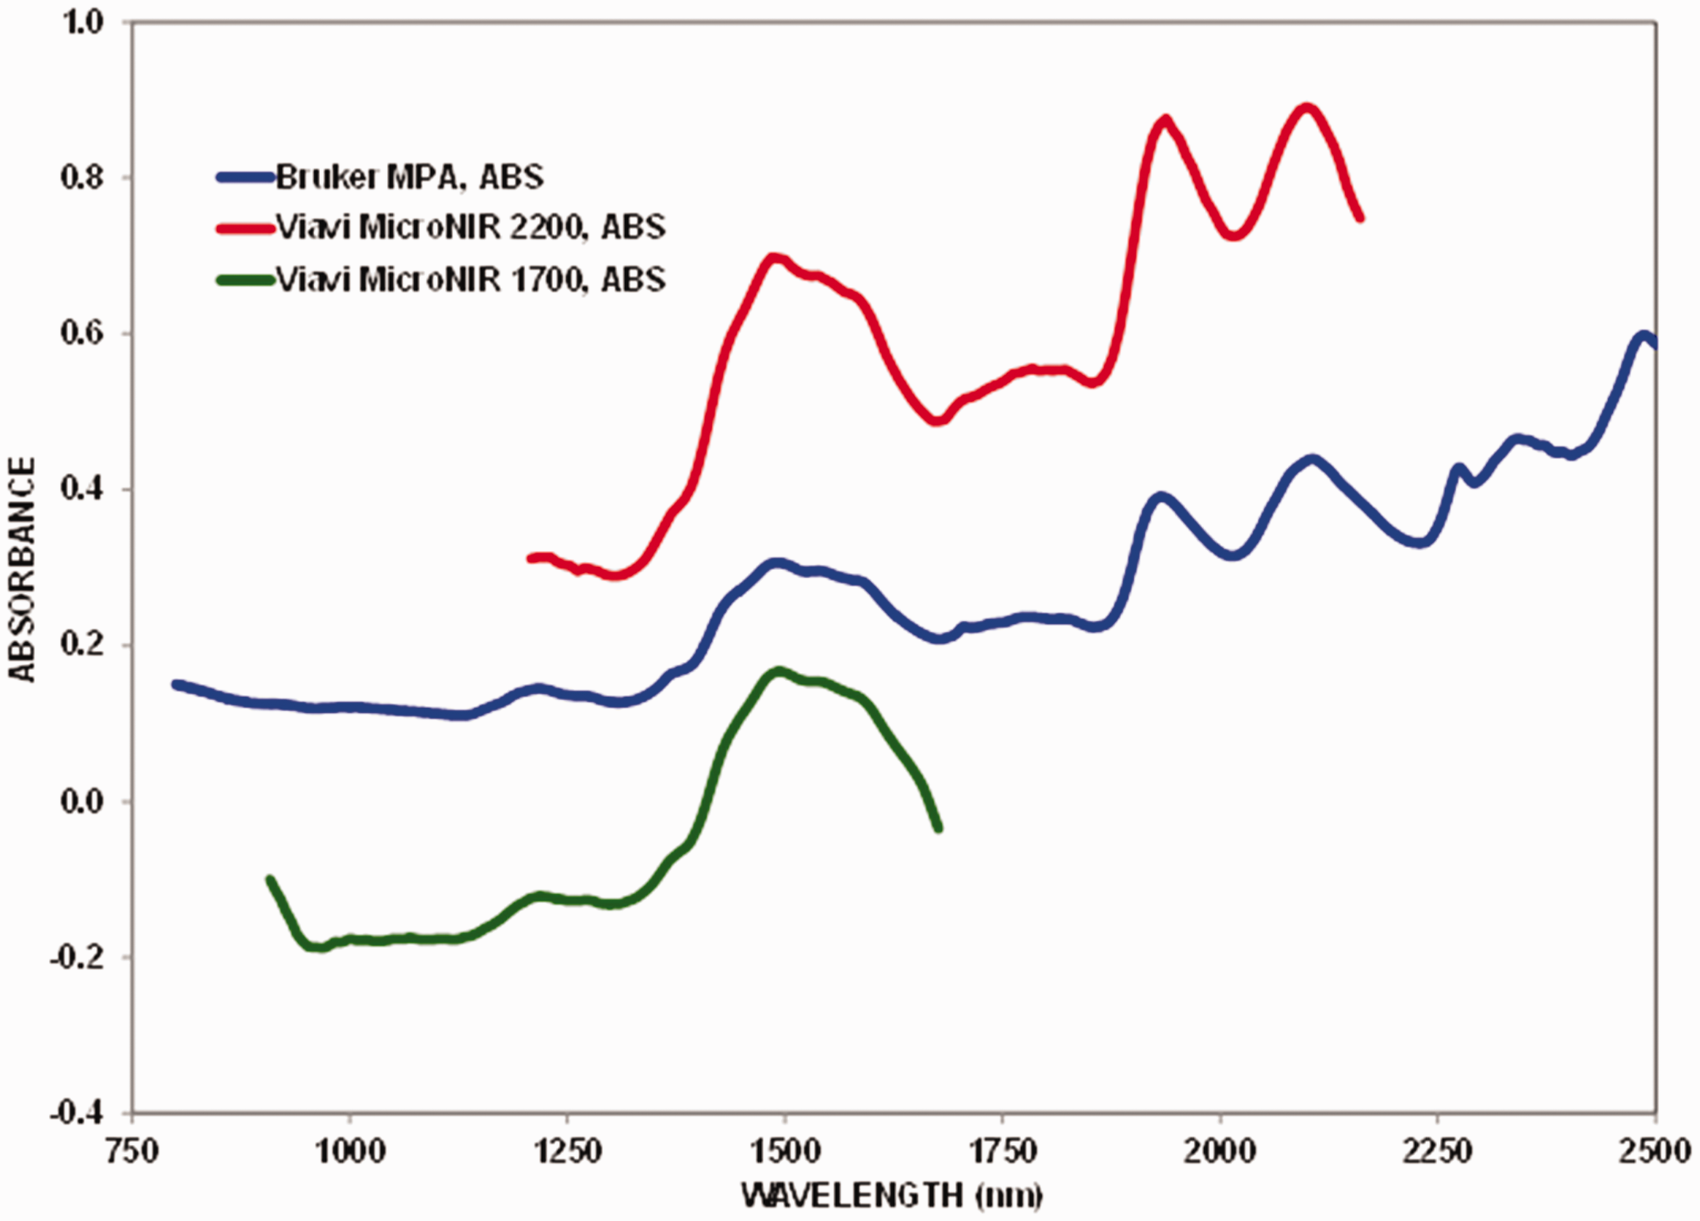
NIR spectral comparison of “extreme” treatments with laboratory condition treatment
For this paper, “extreme” treatments are those treatments with the widest T and RH levels, such as 15℃ and 45% RH for the cool/dry extreme and 27℃ and 85% RH for the hot/wet extreme. The absorbance spectra for S6 cotton fiber for the two extreme treatment conditions and the mid-point standard laboratory condition of 21℃ and 65% RH are shown in Figure 3. The graph shows a distinct difference among treatment conditions, especially for the treatment with the highest T and RH combination, 27℃ and 85%, respectively. The NIR spectral absorbance for the treatment with the highest T and RH was higher compared to the other two treatments, possibly indicating that the NIR absorbance spectra of the fiber was affected by extreme relative humidity and temperature conditions, especially at high T-RH combination (and corresponding high fiber moisture content). This difference may be due to true T-RH impacts and to diffuse reflectance differences between the randomly aligned cotton fibers that resulted in minor-to-moderate baseline shifts or differences between samples. Baseline shifts are not unexpected and can occur due to differences in the fiber surface orientation of individual fibers when NIR measurement is underway.
29
In order to determine the true impact on the NIR spectral results due to the T-RH impacts, potential baseline differences must be minimized. Similar trends and results on absorbance spectral data were observed for the other samples and NIR instruments.
P2 instrument near infrared absorbance spectra of extreme treatments, S6, three T/RH conditions (e.g., 1545).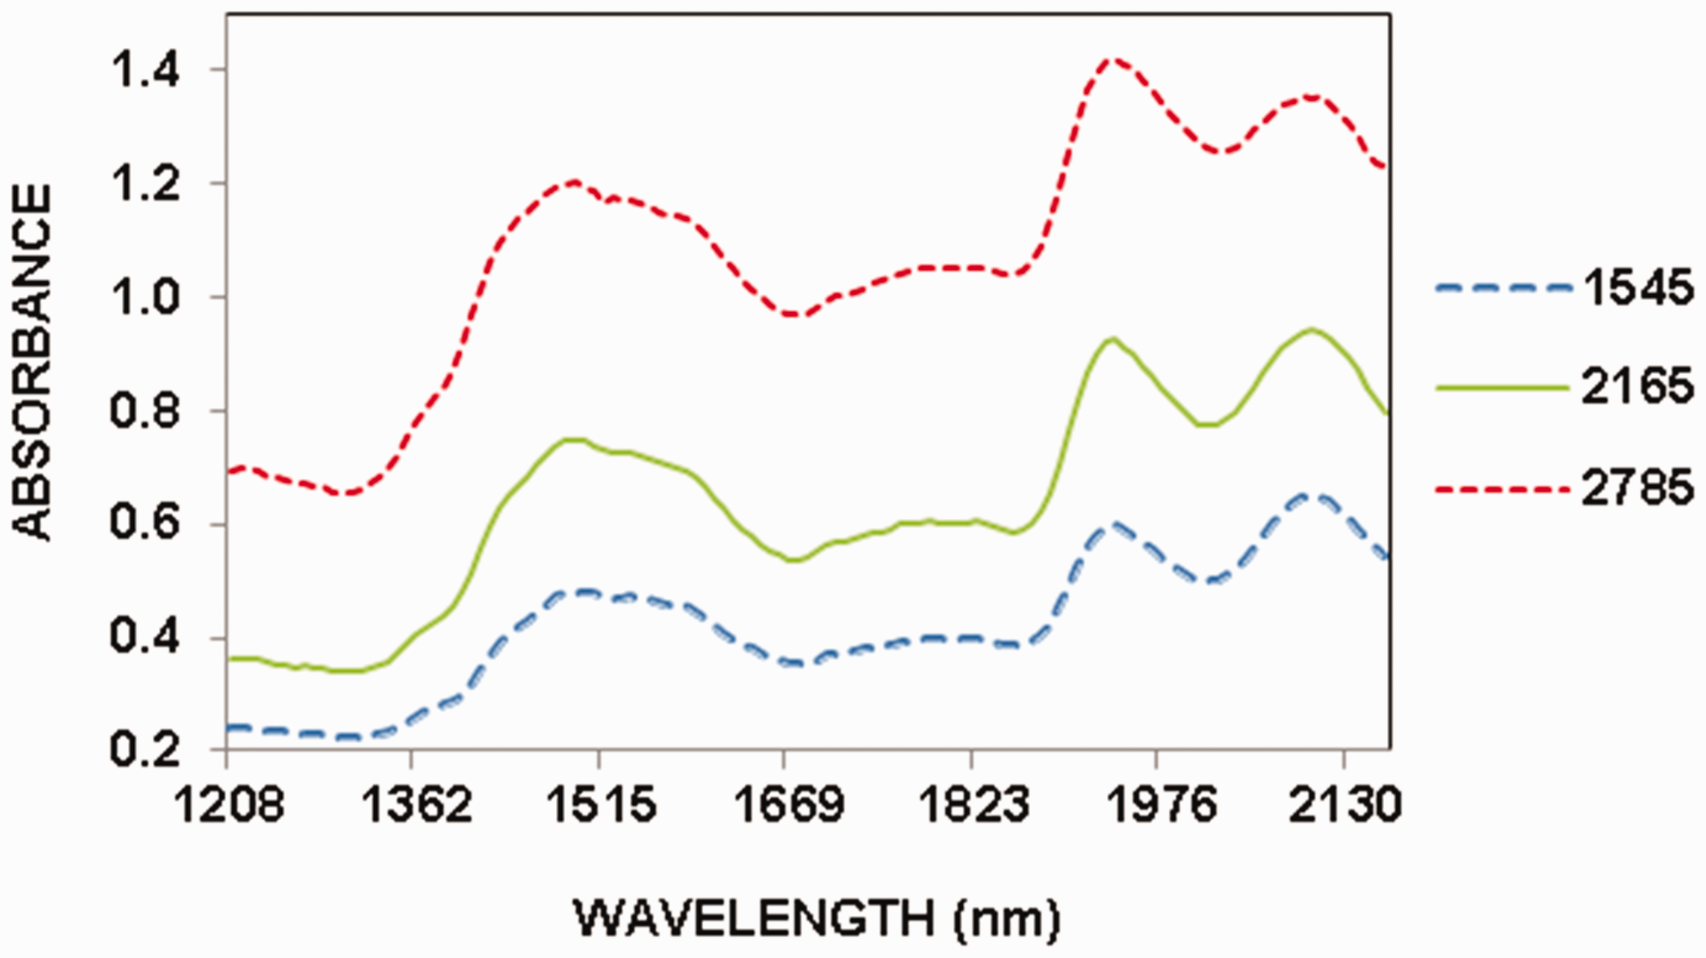
Data transformation of the NIR absorbance spectra, using the FD, was performed to minimize and offset baseline shift and to find distinctive spectral differences between fiber samples and between treatment conditions at specific wavelengths. The FD spectra for the P2 instrument exhibited distinct spectral difference at several wavelengths (Figure 4). Both the absorbance and FD spectral data exhibited larger differences between treatments at the higher T-RH condition (Figure 4). The readily observed spectral differences with extreme T-RH environmental conditions strongly imply that non-standard T-RH combinations were impacting the NIR spectral response and demonstrate that the higher T and RH conditions may affect the NIR response the most. Since higher T and RH conditions may result in higher fiber moisture content, it is possible that a moisture impact on the NIR spectra was observed. The FD on the P2 instrument spectral data exhibited five distinct ranges/regions where differences were observed between treatment conditions (∼1320–1440, 1480–1660, 1700–1770, 1850–1930, and 1960–2090 nm).
P2 instrument near infrared first derivative spectra of extreme treatments, S6, three T/RH conditions (e.g., 1545).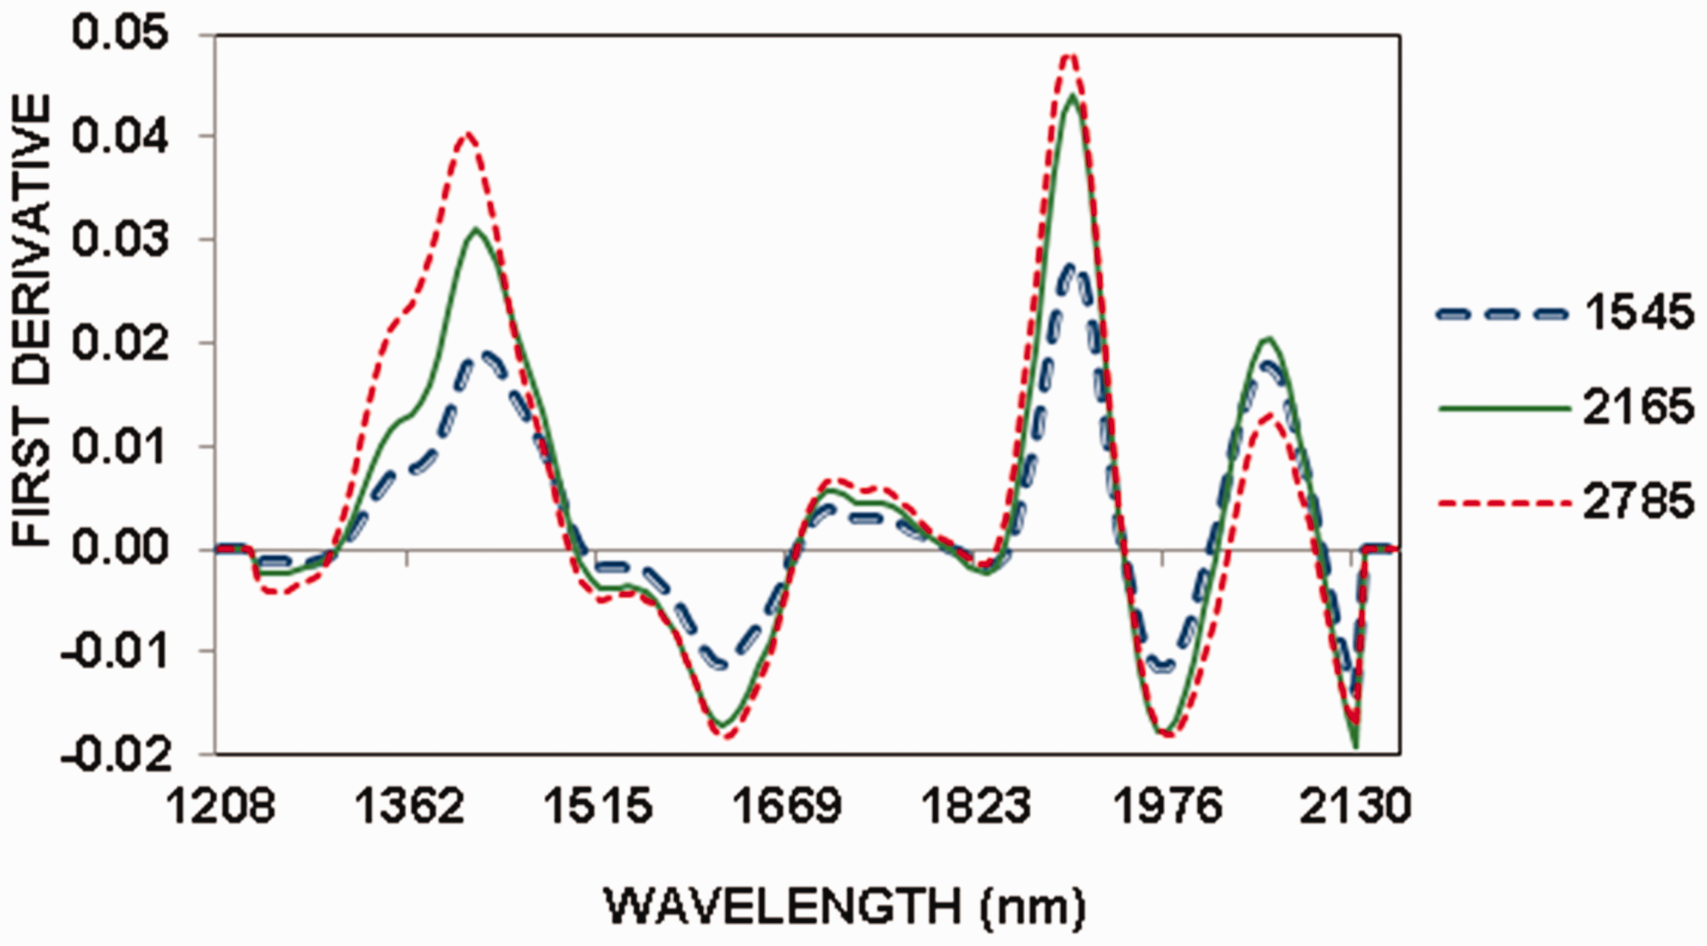
NIR spectral comparison at constant temperature (T) and relative humidity (RH)
The relative independent impacts of T and RH on the NIR spectra were discerned by comparing the NIR absorbance and the FD spectra at the extremes for one variable (highest and lowest treatment conditions for one variable) with the other variable held constant. The absorbance spectra for the P2 instrument at constant temperature (21℃) and at the three different RH levels (low 45%, standard 65%, and high 85%) are shown in Figure 5. The NIR absorbance spectra at constant RH (65%) and at three different temperatures (low 15℃, standard 21℃, and high 27℃) are shown in Figure 6. The spectra data of S6 cotton fiber variety was used for both Figures 5 and 6.
P2 instrument near infrared absorbance spectra at 21℃, S6, varying RH. P2 instrument near infrared absorbance spectra at 65% RH, S6, varying T.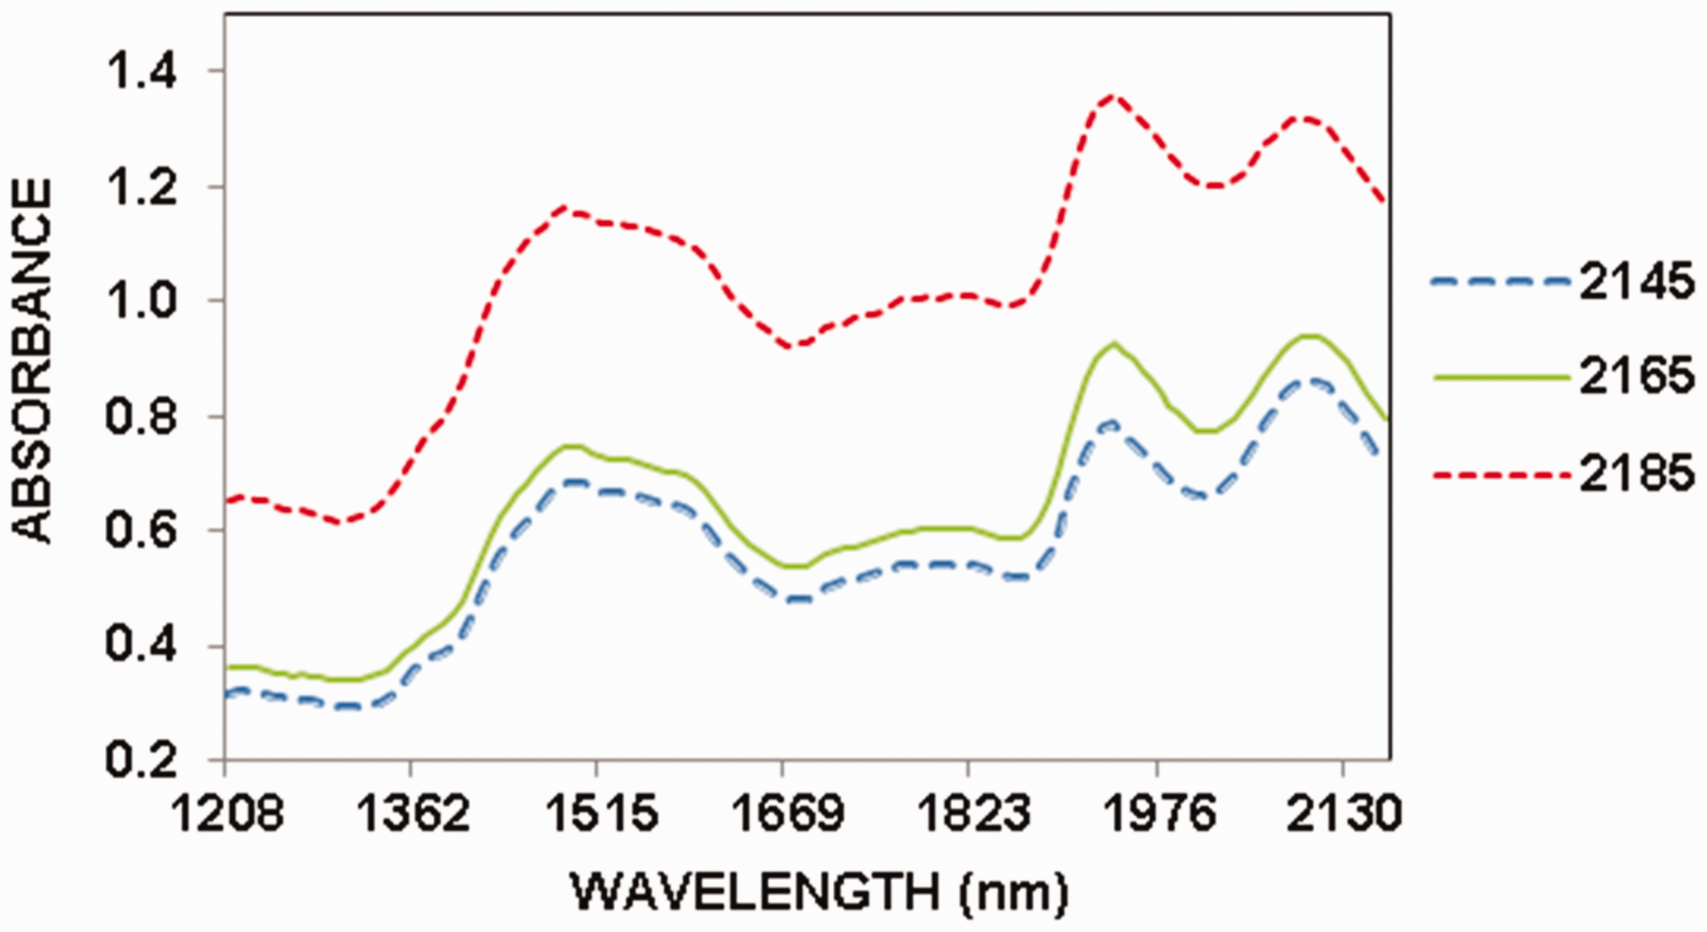
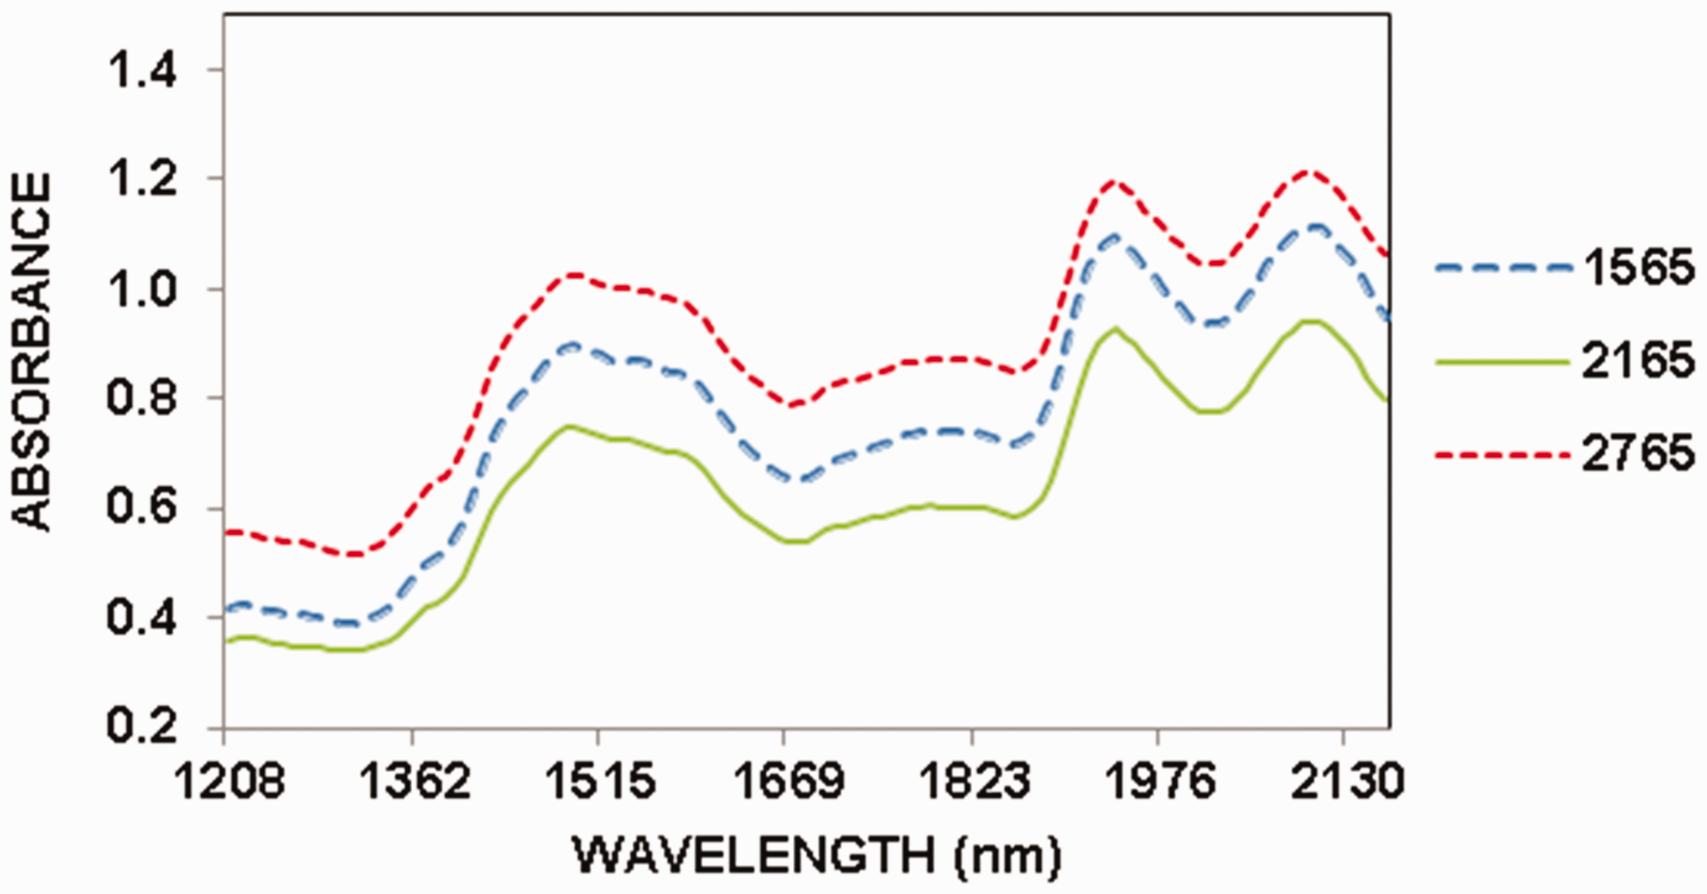
At a constant temperature (21℃), the spectra of the three treatment RH conditions were similar in spectral band locations, they were distinctly separated, and the spectra differences were in the correct order corresponding to ascending RH treatment (Figure 5). At a constant relative humidity (65%), the spectra for the lowest T (15℃), higher T (27℃), and standard T (21℃) were also separated (Figure 6). Further, the NIR absorbance spectra for the constant RH spectra were not in order of ascending T treatment. The differences may be the result of true T/RH impact and/or baseline shifts. Similar trends and results on absorbance spectral data were observed for the other cotton fiber samples and NIR instruments.
As before, data transformations using the FD of the absorbance spectral data were performed to minimize and offset the baseline shift observed for these treatments. The FD spectra shown in Figures 7 and 8 were from the S6 cotton fiber absorbance spectra displayed in Figures 5 and 6, respectively. Figure 7 presents the FD spectra at constant temperature (21℃) and at three different RH levels (45%, 65%, and 85%), and Figure 8 shows the FD spectra at constant RH (65%) and at three different temperatures levels (15℃, 21℃, and 27℃). Similar trends on FD spectral data were observed for the others cotton fiber samples and NIR spectrometers.
P2 instrument near infrared first derivative spectra at 21℃, S6, varying RH. P2 instrument near infrared first derivative spectra at 65% RH, S6, varying T.
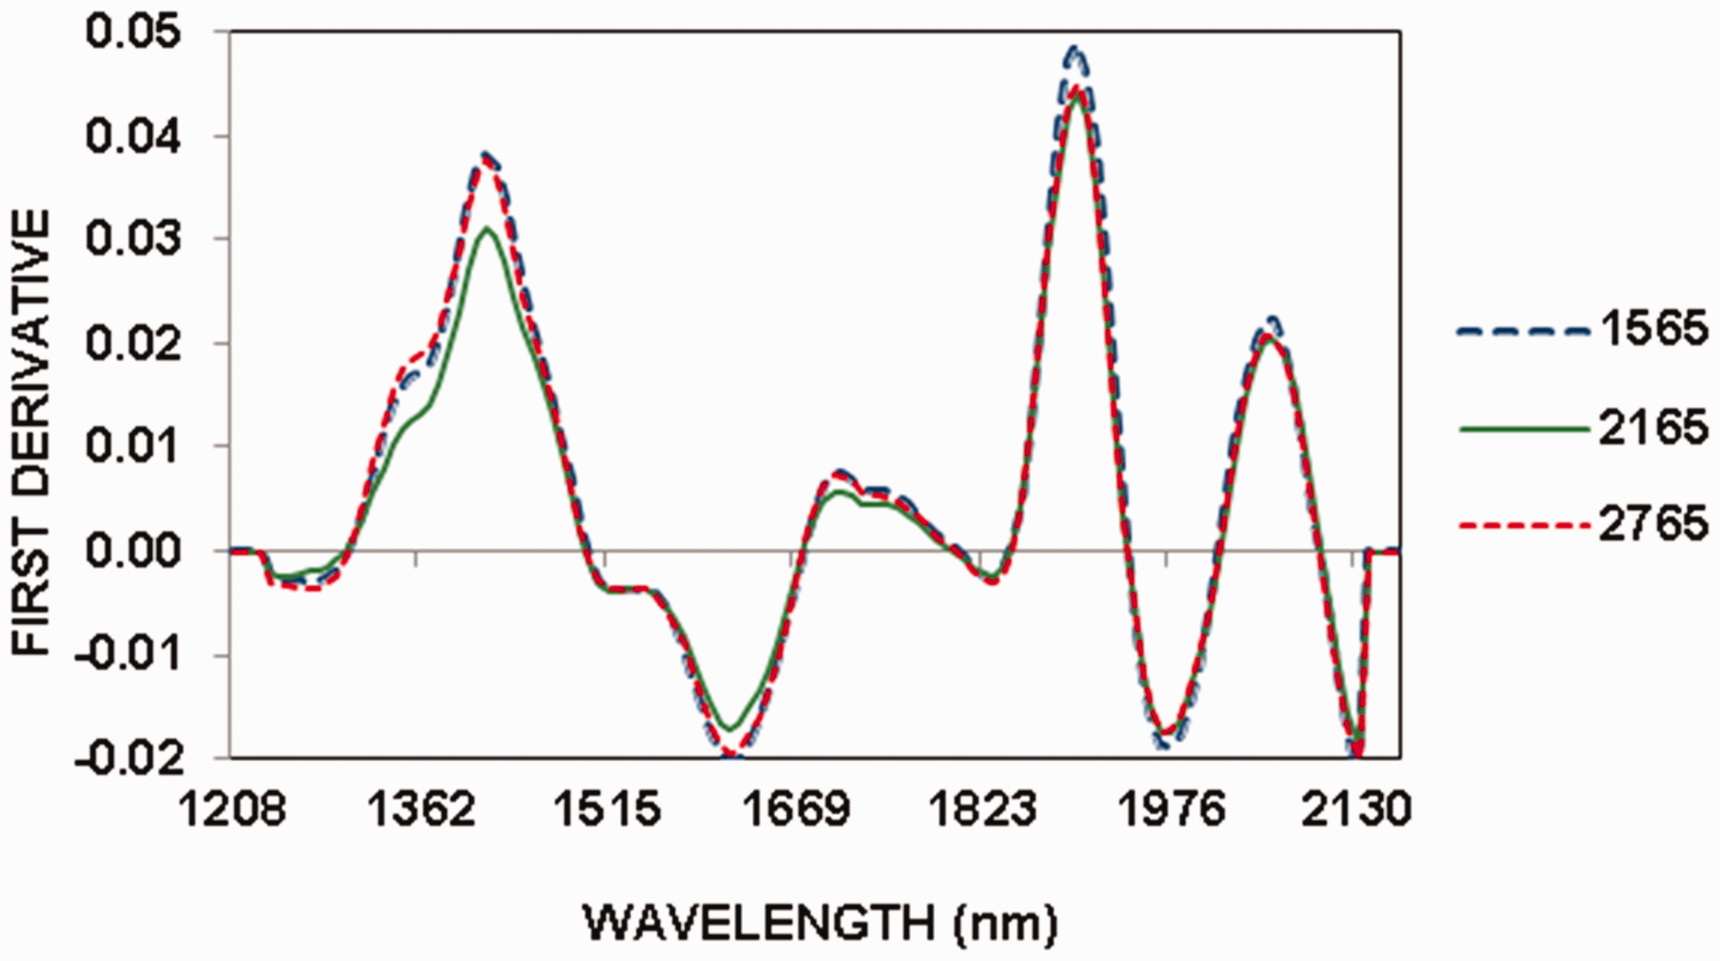
When holding the temperature constant (21℃), Figure 7 exhibits distinct spectral differences, representing a clear separation between treatments at different RH. The three wavelength ranges that appear to be affected by varying relative humidity are between ∼1320 and 1440, 1850 and 1930, and 1970 and 2090 nm. The spectral differences between different T treatments at constant RH shown in Figure 8 are neither as distinct nor as uniform as those observed in Figure 7. These results indicate that RH, rather than T alone, could be the major condition impact on the NIR spectra.
Moisture fiber analysis and NIR mic projections
Temperature by relative humidity RH effect, average of all samples at 13 treatments/conditions

Significant at p < 0.05; values with the same letter are not significantly different from each other.
NIR: near infrared.
Previously, it was established by key industry stakeholders (e.g., Cotton Incorporated) that a micronaire outlier is designated as samples in which the difference between the HVI micronaire and NIR projected micronaire was >±0.3 mic units.29,33 The NIR spectra were analyzed by treatments and by samples and both were bias corrected based on the laboratory-controlled conditions data results (T = 21℃ at RH = 65%). Higher RH/T conditions not only affected the fiber moisture content, but also the NIR mic results (Table 3). All three spectrometers were affected by high RH/T treatments, but the B1 instrument was the most stable, as it was the least impacted by T and RH and gave the most consistent NIR mic results. The P1 instrument was the most impacted by the T and RH and gave a much wider range/deviation of NIR mic projections when predicting in environments with high T and RH (Table 3). The NIR mic projection using the P1 instrument, at RH of 85%, were impacted negatively by over 2 micronaire unit difference, in contrast with the B1 instrument, which was impacted by less than 0.3 micronaire units normally.
Figure 9 visually illustrates the effect of high temperature and RH on sample S2’s fiber moisture and NIR mic projections using each of the three spectrometers. Figure 9 shows the significant effect of higher T and RH on fiber moisture and the projected NIR mic, and also how high T and RH affects each NIR instrument. The B1 instrument was the most stable of the three and projected the least impacted and most consistent NIR micronaire results. This result indicates that the superior instrumental components (especially the detector) and NIR spectral range of the bench instrument may be minimizing the deviations due to non-standard T and RH. It was interesting to note that the P1 instrument was the instrument most impacted at high T and RH. The wavelength spectral range of the P1 instrument is ∼910–1680 nm, while the upper NIR wavelength of the P2 instrument and the B1 instrument go beyond 2050 nm and include additional spectral information not present in the P1 instrument measurements. One potential rationale for the differences in impacts between portable instruments is that the P2 instrument spectral range includes the NIR moisture peak at 1900 nm.
23
The OH bands of water (moisture) have significant NIR absorbances, and the varying moisture content that occurs with varying T and RH can lead to changes (impacts on the NIR spectra when the NIR measurements were made at non-standard conditions). The inclusion of the moisture peak (and fiber moisture deviations monitored by this peak/band) in the PLS calibrations for instruments B1 and P2 resulted in the development of improved, more robust calibration models for the longer wavelength range portable instrument that result in a lower impact on the NIR mic projections by high T and RH (and corresponding high moisture). Similar trends and results were observed for the others cotton samples using the three NIR spectrometers.
Near infrared (NIR) mic projection results and moisture content (MC) at different T and RH, S2.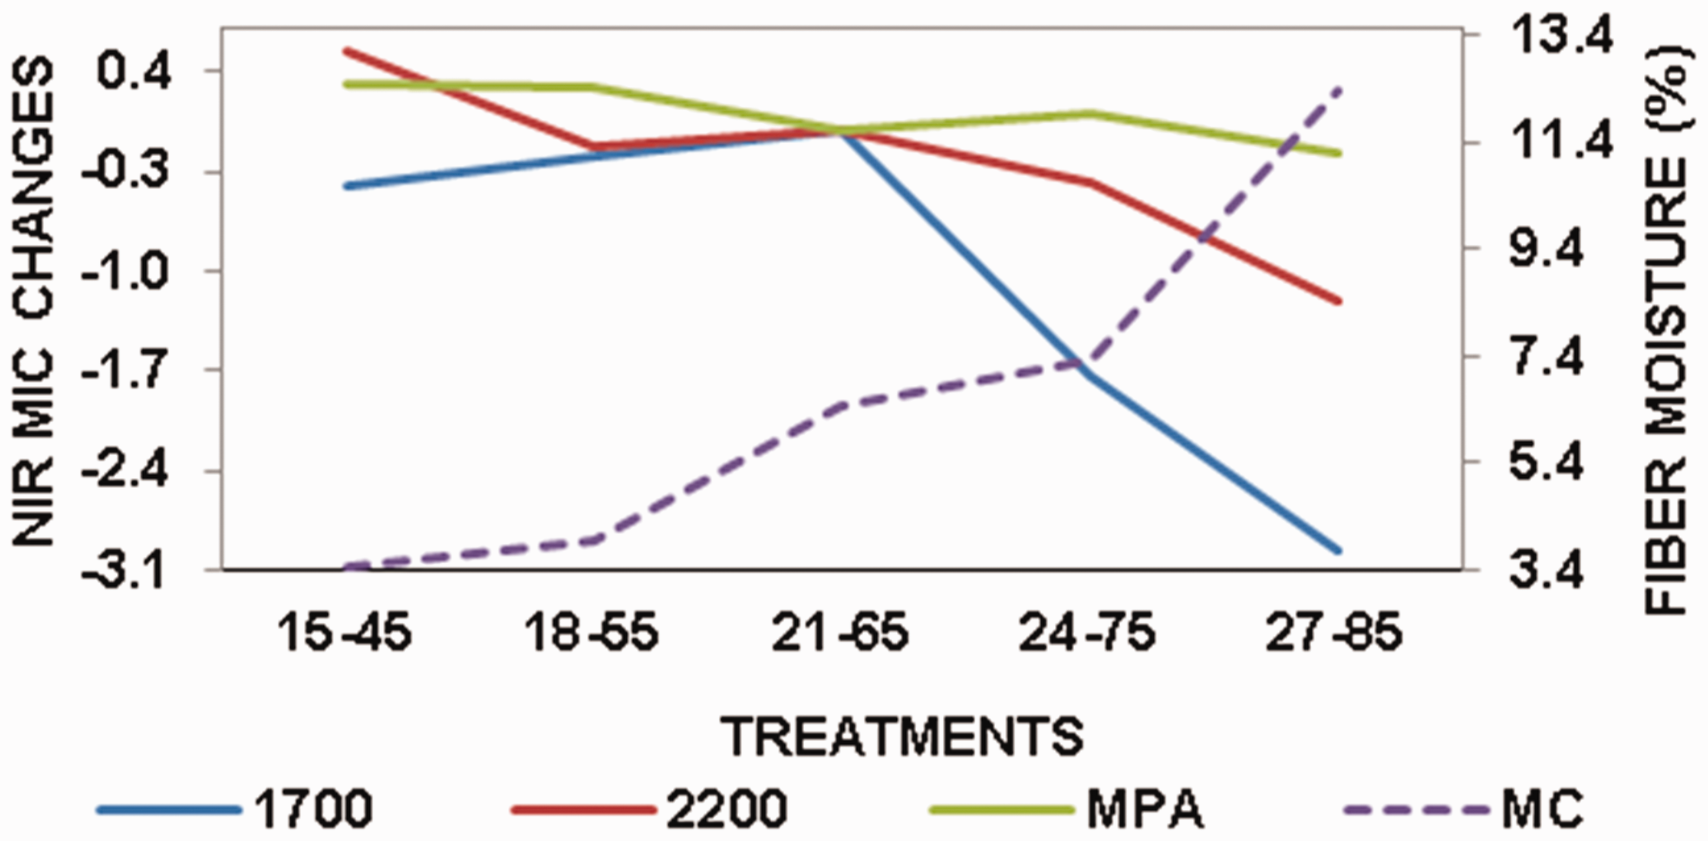
Effect on samples (sample effect) of temperature T and relative humidity RH on average moisture and near infrared (NIR) micronaire projection results
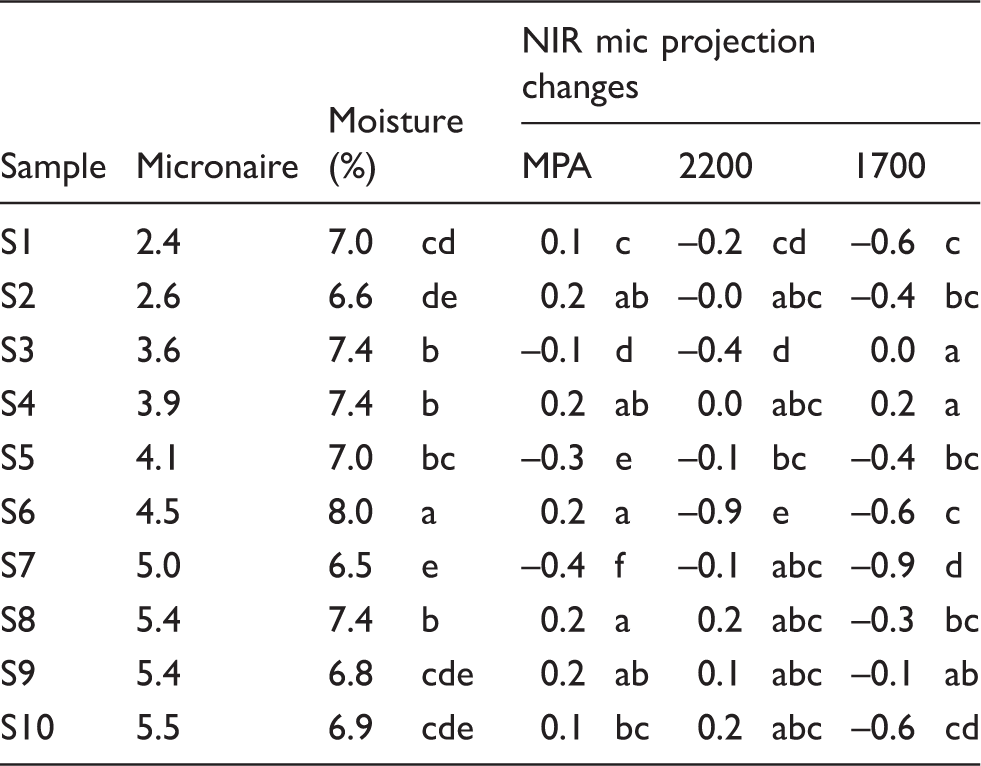
Significant at p < 0.05; values with the same letter are not significantly different from each other.
MPA: MultiPurpose Analyzer.
The sample effect analysis averaged all T and RH combinations/treatments and compared all 10 cotton samples between each other, and it compared the three spectrometers between each other (Table 4). The P1 instrument was the most impacted and yielded only three samples within the acceptable ±0.3 mic units range. The P2 instrument was less impacted than the P1 instrument and had only two samples outside the ±0.3 mic units range. The B1 instrument was the least impacted by moisture, yielded the most stable micronaire projections/results, and had only one sample outside the ±0.3 mic units range. The NIR mic measurements for all instruments detected mic differences between the samples, but the accuracy of NIR mic projections for the P1 instrument was the most impacted especially at higher T and RH environments.
The fiber moisture content interaction effect of temperature (T) by relative humidity (RH) of all treatments is shown in Figure 10. Figure 10 visualizes the fiber moisture content data presented in Table 4 separated by treatment and sample (micronaire). The treatments with the highest RH contained the highest fiber moisture content, as expected. This is closely followed by the treatments with the second highest RH. It also illustrates that the treatments with the lowest T/RH had the lowest fiber moisture. The data analyses demonstrated that there is an interaction (T*RH) effect, meaning that fiber moisture content is affect by both relative humidity and temperature, although most likely not equally. In the T*RH effect studies, it is of interest to determine which variable (T or RH) is the most impactful on the NIR mic projections.
Fiber moisture content for all samples by treatments, all T-RH treatments.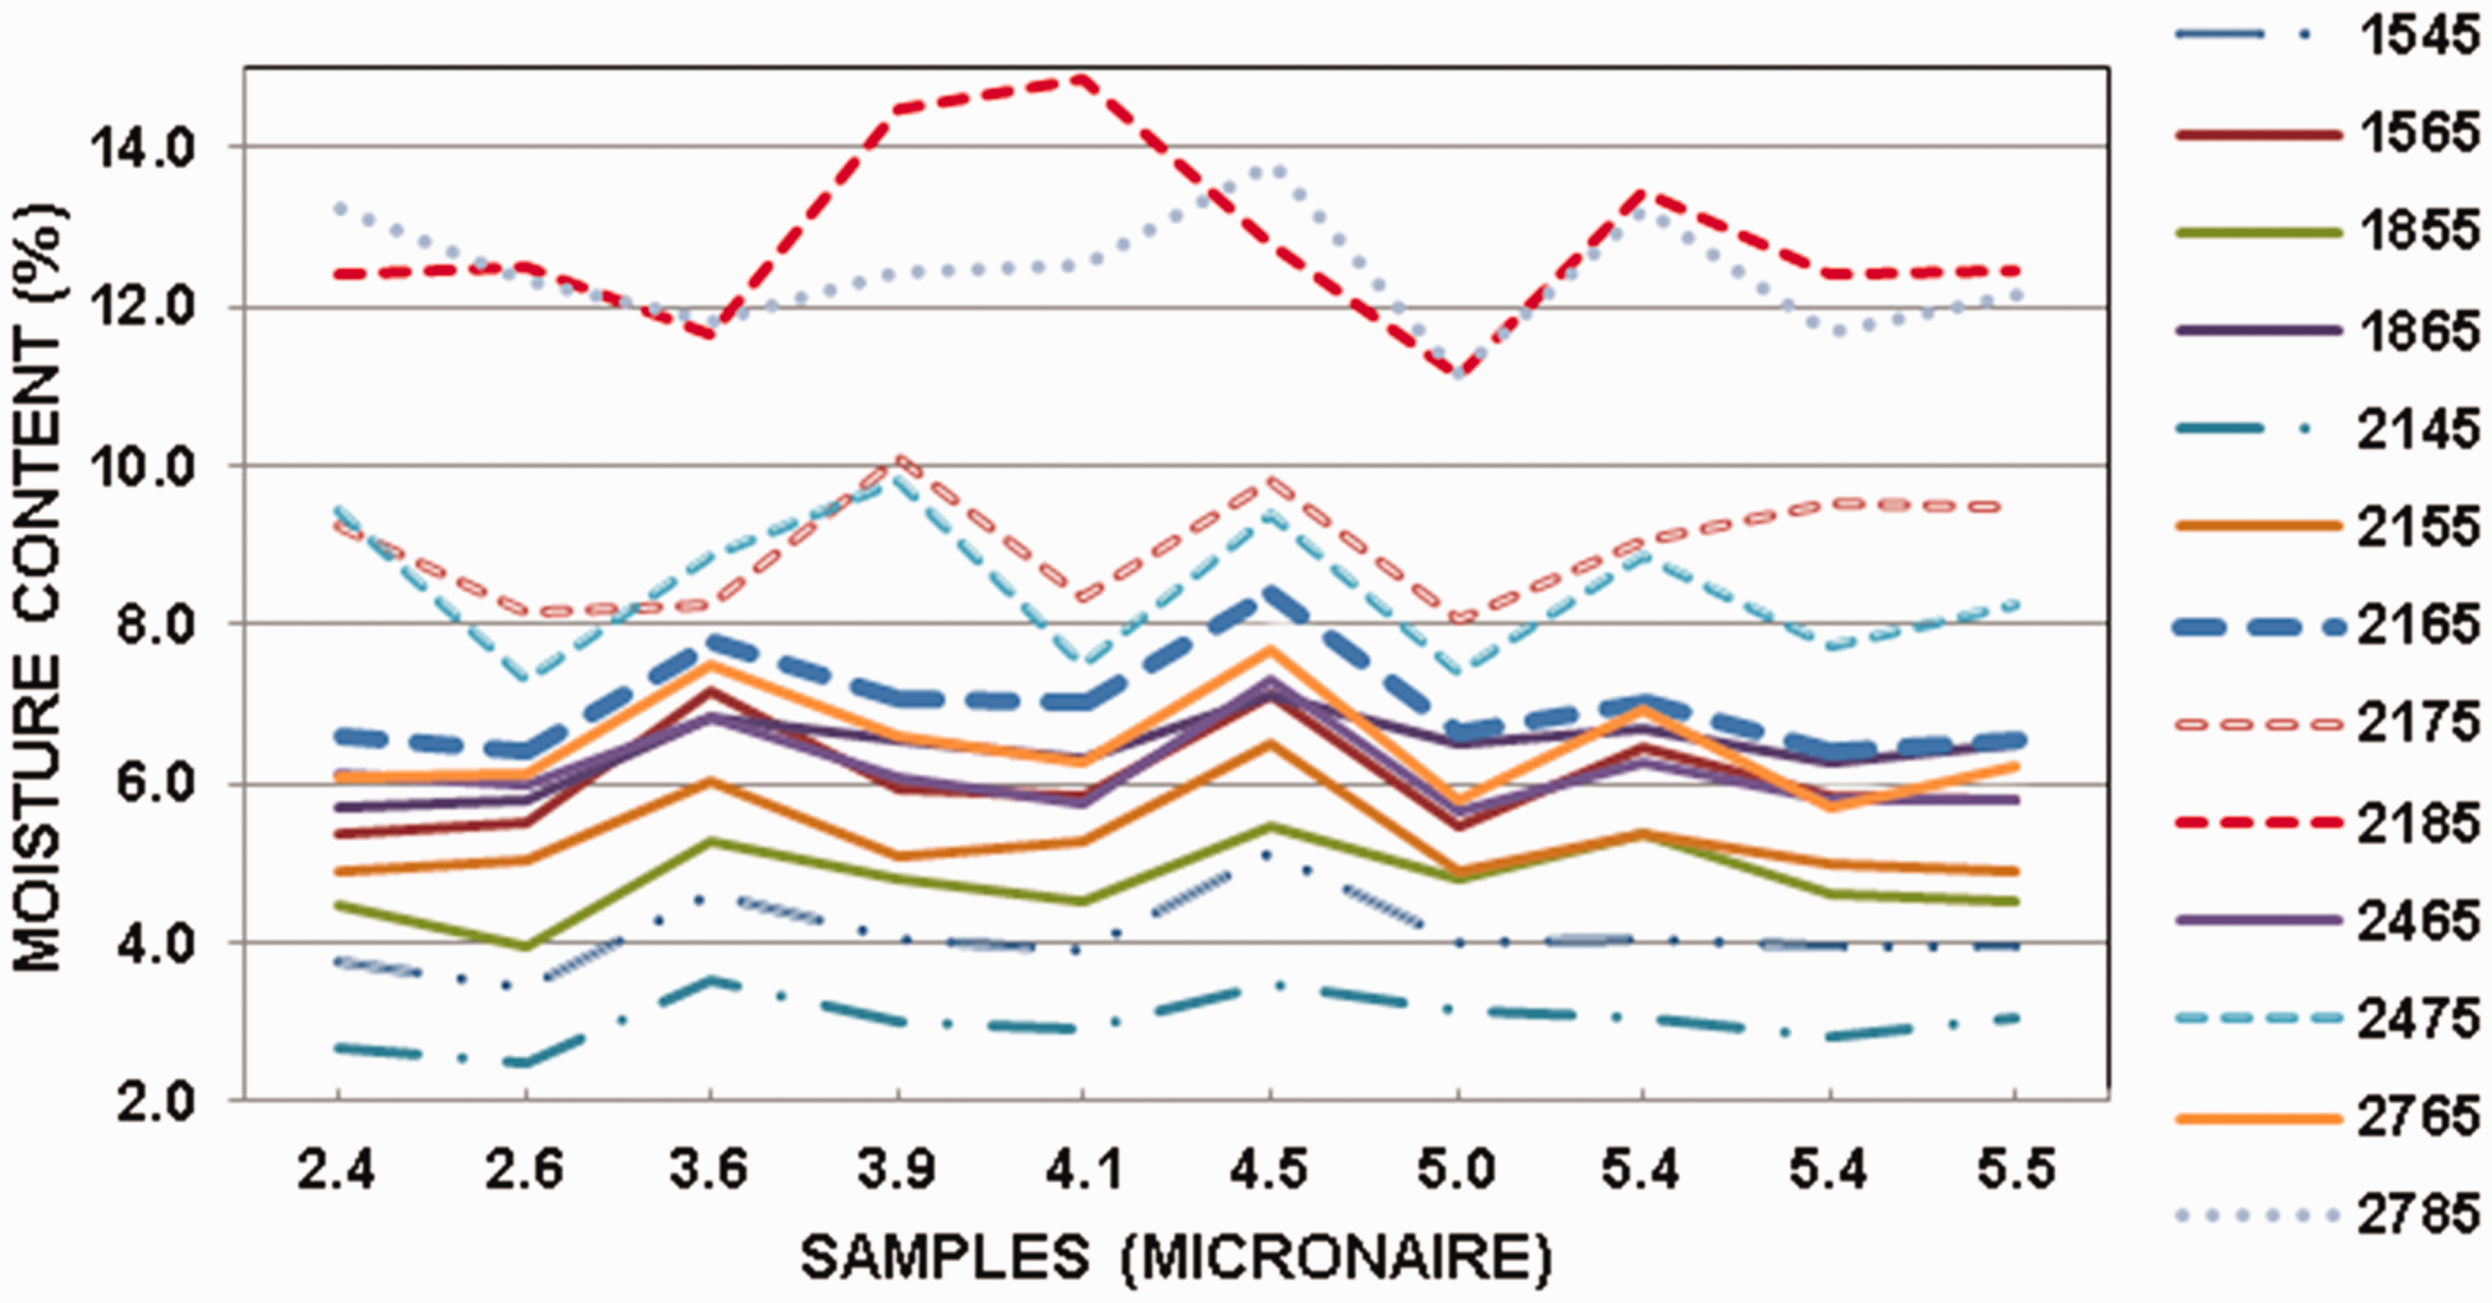
Fiber moisture at constant temperature (21℃)
Relative humidity RH effect at constant T = 21℃, varying RH, average of all cotton samples at each RH

Significant at p < 0.05; values with the same letter are not significantly different from each other.
NIR: near infrared; MPA: MultiPurpose Analyzer.
The fiber moisture content was statistically different among all relative humidity treatments (p < 0.05; Table 5), and it distinctively indicated that, at higher RH levels of 75% and 85%, the fiber contains higher fiber moisture of 9.0% and 12.8%, respectively. The fiber moisture content range between the lowest RH treatment (3.0%) and the highest RH treatment (12.8%) was of almost 10%. As expected, the fiber moisture content at the standard conditions of T = 21℃ and RH = 65% was approximately 7.0%.
As previously noted, a micronaire outlier was designated as samples in which the difference between the HVI micronaire and NIR measured micronaire was >±0.3 mic units.29,33 The NIR spectral data results of these five treatments, shown in Table 5, were similar to the results observed in Table 3, with the primary difference being the specific letter grouping of significant differences. As observed previously, all three NIR instruments were affected by non-standard RH (not 65%) at constant T (21℃), with negative deviations at high RH and positive deviations at low RH. The B1 instrument was the least impacted and was consistently on target with NIR mic projections when RH = 75% or lower. The P1 instrument was the most impacted, followed by the P2 instrument, in treatment environments with RH beyond 10% above or below RH = 65%. The impact of RH treatments indicates that RH has a large influence on fiber moisture and, therefore, impacts the NIR mic measurement.
Effect of relative humidity RH by sample at T = 21℃, average of all cottons at each RH
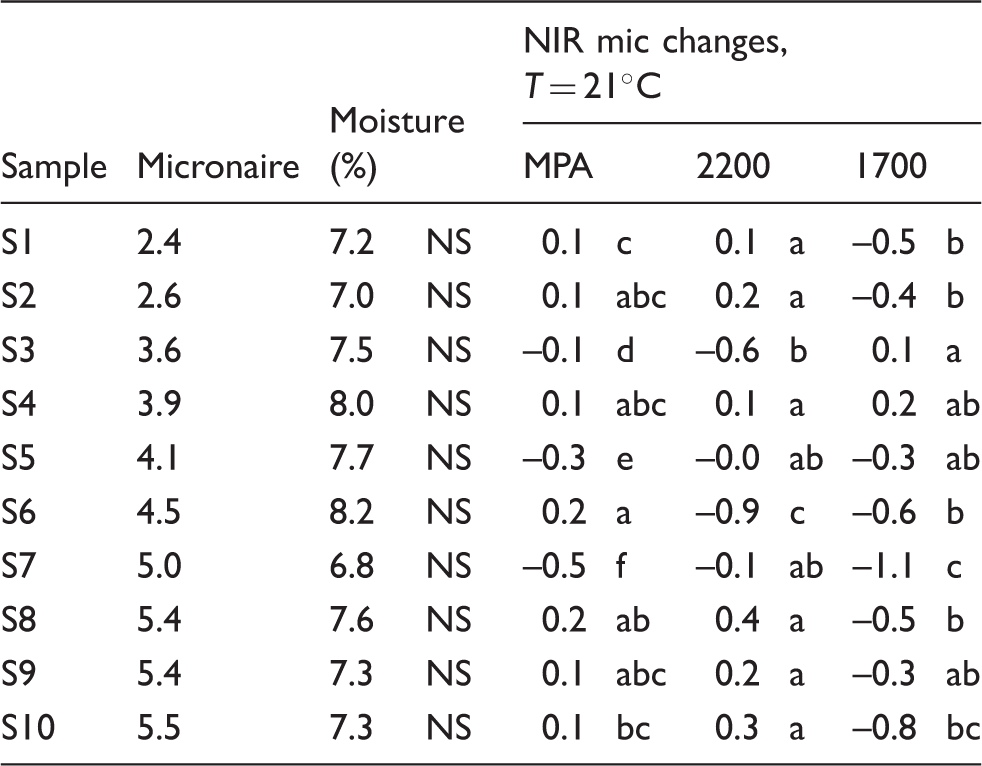
Significant at p < 0.05; values with the same letter are not significantly different from each other.
NS: not significant; NIR: near infrared; MPA: MultiPurpose Analyzer.
At 21℃, the sample effect was significant for all three NIR mic projections (Table 6). It is important to note that both Tables 4 and 6 yielded similar trends on the NIR mic projections, and Table 6 shows that at a constant temperature (21℃), the P1 instrument was the most impacted by RH and projected only four samples within the acceptable ± 0.3 mic units range. The P2 instrument was less impacted and had only three samples outside the ± 0.3 mic units range. The B1 instrument was the most consistent and least RH impacted instrument, with only one sample projected outside the ±0.3 mic units range.
Figure 11 visually illustrates the effect of high RH on fiber moisture and NIR mic projections using each of the three spectrometers to measure sample S2. Figure 9 exhibits the ascending effect of treatments with lower T and RH to higher T and RH on fiber moisture, and concurrently the effect of those treatments on NIR mic projections with each of the spectrometers. At constant temperatures, Figure 11 displayed similar trends on the ascending effect of RH on fiber moisture and on NIR mic projections. The P1 instrument and P2 instrument were most impacted at RH 75% and higher. Similar trends and results were observed for the other cotton fiber samples for fiber moisture and NIR mic projections.
Near infrared (NIR) mic projection results and moisture content (MC) at T = 21℃, varying RH, S2.
To complement and further elucidate the moisture level–T/RH relationships and impact on NIR micronaire projections exhibited in Tables 5 and 6, Figure 12 visualizes the effect increasing RH has on fiber moisture for the different samples. Each treatment affected all samples in similar ways, in which all samples had higher fiber moisture content at a higher RH treatment and all samples had lower fiber moisture content at a lower RH treatment. RH treatments ranged by 40% (in 10% RH increments), and Figure 12 clearly visualizes the change in fiber moisture across the range of these RH treatments at a constant (21℃) for individual samples.
Fiber moisture content for all samples at T = 21℃, varying RH.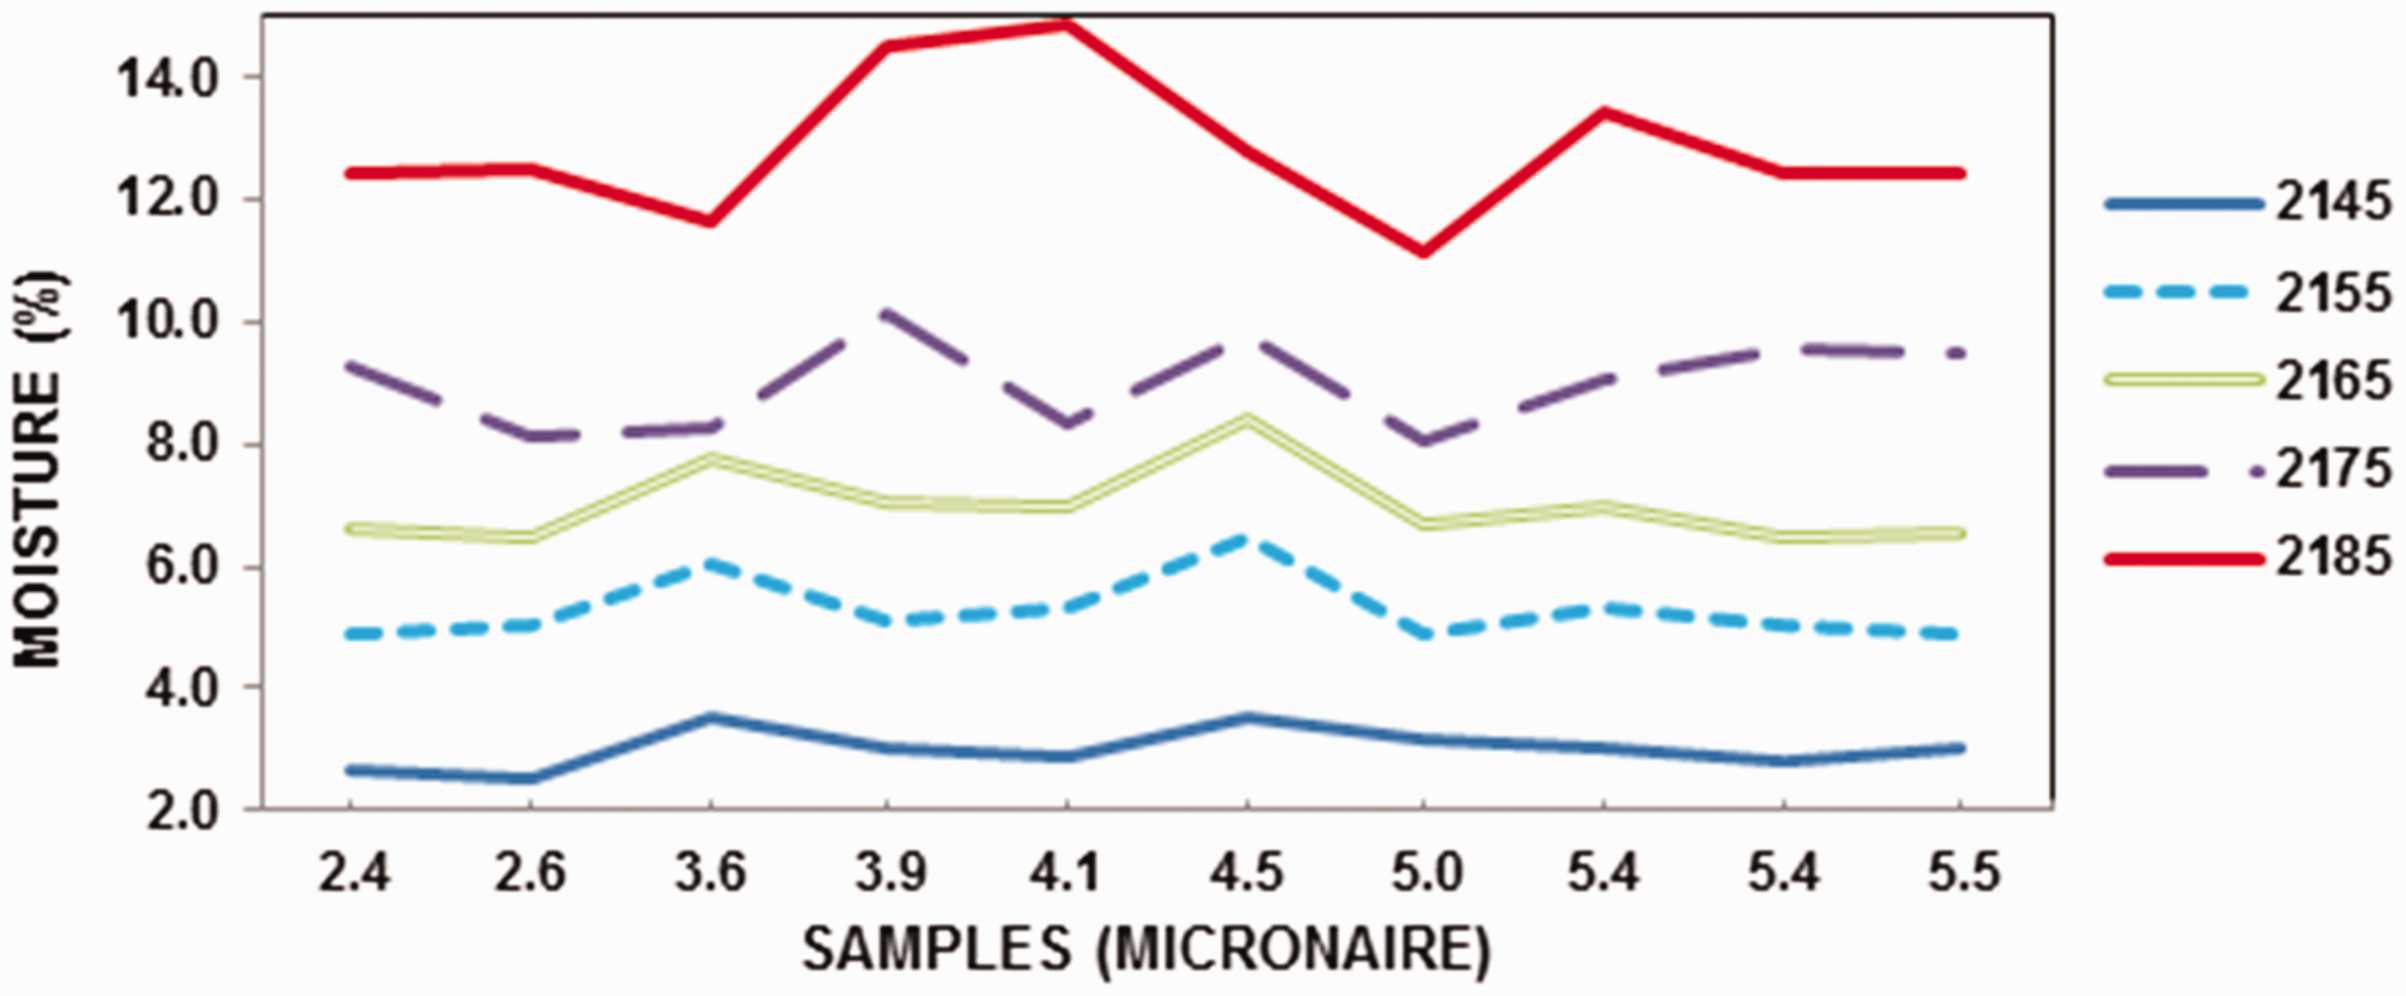
Fiber moisture at constant RH (65%)
Temperature T effect at constant RH = 65%, varying T, average of all cotton samples at each T
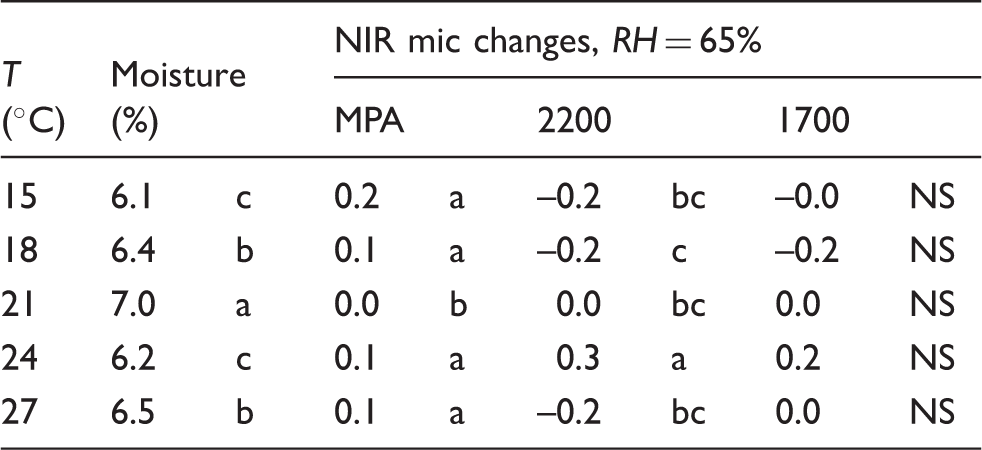
Significant at p < 0.05; values with the same letter are not significantly different from each other.
NS: not significant; NIR: near infrared; MPA: MultiPurpose Analyzer.
The NIR spectra data results of the five treatments averaged across samples are shown in Table 7. At constant RH = 65%, a small number of the NIR mic projections were significantly impacted due to changes of temperature, but these impacts were very small and not of practical significance (all variety-average mic deviations < ± 0.3 mic). The statistical differences among temperature treatments were not significant for the P1 instrument. The B1 instrument and P2 instrument did exhibit significant, but small, statistical differences among treatments at different temperatures. However, although statistical difference with changing temperature was observed for the B1 instrument and P2 instrument mic results at constant RH (65%), the NIR measurements under different temperatures were not practically impacted and did not project NIR mic beyond the target ± 0.3 mic units outlier range.
Effect of temperature T on samples at RH = 65%, varying T
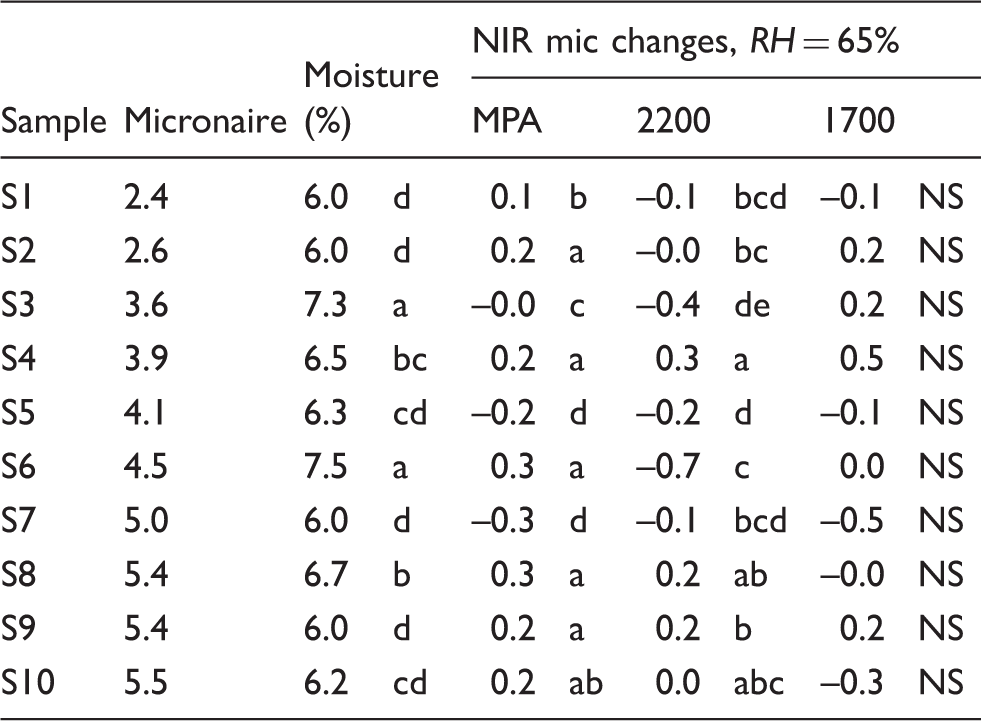
Significant at p < 0.05; values with the same letter are not significantly different from each other.
NS: not significant; NIR: near infrared; MPA: MultiPurpose Analyzer.
Statistically, the P1 instrument yielded no NIR mic projection difference among samples at a constant RH = 65%, but practical significance was shown with two outliers (>±0.3 mic unit difference). The B1 and P2 instruments yielded statistical differences on NIR mic with all samples (Table 8), but these statistical differences were small and normally <±0.30 mic units difference. The NIR micronaire projection results of these five treatments shown in Table 8 are not similar to those observed in Table 4. At a constant RH = 65%, the P1 instrument projected only two samples outside the acceptable ± 0.3 mic units range. The P2 instrument had two samples outside the acceptable ±0.3 mic units range. The B1 instrument had only one sample projected outside the ±0.3 mic units range. The low number of outliers at constant RH/varying T compared to the higher number of outliers (and higher positive and negative deviations) at constant T/varying RH establishes that the RH impact on the NIR micronaire projections was much greater than the T impact. Further, the variable with the greatest impact on the NIR micronaire projections was RH.
Figure 13 visualizes the effect of the temperature treatments at a constant RH (65%) on different samples fiber moisture. As indicated in Tables 7 and 8, the range and variation of fiber moisture with these treatments at a constant RH and varying T (Figure 13) is minimal in relation to the range and variation of fiber moisture for samples at a constant T and varying RH (Figure 12). At a constant RH (65%), all fiber samples responded in similar ways (Figure 13), but fiber moisture was impacted only to a small extent by differences in temperature.
Fiber moisture content for all samples at RH 65%, varying T.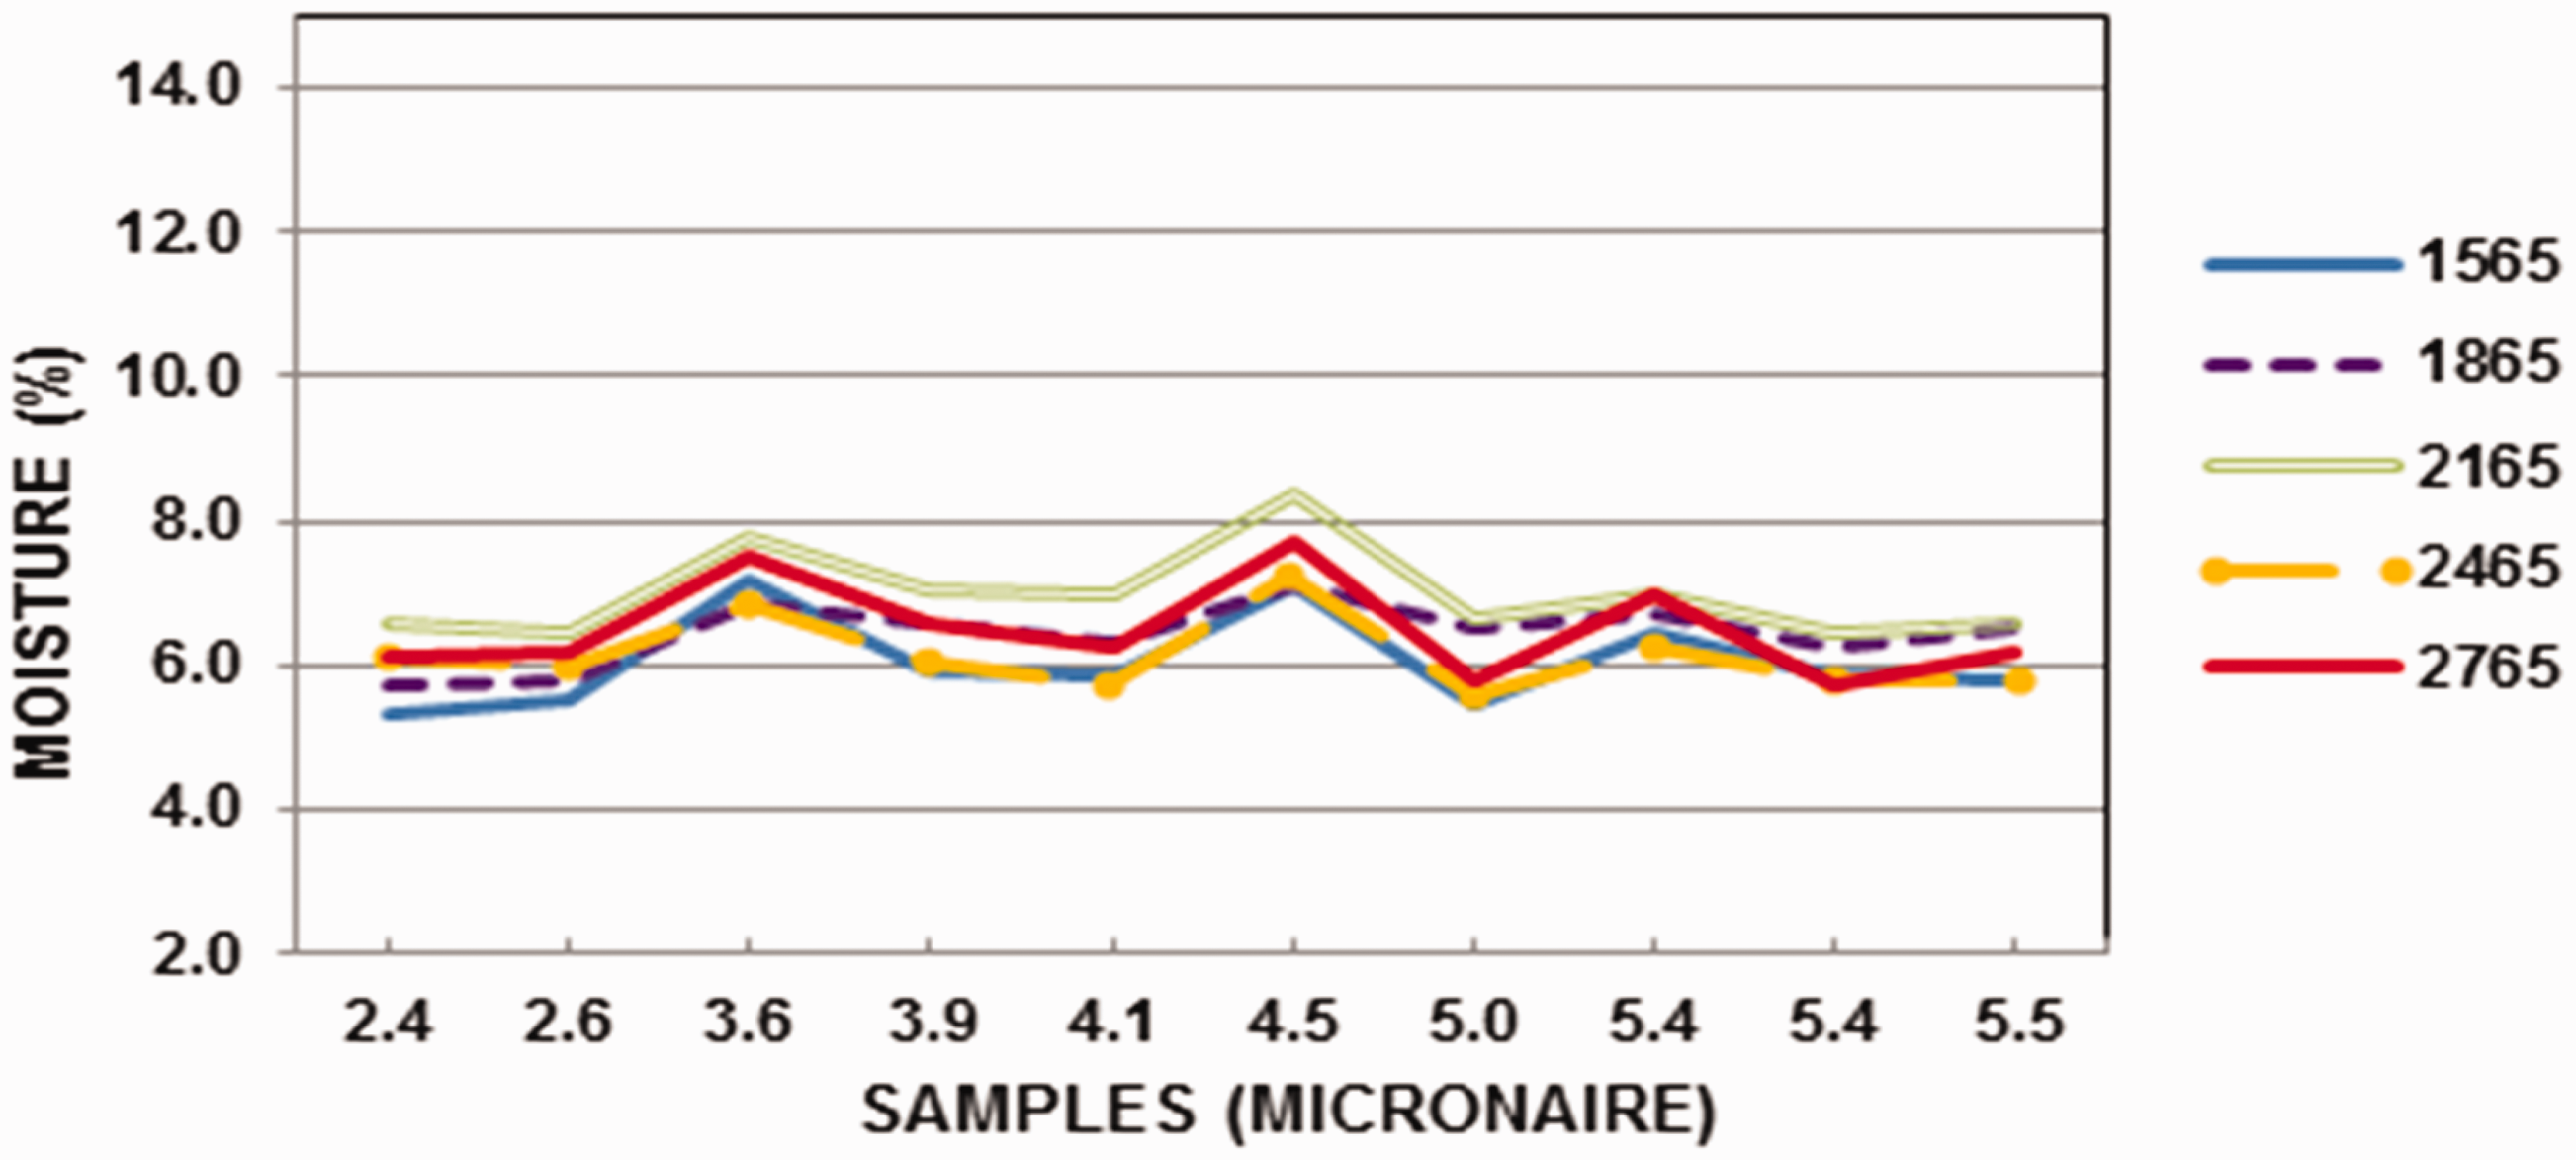
Conclusions
The impacts of fiber conditioned under different environmental conditions (temperature T and relative humidity RH) on the NIR micronaire results were investigated on three NIR instruments for 13 T/RH treatments, with the standard condition of 21℃ and 65% RH serving as the reference condition. The changes in T/RH conditioning significantly impacted the fiber moisture content, with as much as 10% moisture difference between the highest and lowest T/RH treatments. Distinct spectral differences were observed with changing fiber conditioning (and resulting moisture level), with the largest impacts occurring for changes in RH. All three NIR spectrometers were able to spectrally discern differences among treatments, and all three were affected by the T and RH conditioning of the fiber, although the bench-top, laboratory NIR instrument was less impacted. The NIR micronaire results were impacted by the fiber T/RH conditioning, with the bench-top NIR instrument (∼800–2500 nm) being the least impacted (fewest outliers and deviations; most consistent), followed by the higher wavelength portable NIR instrument (∼1160–2160 nm); the lower wavelength portable NIR instrument (∼910–1680 nm) was the most impacted by T/RH changes. Potential rationales for the increasing number of outliers with the portable NIR instruments are the lack of bench-top quality components (e.g., detector) and, for the lower wavelength portable instrument, the absence of the ability to monitor and include in calibrations the moisture peak at ∼1930 nm. The largest deviations (and number of outliers) in micronaire occurred at fiber conditioning/treatments above 21℃/65% RH on samples that exhibited the highest fiber moisture content. Changes in the environmental conditions resulting from higher RH were more impactful on the NIR spectral and micronaire results than the changes in the T environments alone. The objective to determine the effects and impacts on the NIR micronaire results of non-standard T and RH environmental conditions, and resulting fiber moisture content changes with changing T and RH, was achieved. These results provide a rationale for the deviations observed previously in NIR micronaire results for outside the laboratory micronaire measurements with portable NIR units. Thus, for outside of the laboratory NIR fiber measurements of micronaire, considerations for fiber moisture impacts should include provisions for moisture corrections and/or inclusion in calibration development, especially for instruments with a maximum wavelength of <2000 nm.
Footnotes
Disclaimer
The use of a company or product name is solely for the purpose of providing specific information and does not imply approval or recommendation by the USDA to the exclusion of others.
Acknowledgements
The authors wish to acknowledge Ms Jeannine Moraitis for her outstanding work in support of this research.
Declaration of conflicting interests
The authors declared no potential conflicts of interest with respect to the research, authorship, and/or publication of this article.
Funding
The authors received no financial support for the research, authorship, and/or publication of this article.