
Abstract
Yarn packing density is an important parameter in correlating the internal structure of the yarn to its final properties and performance. The current methods of determining the yarn packing density have three main drawbacks: they are labor dependent, they are time consuming, and they approximate many parameters of the fibers and the yarn. The current work utilizes the Chan-Vese (CV) segmentation model to detect the actual contours of the yarn and the fibers inside its cross-section. This algorithm allows the automation of the process which reduces the time required for the analysis and makes it independent from the human element. The method also avoids the approximations involved in the traditional methods by calculating the actual areas of the fibers and the yarn which makes it more precise in determining the yarn packing density. A user-friendly graphical user interface (GUI) was developed to utilize the CV algorithm and calculate different yarn parameters such as the yarn's radial packing density, the yarn's effective diameter, and the yarn's effective packing density. The area ratio factor (ARF) was used as a quick indicator of the accuracy of fiber segmentation. The CV algorithm was described in detail and tested with ring-spun yarns from different materials and the results were found to be in agreement with the reported values of such yarns. The introduced method can be extended to the evaluation of fibrous materials other than yarns.
Keywords
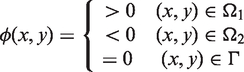
Yarn packing density is a description of the internal yarn structure and the relative arrangement and distribution of fibers inside the yarn.1–3 It is one of the major parameters that reflect the effect of yarn processing and technology on the yarn structure and its final properties.4–8 Yarn packing density (μ) can be defined as the ratio between the fibers volume and the total volume of fibrous assembly, where μ ε <0,1>. The fiber's volume fraction can be used alternatively in the literature to refer to the term packing density. Instead of its use in volumetric terms, it can also be interpreted as the ratio between the area of the fibers in a yarn cross-section (the substance area Sc) and the total cross-sectional area of yarn (S) that includes the substance area and the air-gaps between fibers. The cross-section can be divided into many annular rings and the packing density of the individual sectors can be evaluated. The relationship expressing yarn packing density as a function of the radius (r) is called the radial packing density μ(r).
According to the Internal Standards IS 22-103-01/01,
9
the yarn packing density can be determined using two experimental methods which were found to be highly comparable: the direct method and the secant method. The direct method depends on tracing the borders of the fibers in the cross-sectional image using a special image processing software (e.g. LUCIA system) to create the real contours of the fibers. The center of gravity for each fiber is manually approximated in this method and the coordinates of these centers (xi,yi) are used to calculate the yarn center (x0,y0). The median of the centers' coordinates is used in determining the yarn center (rather than their arithmetic mean) because the median is not sensitive to the random positioning of the fibers. Rings of fixed thickness and centered at the calculated yarn center are constructed in the yarn image as shown in Figure 1 and the area of the fibers (Scj) inside each ring (j) is calculated and divided by the area of the jth ring to calculate the radial packing density (μr), that is
Calculation of the radial packing density.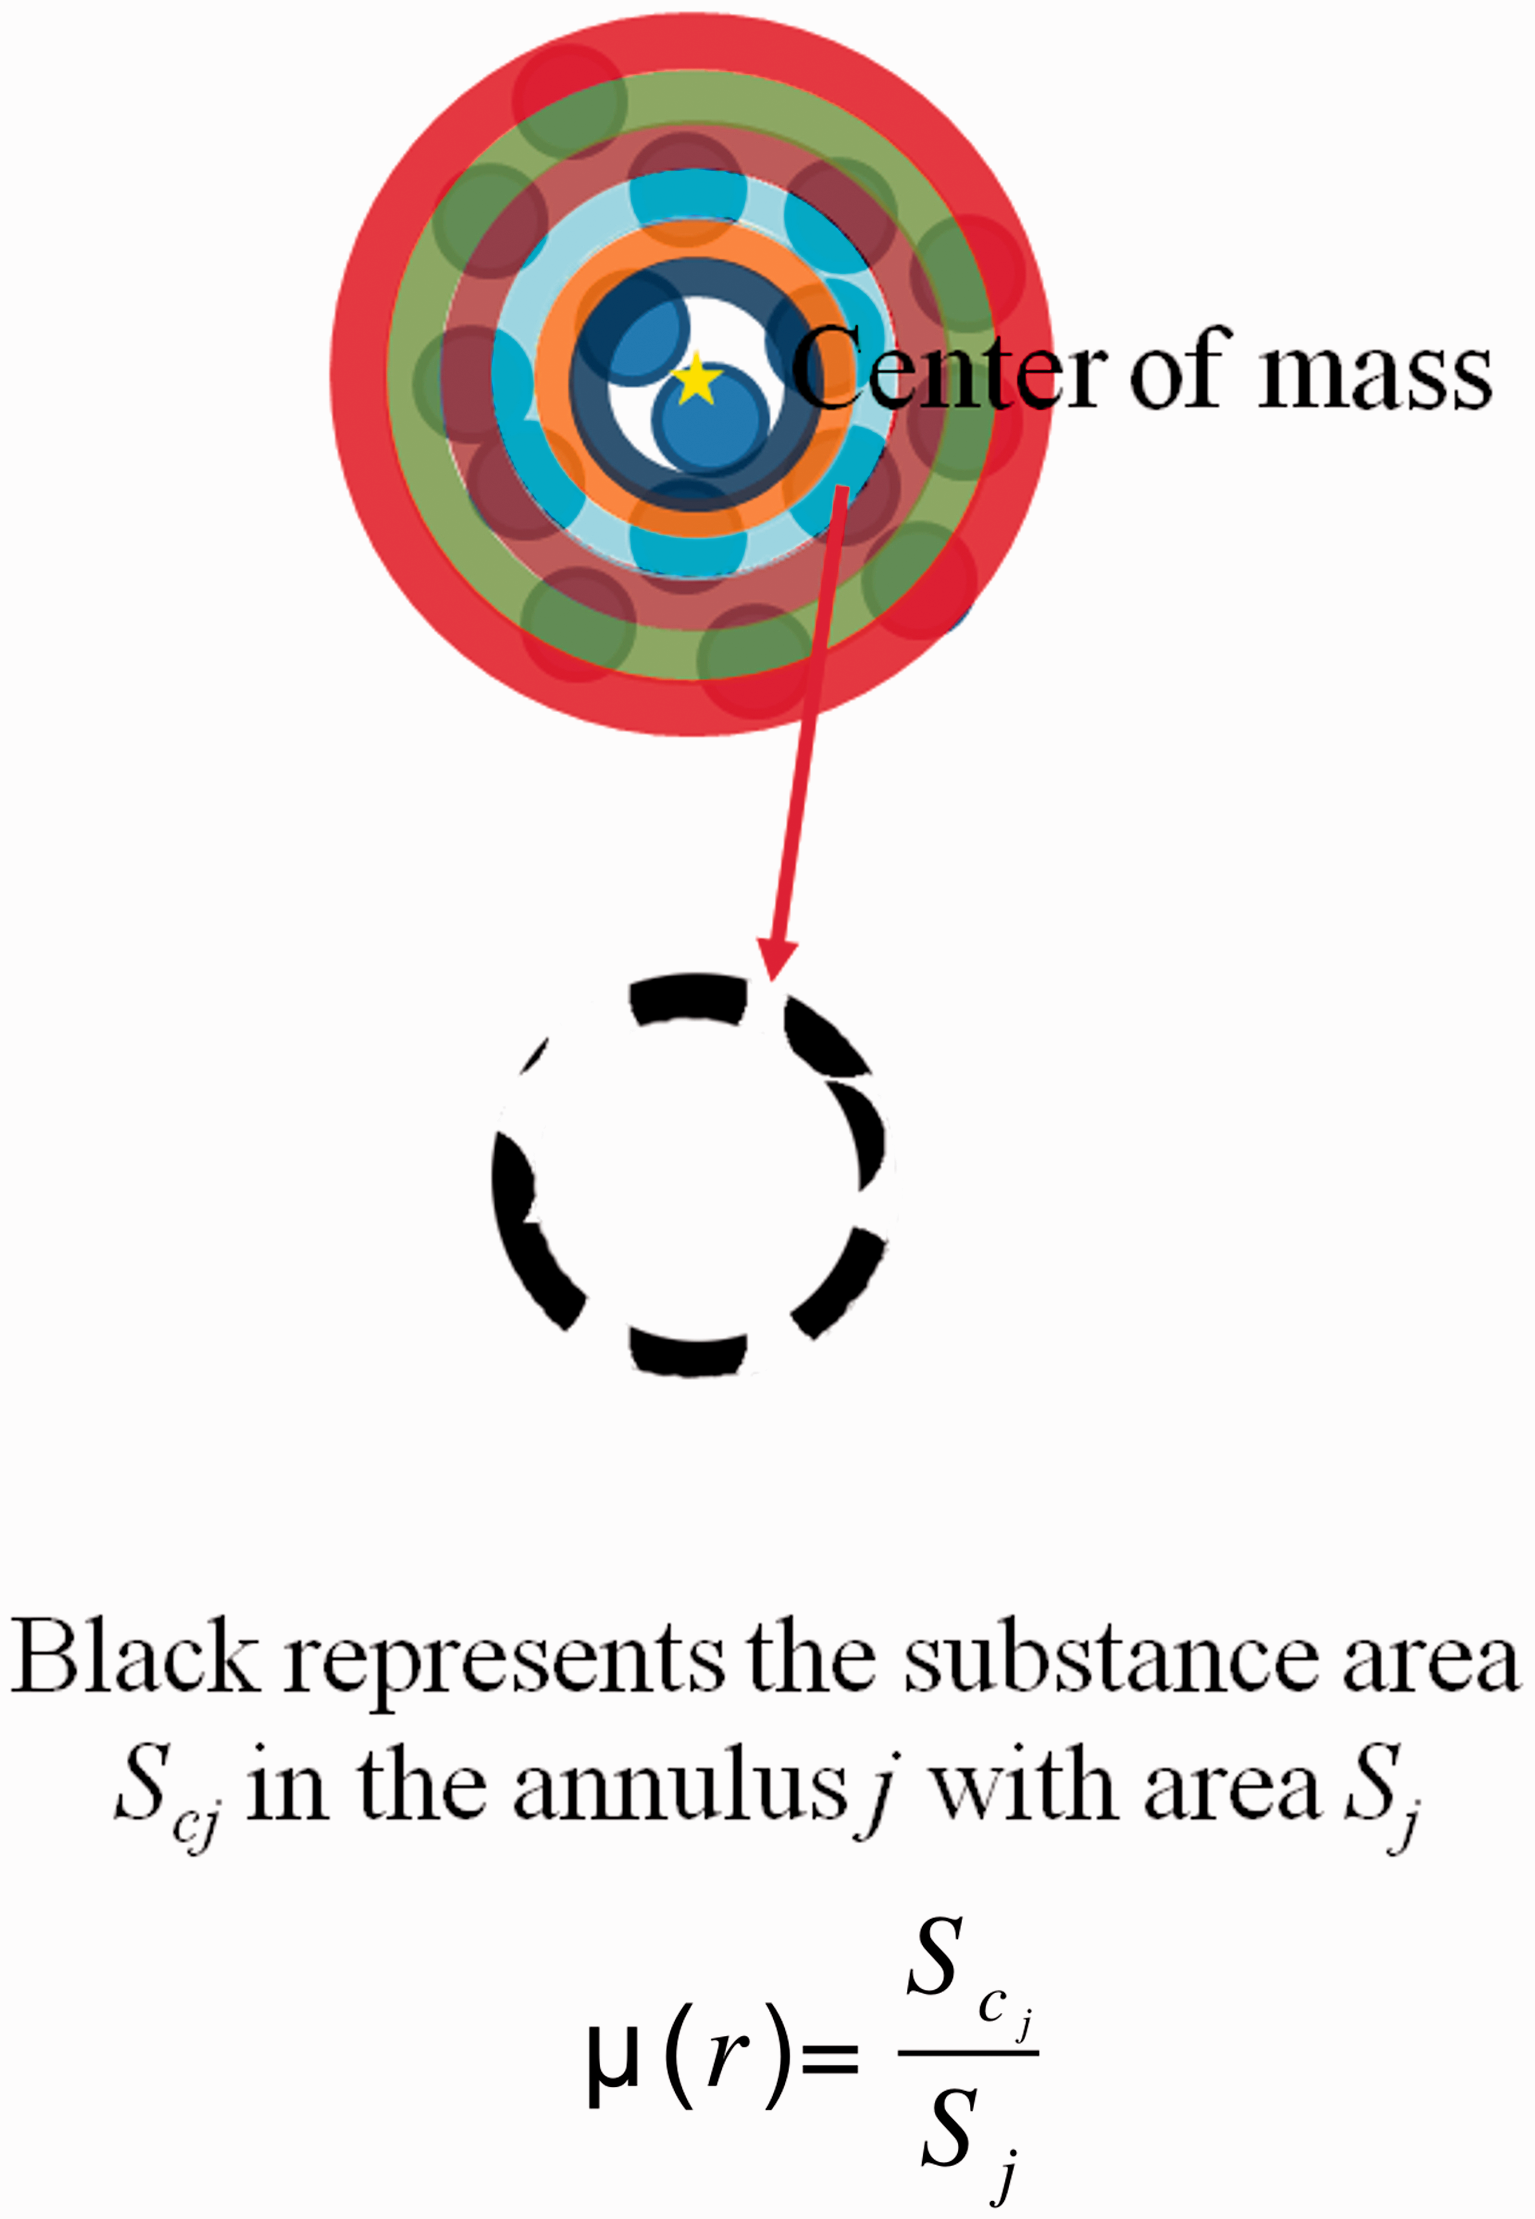

The effective yarn diameter (def) was found from the databases of measurements for different ring-spun and rotor-spun yarns that it corresponds to the yarn diameter at a radial packing density in the range between 0.15 and 0.17.10,11 The effective yarn diameter can be estimated by interpolating the measured values of radial packing density μ(r) at the given packing density. The effective yarn packing density μef can then be calculated as the ratio between the total fiber area (Sf) and the area of a circle with a diameter equals the calculated effective diameter (Sef) as follows:

The secant method, on the other hand, follows the same calculation procedures of the direct method but it does not use the actual shape of the fiber’s cross-section. The secant method substitutes the fibers with circles that are centered at the center of gravity of the individual fibers and having areas calculated from the fibers' fineness, density, position, and yarn twist. Secant method is suitable for cotton yarns or other highly twisted yarns, where it is difficult to recognize the individual contours of fiber. This procedure is not recommended, however, for yarns with a relatively high number of fibers in the cross-section (e.g. more than 200 fibers), unless all fiber contours can be focused during their imaging.
The above-described methods of evaluation suffer from some corrections and approximations (such as the fibers' centers coordinates) that lead to less accurate values. Therefore, this work suggests a segmentation method that detects the actual geometries and cross sectional areas of the fibers and the yarn. The method detects the fibers and the yarn perimeters using automatic image processing and analysis techniques then allows the user to edit the detected edges for more precise adjustment. The suggested algorithm utilizes the detected images to calculate the yarn radial packing density, the effective yarn packing density, the effective yarn diameter, and the total number of fibers inside the yarn.
Methods
Since the packing density is the ratio between the area of the fibers inside the yarn and the yarn’s cross-sectional area, it is necessary to segment the image for calculating these two areas. Segmentation of images based on the variational methods
12
can be obtained by minimizing the appropriate cost functionals.
13
Therefore, for an image (I) with

In this study, the Chan-Vese (CV) model15,16 for active contours was used to detect the boundaries of the yarn in a given cross-sectional image. The CV model is based on techniques of curve evolution, Mumford–Shah functional for segmentation, and utilizes level sets13,17 to facilitate the solution.
18
In the level set formulation, the problem becomes a “mean-curvature flow” which results in evolving the active contour until a stop condition is met on the desired boundary. Because most classical snakes and active contour models rely on the edge function (might be calculated from the image gradient
CV segmentation model
The objective of the CV model is to partition the input image with a domain CV segmentation model.
To achieve this image partitioning, a cost (or objective) function is created and minimized. There are different models for the cost functions where the Mumford-Shah (MS) energy-based model was proven to be efficient. Based on the MS model, Chan and Vese suggested the following energy functional:
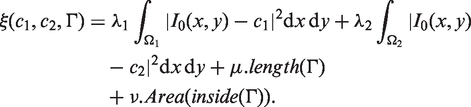
The energy (ξ) consists of two main terms: the data terms (the first two terms in equation (4)), and the smoothness or curvature terms (the last two terms in equation (4)). The “data” terms represent the energy inside and outside the curve Γ that evolutes during the calculation. This data part of the energy is the integration of the squared absolute difference between the intensity of the image at a pixel position x and y (

The energy functional ξ is called curve evolution functional because the regional contour Γ evolves in an active way during this functional minimization. Minimizing the functional ξ maintains the main criteria of the model; that is, the first criterion can be achieved by keeping the data terms at their minimum and the second criterion can be achieved by minimizing the smoothness terms. To solve this minimization problem for curve evolution, the level set method has been used extensively, because it allows for cusps, corners, and automatic topological changes. 16
Level set formulation
The level set method
17
replaces the unknown curve Numerical algorithm for implementing the CV model.
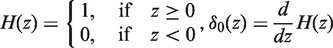
Before substituting for the curve Γ in the energy functional, it can be noticed from equation (4) that the integration is performed over different regions. Therefore, the Heaviside function H is introduced and its derivative as the Dirac delta function
For the application of these functions during the computation, it is necessary to regularize them by their consideration over an infinitesimal interval
Because the function φ has certain values at each region, taking it as an argument of the Heaviside function (

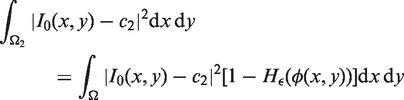

Therefore, by the application of the level set function, and unlike the expression of the energy functional

By minimizing the energy (

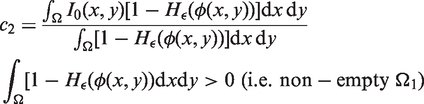
To solve the minimization problem of ξ in equation (12), the constants c1 and c2 are kept constant and the associated Euler–Lagrange equation is deduced. Parameterizing the descent direction by an artificial time
Numerical implementation of the model
The regularized Heaviside function (

The solution for equation (15) can be accomplished numerically using the finite difference implicit scheme for discretization. Let the step in the space domain be the interval h and in the time domain be the interval


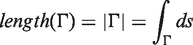
Equation (18) transformed equation (15) from a PDE into a system of linear algebraic equations that can be solved using the iterative methods of linear algebra. For any input figure that needs to be segmented, the whole model can be applied and solved using the algorithm outlined in Figure 3.
Experimental setup
Yarn and fiber specifications

The standard preparation method can be briefly described as the yarn is soaked in a solution of a dispersion glue and a surfactant in a 1:1 concentration ratio. The 1,4-bis(2-ethylhexyl) sulfosuccinate (also known as Spolion 8) surfactant was used as a dispersion and wetting agent in a concentration of 5 g/l. The applied glue was a universal Gama Fix Henkel which is available in office supply stores. After immersing the yarn in the mixed solution of the glue and the surfactant, the yarn sample is dried in standard atmospheric conditions for 24 hours. The yarn is then immersed only in the glue and dried at the same conditions. After drying, the yarn sample is embedded in a 2:3 mixture of bee’s wax and paraffin, respectively, to form a mold block with dimensions of 3 cm × 1.5 cm. The sample mold is then left to solidify and placed in a freezer at –8℃ for 24 hours. After its hardening and solidification, the sample is ready for slicing into thin slices of 15 µm thickness using a microtome. The cross-sectional slice is then placed on a transparent slide and the wax is dissolved by adding few drops of xylene. The image acquisition is performed using the CCD camera installed on a Nikon microscope and attached to a computer. The acquired images were enhanced by transforming the grayscale values using the “contrast-limited adaptive histogram equalization (CLAHE)” algorithm. 20 Three pictures of well-focused samples were processed for each yarn to test the validity of the segmentation method.
Results and discussion
Samples of yarn cross-section are prepared as described in the experimental part and the yarn images are acquired using the camera on the microscope. The acquired yarn images are then introduced to the “Yarn Packing Density (YPD)” software, shown in Figure 4, that was developed to utilize the algorithms described above for calculation. The software reads the image and the user can select the whole image or assign a small region for analysis if the fibers are more concentrated at small part of the image.
Developed GUI for implementing the CV algorithm, YPD.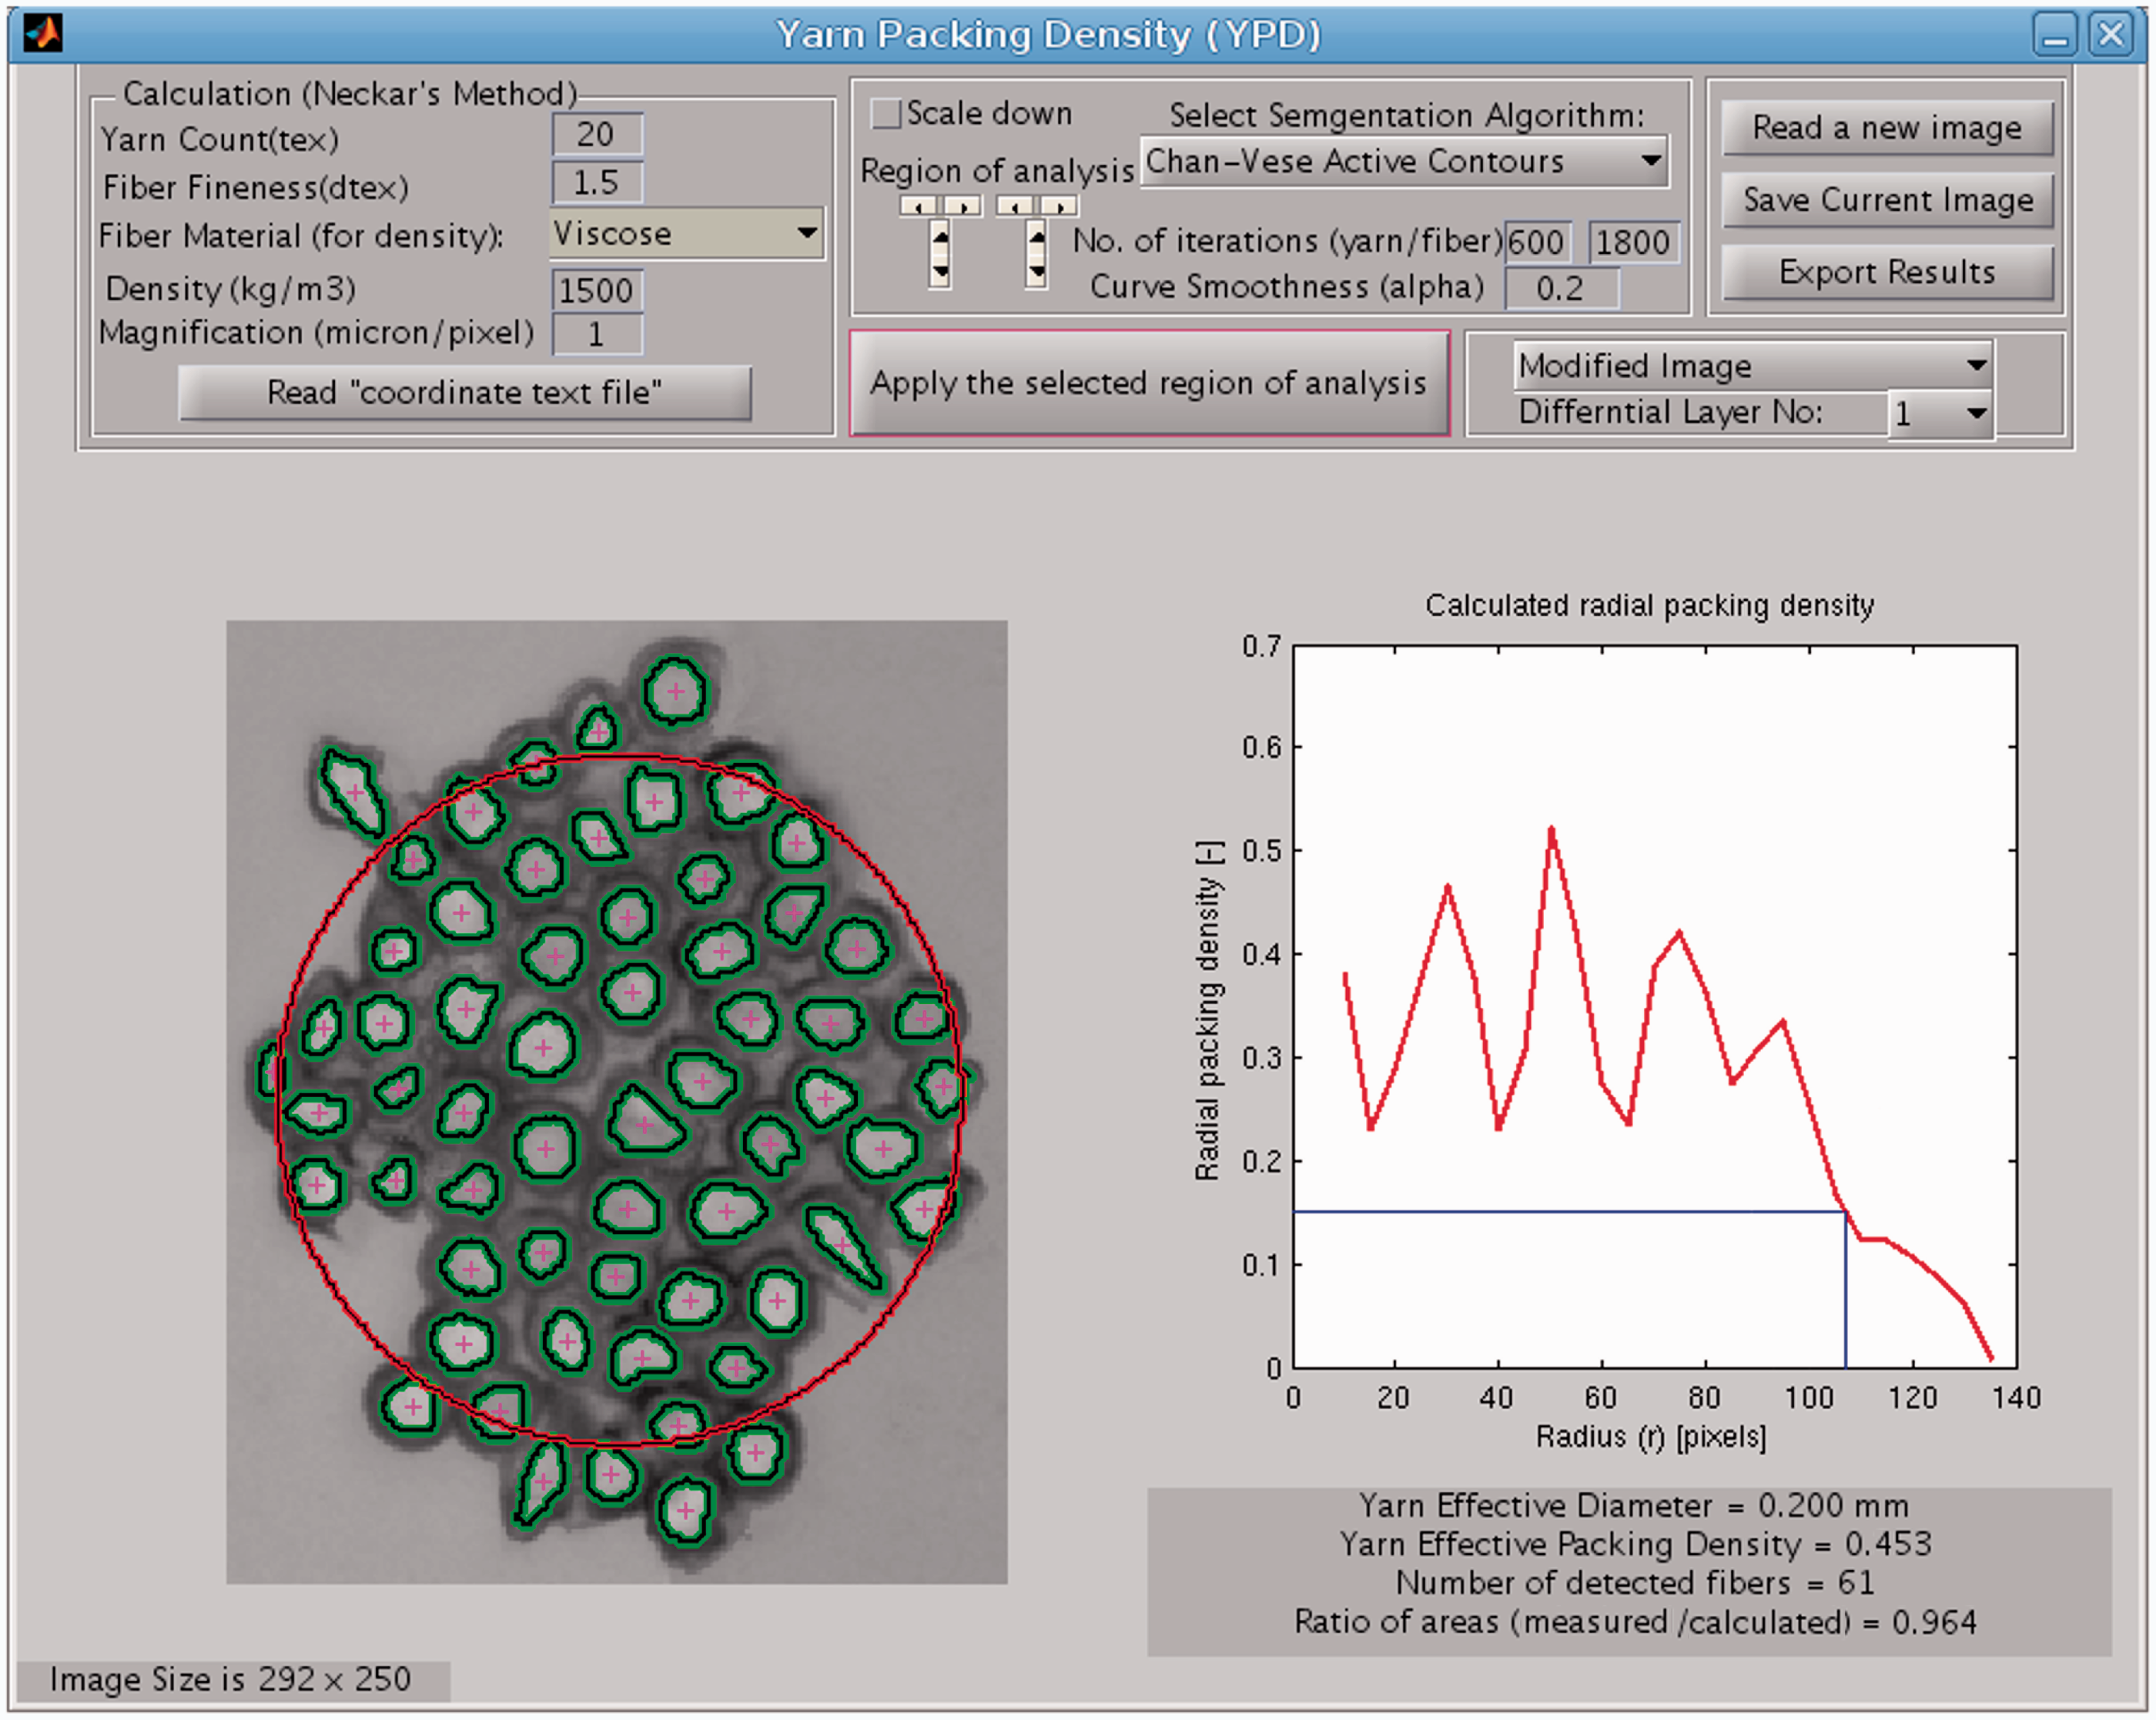
Yarn contour
Once the CV model for segmentation is applied, the program starts with the outside borders of the image as initial conditions which allow the algorithm to stop at the outer contour lines of the yarn. The curve evolution of the algorithm at different iteration cycles is shown in Figure 5 which indicates that the algorithm was able to segment the picture in two regions that represent the image background and the yarn. The algorithm successfully segmented the image after about 300 iterations then no significant change in the yarn contour was detected. The time required for each iteration cycle and the total time required for segmenting the image depends on the image size and the hardware processing capabilities. It is, therefore, one of the drawbacks of this algorithm to take relatively long time during segmenting large size images and while researchers are trying to develop efficient algorithms to process massive amounts of images,
21
this algorithm depends on the image size and the available hardware resources to process the image. To accelerate the processing time of some large images, the program allows the user to choose scaling down the image. By scaling down the picture, the yarn image is resized and the segmentation algorithm is applied on the smaller version then the image is scaled-up again being ready for the next packing density calculations.
Curve evolution of the CV algorithm at different iteration cycles.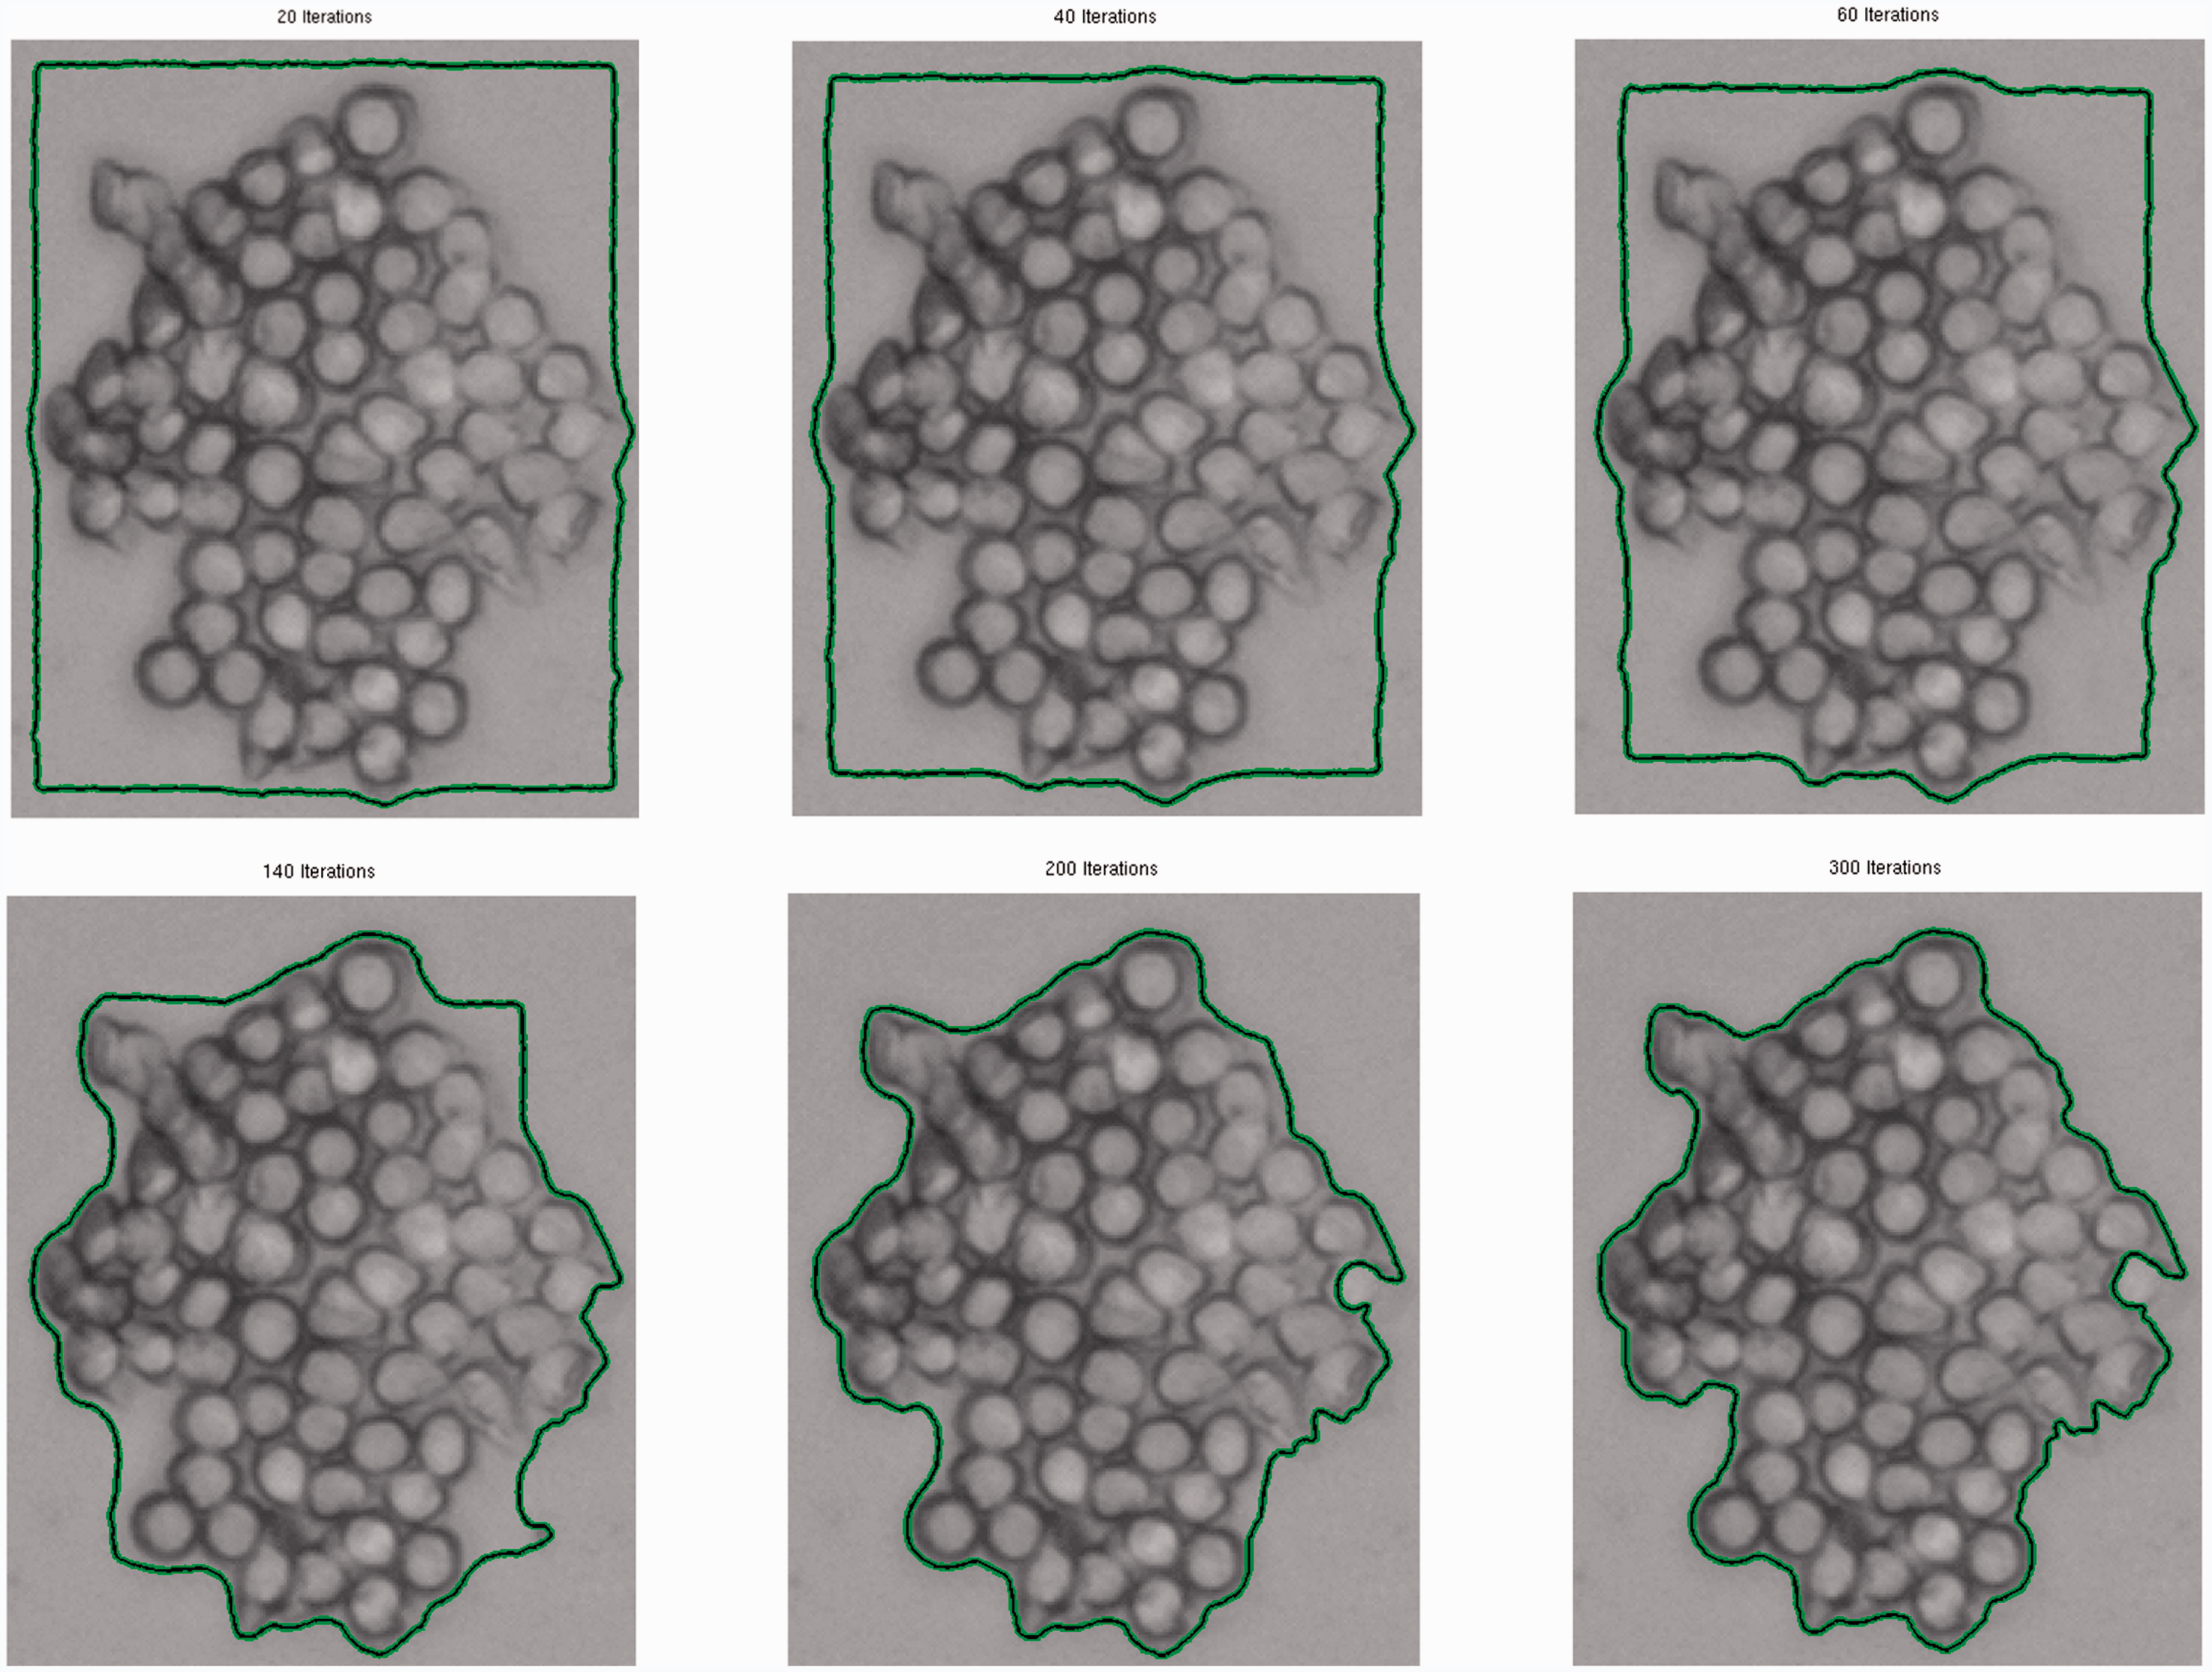
Fibers’ contours
After the determination of the yarn contour, the CV algorithm is applied again to determine the contours of the fibers inside the yarn cross-section. The initial condition for the fibers detection algorithm is a square approximated at the center of the image and propagates towards the edges of the yarn. The fiber detection takes more iteration cycles as the algorithm separates the image into many segments according to the number of fibers in the yarn cross-section. The detected fibers are shown in Figure 6 in binary format and highlighted with red color as superimposed to the yarn cross-sectional image. It can be noticed from this figure that the algorithm is successful in detecting the internal cross-section of the fibers while the walls of the fibers are considered as part of the space surrounding the fibers in the yarn. This can be considered as a source of error in determining the actual yarn packing density and it usually leads to lower values because the total fibers' area (the substance area) is decreased. On the other hand, the currently applied methods that approximate the yarn cross-section to a circle have a similar source of error by adding more area to the actual yarn cross-section. This source of error in the traditional method results in a similarity between the calculated values of our method and the traditional methods. It can also be noticed in Figure 6 that the utilized active contour method allows the detection of fibers with different cross-sectional areas which is not considered by the traditional methods (e.g. the secant method) that approximate the fibers cross-sections to circles with a constant diameter and area.
Lyocell yarn image (left); detected fibers inside the yarn in binary format (middle); highlight of the detected fibers (right) where the red circle shows the calculated effective yarn diameter, and the green points highlight the centers of the detected fibers.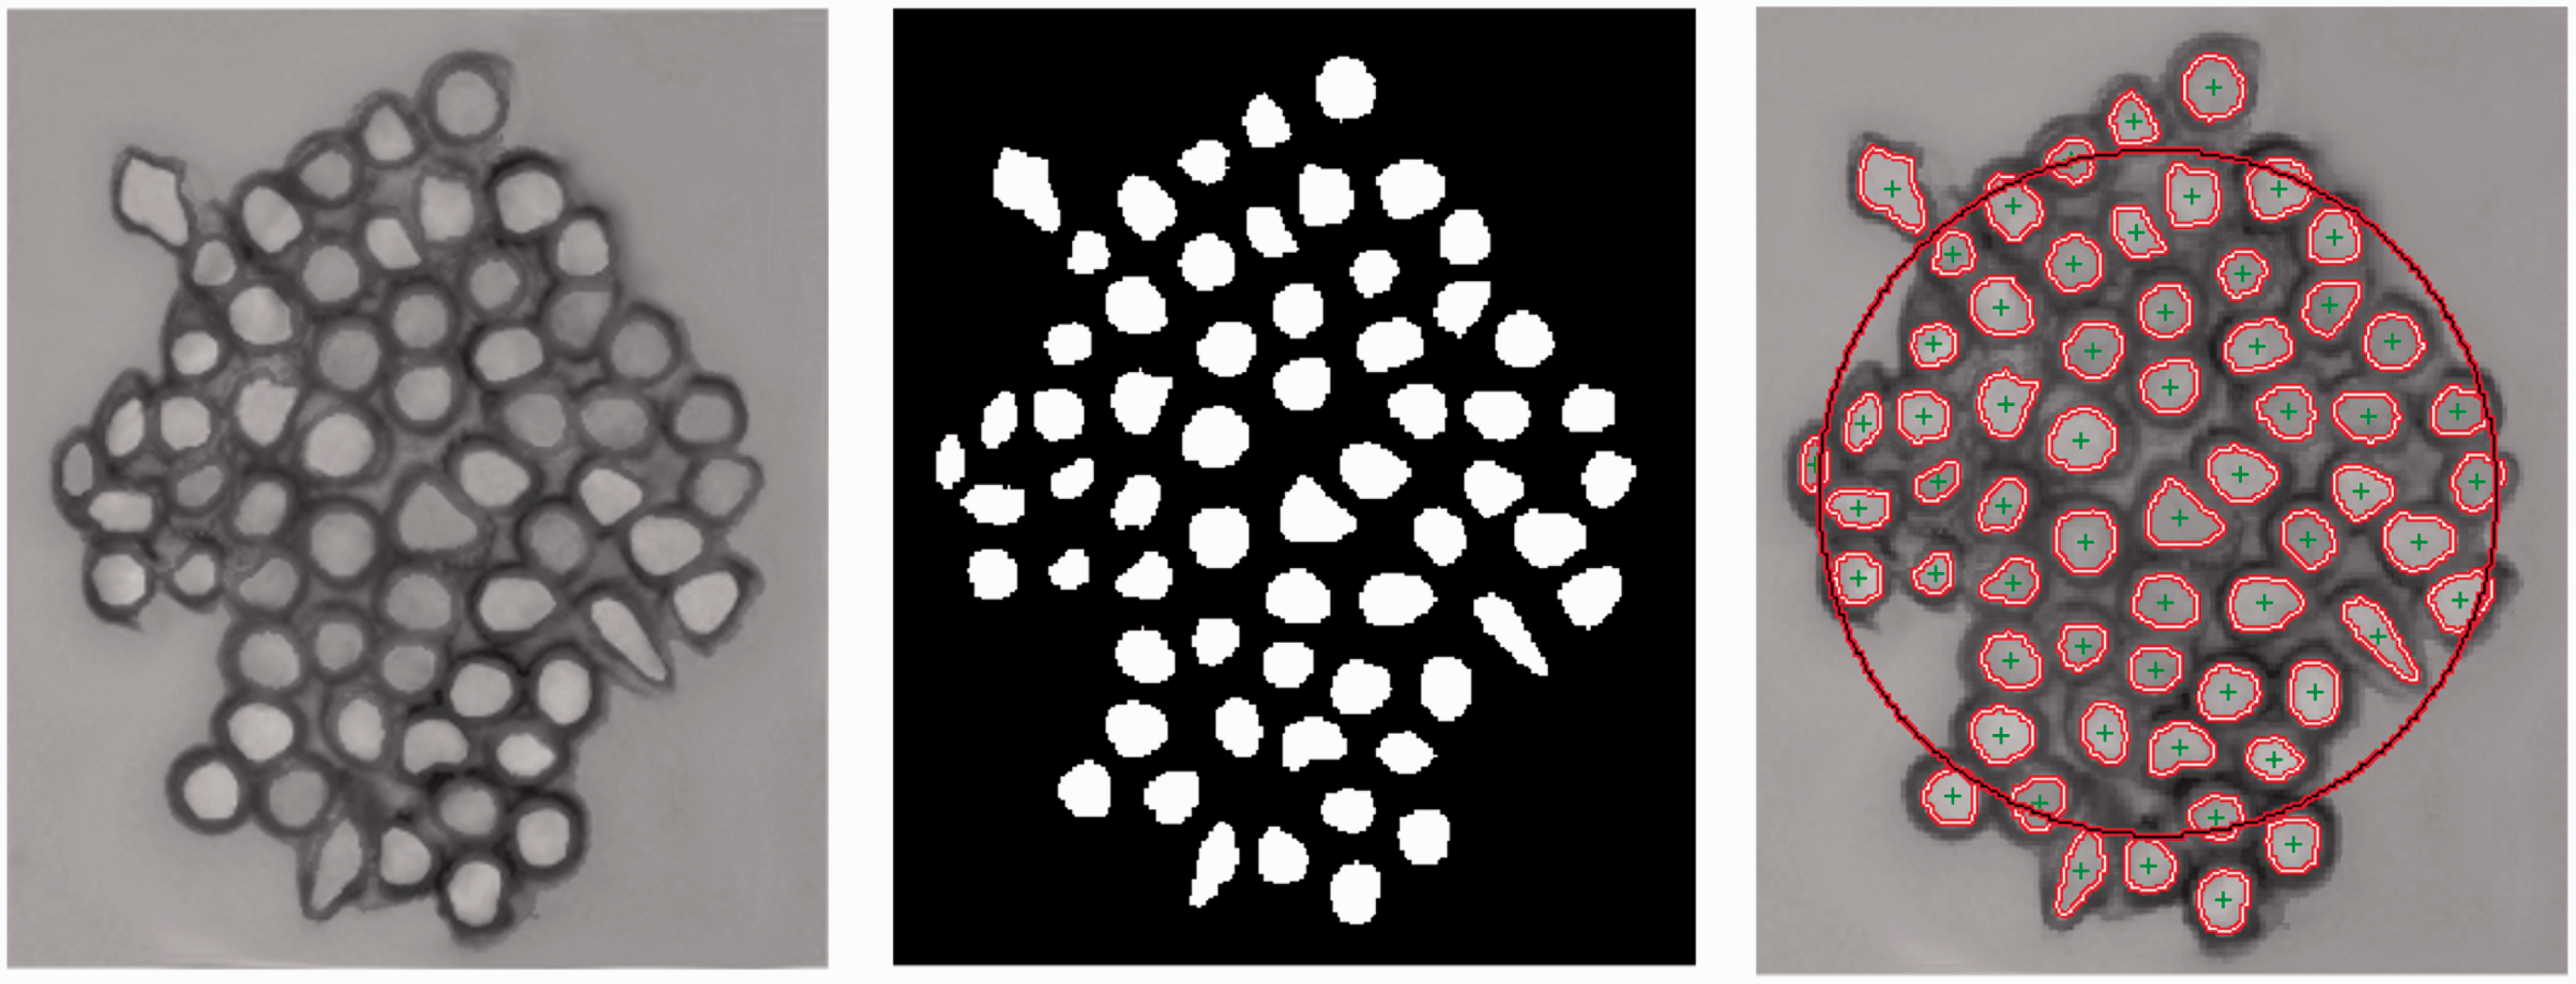
Packing density calculation
Once the contours of the yarn and the fibers are detected, it is possible to calculate the radial packing density (μr). The process starts with calculating the yarn's center of gravity that is considered as the mass center of the object that represents the yarn and its coordinates (Xc, Yc) is calculated from the constituent pixels of that object (Xi, Yi). The mass center coordinates (Xc, Yc) are calculated according to the following relation:
The maximum diameter of the yarn object was then divided with equally displaced points which create concentric rings that are used in calculating the radial packing density. Examples of those rings are shown in Figure 7 where the areas of the fibers appear in the jth ring are summed (Scj) and divided by the area of that ring (Sj) to calculate the radial packing density (μr) as explained earlier in equation (1). The radial packing density can be plotted as a function of the radius as shown in the right bottom graph of Figure 4 which allows the determination of the yarn effective diameter (def) by interpolating the radial packing density at 0.15. The estimated effective diameter for the studied yarn was determined to be about 0.20 mm. The effective yarn packing density μef was calculated as the ratio between the total fiber area (Sf) and the area of the circle of effective diameter (Sef) and was found to be 0.453.
Examples of annular rings that are considered for calculating the yarn radial packing density.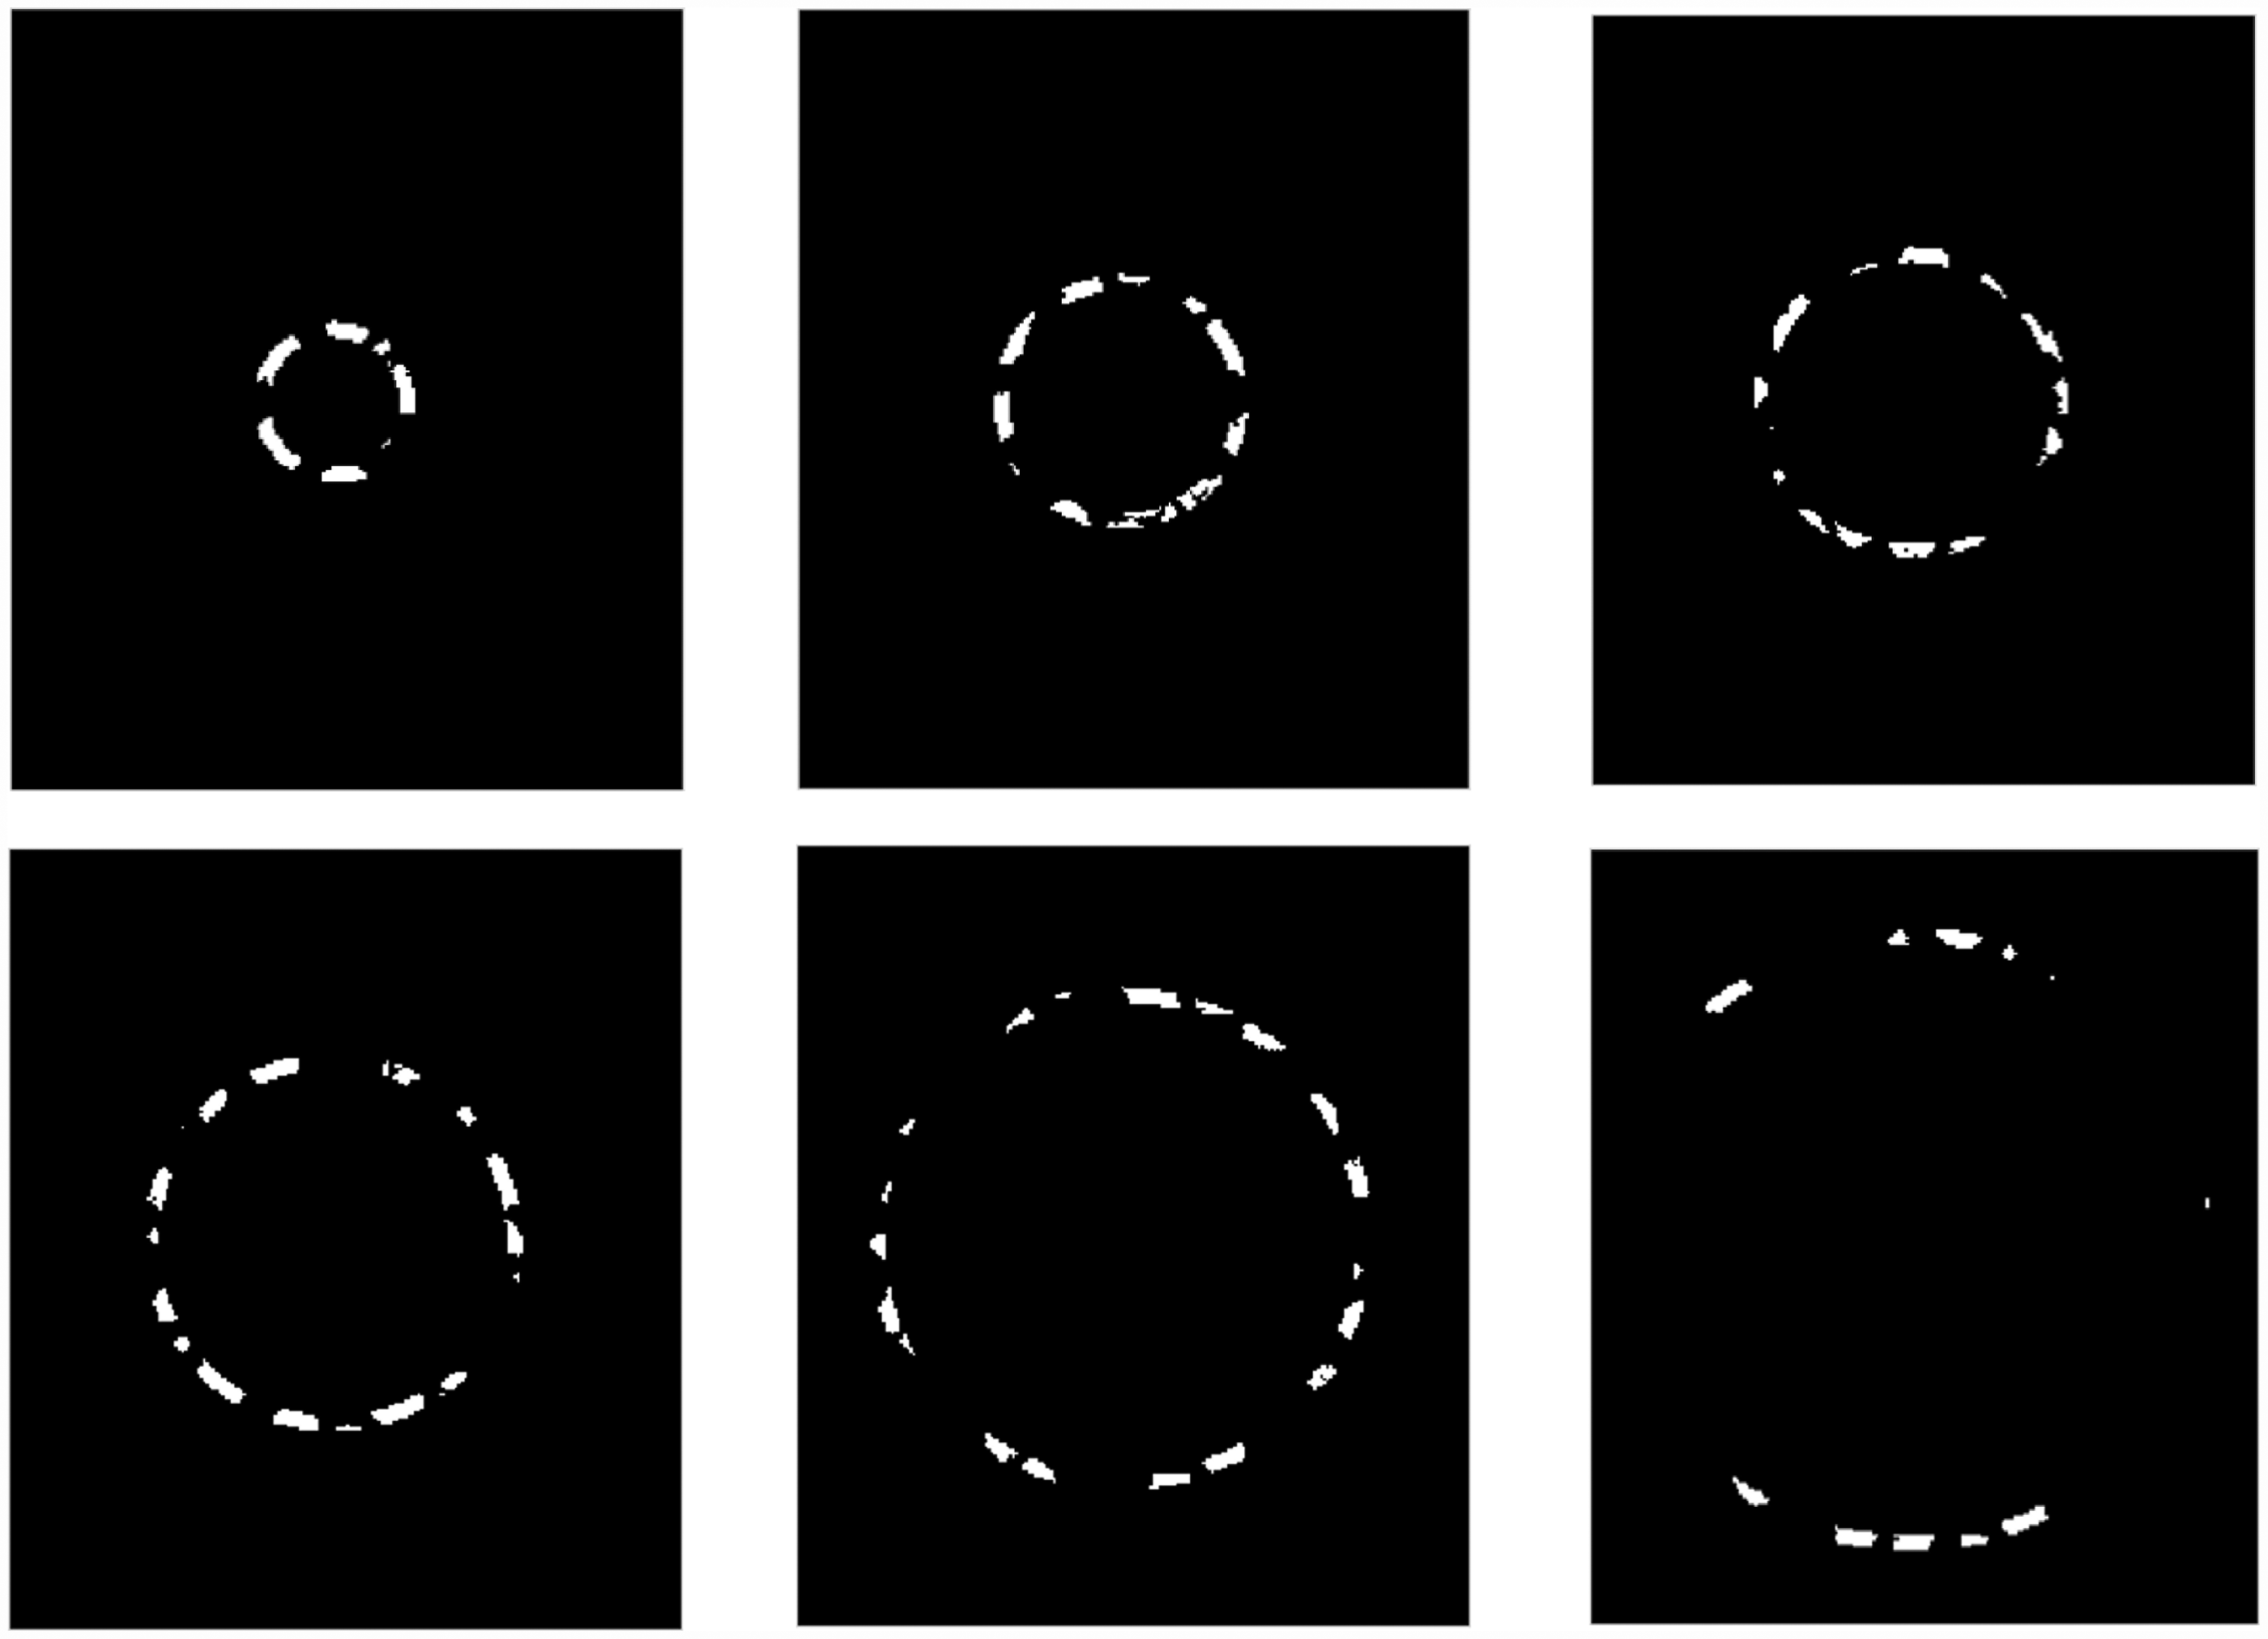
To check the accuracy of the measured area of the fibers, the ARF was used which can be defined as

Other yarn case studies
A similar discussion can be extended to the other two yarn types (viscose and cotton), and their results are summarized in Table 2 while their images are demonstrated in Figure 8. It can be seen in Figure 8(b) that some viscose fibers were considered as one big fiber during segmentation which is revealed to the shape of the yarn and the processing algorithm. It was shown earlier that the calculation algorithm segments the image in two stages; the first to detect the yarn contour and the second to detect the fibers inside the yarn. During the first stage and according to the yarn shape, more than one object can be detected in the image where, for example, the big blob fibers shown in Figure 8(b) are relatively far from the main object where most of the fibers are concentrated. In the case of multiple objects produced during the first stage of yarn contour determination, the algorithm considers the object of the biggest area as the yarn body that will be processed during the second stage of fiber segmentation. Therefore, according to the yarn structure and the distribution of the fibers in the yarn cross-section, the fiber objects that may be relatively far from the main yarn body will not be processed during fiber segmentation which results in the less segmented fibers shown in Figure 8(b).
Cross-sectional image of viscose yarn (a) and cotton yarn (d); Segmented fibers in binary format for viscose (b) and cotton (e); Highlight of the detected fibers in the viscose yarn (c) and cotton yarn (f). The red circles in (c) and (f) have diameters of the calculated effective yarn diameter and the green points highlight the centers of the detected fibers. Average results of the measured samples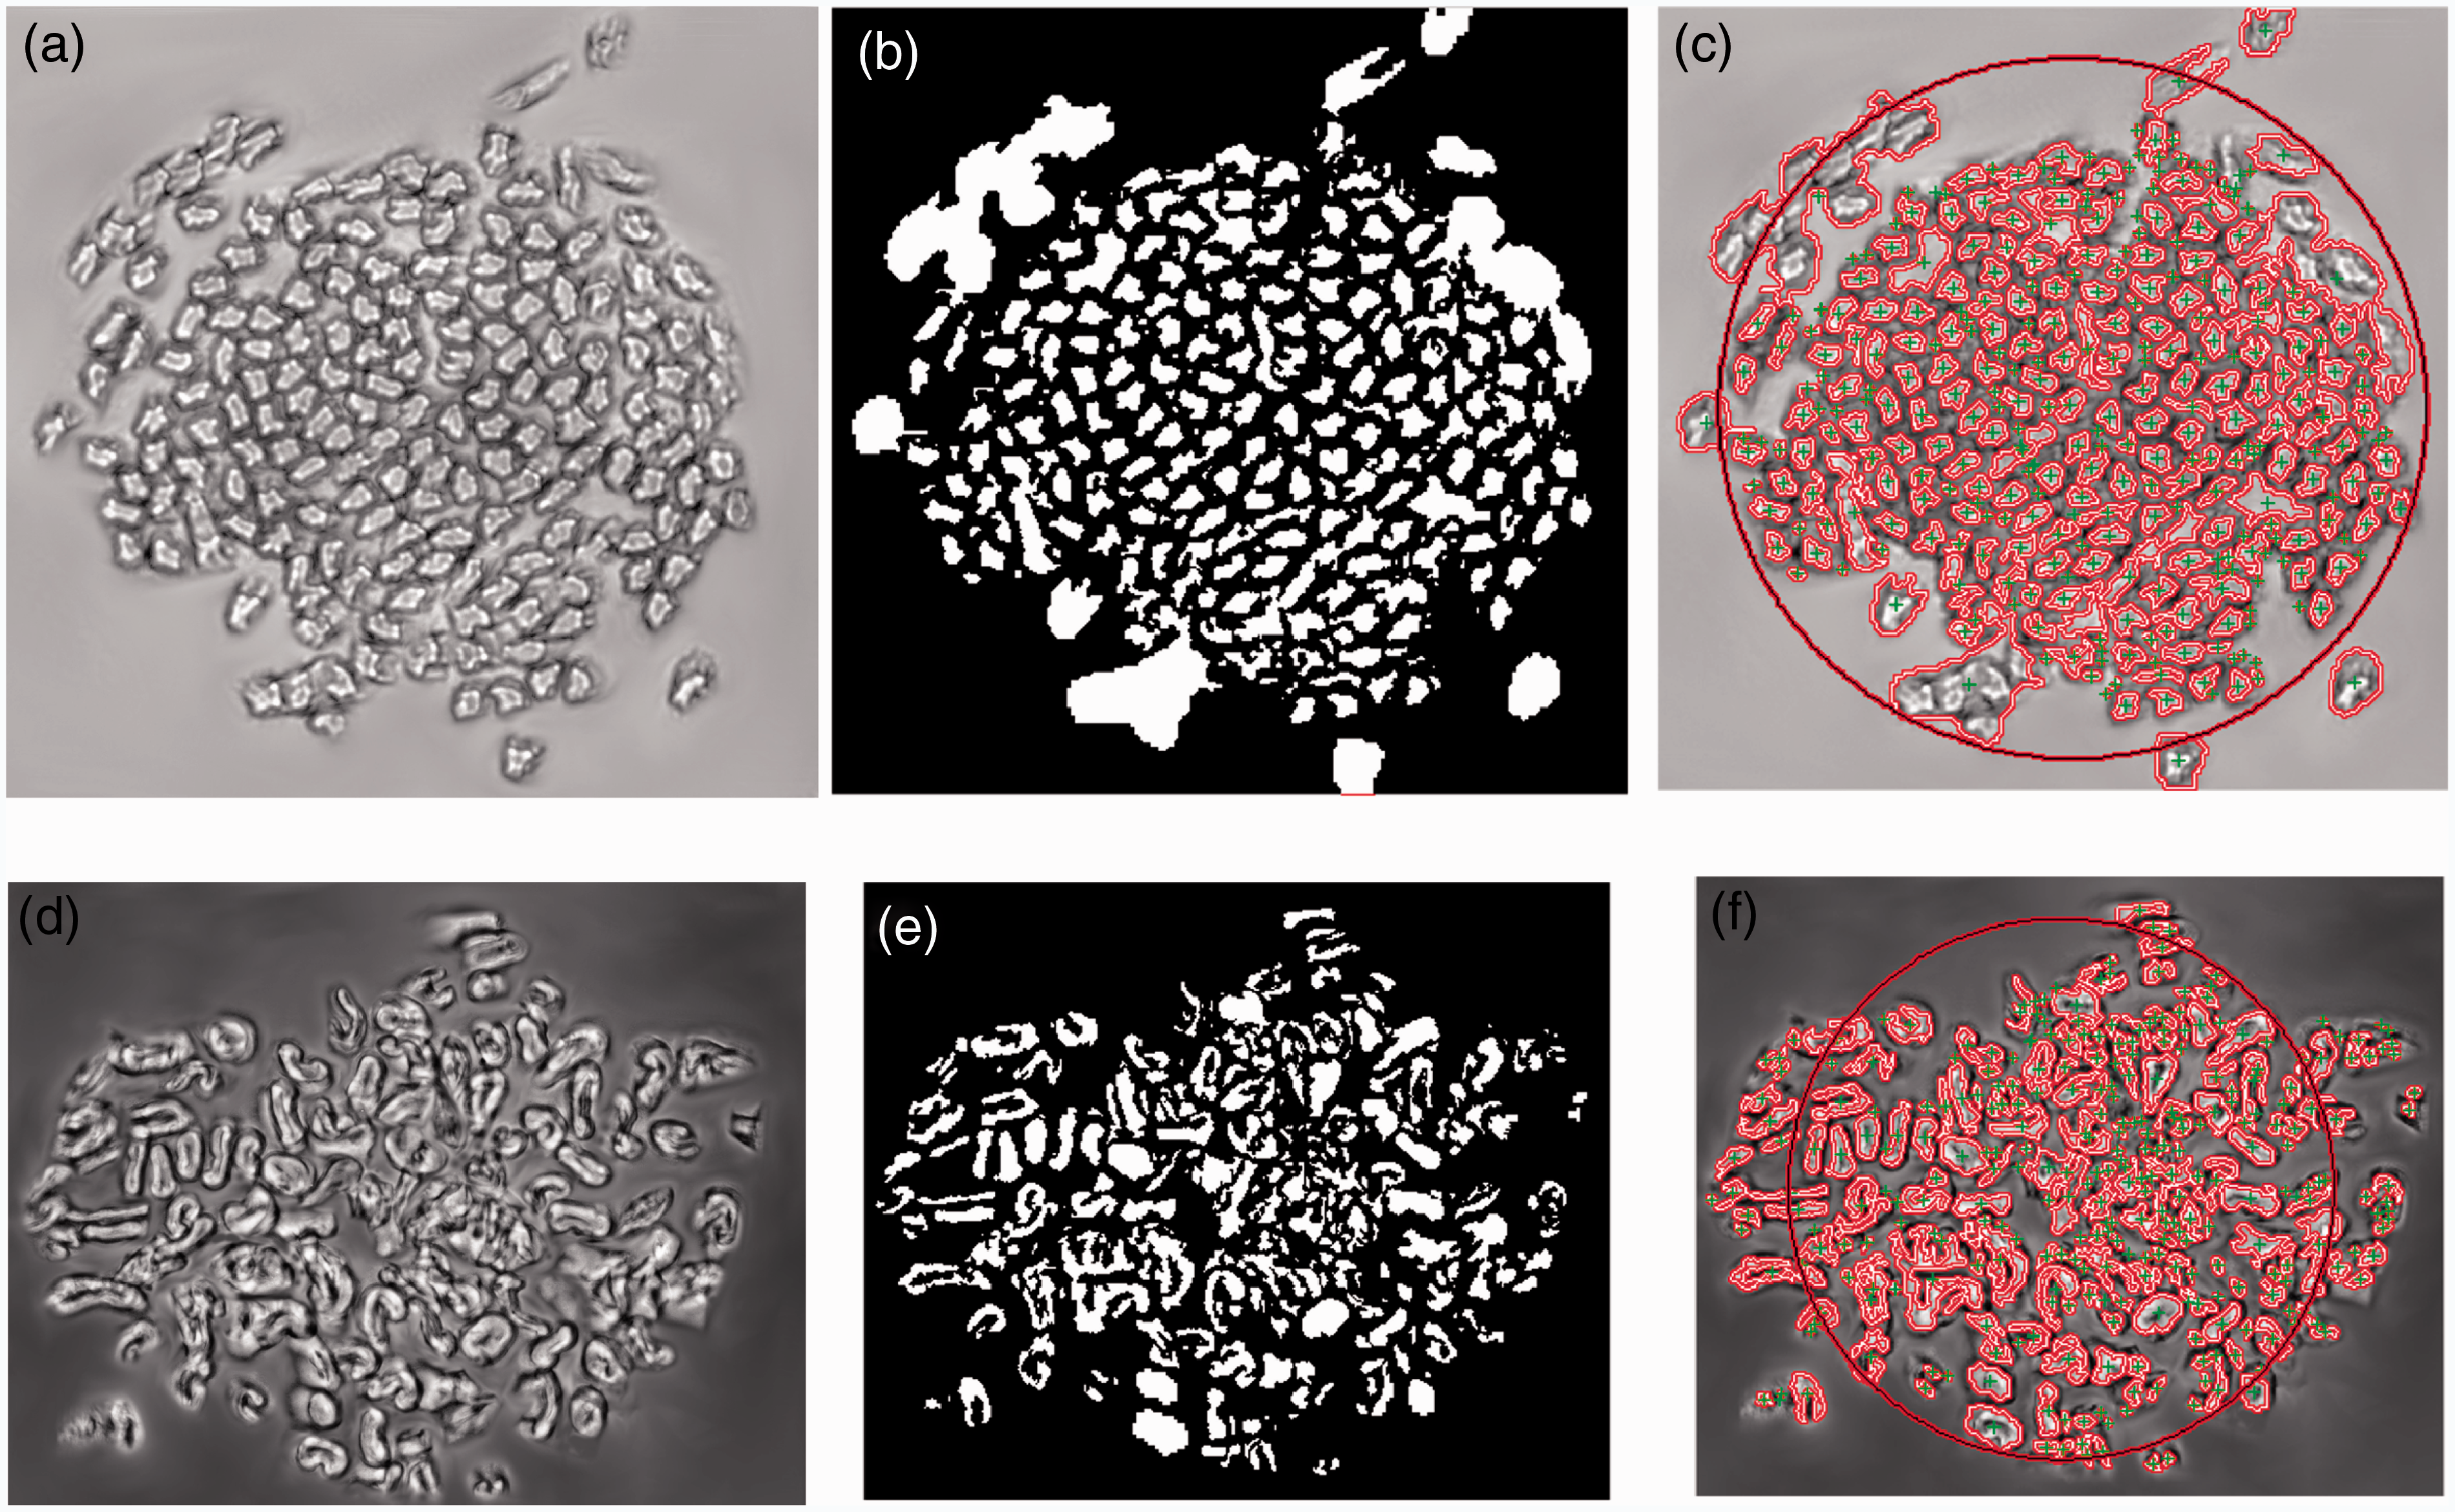
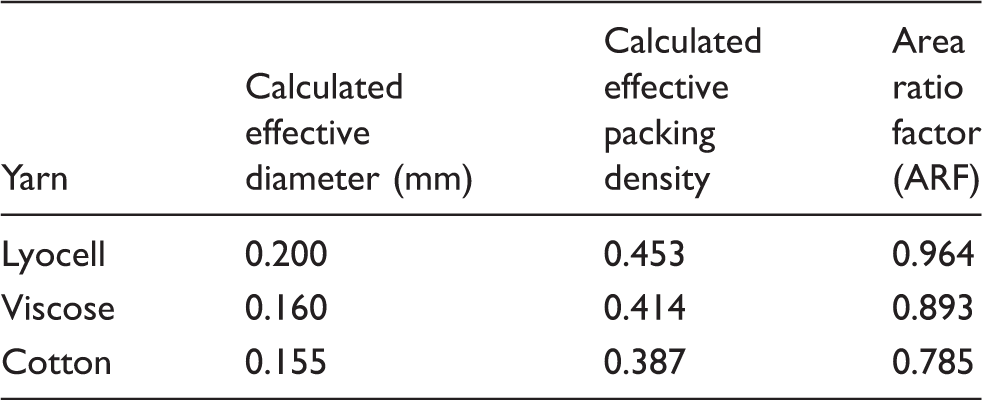
The ARF for the measured samples is listed in Table 2 and can be used to quickly indicate if there is suspected sources of error during the segmentation. The lowest ARF value was found in cotton yarn samples which can be explained by the cross-sectional shape of the cotton fibers which is distinguished by the kidney shape with the lumen of the fiber at the middle as shown in Figure 8(d). By examining the binary image for the segmented cotton fibers in Figure 8(e), it can be seen that the segmentation algorithm subtracts the area of the internal fiber lumen from the total area of the fiber which results in less value of the measured area (Smeas.) and lower ARF value.
Due to the sample size limitations, it is important to notice that the resulting packing density values are not statistically significant and should not be considered as final values for these yarns. For the results to be significant, many cross-sectional samples at different positions along the yarn should be captured and analyzed. However, the quality of cross-sections during their slicing interferes with the imaging system and usually results in out-of-focus images that need extra processing and limits the number of high-quality pictures that can be analyzed. Therefore, the small sample size used in the current analysis was applied to only verify the validity of the segmentation method and to get indicative numbers of the measured yarn parameters to have some insights about the system’s constraints. It was observed that the quality of the imaging system and the careful sample preparation are very important factors in deciding the reliability of the calculated results. The calculated packing densities of the given yarns (although need more samples for verification) are comparable to the results calculated using traditional methods for yarns of similar counts.11,22,23 This agreement, however, contradicts our expectations of getting packing density values higher than the values obtained from traditional methods that add extra porosity to the yarn structure by considering a circular cross-sectional shape of the yarn. It can be explained, on the other hand, by the decreased area of fibers detected by the automated CV segmentation method that does not consider the wall of the fiber (e.g. the Lyocell case) or the lumen (e.g. the cotton case) as parts of the total area of the fiber and, therefore, it is important to consider some correcting factors that compensate for this source of error after fiber segmentation. No correction factors were applied on the given results but it is pointed out here as a possibility for modifying the results.
Conclusion
The CV model was utilized to segment objects in the yarn cross-section to help in detecting the actual contours of both the yarn and its constituent fibers. The detected yarn contour allows the use of the actual yarn cross-sectional shape which differs from the approximated circular contours that are considered in the conventional methods for calculating the yarn packing density. The ARF results have shown a deviation from the ideal ARF value (where ARF=1) due to the cross-section nature of each segmented fiber's type. One drawback of the introduced algorithm is its inability, with the given conditions, to consider the total area of the fiber (where the walls or the lumen of the fiber can be excluded) which results in lower calculated values of packing density. These low values, however, were found to be comparable to the results of the traditional methods as these methods approximate the yarn cross-section to a bigger circle. By considering the actual yarn contour (rather than its circular approximation), the measured packing density of the current samples is expected to be higher than the produced values. In general, the segmentation method presented in this work was found to be faster and more reproducible than the traditional methods of calculating the packing density. Since this method is principally an image segmentation model that can be used to separate the fibers from the background, the method can be extended to segment different fibrous structures to calculate their porosity and packing density. Finally, the sample preparation and the quality of imaging system were found to be crucial factors in producing reliable results and the authors are currently working on alternative methods for image acquisition to be able to obtain enough sample size that produce statistically significant results.
Footnotes
Funding
This work was supported by ESF operational program “Education for Competitiveness” in the Czech Republic in the framework of project “Support of engineering of excellent research and development teams at the Technical University of Liberec” (grant number CZ.1.07/2.3.00/30.0065).
Acknowledgements
The authors also gratitude the time and effort of Professor Bohuslav Neckář for his fruitful and constructive discussions. We would like also to thank Professor Michal Vik for his help in capturing some of the microscopic images.