



Abstract
In the first part of this study, the drying behavior of wool-acrylic yarn bobbins was investigated by a theoretical model and genetic algorithm method. Each candidate solution for Do, D1 and D2 was presented on a single chromosome. The values of Do, D1 and D2 yielding the best fit between the experimental and predicted moisture contents were obtained using the genetic algorithm. In the second part of this study, the suitability of various empirical and semiempirical models in the modeling of the drying process was investigated by the genetic algorithm. The population number was taken as 30 and the tournament selection method was used. The calculations were performed until the 20th generation for the theoretical model and 100th generation for the empirical and semiempirical models. The results show that the genetic algorithm can be successfully used in the modeling of the drying process of yarn bobbins. The results also show that the Verma et al. and Diffusion Approach models yield the best fit with experimental data.
The mathematical modeling of drying behavior in the textile industry is important because it enables a suitable process design based on product quality, minimization of energy cost and minimization of cost due to quality constraints.
In the textile industry, removal of water from the product is performed in two stages known as pre-drying and final drying. Pre-drying is a mechanical drying process and generally performed by centrifugal force. Final drying is generally performed by a hot-air convective drying process.
The convective drying process is usually performed by passing pressurized hot air from the inner part of the bobbins to the outer part. The drying process is generally continued until the equilibrium moisture ratio is attained. The drying period is strongly dependent on the temperature and the relative humidity of drying air. Other factors affecting the drying rate are the thermophysical properties, the dimensions, the porosity of yarn and the flow rate of the drying air.
There are a considerable number of drying models used for simulation of convective drying behavior of solids in many industries. Most of them are based on the diffusion equation. Keshavarz et al. 1 developed a lumped model for time-dependent dehydration of solids in the form of slab, cylinder and spherical geometries. They used the polynomial approximation approach and implemented a model that can be used to calculate the average concentration for higher value of Biot numbers. Ribeiro and Ventura 2 examined the through and cross-drying of wool bobbins. They suggested a modified heat equation, including temperature and moisture content. They assumed that evaporation occurs only on the moving boundary. Akyol et al. 3 suggested a new drying model for cotton-based yarn bobbins. They used mass and modified heat equations. They also used a polynomial approach for nondimensional temperature and calculated the most suitable coefficients by a regression analysis. Lee et al. 4 developed a two-dimensional numerical model for the drying of tufted textile materials. They modeled heat and mass transfer for the porous tufted material and the surrounding air separately. The theoretical results show a good agreement with the experimental data. Nastaj 5 developed a numeric model for highly viscous and cylindrical-shaped food stuffs. In this model, the evaporation was assumed to take place on the moving boundary inside the material. This model also enables one to predict the position of the moving boundary, temperature profiles in the dried body and average moisture content of the dried body as a function of time. Garcia et al. 6 suggested a new Arrhenius-type diffusion coefficient for non-impregnated transformer insulating paper as a function of average moisture concentration, temperature and insulation thickness by using genetic optimization. Garcia 7 found that a diffusion coefficient depending on local moisture concentration instead of average moisture concentration should be more suitable. The author specified the diffusion coefficient by modifying the optimization process. Yuzgec et al. 8 developed a nonlinear predictive control technique by using the genetic algorithm for the drying process of baker’s yeast . In their study, the inputs of the drying process (the outputs of nonlinear predictive control) are selected to be air temperature and humidity, and the outputs are moisture content, average temperature and product quality. Erenturk and Erenturk 9 investigated the drying behavior of carrot for various drying air temperatures, air flow velocities and carrot slice thicknesses. They found that the modified Page model is the most suitable model. In their study they used the genetic algorithm to specify the model constants. They also estimated the moisture content of carrot by using a feed-forward artificial neural network. The results of their extensive analysis show that an artificial neural network with a coefficient of determination value of 0.9998 gives the best results. Liu et al. 10 used neural networks and genetic algorithm in their study on grain drying. The neural network was used to predict the moisture content of grain. They used the genetic algorithm to obtain the optimum number of nodes in the hidden layer of the neural network.
In the first part of this study, the drying behavior of wool-acrylic yarn bobbins was investigated by a theoretical model based on a genetic algorithm. The effective thermal conductivity and heat capacity of yarn were assumed to be dependent on the moisture content. The diffusion coefficient was assumed to be dependent on moisture content and temperature in the form of the Arrhenius-type relation. The diffusion coefficients for different drying conditions were determined by the genetic algorithm. In the genetic algorithm, an individual in the population represents a chromosome. The three basic parameters in the Arrhenius-type diffusion coefficient were represented by a single chromosome. The population number was selected to be 30. The values of the parameters yielding the best fit were obtained at the end of the 20th generation. In the second part of this study, the suitability of various empirical and semiempirical models in modeling the drying process was specified by the same optimization method. The calculations were performed until the 100th generation.
Theoretical drying model
Problem statement and physical model
In the textile industry wet yarn bobbins are located into centrifugal dryers and dried mechanically before thermal drying. During mechanical drying a substantial amount of the unbounded water is removed. In this study eight bobbins were used for the experiments. The wool-acrylic yarn bobbins (65% wool, 35% acrylic) were put in a water bath for about 12 hours. Acrylic is a synthetic material made from a polymer called “polyacrylonitrile”. Then they were left in a room for 2 hours to remove the excess amount of unbounded water and then they were located into the bobbin chamber of the hot-air dryer.
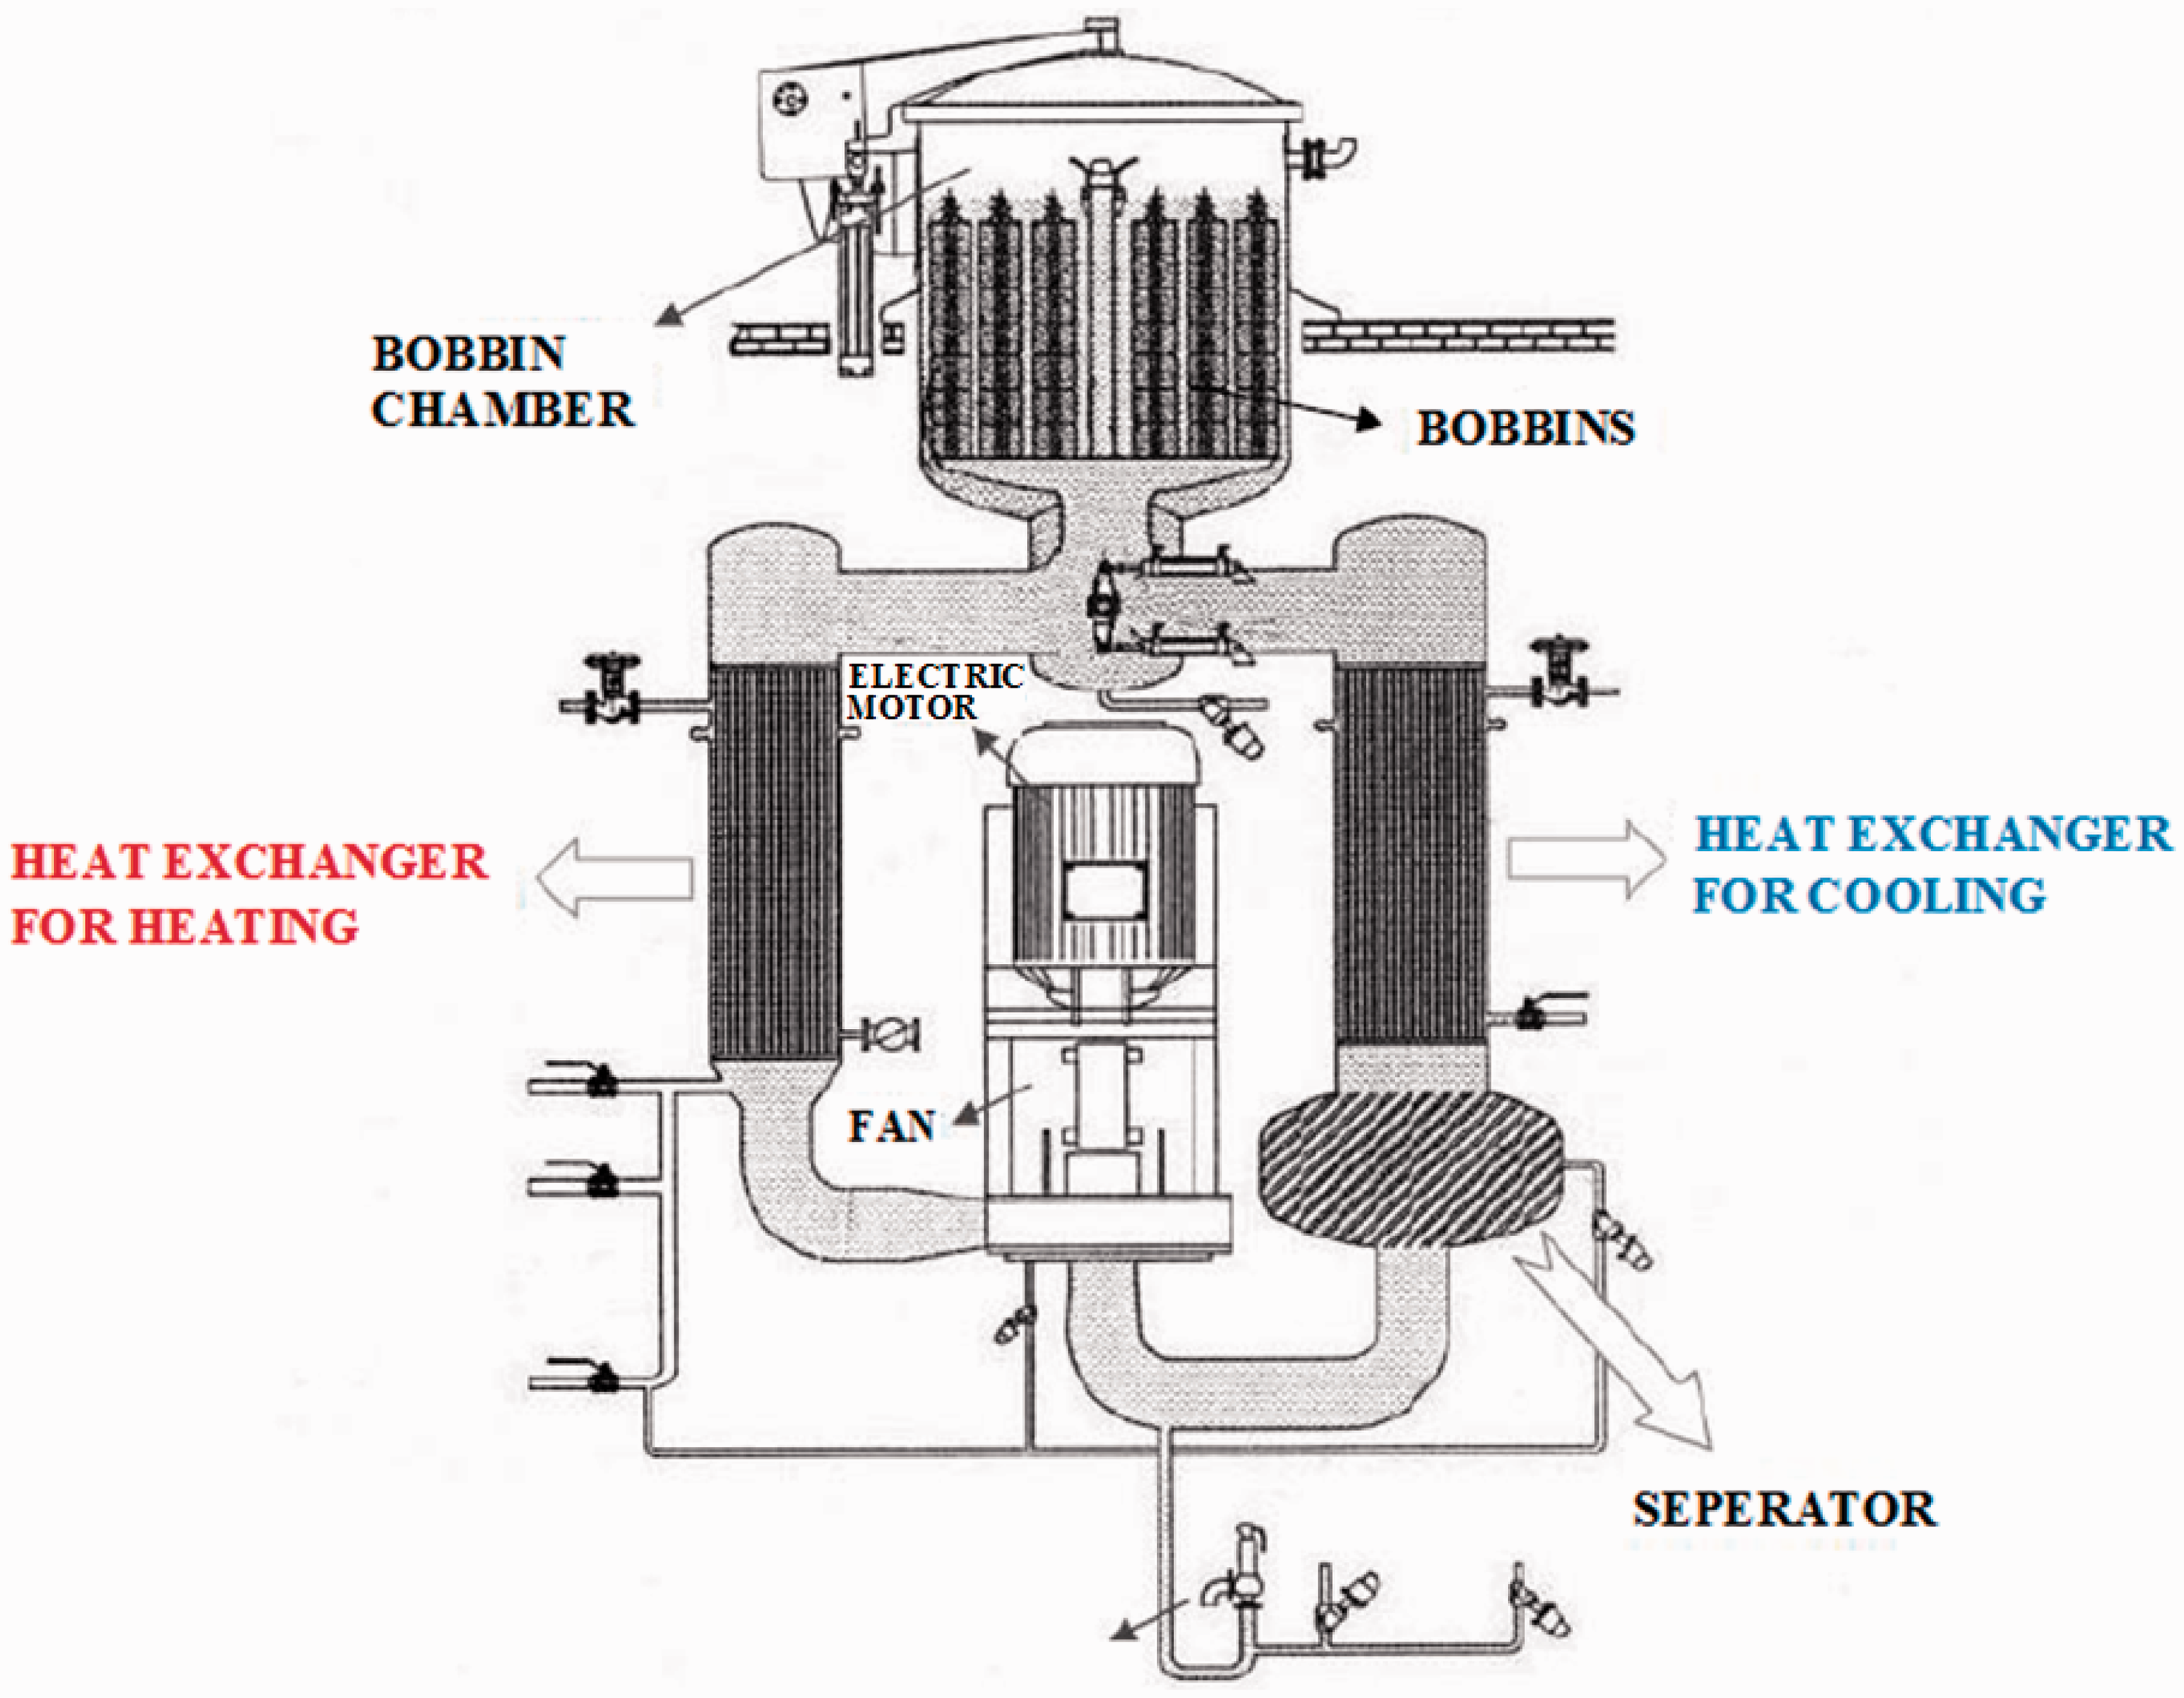
Before the drying process, unheated drying air was used to decrease the amount of the unbounded water. It was passed from the outer part of the bobbins to the inner part for a few minutes. The experimental data were taken for the drying pressure of 1 bar and the drying temperatures of 80℃, 90℃ and 100℃ using a hot-air dryer, as shown in Figure 1. The volumetric flow rate of drying air is 450 m3h–1. During experiments heated drying air is passed from the inner part of the bobbins to the outer part. The weight of eight bobbins was measured during the drying process by the load cells under the bobbin chamber. The tests were conducted via a programmable logic controller (PLC).
Schematic view of the hot-air bobbin dryer.
11
The schematic view of the yarn bobbins is shown in Figure 2. The yarn bobbins with 15.5 cm height have 2.7 cm and 8 cm mean inner and outer radius, respectively.
Yarn bobbin.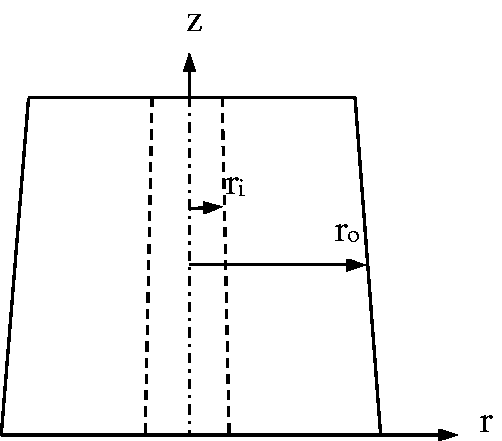
In this study the drying behavior of wool-acrylic yarn bobbins was modeled by the diffusion and heat equations given below


The diffusion coefficient was assumed to be expressed by the following Arrhenius-type relation

In equation (3) temperature is in Kelvin and represented as Genetic algorithm of the drying model.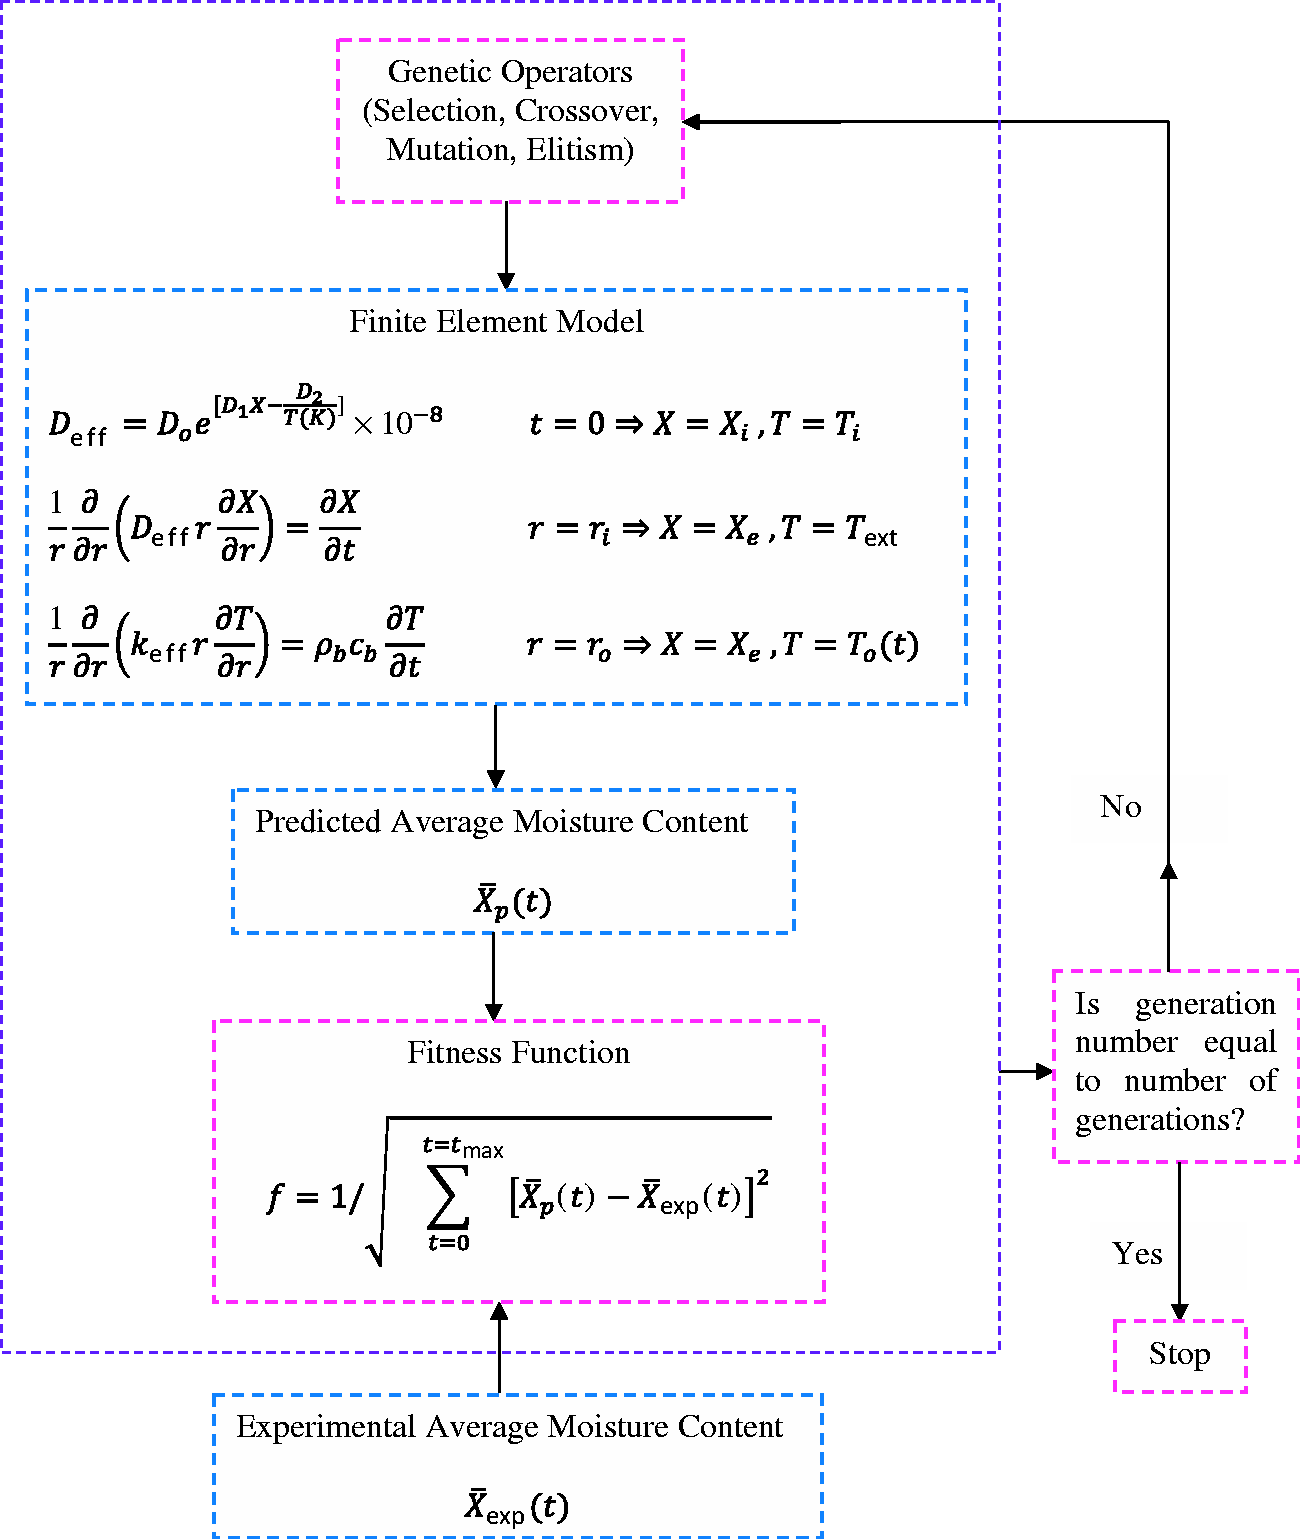
Effective thermal conductivity
As yarn bobbins consist of 65% wool and 35% acrylic, the heat conductivity of the solid matrix can be determined by a geometric mean model.
12
The thermal conductivities of wool and acrylic are available in the literature13,14 as


During drying, the effective thermal conductivity of the bobbin changes as the moisture content decreases. The effective thermal conductivity of the bobbin can be expressed as a function of gas, liquid and solid phases as
15

The temperature dependence of the thermal conductivity of liquid water and air is negligible for the temperature interval considered in this study. The thermal conductivities of water and air were taken as



Porosity
The average dry and wet weights of the bobbin are 0.97 and 2.04 kg, respectively. Considering the dry mass and volume of a bobbin, the density of a dry bobbin was calculated as 351.61 kg/m3. Using the relation given in equation (9), the porosity of the bobbin was determined as ɛ = 0.387

Heat capacity
Thermophysical properties of yarns
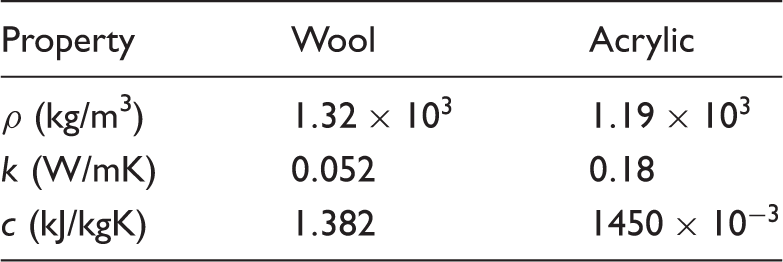
The density and specific heat of the solid matrix of the yarn bobbin were calculated as 

The heat capacity of a yarn bobbin can be written as a function of moisture content as follows

The last term in equation (12) is considerably small with respect to the other terms and it can be neglected. Therefore, the heat capacity of a yarn bobbin can be defined as follows

Initial and boundary conditions
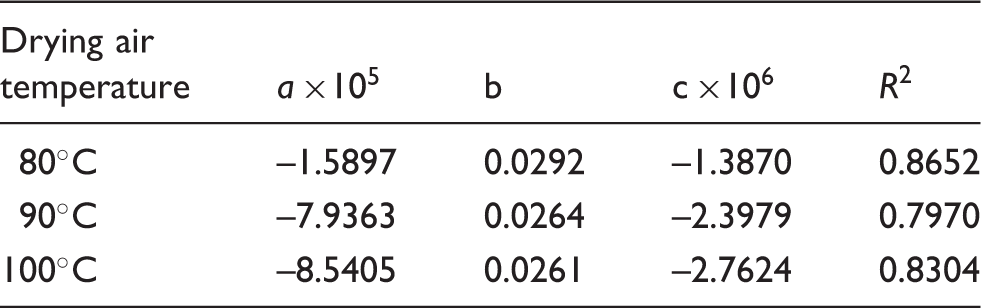
The Henderson model was used to determine the equilibrium moisture content of the yarn bobbin
19

Initial and equilibrium moisture content for different drying air temperatures
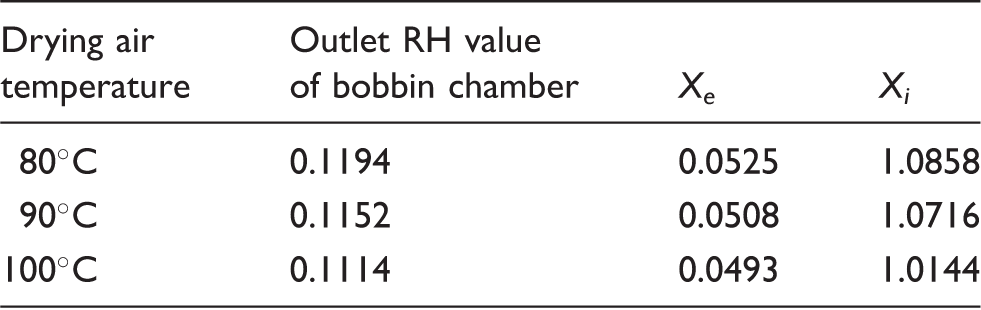
RH: relative humidity.
The moisture content was determined from the following equation using the experimental data


Values of the constants given in
Genetic algorithm
The genetic algorithm is an optimization algorithm based on natural selection. Genetic algorithms were invented in 1960s by John Holland and developed by him and his students in the 1970s. The main terms related with the genetic algorithm are initialization, selection, crossover, mutation and elitism. 20
Initialization
Generation of the initial population; the initial population is usually generated at random. 20
Selection
Selection is based on the fitness function and it ensures next generations are formed from more fit individuals. There are several types of selection methods, such as roulette wheel selection and tournament selection. 20 In this study tournament selection has been performed in such a way that pairs of individuals were selected at random, then a random number r (in the range 0–1) was generated. If the number r was smaller than the tournament selection parameter, the fitter of the two individuals went forward. The tournament selection parameter was selected as 1, to always satisfy the fittest one of the two randomly selected individuals to go forward.
Crossover
Two selected individuals are exposed to crossover regarding crossover probability. Choosing a crossover probability close to 1 increases the possibility of selected individuals to be crossed over. Otherwise, these individuals proceed without crossover. On the other hand, there are several types of crossover methods, such as single-point crossover, two point crossover and uniform crossover.
Mutation
For a simple binary representation, mutation is implemented by sweeping the whole population. The value of 1 on the gene is flipped to a 0 or vice versa regarding mutation probability. 20 In this study, the mutation probability is 0.025. This not only ensures recalling the lost information, but also ensures search space is large enough.
Elitism
According to fitness-proportional selection, it is possible that the fittest individual is not selected. Elitism ensures that the best solution to the problem discovered so far is transferred to the next generation. 20
Genetic algorithm settings

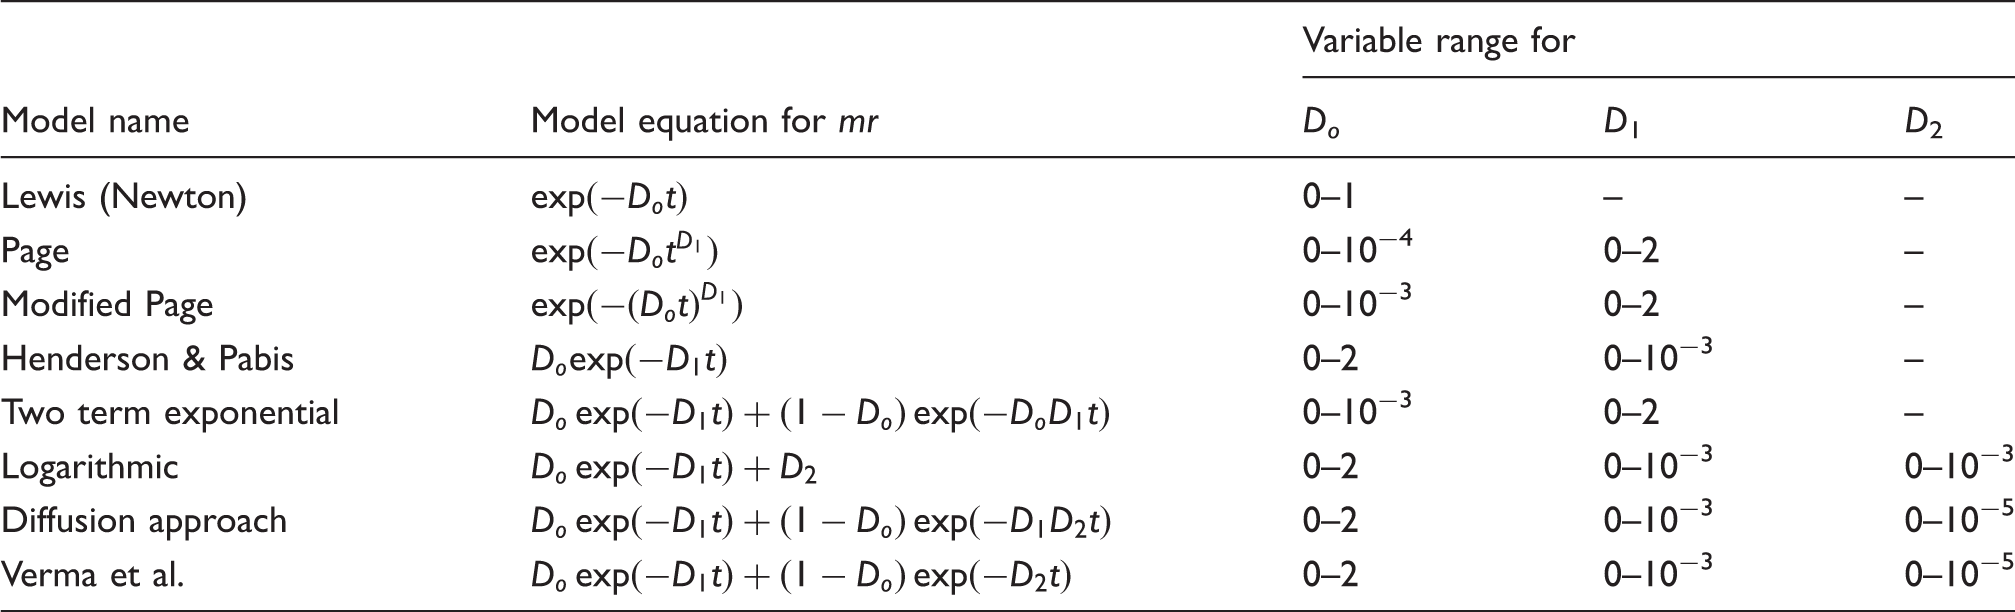
The problem considered in this study is to find the values for Deff (Do, D1 and D2) by the genetic algorithm that yields the best fit between the experimental and predicted moisture content. Maximum values of Do, D1 and D2 parameters were selected as 12, 4 and 200, respectively, to ensure rapid convergence. Maximum values for these coefficients were determined after several trials. These three parameters were presented by binary coding on a single chromosome, as shown in Figure 4. They form an individual in the population. In order to satisfy crossover between each member (Do, D1 and D2), triple-point crossover was applied on a single chromosome. Each parameter consists of 20 genes, while an individual in the population consists of 60 genes. The same results can be reproduced by representing Do, D1 and D2 on different chromosomes consisting of 20 genes and applying single-point crossover between chromosomes.
Representation of parameters on a chromosome.
Application of the genetic algorithm to empirical and semiempirical models

Empirical and semiempirical models considered in this study
Genetic algorithm settings for the empirical and semiempirical models.
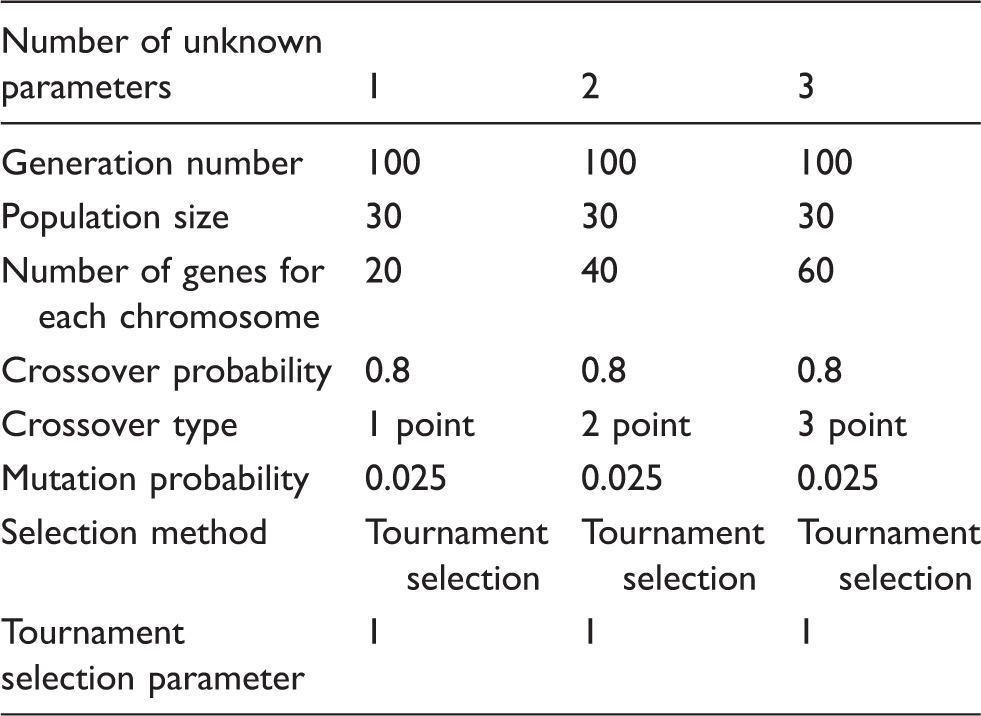
In this study all parameters for the investigated models were presented on a chromosome. Each parameter was represented by a binary string consisting of 20 genes. On the other hand, crossover type of algorithm was arranged according to the number of parameters. For example, for a three-parameter model, triple-point crossover has been applied to ensure Do, D1 and D2 parameters have crossover with each other respectively (Do with Do, D1 with D1 and D2 with D2 in the whole population). Crossover was applied between the first and 20th genes for Do; between the 21st and 40th genes for D1; and between the 41st and 60th genes for D2. Genetic algorithm settings for the investigated models have been presented in Table 6.
Fitness values were calculated according to the following equation

Results and discussion
The experimental and model results were presented at 5-minute intervals for each model considered in this study. The fittest individual was transferred to the next generation as the first individual without any change. The elitism aims to increase the maximum fitness value for the next generation.
Results of the theoretical drying model
This study aims to predict average moisture content as a function of time during drying of the yarn bobbin. The Arrhenius-type diffusion coefficient that yields the best fit between the experimental and model results is determined by predicting the three parameters of Do, D1 and D2 by means of genetic operators. The genetic algorithm calculations were continued until the 20th generation. The experimental and model results of average moisture content ( Drying curves based on the theoretical drying model: (a) T = 80℃; (b) T = 90℃; (c) T = 100℃.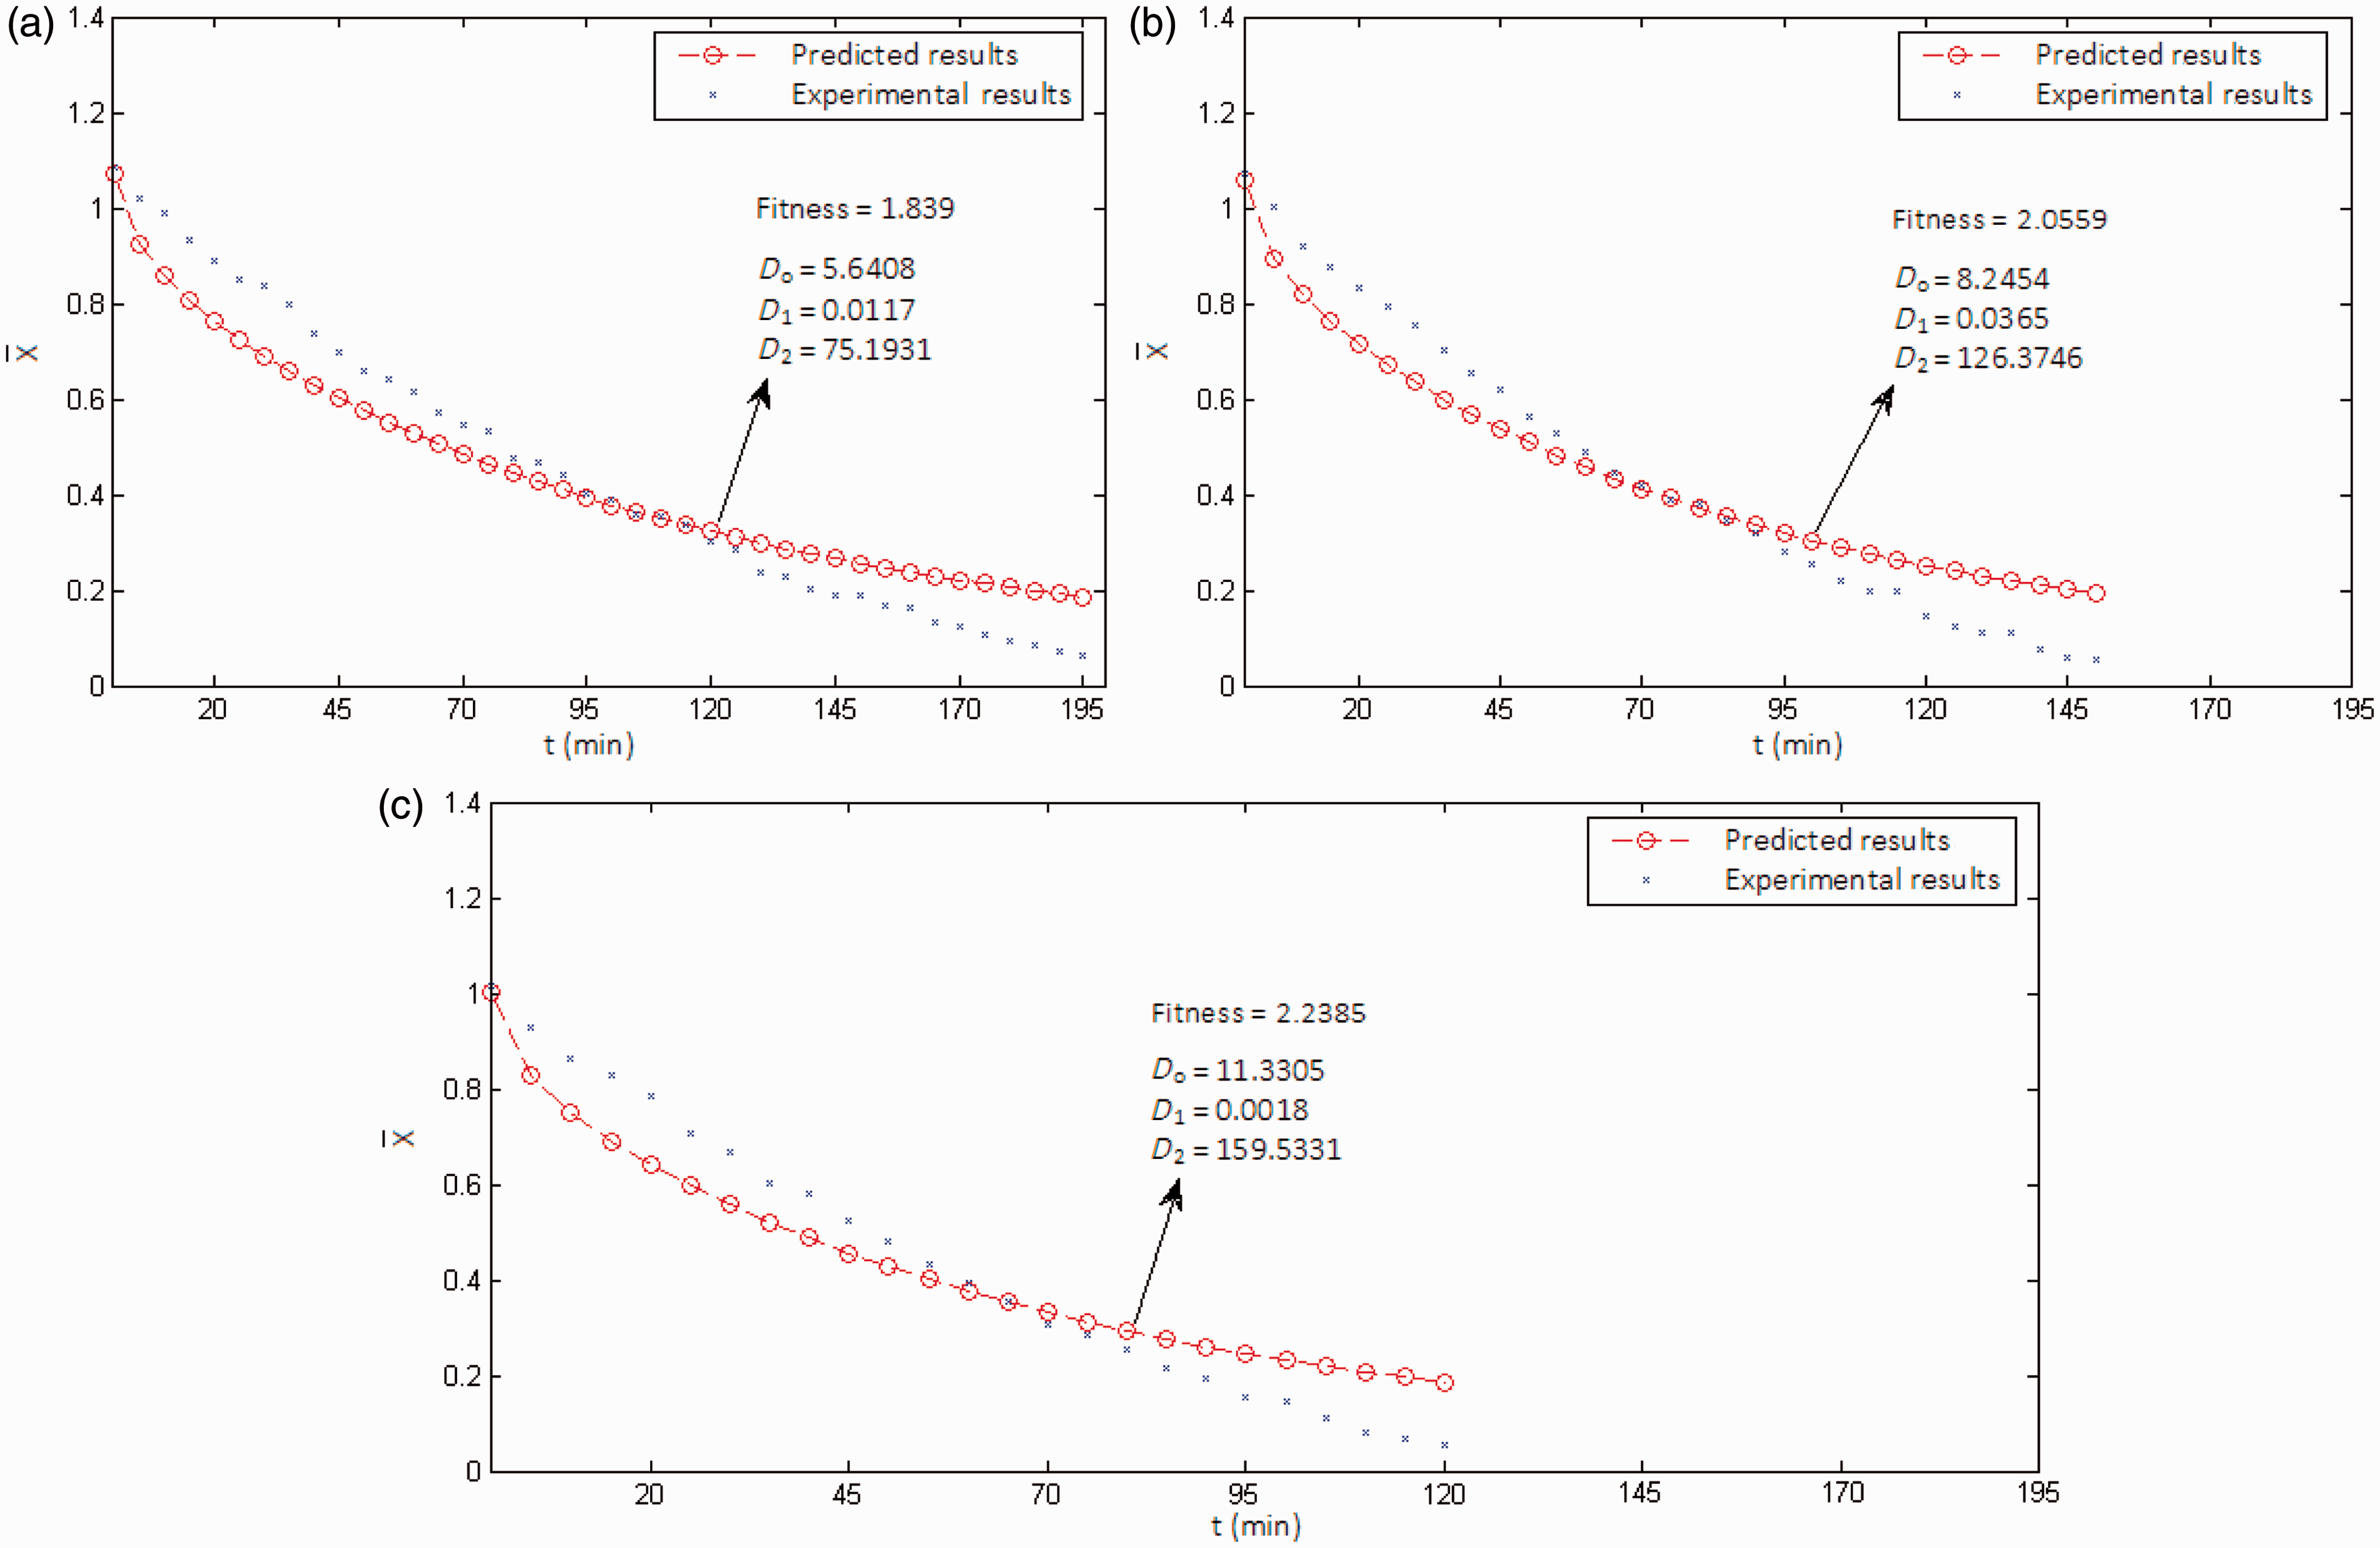
The drying period is inversely affected by relative humidity of the drying air. Ambient air is heated before it is transferred to the bobbin chamber. During heating, specific humidity does not change, but the relative humidity of the air decreases. A significant decrease is seen in drying time when the drying air temperature is increased as a result of lower relative humidity. It should be noted that the weight of the spool was subtracted from the total weight for the calculation of the dry mass of the bobbin for
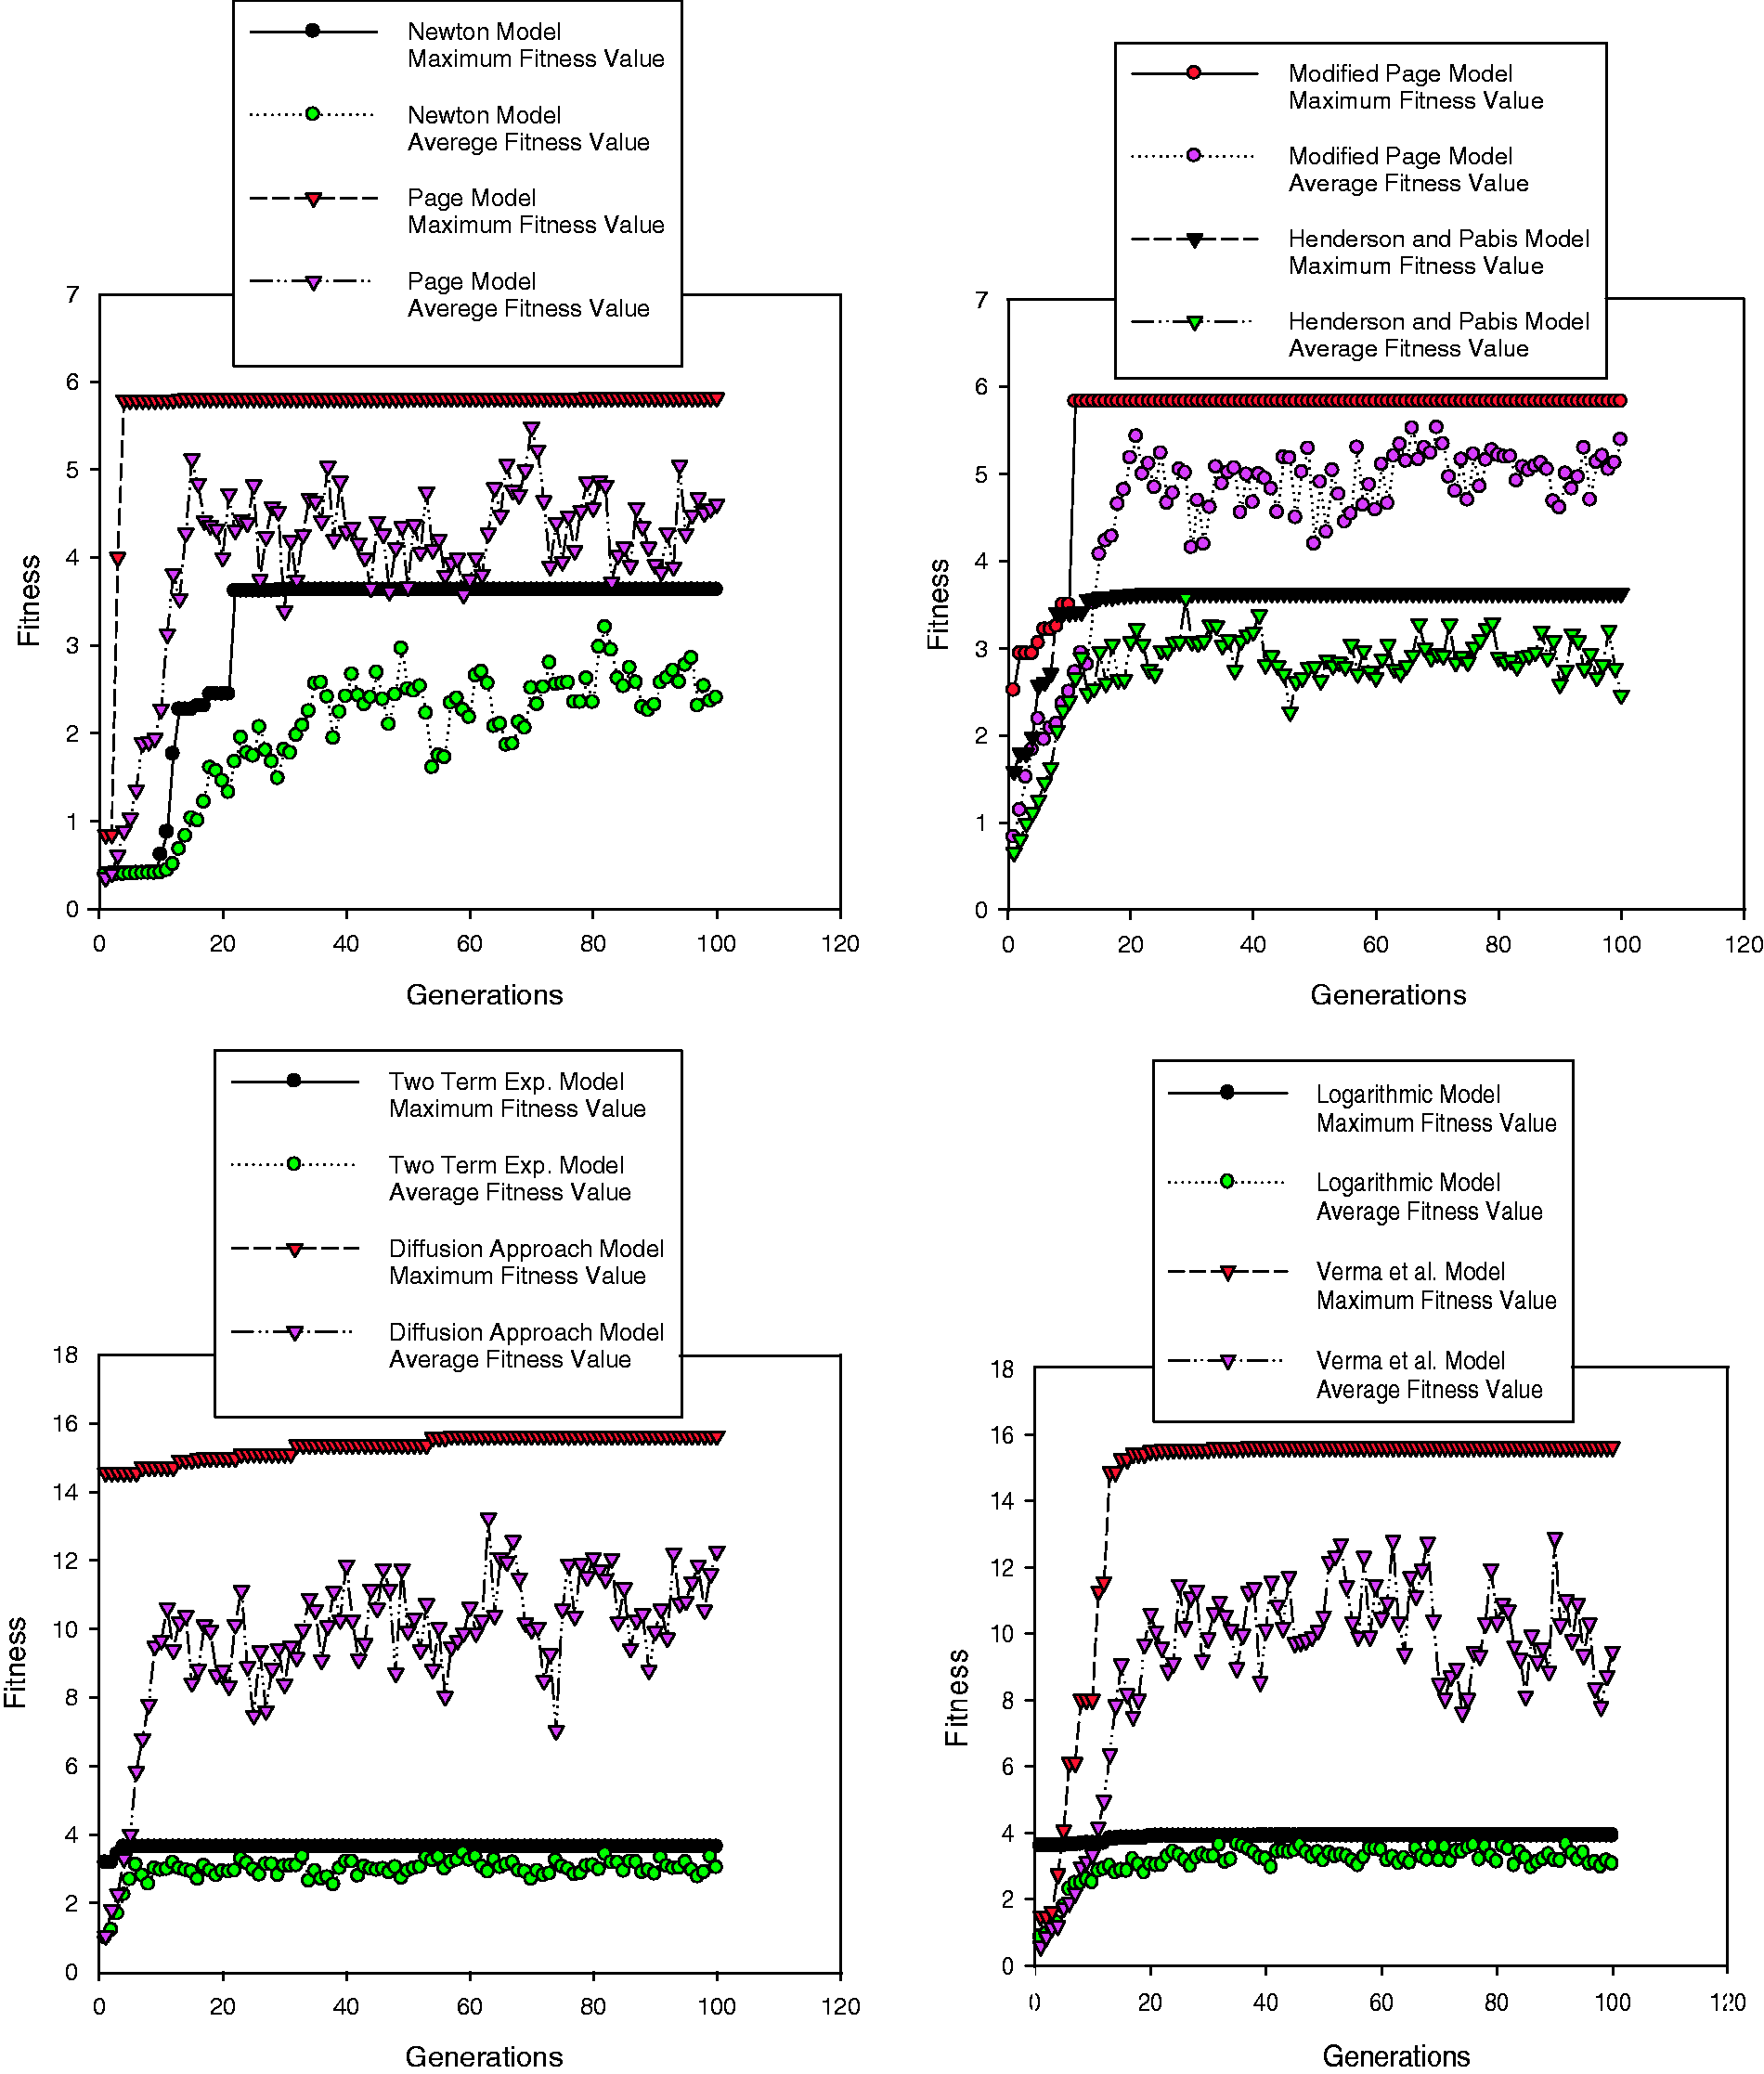
As can be seen from Figure 6, the average fitness linearly increases for the first four generations. The rate of increase decreases after the fourth generation. Average fitness keeps increasing until the 15th generation. The maximum fitness value for each generation remains constant after it shows an increase. The maximum fitness value is observed for a drying temperature of 100℃. It is obvious from equation (18) that as the amount of data decreases, the fitness value shows an increase.
Fitness values of the theoretical model. Fitness values of the empirical and semiempirical models for 80℃. Fitness values of the empirical and semiempirical models for 90℃.

Results of empirical and semiempirical models
Maximum and average fitness values for the investigated models are given in Figures 7–9. The genetic algorithm calculations were continued until the 100th generation. It is obvious from equation (18) that high values of fitness function means less error between the experimental and predicted results. Different from the theoretical model, the average fitness values for the empirical and semiempirical models continue to increase after the fourth generation. Increase in the average fitness value is higher for the Page, Modified Page, Diffusion Approach and Verma et al. models. The results also show that the average fitness value finally approaches a point where it oscillates around a constant value. The maximum fitness value is the fitness value of the best candidate solution for each generation. Considering this fact, it can be concluded that 20 generations is enough for future investigations.
Fitness values of the empirical and semiempirical models for 100℃. Drying curves of the best models: (a) T = 80℃; (b) T = 90℃; (c) T = 100℃.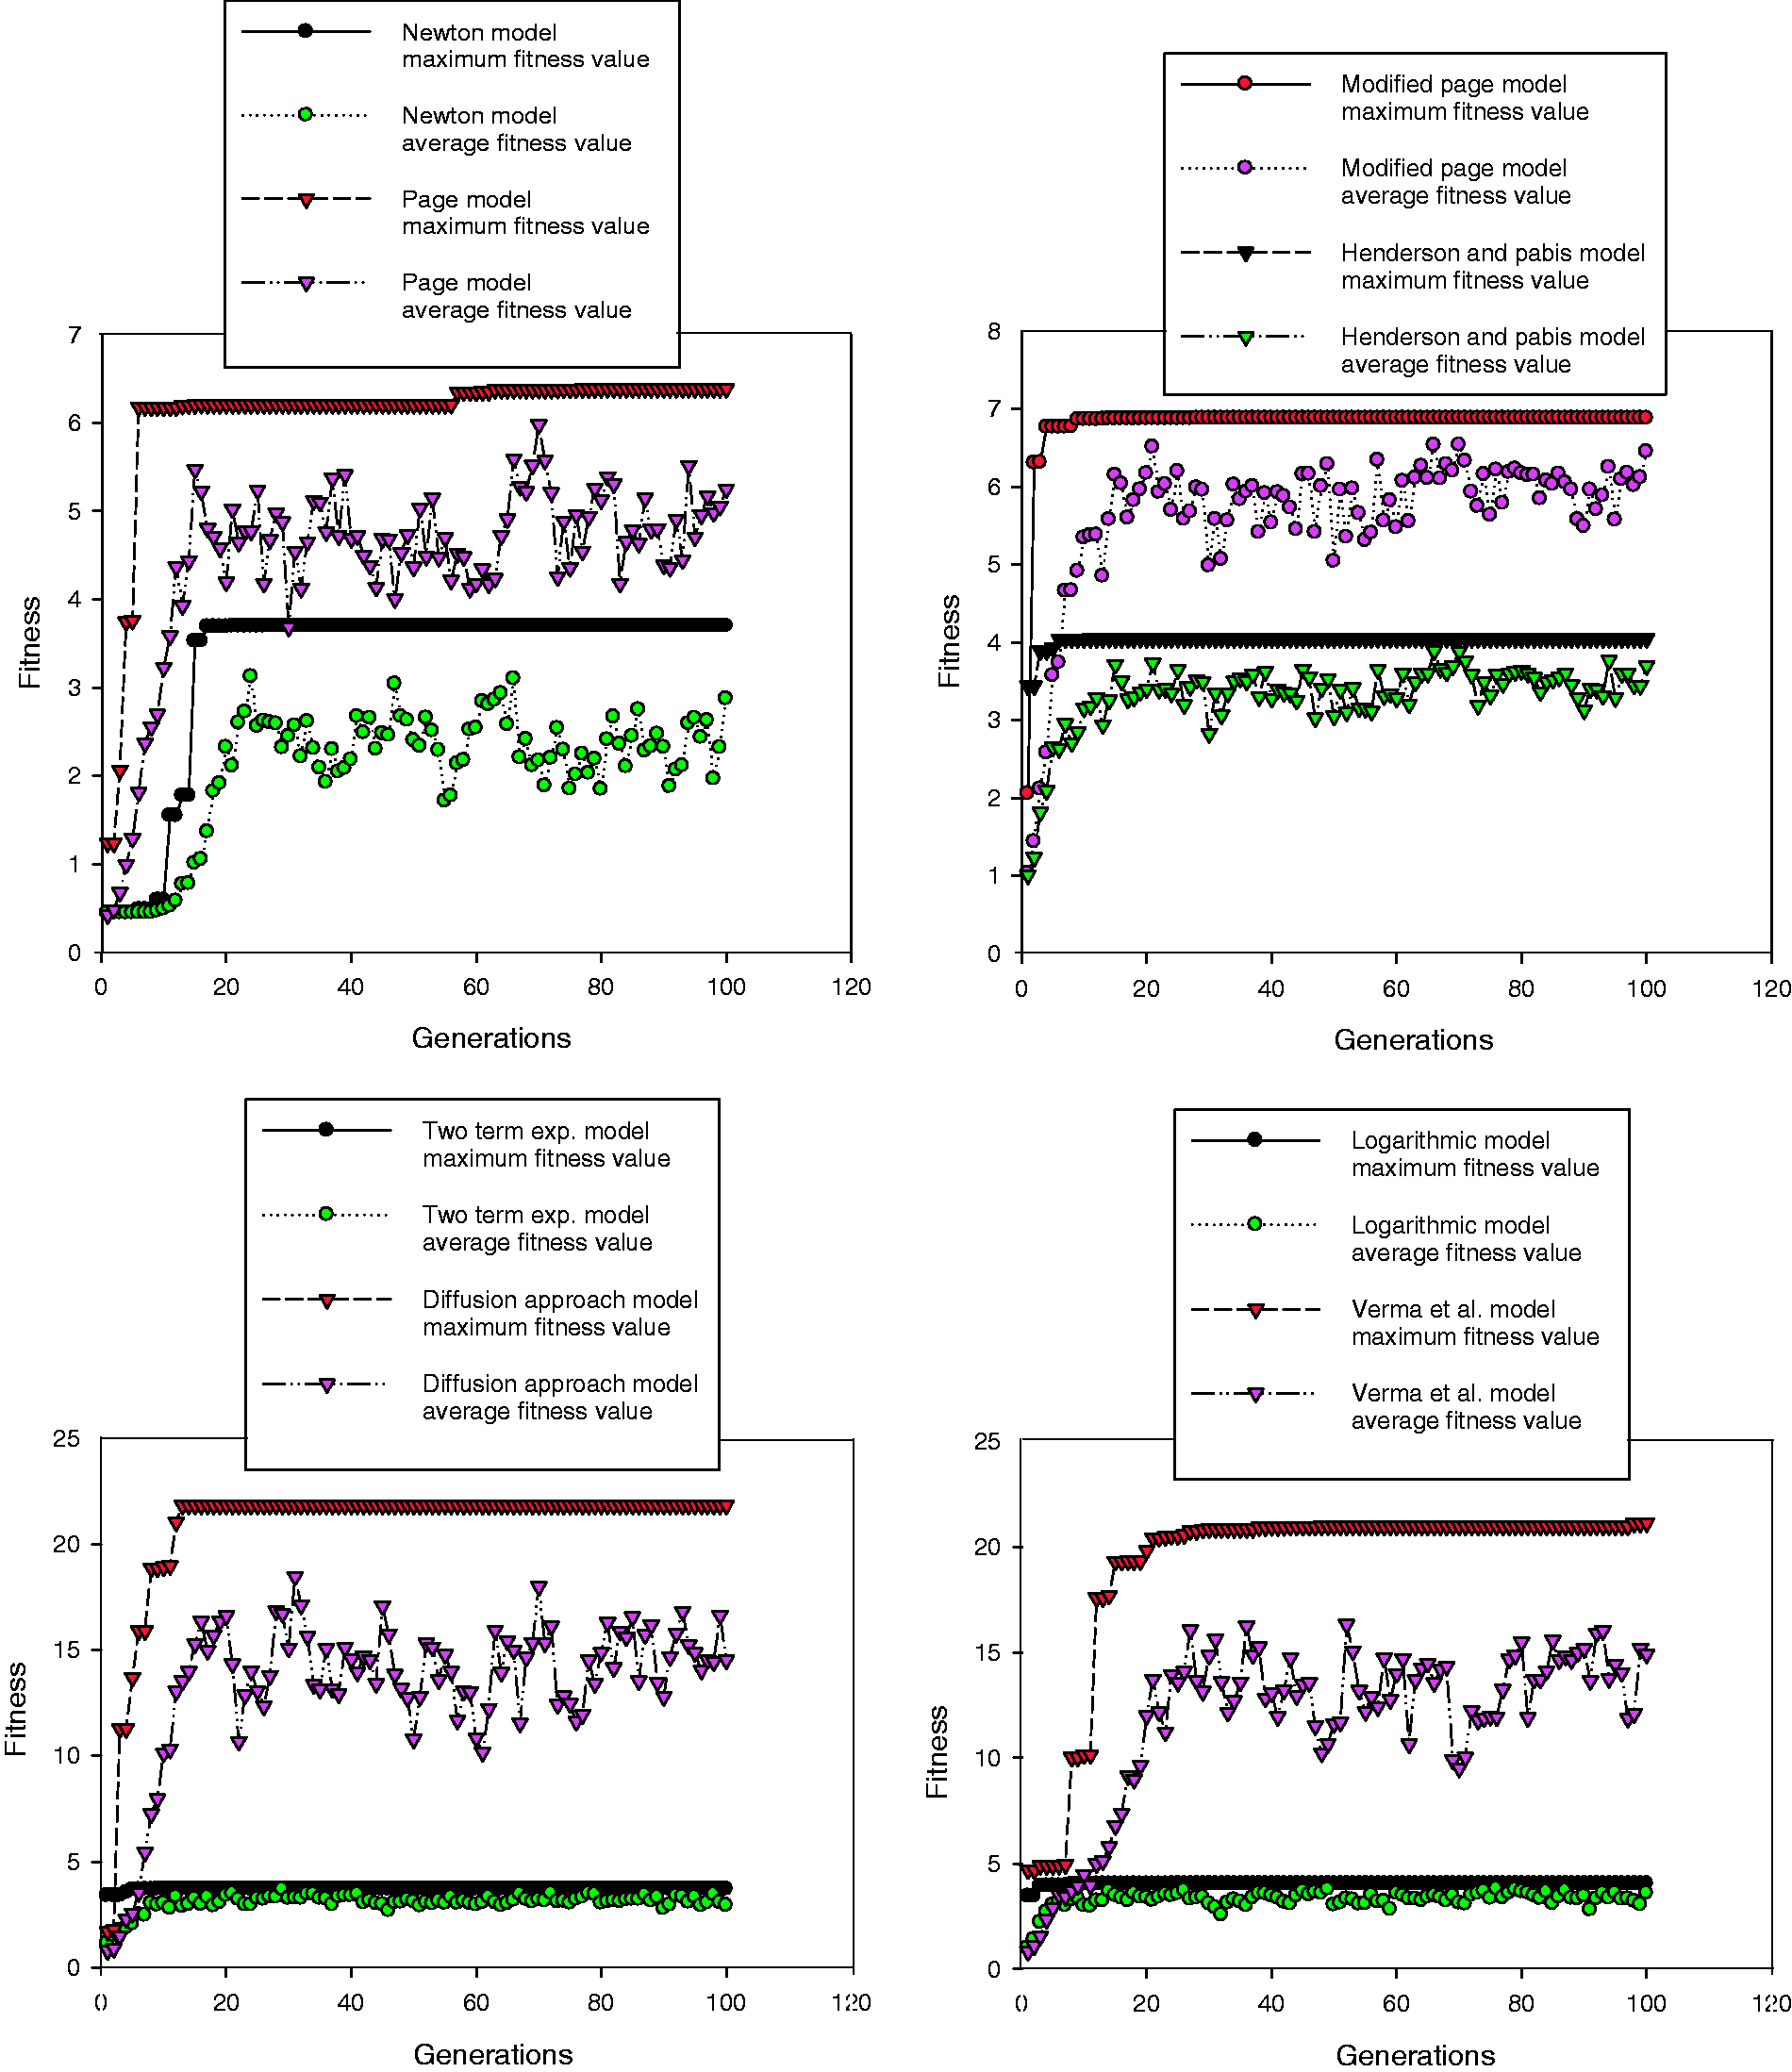

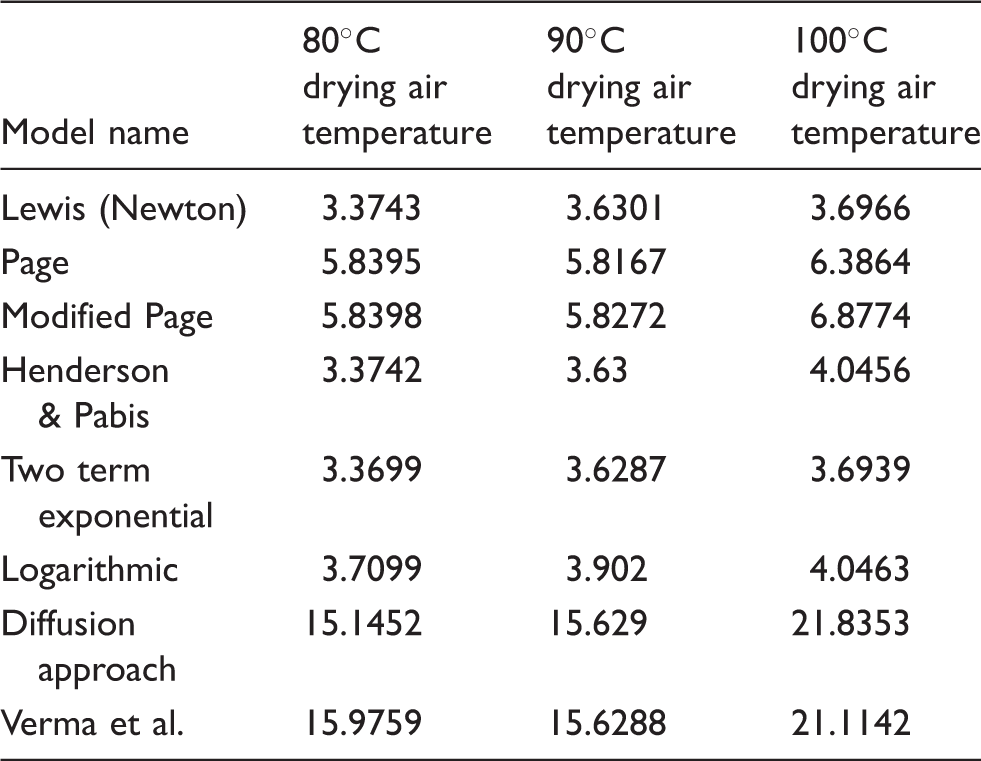
Fitness values after 100 generations
Values of parameters yielding the best fit
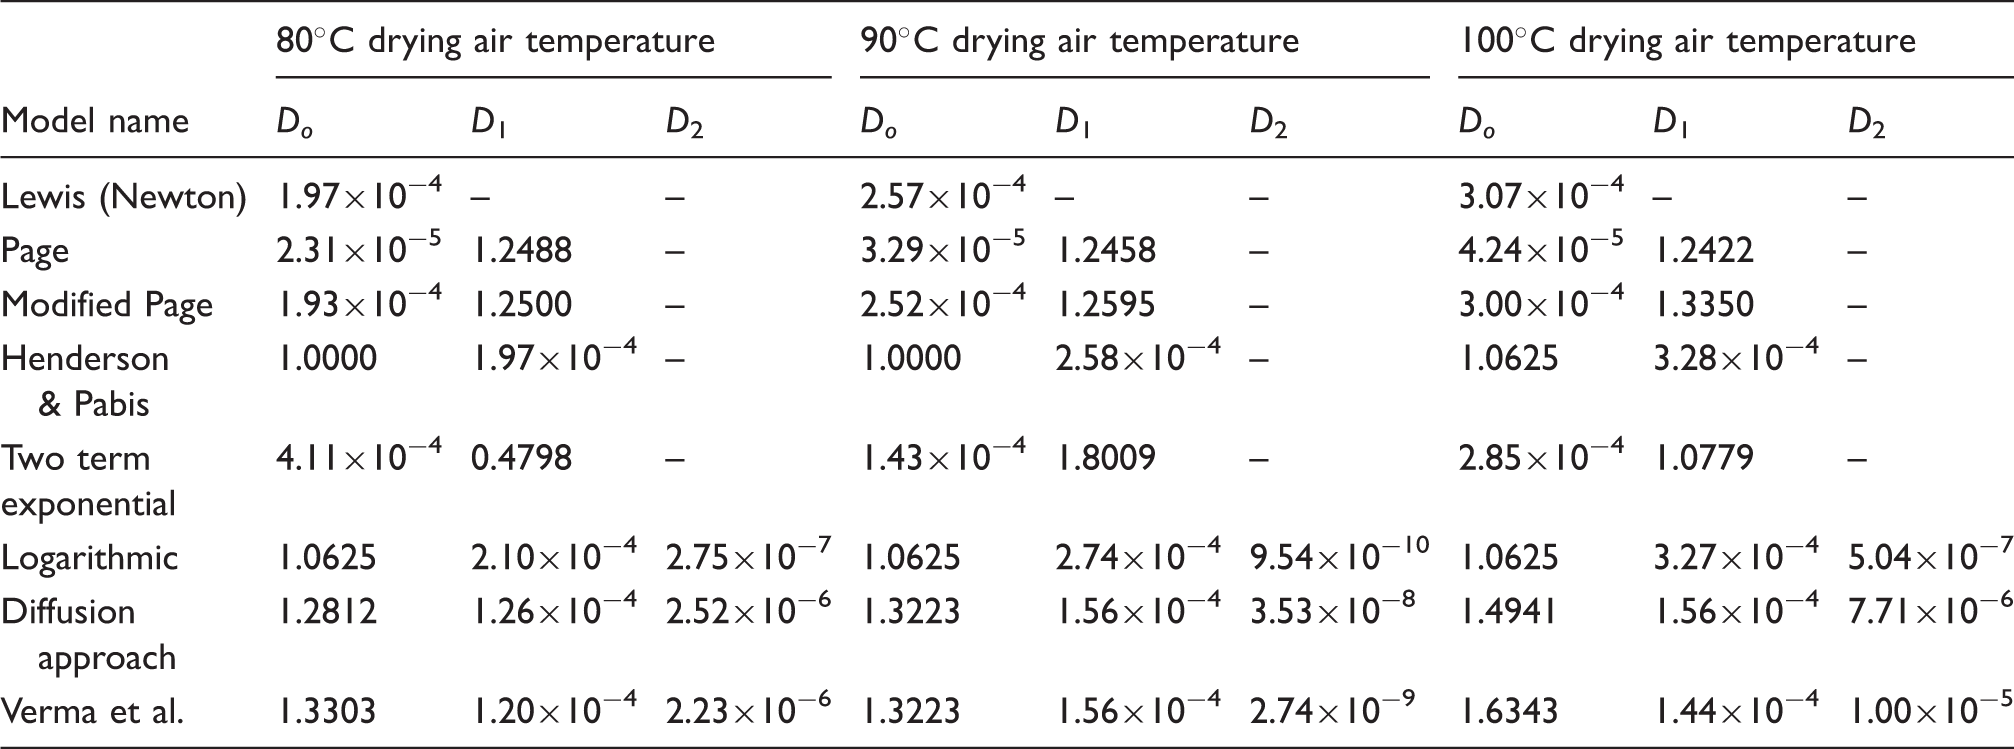
Figure 10 shows the average moisture content development as a function of time for drying air temperatures of 80℃, 90℃ and 100℃. By using the optimum parameters given in Table 8, the Diffusion Approach and Verma et al. models are presented with the experimental results in Figure 10. It is obvious that the model and experimental results are almost the same.
Conclusion
In the first part of this study a theoretical model was developed and the diffusion coefficient yielding the best fit with experimental data was determined by defining a fitness function and using the genetic algorithm. The higher fitness value corresponds to a smaller error between the predicted results of the theoretical model and experiments. In the second part of this study, several empirical and semiempirical models were considered to simulate the drying process and the values of the coefficients of the models yielding the best fit with experimental results were obtained by the genetic algorithm. Tournament selection methods were applied in the genetic algorithm. The results show that the most suitable models with a higher fitness value are the Verma et al. and Diffusion Approach models. Although the empirical and semiempirical models give a better fit, the theoretical model should be preferred as it is a model based on the physical phenomena behind the drying process. These results could be useful for quality improvement in the textile industry. The results also show that the genetic algorithm can successfully be applied in drying processes.
Footnotes
Declaration of conflicting interests
The authors declared no potential conflicts of interest with respect to the research, authorship and/or publication of this article.
Funding
The authors received no financial support for the research, authorship, and/or publication of this article.