




Abstract
Textile curtains can be designed to be good sound absorbers. Their acoustical performance, as usually described by the sound absorption coefficient, not only depends on the textile itself but also on the drapery fullness and the backing condition, that is, the spacing between the fabric and a rigid backing wall, or the absence of a backing in the case of a freely hanging curtain. This article reviews existing models to predict the diffuse-field sound absorption coefficient, which to date can only predict the case of flat curtains. A set of existing models is extended to the case of curtains with drapery fullness using a semi-empirical approach. The models consider different backing conditions, including freely hanging curtains. The existing and new models are validated by comparing predicted sound absorption coefficients with data measured in a reverberation room. Hereby, curtains consisting of different fabrics and with different degrees of fullness are considered. Besides situations with rigid backing, also the measurement data of textiles hung freely in space are included in this study. Comparisons reveal a very good agreement between measured and predicted sound absorption coefficients. Compared to currently available commercial sound absorption prediction software that can only handle the situation of flat textiles with rigid backing, the results of the presented models not only show a better agreement with measured data, but also cover a broader range of situations. The presented models are thus well applicable in the design and development of new textiles as well as in the room acoustical planning process.
Noise interrupts communication, reduces productivity and may lead to fatigue or even adverse health effects. Therefore, it is necessary to optimize the acoustical quality of rooms taking into account their usage. Materials such as glass and concrete commonly used in interior design are acoustically “hard”. These materials reflect sound energy very well, creating a very reverberant sound field in the room. Improvements of the acoustical environment, for example, in rooms where people work, communicate or relax, may often be achieved by introducing sound absorbing materials. These, by decreasing reverberation, increase speech intelligibility and make rooms quieter. Textile curtains can be designed to be good sound absorbers. For a long time, however, only heavy curtains of material such as velvet have provided sufficient absorption to fulfill acoustical requirements. Recently, new lightweight and even translucent textile curtains that absorb sound very well have been developed, 1 which has put them in the focus of interest. Further, the use of textile curtains hung freely in space as sound absorbers has recently been investigated. 2 In this paper, calculation models to predict the acoustic performance of such lightweight curtains in rooms under various conditions are presented and validated by comparison with measured data.
To quantify the acoustical performance of materials or the resulting quality of rooms, various measures are available.3,4 In statistical room acoustics,
3
the most important parameter is reverberation time. Reverberation time RT may be predicted by the well-known formula by Sabine,
5
with room volume V and total absorption area A of the room as input parameters, using

A is calculated by

The first term in Equation (2) is the sum of the product of the sound absorption coefficients
For textile curtains, several prediction models to calculate the sound absorption quantities have been developed. The classical model only considers the size of the air cavity between the fabric and a rigid wall and the specific airflow resistance of the fabric as input parameters. 3 It is based on the assumption that no sound-induced fabric vibrations occur, which is fulfilled if the fabric is much heavier than the surrounding air layer. However, for lightweight fabrics sound-induced vibrations affect the sound absorption characteristics. Several authors have proposed methods to take this effect mathematically into account.10–12
Shoshani and Rosenhouse 13 found that the microstructure of the fabric substantially influences the sound absorption coefficient. Since then, several models based on geometrical fabric parameters, such as porosity, thickness or pore size, have been proposed.10,14–18 The effect of flow distortions due to the constriction of the oscillatory flow through the material was described mathematically by Atalla and Sgard. 19 Recently, methods and theoretical models have been developed that have a high potential to provide accurate predictions for multilayer curtains either mounted in front of walls or freely hanging in the room. 18 In the prediction, the effects that occur during testing in a reverberation room are considered, such as edge diffraction at the specimen 20 and non-uniform intensity distribution of the incident sound, 21 as well as the effects mentioned above already. However, to date the models have only been validated with measurements of the absorption coefficient for normal incidence in the impedance tube, 22 but not with measured data from a reverberation room. Further, the published models have been limited to flat curtains so far.
The objective of this study is therefore to extend the existing models of Pieren and Heutschi, 18 which are the most recent available models, to the case of folded curtains. Hereby, the focus lies on the general case of a single fabric layer curtain. In the following, the existing models of Pieren and Heutschi 18 to predict the sound absorption performance of curtains as measured in the reverberation room are briefly outlined. The models are then semi-empirically extended to the case of folded curtains. Finally, predicted results are compared to measured data from a reverberation room.
Theory and model development
In this section existing models for flat curtains are briefly summarized and subsequently extended to the case of curtains with drapery fullness. A fullness of 0% corresponds to a flat curtain; a draped curtain having twice the amount of fabric is referred to as 100% fullness. The existing and extended models allow for a description of the following four cases:
case I: flat curtain in front of a rigid wall; case II: freely hanging flat curtain (without wall); case III: folded curtain in front of a rigid wall; case IV: freely hanging folded curtain (without wall).
Existing sound absorption models for flat curtains (cases I and II)
The models discussed here originate from the model presented by Pieren. 17 The final model 18 describes the general case of sound absorption coefficients of flat, lightweight, multilayer curtains, that is, the above cases I and II. Below, the equations to predict the (diffuse-field) sound absorption in reverberation rooms are derived and simplified for the case of a single layer curtain.
For case I, the considered set-up consists of a thin sheet of fabric that is mounted at a well-defined distance d in front of a rigid, that is, fully reflecting, surface forming an air cavity, as shown in Figure 1. The thickness of the sheet is assumed to be small compared to the wavelength of sound. It is further assumed that a plane airborne sound wave is incident on this structure. The incident sound wave is then partially reflected at, partially transmitted through, and partially absorbed by the fabric. At the right-hand side of the air cavity, the sound wave is fully reflected at the rigid wall and returns to the fabric from the opposite side, where the wave is again partially reflected, transmitted and absorbed. Hence, a complex sound field with interference of incoming and reflected waves is being built-up in the cavity. This again strongly affects sound absorption and, in particular, its frequency dependency. In contrast to case I, in case II (Figure 1), where the fabric is far away from any boundary, the transmitted wave is not reflected, but propagates away from the curtain. According to standard ISO 354,
6
case I is characterized by Sketch of case I with a fabric sheet at distance d to a rigid wall and of case II with a freely hanging fabric sheet without air cavity.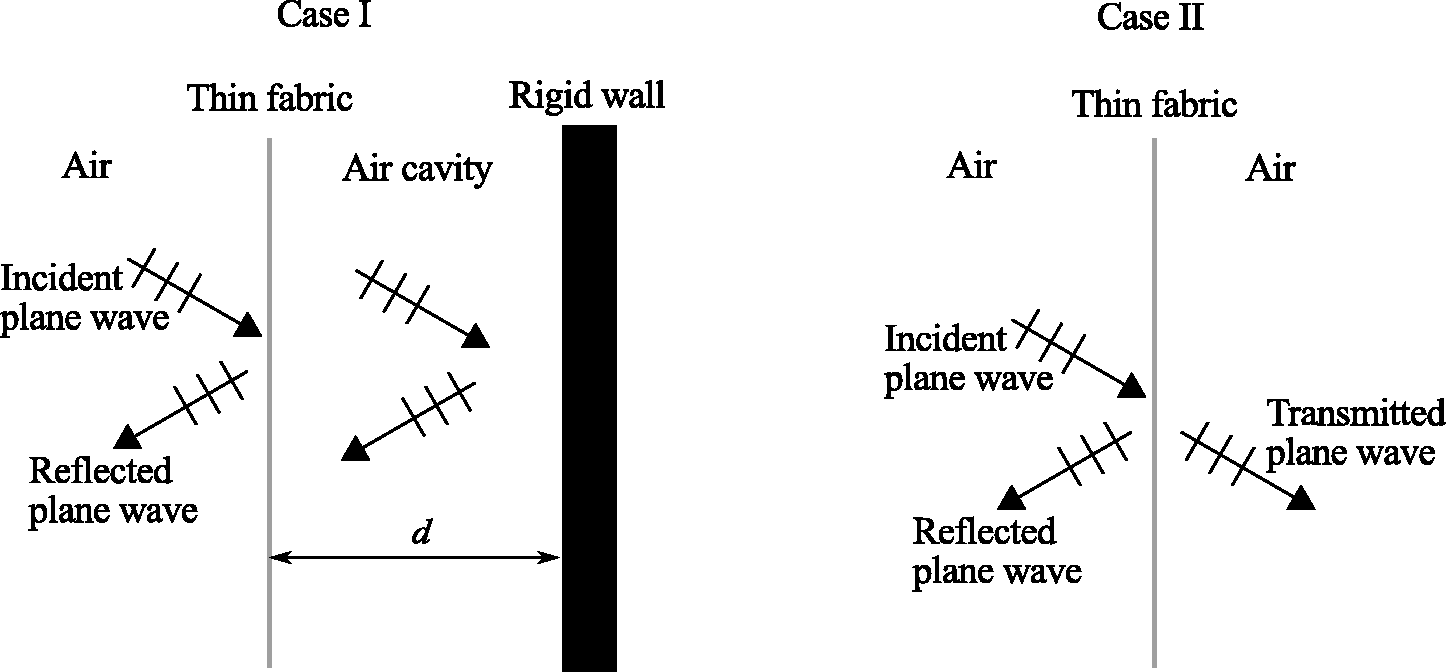
The physical behavior of the above structures can be described by physical models, such as the equivalent circuit (EC) method 23 that is well suited and broadly used for this purpose.7,11,12,17,18,24 In this analogy, mechanical and acoustical quantities or elements are represented by equivalent electrical quantities or elements. Accordingly, the ratio of a sound pressure and a sound particle velocity yields an acoustical impedance.
The fabric impedance Zf is defined as the ratio of the sound pressure drop across the fabric and the sound particle velocity inside the fabric. For thin fabrics this impedance fully characterizes the acoustical behavior of the textile. It can be calculated from the specific airflow resistance Rs (in Pa s/m)
25
and the area density m (in kg/m2) as7,11,12

As the geometric arrangement of the textile strongly determines the acoustic field (see above), different equations for the absorption, based on the fabric material [Equation (3)] and the backing condition, need to be established. Further, for the backed or freely hanging textile they have to be distinguished between
For a flat fabric placed at a distance d (in m) to a rigid wall, the statistical absorption coefficient is described by
18


The averaged radiation impedance
For case II, the equivalent absorption area of a freely hanging fabric of surface area S (in m2) may be obtained by
18

It is interesting to note the similarities of Equations (4) and (6) in the presented form, which is not obvious in the general form of the equations presented by Pieren and Heutschi. 18
If
New sound absorption models for folded curtains (cases III and IV)
In practical applications, instead of flat curtains often folded curtains, that is, with fullness larger than 0%, are used, where a fullness of 100% is most common. Fullness influences the sound absorption of curtains.27,28 Until now, no model for the prediction of sound absorption by folded curtains is available. Based on theoretical considerations, numerical simulations and conclusions on measured data, a semi-empirical model for
Commonly folded curtains are mounted in parallel to a flat wall or window (case III), as depicted in Figure 2. By introducing a certain degree of drapery fullness, the distance of the fabric to the backing wall varies locally. To characterize such a situation it is useful to use the average distance Sketch of cases III and IV of a folded thin curtain with an average distance 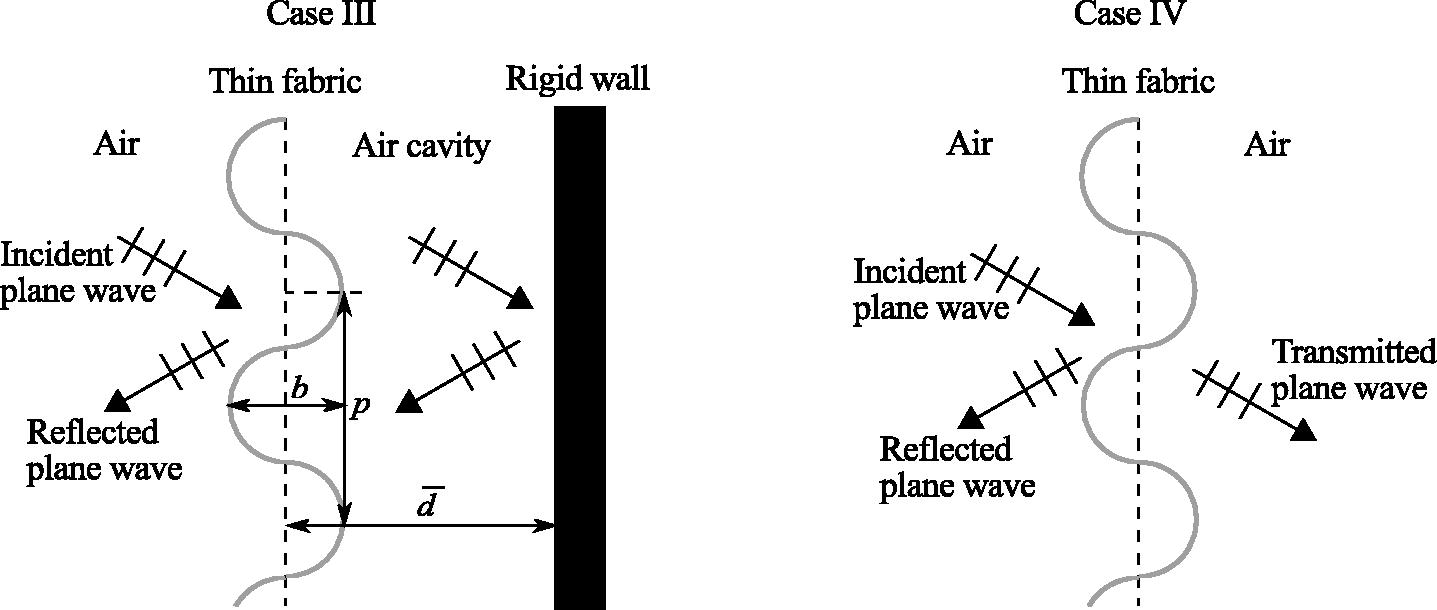
Firstly, for a given fabric, the depth of the air cavity strongly affects the frequency dependency of the absorption coefficient (as in the above case I). For a flat fabric (case I), the air cavity depth d primarily determines the frequencies of the local maxima and minima of the absorption coefficient. 18 A variation of the cavity depth thus smoothes the frequency dependency of the absorption coefficient. Therefore, intuitively the variation of air cavity depth is accounted for by averaging absorption coefficients calculated for several discrete distances.
Secondly, the folding implicates that a portion of the incoming and reflected sound waves traverses the fabric more than once while passing the curtain. This effect is expected to play a role only at grazing incidence and at high frequencies. The corresponding wavelengths thus have to be small compared to the folding. To model this effect, a frequency and geometry dependent function ξ is introduced. ξ describes the portion of sound energy that traverses the fabric double compared to the flat case. It may take values of 0 ≤ ξ ≤ 1.
With these two assumptions, the model for case III may be derived by adopting the model of case I. We propose a semi-empirical model for the statistical absorption coefficient of folded curtains as follows

In Equation (7),

In Equation (8), the expression in parentheses describes the sound energy that is not absorbed by a single fabric layer. A portion of this energy (ratio ξ) passes through the textile multiple times and is reduced by

Equation (9) was established based on the following considerations. For frequencies below a certain cut-in frequency,
Further,
Finally, the folding depth has to be of the same order of magnitude as or larger than the folding period. How much larger is not critical, as fullness larger than 100% does not provide any substantial change in
Note that the area density m used as input data in Equation (7) is independent of fullness, even though the total area density of the folded curtain increases because of the total mass increase, whereas its area remains constant. In fact, numerical simulations with a doubling of the area densities (100% fullness) resulted in distinct overestimations of
In this study we also consider the situation with a folded curtain mounted freely hanging in the diffuse field of a room (case IV), as depicted in Figure 2. We introduce a new equation for this case as an extension of the equation of case II

Materials and methods
For model development and validation, the diffuse-field sound absorption of four textiles with varying acoustical properties was measured under different backing conditions and fullnesses, and also predicted using the presented models.
Textile characteristics
Non-acoustical parameters of fabrics 1–4

Measurements
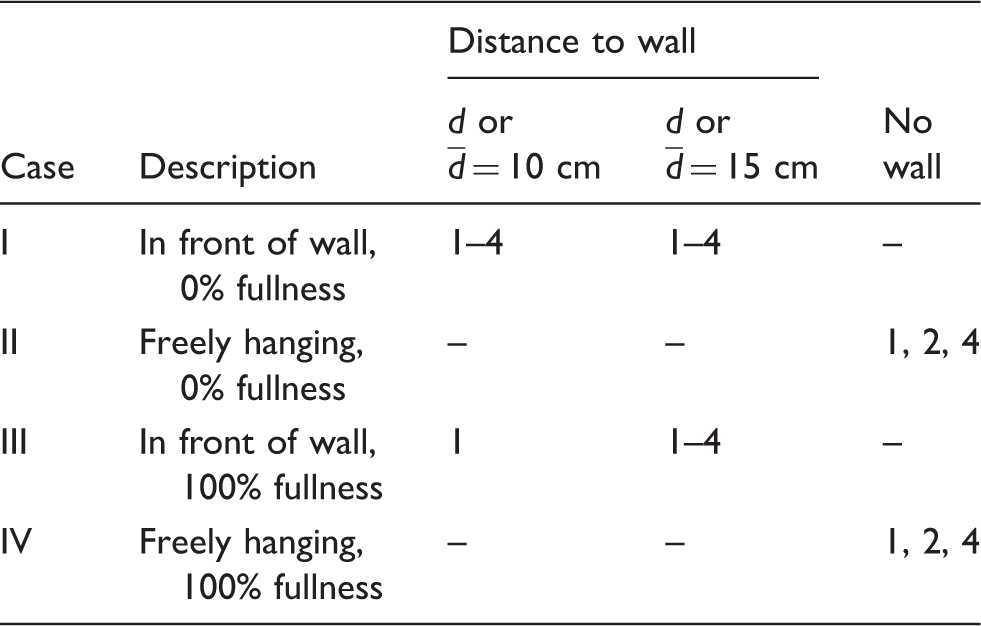
Measurement overview for the textiles 1–4 (according to Table 1) and their configurations to obtain the statistical absorption coefficient
Empa’s reverberation room has a volume of 215 m3 and a peculiar shape with all walls skewed and not vertical to the floor. The room is equipped with hanging sound diffusers to further increase its diffusivity and a humidifier ensures a minimum relative humidity of 60% to reduce air absorption to minimum. Four fixed loudspeakers and six microphones are distributed in the room to measure the spatially averaged reverberation time with and without a test specimen. The reverberation time is evaluated using the so-called impulse response method, where level decays and reverberation times respectively are found by backward integration of the measured room impulse response functions. For the measurement of the impulse response function, the reverberation room is excited with a maximum length sequence (MLS) signal. Based on the difference in reverberation time with and without a specimen, the (diffuse-field) sound absorption of a test object or a test material is calculated. The size of the reverberation room requires test specimens with dimensions of typically 3 m × 4 m. In the used reverberation room, flat absorbers as well as specimens that require a well-defined distance to a rigid backing, as for cases I and III in this study, are placed in a fixed specimen zone on the floor, which was determined during the qualification procedure of the facility. To mount the textiles with a well-defined distance to the floor, wooden rectangular frames of 3 m × 4 m with different heights with thin tensioned wires attached at their top that span across the test area were used (cf. Figure 3). The fabrics were placed over these wires. For the flat case (case I), fabrics of 3 m × 4 m were used. The distance d to the rigid surface (cf. Figure 1) was realized by using frame heights of 10 or 15 cm. Measurements of folded curtains (case III) were made with 100% fullness, that is, fabrics of 3 m × 8 m were used. Figure 3 shows a photograph of a fabric mounted on the wooden frame with 100% fullness. With a wire spacing of 9 cm, a folding period p = 9 cm was achieved (see close-up view in Figure 3), which is a typical value for curtain systems. For the folded fabrics this resulted in a folding depth b = 7 cm. The mean distance Photographs showing textiles during the measurement in the reverberation room for the configuration of a folded curtain (case III) and a freely hanging curtain (case II).
Predictions
Statistical absorption coefficients
The calculations were performed at the center band frequencies of 1/27 octave bands, and only the final results were averaged to 1/3 octave bands. As a first step, for each fabric its fabric impedance Zf was determined by Equation (3) using the values given in Table 1. Zf was then inserted either into Equation (4) or (6). To numerically solve the integrals in these equations, the angle θ was discretized in steps of 2°, corresponding to 0.035 radians. Further, the area S (in m2) and cavity depth d (in m) was the same as in the experiments. In Equation (4) the weighting function given by Equation (5) was applied, and the averaged radiation impedance
From the predicted absorption coefficients
Comparison of measured and predicted data
In this section the measured and predicted results of different textile specimens and configurations, according to Table 2, are presented and compared for model validation.
Flat curtains in front of wall (case I)
Figure 4 shows measured and predicted Measured and predicted statistical sound absorption coefficients for flat curtains in front of a rigid wall (case I) of fabrics 1–4.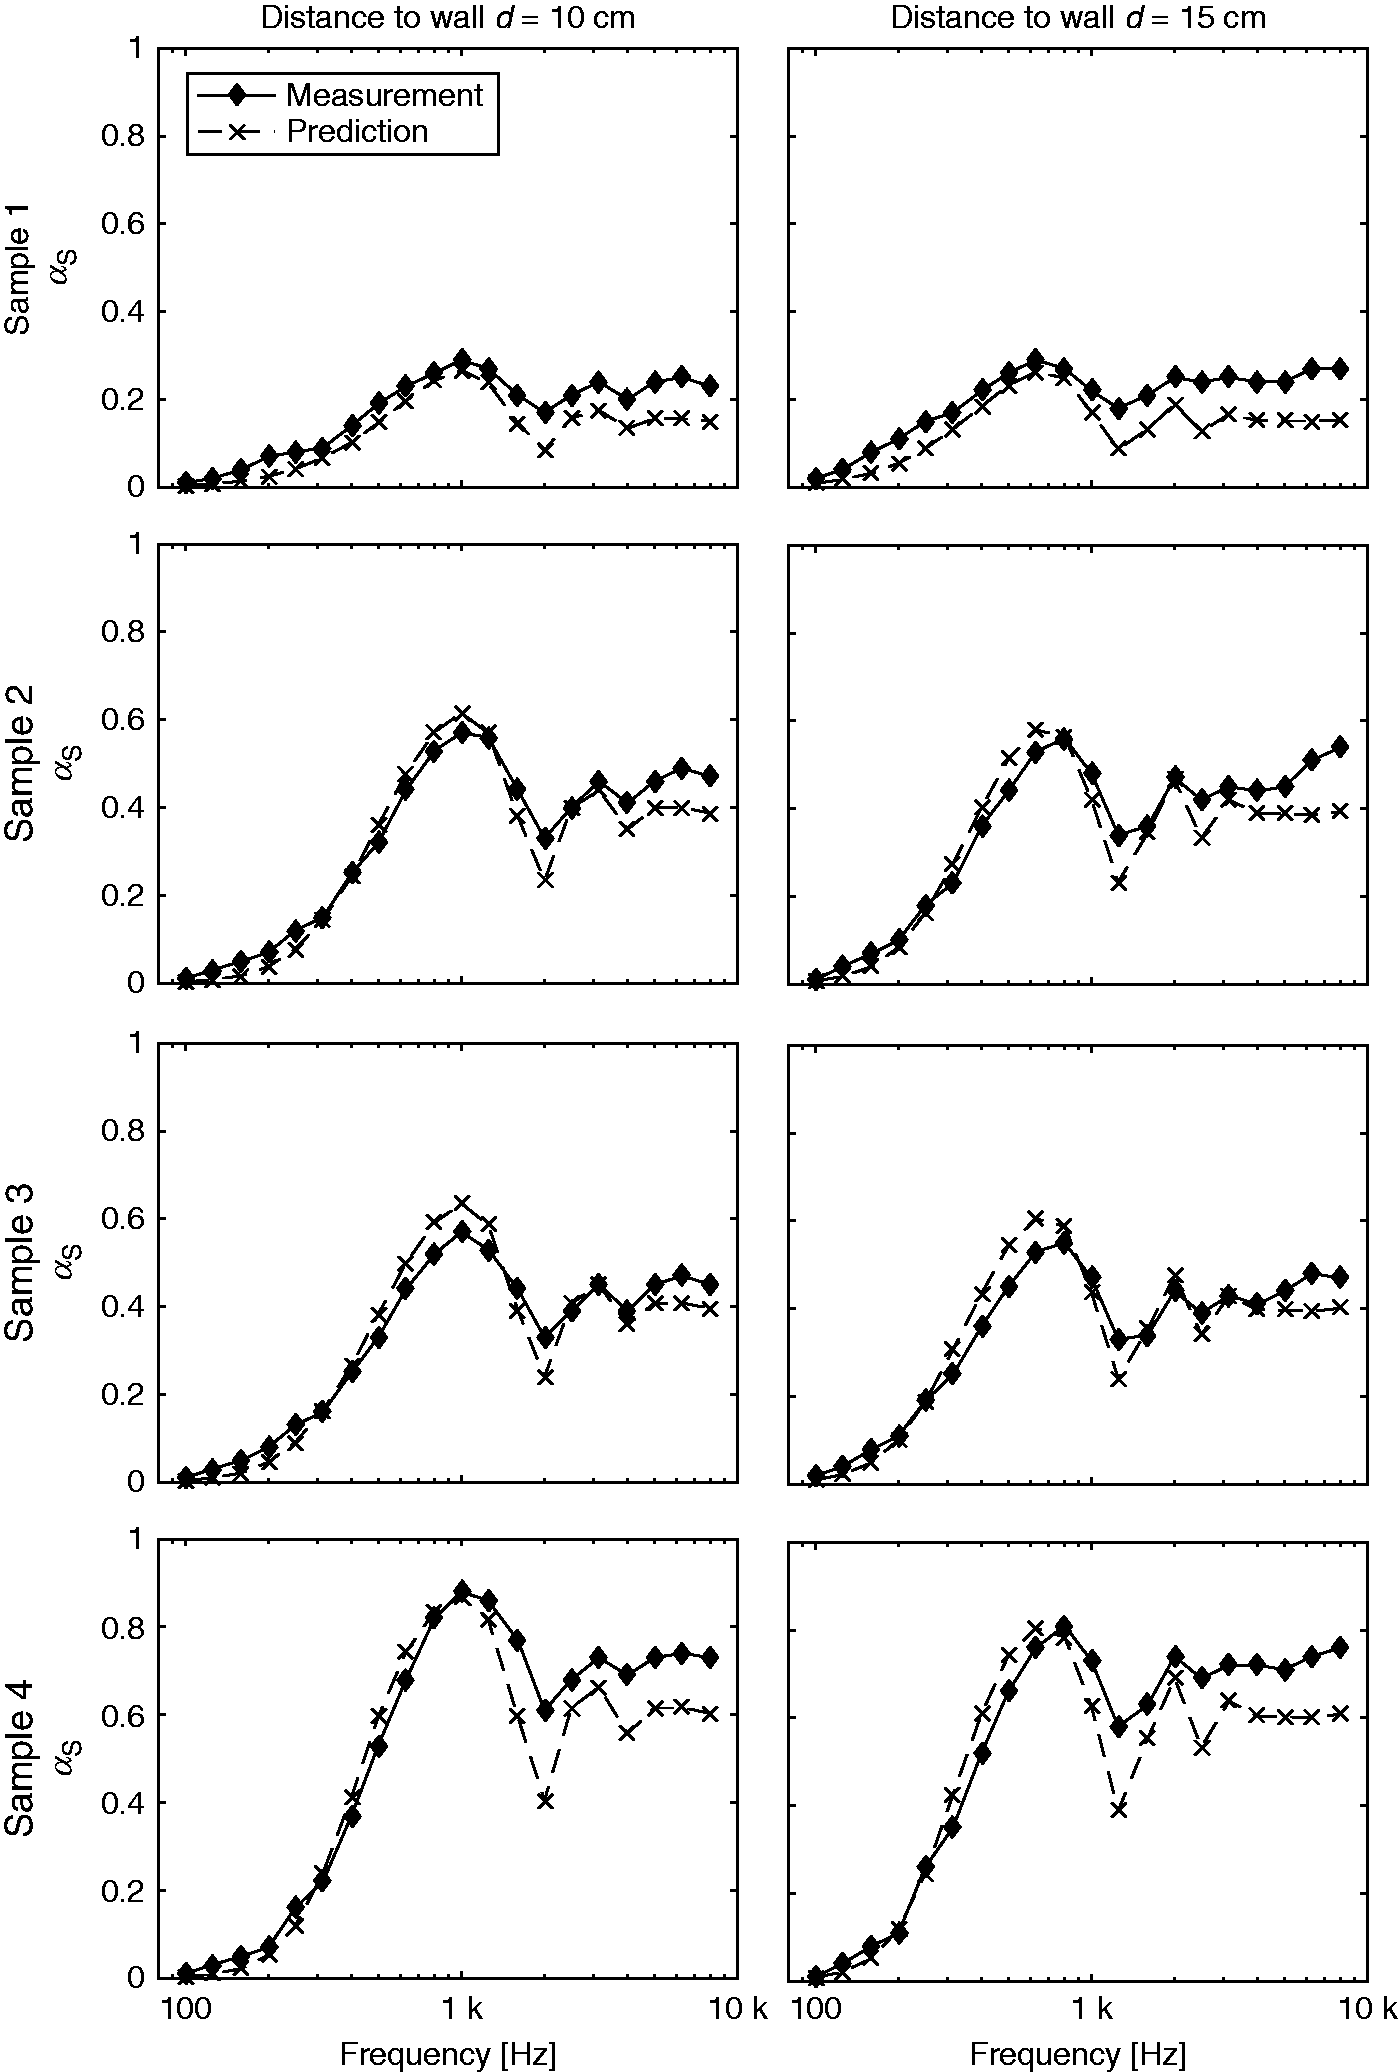
In particular, the values at the local minima are clearly more pronounced in the calculations than in the measurements. Apparently, the model overestimates the destructive interferences, which are less prominent in measurements where non-ideal conditions, such as residual absorption and scattering within the air cavity, lead to a coherence loss, which remains unaccounted for by the model. Further, at frequencies below 300 Hz, deviations between measured and calculated data may be observed, particularly for fabric 1. Predicted data slightly underestimates
Finally, at high frequencies (above 2–4 kHz) the model predicts systematically lower values than measurements. The reason for this is not known. Three hypotheses are now shortly discussed. A first possible reason is the non-uniform intensity distribution during the measurement. Although the model accounts for this effect with Equation (5), this approximation may be inadequate for high frequencies. However, the fact that similar differences also occur for freely hanging curtains (see the next section) does not support this hypothesis. Secondly, generally also peculiarities of the laboratories might play a role. Round robin tests between laboratories have revealed large inter-lab differences. 31 A third possible reason is the fabric impedance model [Equation (3)], which assumes static airflow through the fabric. This assumption may become inappropriate at high frequencies where effects such as inertia of the air moving inside the pores or flow distortions on both sides of the fabric occur. These effects are omitted in the applied model. To account also for these effects, the fabric impedance model would have to be extended. However, for the development and validation of an extended fabric impedance model, impedance tube measurement data well above 2 kHz would be required, but are currently only available up to 1.6 kHz. 17 To investigate this possible deficiency of the model, preliminary impedance tube measurements were conducted on a sample of fabric 4 up to 6.4 kHz. They in fact revealed higher absorption coefficients at high frequencies than what the model predicts. These findings support the hypothesis that the fabric model has to be refined to more accurately predict the sound absorption coefficient at high frequencies.
Freely hanging flat curtain (cases II and IV)
Figure 5 shows measured and predicted Measured and predicted equivalent absorption areas for flat and folded freely hanging curtains (cases II and IV) of fabrics 1, 2 and 4. Shown values are normalized to a reference area of 10 m2.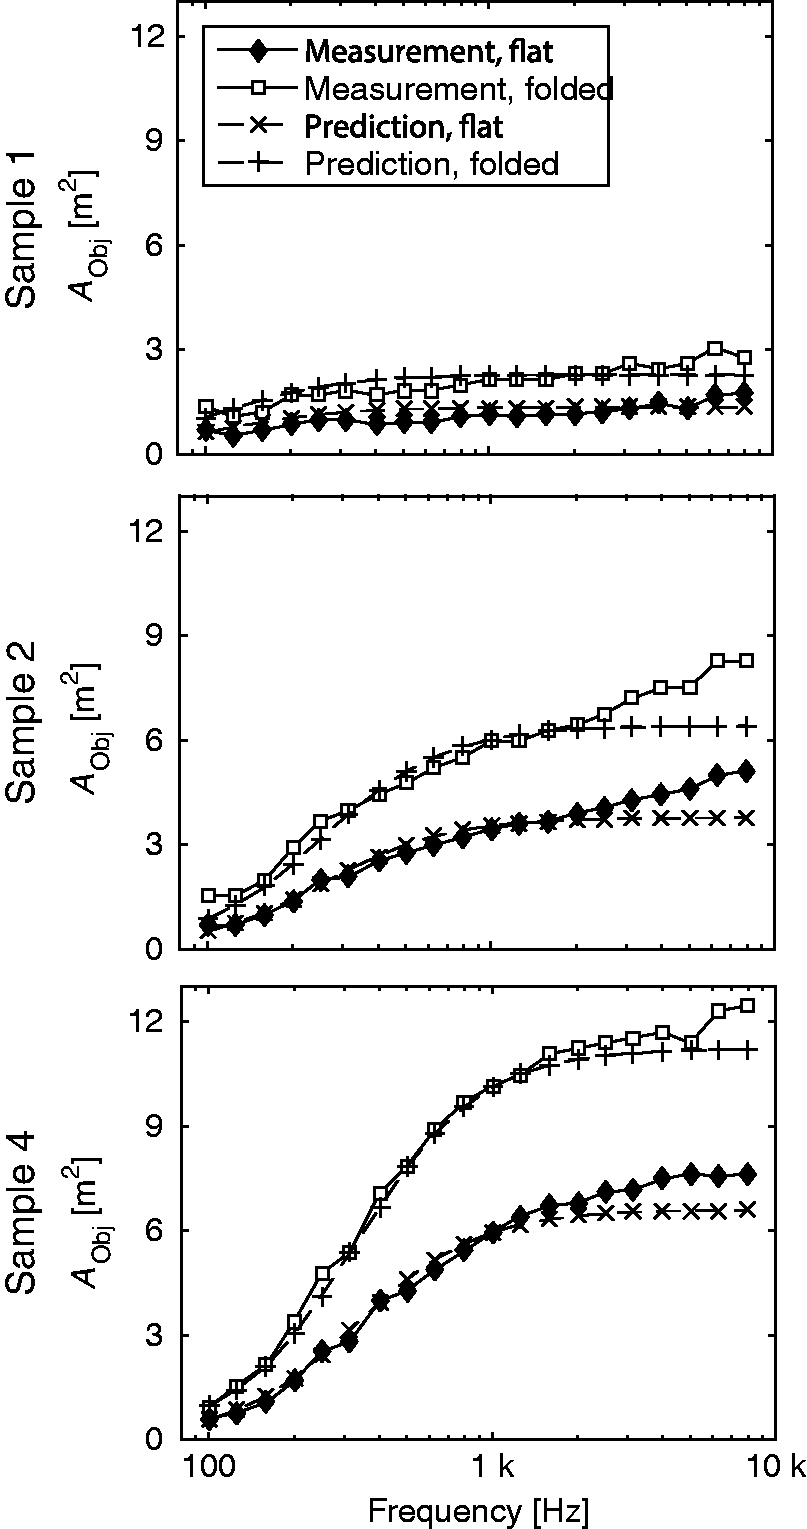
The measurements show that for curtains with identical covering areas,
Measurements and predictions closely agree from 100 Hz to more than 1 kHz. Above this, the model increasingly underestimates
Folded curtains in front of wall (case III)
Figure 6 shows measured and calculated Measured and calculated sound absorption coefficients for folded curtains in front of a rigid wall (case III) of fabrics 1–4 for average distance to the backing wall 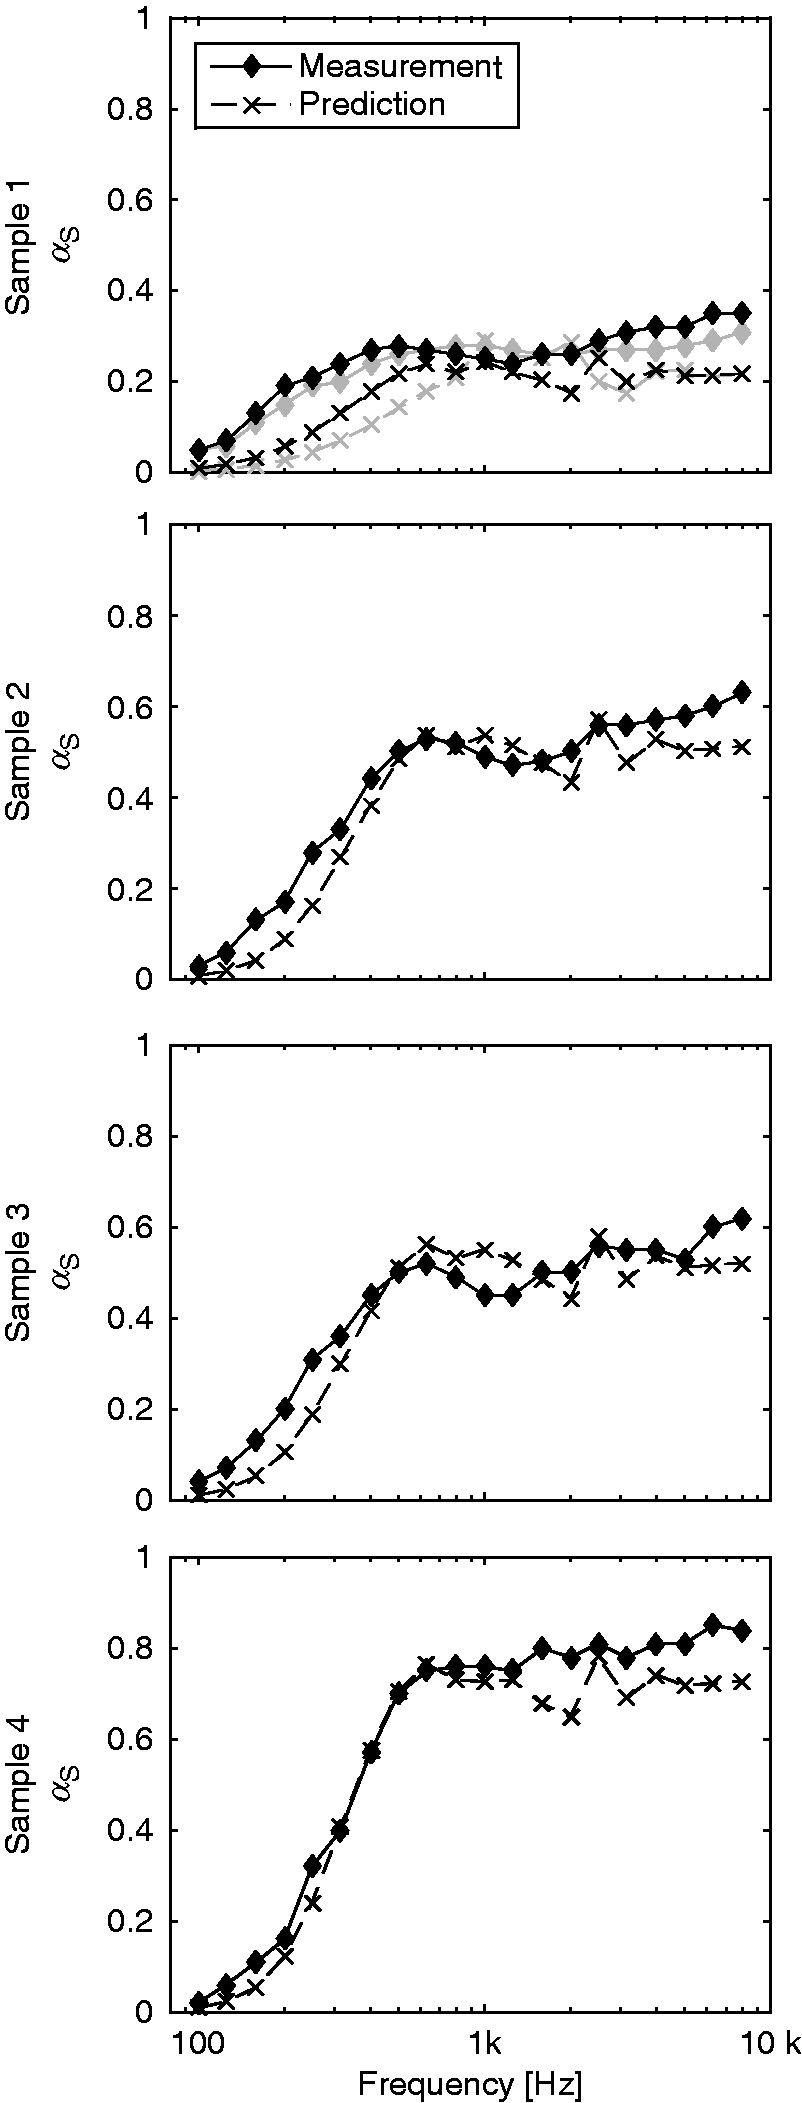
The model predicts the absorption satisfyingly well in the measured frequency range from 100 Hz to 8 kHz for all fabrics. As for case I, the model underestimates measured
Weighted absorption coefficient (cases I and III)
Figure 7 contains a comparison of measured and predicted weighted absorption coefficients determined from the above data of cases I and III. The measured and calculated values agree very well. The maximal deviation of the predictions amounts to 0.05. In six out of 13 data pairs, the prediction underestimates the measurement by 0.05, and zero otherwise. The differences of measured and predicted values thus exhibit a mean value and standard deviation of 0.02 ± 0.03. The mean value does significantly differ from zero with a probability of 0.99 (one-sample two-tailed t-test).
Comparison of measured and predicted weighted absorption coefficients 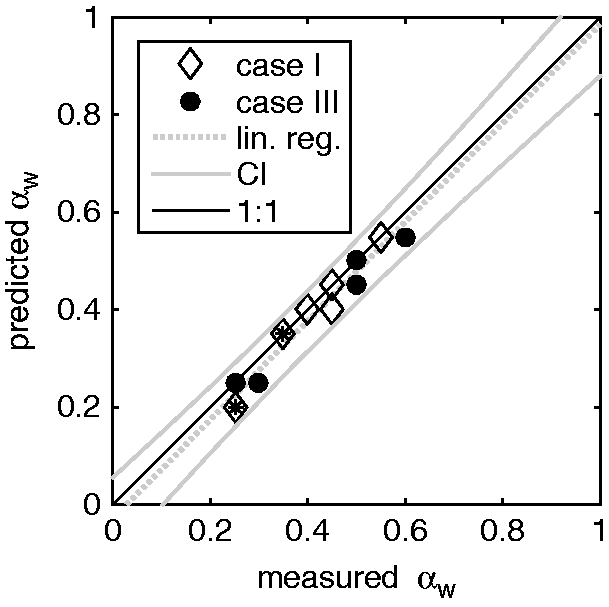
This integral comparison of predicted and measured
Thus, the models, amongst other purposes, can be used to optimize Simulation result showing the weighted absorption coefficient 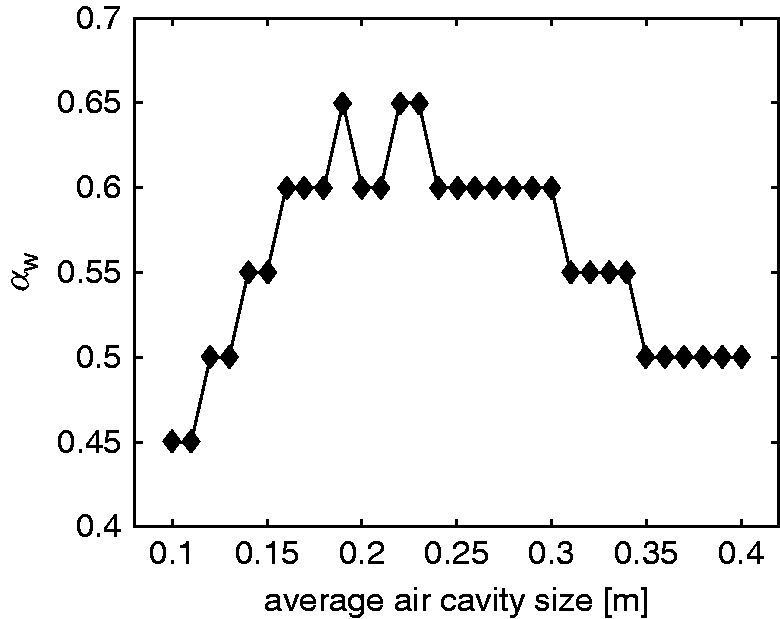
Comparison of the presented model with commercial software
This section is dedicated to a comparison of calculation results by the presented model, and existing models that are implemented in commercial software. To our knowledge, no software specifically for the prediction of sound absorption of curtains exists. However, there are a few programs available that allow treating multilayer structures in front of a rigid wall. In these programs a flat curtain in front of a rigid wall (case I) may be entered as two layers, that is, an air cavity of depth d and a thin layer of porous material. In the following comparisons, the three commercial software packages SoundFlow, Winflag and Zorba (randomly named Software 1, 2, and 3 to maintain anonymity in the results) were used as follows.
AFMG SoundFlow, Demo Version 1.0.11 (Ahnert Feistel Media Group, Berlin, Germany) with the following specific program settings. Porous absorber calculation model: Bies/Hansen
32
(only available model of the basic version of SoundFlow); dimension ISO 354 (3 m × 4 m); direction of incidence: diffuse field. No information has been found concerning the calculation of random incidence absorption. WinFlag, Demo Version 2.4 (Morset Sound Development, Trondheim, Norway) with the following specific program settings. Reverb room, square with side length 3.163 m; selected porous absorber calculation model: Delany–Bazley.
33
The calculation of the random incidence absorption coefficient is based on Thomasson.
20
Zorba, Version 3.0.1 (Marshall Day Acoustics Ltd Pty, Adelaide, South Australia). Selected porous absorber calculation model: Allard–Champoux.
34
The calculation of the random incidence absorption coefficient is based on Thomasson.
35
Figure 9 exemplarily compares the predicted sound absorption coefficients Comparisons of the sound absorption coefficient 
As an integral comparison, Figure 10 shows the predicted and measured weighted absorption coefficients Comparison of predictions of weighted absorption coefficients 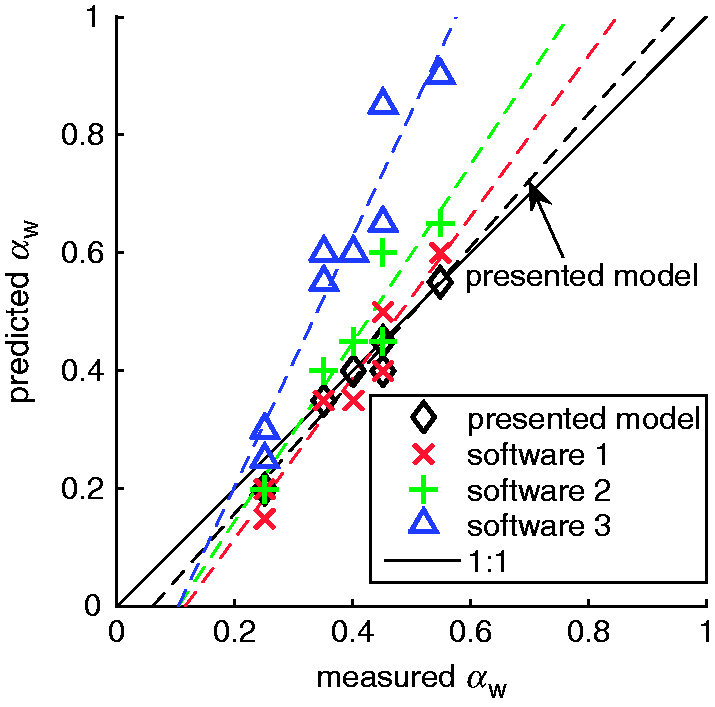
Conclusions
In this article, existing and new calculation models for the diffuse-field sound absorption of textile curtains were presented. The models cover flat as well as folded curtains, and the configuration with a rigid backing and without backing. For these cases modeling results were compared to measured results from a reverberation room. Generally, a very good agreement between measured and predicted values was observed. Comparisons revealed only at high frequencies the potential for further model improvements. Nevertheless, compared to currently available commercial sound absorption prediction software, the presented models not only yield more accurate results, but also cover a broader range of configurations, while the commercial software can only handle the case of flat textiles with rigid backing. The proposed method performs considerably better than commercial software and can be a viable alternative to experimentally measured values, which are prone to uncertainties of similar magnitude. The models are therefore applicable to textile development as well as to room acoustical planning purposes. Although the studied parameter range was quite remarkable, further validations should be performed to extend the applicability of the models, in particular regarding higher specific airflow resistances. The results further indicate that future prediction model improvement could be achieved by enhancing the fabric model.
Footnotes
Acknowledgements
We would like to thank four anonymous reviewers for their constructive comments and Martin Wü rzer for his help in the measurements.
Declaration of conflicting interests
The authors declared no potential conflicts of interest with respect to the research, authorship and/or publication of this article.
Funding
The authors received no financial support for the research, authorship and/or publication of this article.