
Abstract
The main topic investigated in this paper is the effective measurement of the fabric friction property by the comprehensive handle evaluation system for fabrics and yarns (CHES-FY). The optimal system parameters of the CHES-FY were determined using an orthogonal experiment design based on the correlations between four curve parameters from the pulling-out force – the displacement curve of the CHES-FY and the friction coefficient tested by the Kawabata evaluation system for fabric surface tester. The repeatability and stability of the CHES-FY under settings of optimal system parameters were also analyzed. Moreover, the four curve parameters were used to cluster the smoothness/roughness handle of fabrics objectively by the k-means cluster method, and the clustering results of the k-means cluster method were compared with those of the subjective cluster method. Analysis of the results showed that the selected optimal system parameters were a good combination, and the CHES-FY with the optimal system parameters provided an effective and reliable evaluation to the friction coefficient and smoothness/roughness handle of fabrics.
Keywords
The friction property is one of the primary mechanical performances of a fabric, which affects the handle, comfort and aesthetics, as well as application of the fabric.1–3 Many studies on the friction property of fabrics have been conducted, such as that of Izumi et al., 4 took up the surface roughness and slipping resistance as tactile parameters to explore the surface properties of fabrics, and three sensory tests were employed to discriminate between surface roughness and slipping resistance of the fabric; Ravandi et al. 5 studied the dynamic friction property of fabrics and analyzed the relationships between fabric structure and the stick–slip motion; Zurek et al. 6 investigated the friction behavior of fabrics woven from filament yarns and found that the differences in fabric friction depended on the morphology of the fabrics and the rubbing directions. To study the correlation between friction and smoothness and better meet the requirements of end-use textile products, quantitatively measuring and characterizing the friction properties of fabrics become necessary. Zurek et al. 7 used a modified Instron tester to measure the frictional resistance of fabrics. Ramgulam et al. 8 designed a non-contact method of using a laser sensor for the measurement of the surface friction of fabrics. Ramkumar et al. 9 employed a polymeric artificial finger sensor to measure the frictional characteristics of fabrics by simulating the feeling mechanism of human fingers, and comparisons between instrument measurements and subjective assessments confirmed the accuracy of this method. Taylor and Pollet 10 also developed a tester to evaluate the low-force frictional properties of fabrics against the engineering surface. A well-known friction apparatus is the Kawabata evaluation system for fabric surface tester (KES-F4). 11 The KES-F4 uses two testing units, which comprise a series of steel piano wires to simulate the friction ridge in a human’s fingers; during the testing, the two units slide on the surface of a fabric to measure three indices correlated with surface characteristics in order to evaluate a fabric’s friction properties. However, the apparatus mentioned above was designed to test only one pure property during one test; it is not suitable for evaluating the smoothness/roughness handle attribution that is related to multiple mechanical properties of fabrics. Moreover, the comprehensive property of fabrics is not a simple linear combination of different mechanical properties.
An alternative method was presented by extracting a rounded sample through a ring or orifice to evaluate the comprehensive behaviors of fabrics.12–17As a result, a commercial tester, that is, the PhabrOmeter fabric evaluation system, was developed by Pan. 18 The PhabrOmeter system could use a single instrument to measure the comprehensive response behavior of fabrics in order to evaluate the fabric handle characteristics, where the value of the smoothness handle of a fabric was calculated by featuring the extraction curve parameters that were related to the friction property. However, this method could not measure the pure mechanical and physical properties of fabrics directly.
Recently, the comprehensive handle evaluation system for fabrics and yarns (CHES-FY) has been developed to achieve the goal of measuring mass, bending, friction and tensile/shear properties for both fabrics and yarns in situ and assessing fabric handle by a pulling-out test.19–21 The friction property can be evaluated based on the principle of capstan equation and the corresponding indices of physical and mechanical properties have been derived by a series of theoretical models.22–24 The fuzzy mathematics method was used to characterize fabric handle based on the pulling-out force – the displacement curve of the CHES-FY. 25 However, the system parameter setting and corresponding effects of the system parameters on the results of the friction characterization of the CHES-FY have not been discussed. Therefore, this paper detailed an experimental study to investigate the optimal system parameters of the CHES-FY for friction testing based on the orthogonal experiment design and correlation analysis; the effective and repeatability of the system for evaluating the friction coefficient and smoothness/roughness handle of fabrics are also discussed under the optimal system parameters.
Experimental details
Samples and primary parameters
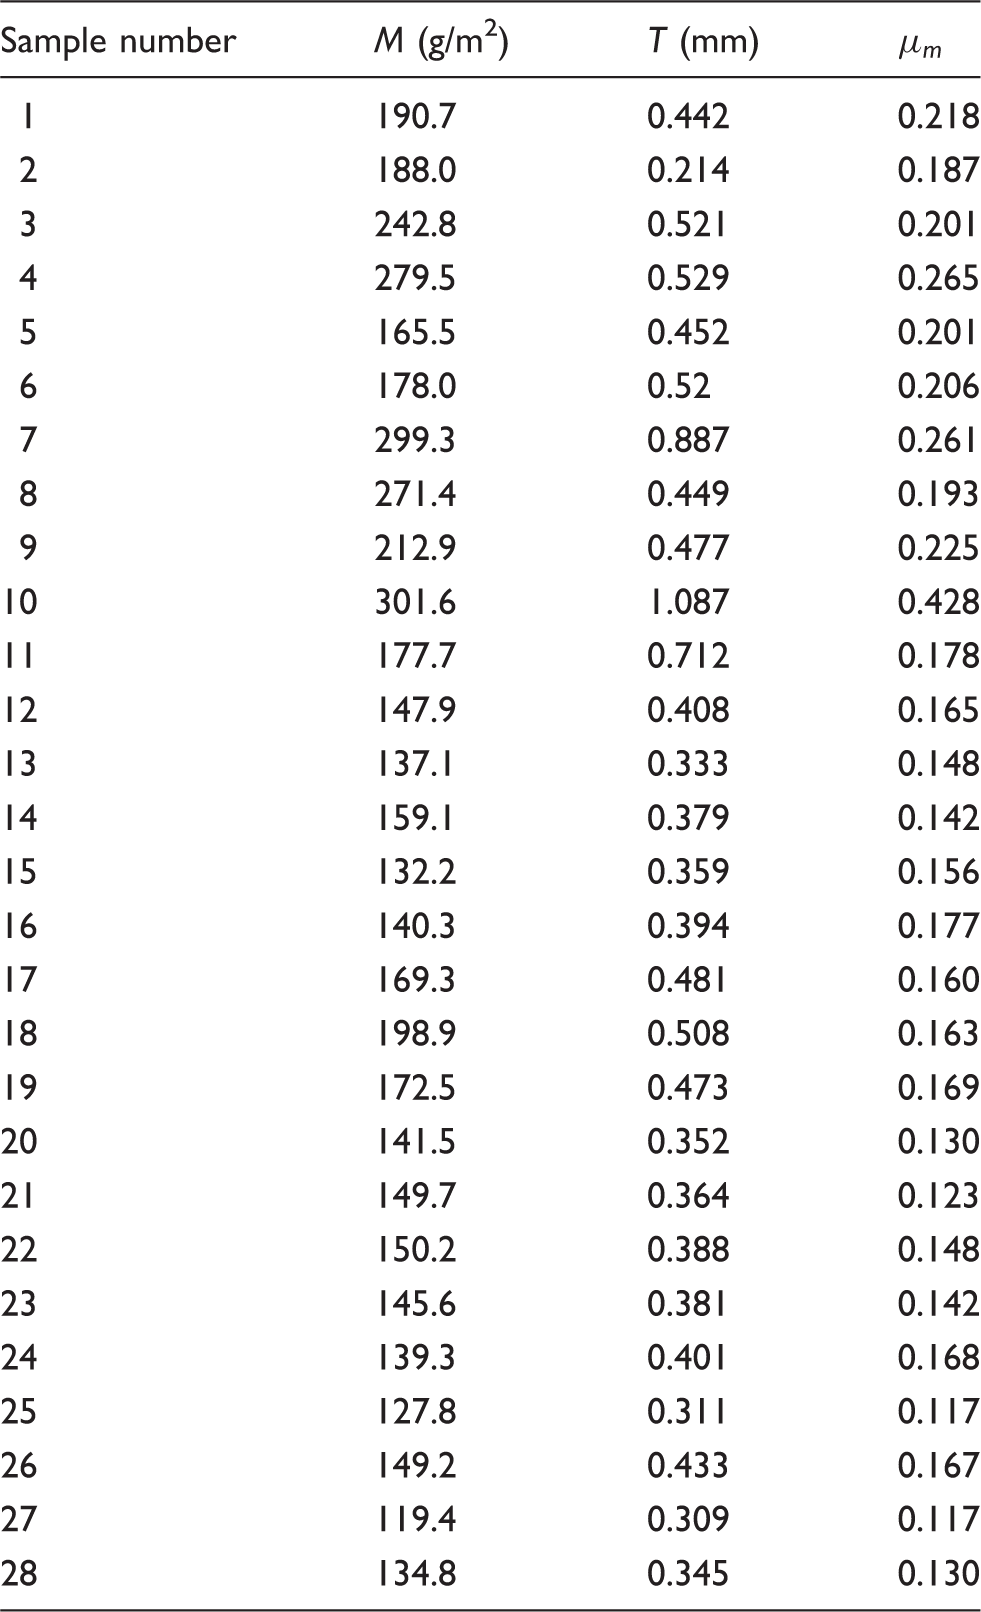
Primary parameters of 28 wool woven fabrics
The CHES-FY and the friction test
The schematic structure of the CHES-FY, which comprises a pulling pin, bi-U-shaped pins, a pair of jaws, a force sensor and a digital camera, is illustrated in Figure 1. The horizontal distance between the two jaws (DJJ), the interval of the bi-U-shaped pins (DPP), the vertical distance between the jaws and the bi-U-shaped pins (DJP) and the diameter of bi-U-shaped pins (d) can be adjusted according to experimental conditions (see Figure 1).
Three-dimensional schematic structure (a), two-dimensional schematic structure with four system parameters (b) and artifact photo (c) of the comprehensive handle evaluation system for fabrics and yarns.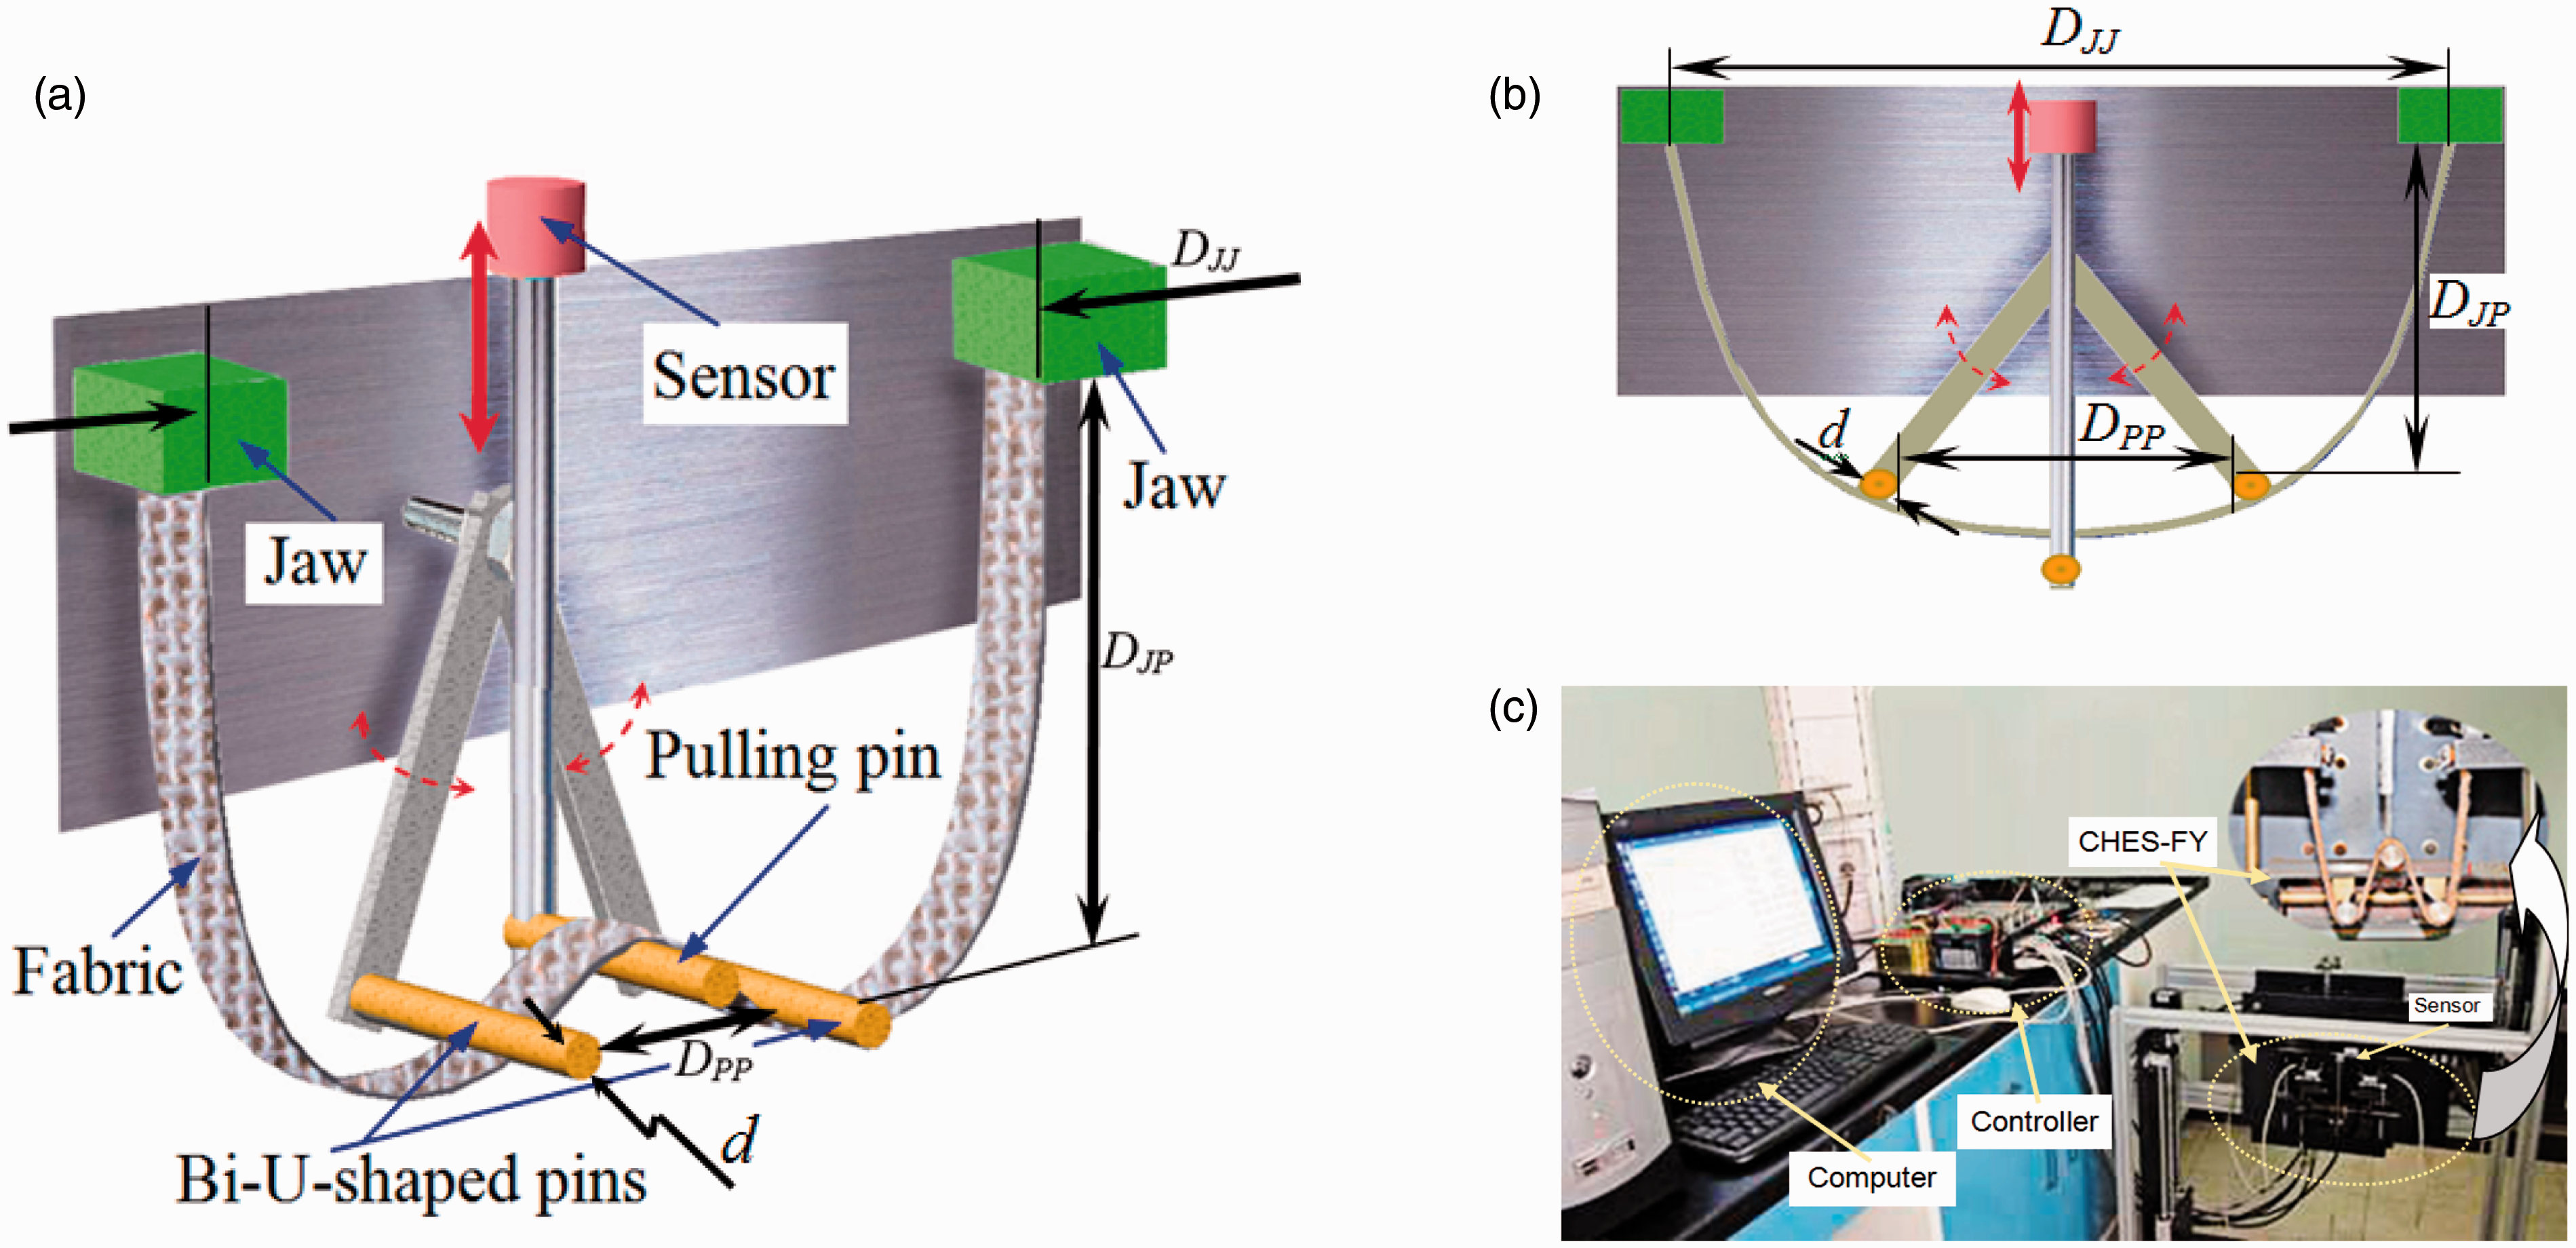
The pulling pin can move up and down to pull a fabric sample through the interval of the bi-U-shaped pins, and the force sensor connecting with the pulling pin can simultaneously record the pulling-out force. By analyzing the deformation of the fabric, the pulling-out process of the CHES-FY is divided into four steps, that is, weighting, bending, friction and stretching steps; the friction step starts at the end of the bending step when the pulling-out force reaches a maximum value and finishes when the fabric start to be stretched by the pins,
26
as shown in Figure 2. Thus, the pulling-out force–displacement curve was generally divided into the corresponding four segments referring to the turning points (see Figure 2(b)). Before the maximum value of the pulling-out force, bending deformation is dominant, and the pulling-out force mainly reflects the bending property of the fabric. Thus, the increasing segment of the curve was considered to correspond to the bending step. Thereafter, the pulling-out force suddenly decreases once the fabric begins to slip on the surface of the bi-U-shaped pins by overcoming the static friction, where the dynamical friction coefficient of fabrics is a key factor that affects the slope of the falling segment of the curve. Therefore, the linear fitting slope of the falling segment of the curve (termed as the right-hand slope, Sr) and the maximum pulling-out force (termed as peak value P) were selected as the two curve parameters. The area under the falling segment of the curve (i.e. the right-hand area, Ar) was also extracted to better reflect the features of the falling segment. In the following status of the pulling-out process, the contacting angle between the fabric sample and bi-U-shaped pins is approximately constant, showing a segment of the horizontal curve, which significantly displays the friction behavior of the fabric, so it was selected as another curve parameter and termed as horizontal force (fm). The fabric keeps sliding along the surface of bi-U-shaped pins until it tends to be stretched with the pulling-out force–displacement curve showing a rapid increase at the last segment (i.e. the stretching step). The four curve parameters for evaluating the friction property of fabrics are illustrated in Figure 2(b).
The pulling-out process (a) and corresponding pulling-out force–displacement curve with four curve parameters (b) of the comprehensive handle evaluation system for fabrics and yarns.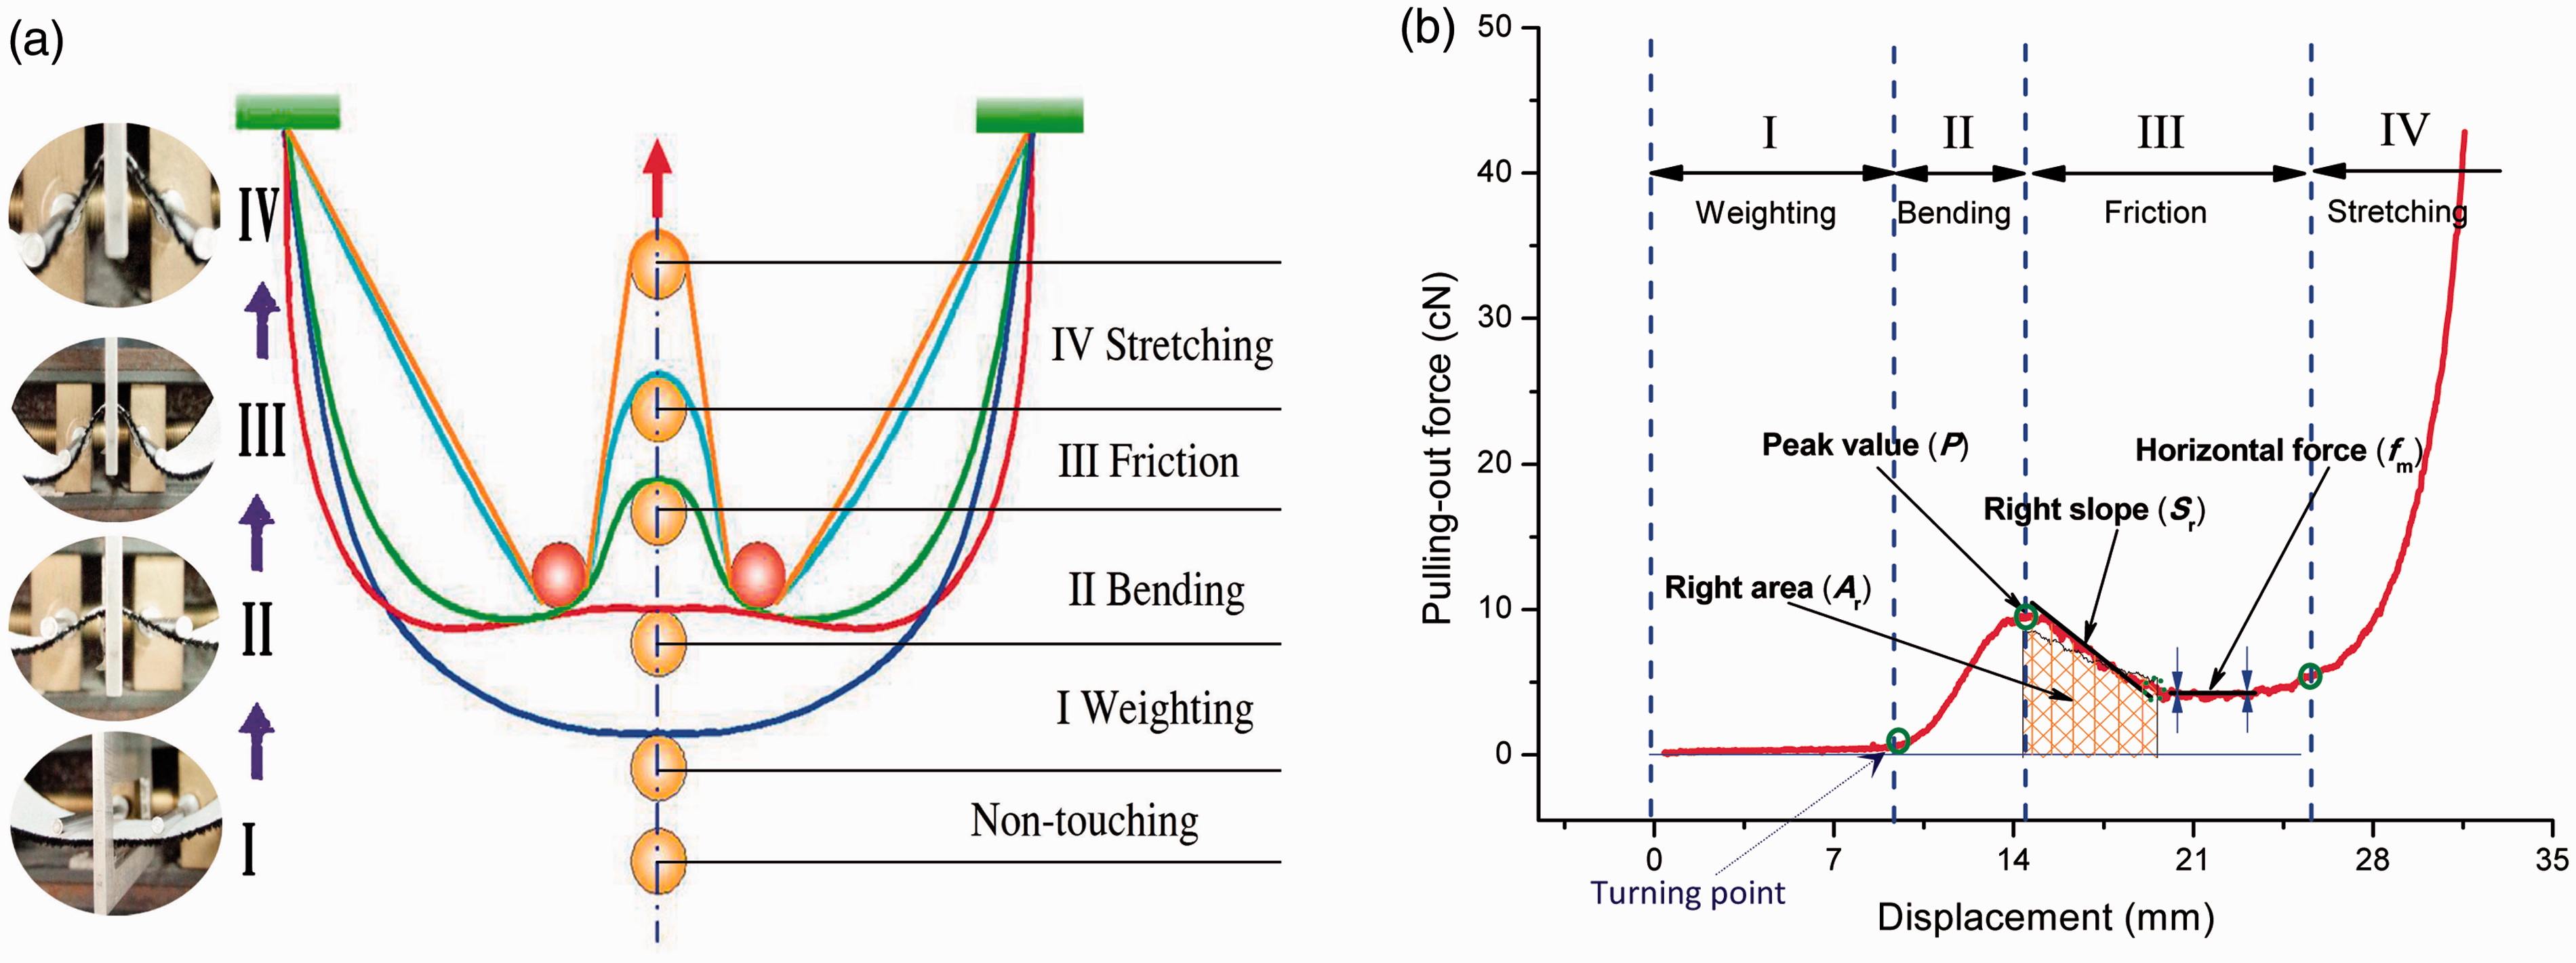
Design of the orthogonal experiment
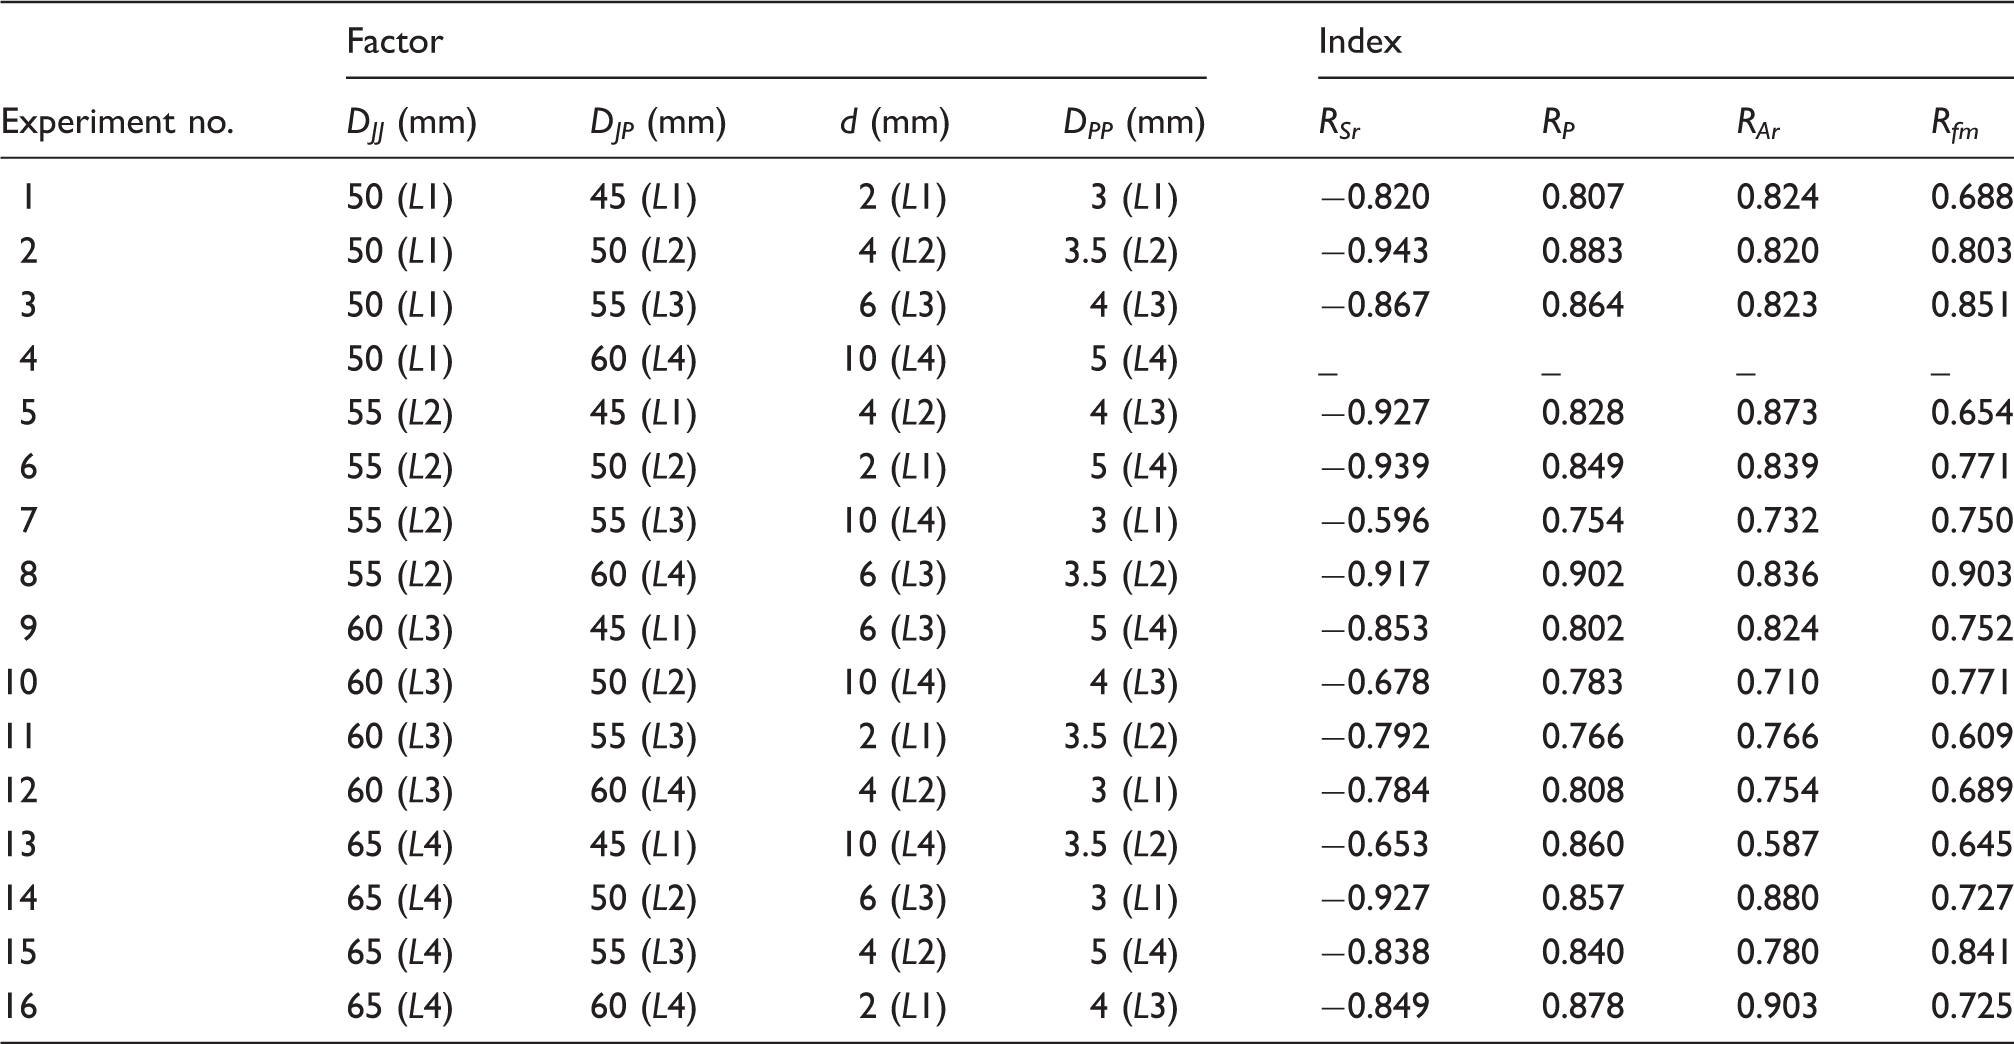
The orthogonal experiment was applied to select optimal system parameters in order to better evaluate the friction property of fabrics by the CHSE-FY. The four system parameters, that is, DJJ, d, DJP and DPP, were selected as four factors, and each of the factors was assigned with four levels. Therefore, 16 experiments should be performed for each fabric, and four curve parameters could be featured from each pulling-out–displacement curve of the experiments for each fabric. In order to analyze the effects of the four system parameters on the test results of the fabric friction properties, correlations between the friction coefficient tested by the KES-F4 and curve parameters featured from the CHES-FY were carried out.
Results and discussion
Determination of the optimal system parameters
Orthogonal experiment array with correlation analysis
Orthogonal experiment array and correlation coefficients between the friction coefficient and curve parameters
Analysis of the significances of the factors and levels
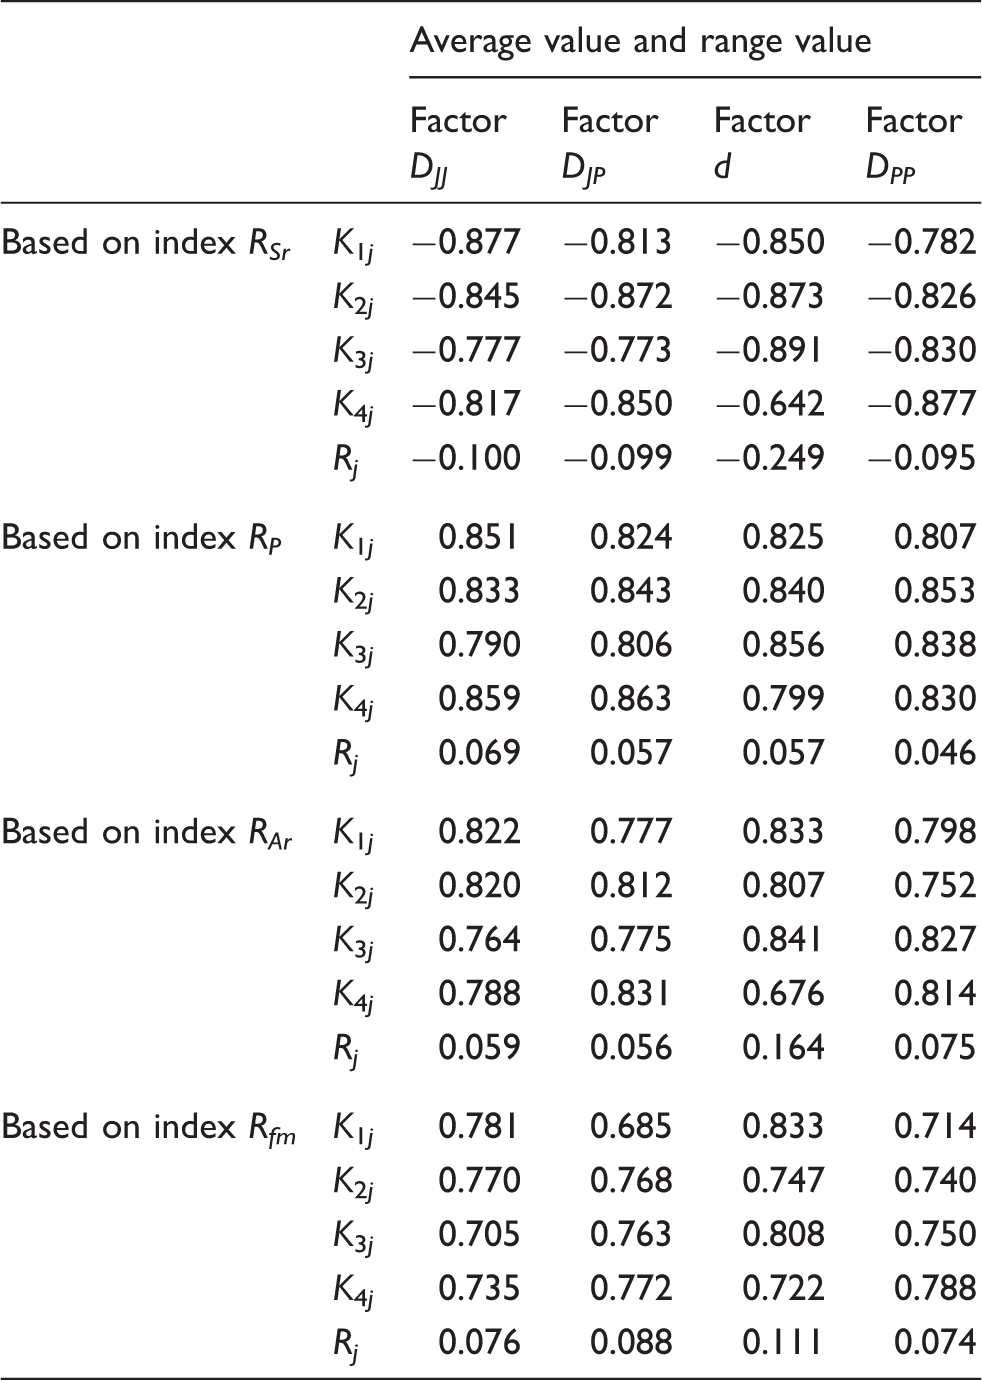
Average value and range value of orthogonal experiments
Numerical values of factors by significant sequence
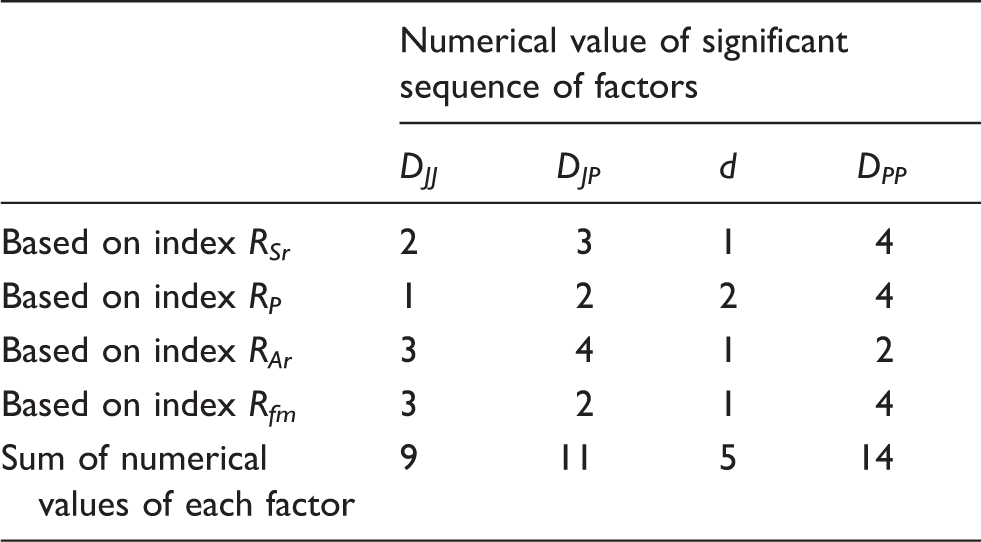
From Table 4, the effects of the diameter of bi-U-shaped pins (d) are the most significant, as indicated by the smallest sum of its numerical values. The following are DJJ and DJP, and the weakest significant factor is DPP with the largest sum of numerical value. Therefore, the integrated significances of the factors are in the order d > DJJ > DJP > DPP.
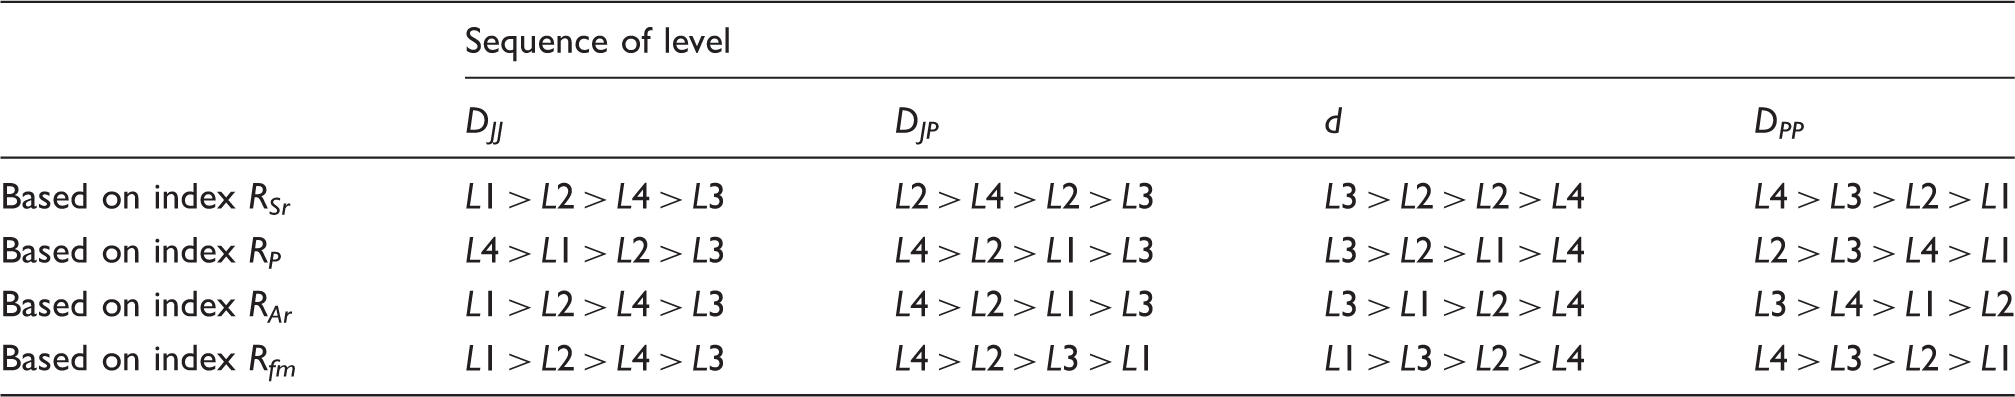
Significant sequences of four levels for each factor based on each index
Comparisons between experiments no.17 and no.18
Result comparisons between experiments no.17 and no.18

C.V.: coefficient of variation.
As observed, the correlation coefficients of the peak value (P) and horizontal force (fm) of experiment no.17 are larger than those of experiment no.18, while the correlation coefficients of the right-hand slope (Sr) and right-hand area (Ar) of experiment no.17 are slightly smaller than those of experiment no.18. Thus, regarding the correlation with friction coefficient, there is no significant difference between experiments no.17 and no.18. However, the C.V.s of the four curve parameters of experiment no.17 are all larger than those of experiment no.18. This can be explained because the larger C.V. means higher sensitivity of the experiment to discriminate fabrics with a close friction property. Hence, experiment no.17 with the higher absolute C.V. being 0.973, 1.201, 1.015 and 0.910 compared with those (0.816, 0.937, 0.921 and 0.895) of experiment no.18 can better evaluate the friction property and improve the sensitivity of the CHES-FY. Therefore, the optimal system parameters are from experiment no.17 and are concluded as follows: the diameter of bi-U-shaped pins is 6 mm; the horizontal distance between the jaws is 50 mm; the vertical distance between the jaw and bi-U-shaped pins is 60 mm; and the interval of the bi-U-shaped pins is 4 mm.
By relating the curve parameters of the CHES-FY with the optimal system parameters to the friction coefficient by the KES-F4, a multiple regression model for the prediction of the friction coefficient of fabrics was developed. The entry method was adopted to conduct the modeling based on an analysis of variance (ANOVA) at the 95% confidential level. The regression model is shown in Equation (1)

The regression model fits well, as indicated by the high determination coefficient (R2) and the p-value (<0.001).
Analysis of system repeatability and stability
To validate the repeatability and stability of the CHES-FY under the setting of the optimal system parameters and to test the effectivity of this system for evaluating the friction property of different kinds of fabrics, the fabrics of five types of materials (cotton, viscose, ultra-high molecular weight polyethylene (UHMWPE), aramid and polyester) were used to wrap the bi-U-shaped pins, as shown in Figure 3, and three repeat tests were carried out by using each type of the wrapped bi-U-shaped pins for each of the 28 fabric samples. Four curve parameters were featured from the pulling-out force–displacement curves, and Equation (1) was employed to integrate the four curve parameters of each test into a value in order to make the analysis more convenient. The C.V. of the predicted friction coefficient of every three repeat tests was calculated and is statistically given in Table 7. It should be pointed out that fabrics no.7, no.8 and no.18 cannot be tested by the bi-U-shaped pins wrapped by the cotton fabric as the corresponding pulling-out force–displacement curves of these fabrics are monotonically increasing, not showing the typical peak value. This may be due to the specific structure of the fabric surface with suede accents. Thus, it also implies that the bi-U-shaped pins wrapped by cotton may not be suitable for measuring fuzzy suede fabrics.
The bi-U-shaped pins wrapped by five types of materials: (a) cotton; (b) viscose; (c) ultra-high molecular weight polyethylene; (d) aramid; (e) polyester. The statistic results of the coefficient of variation (C.V.) of the predicted friction coefficients for 28 fabrics under five types of wrapped bi-U-shaped pins UHMWPE: ultra-high molecular weight polyethylene.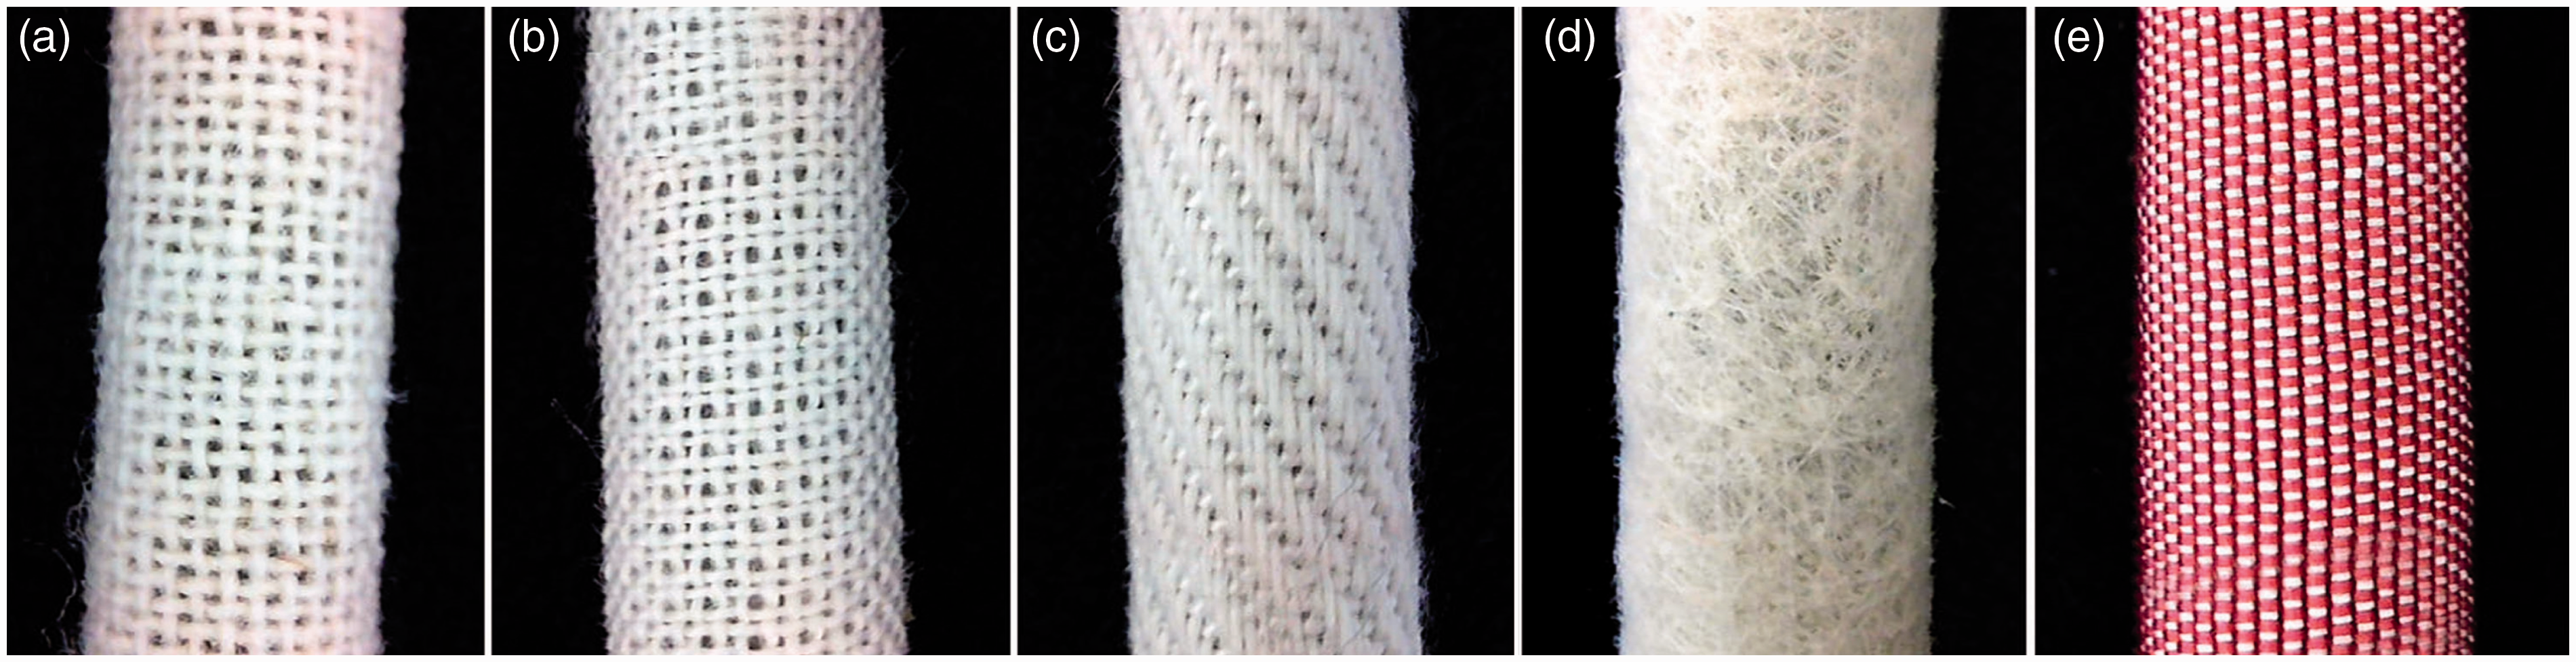
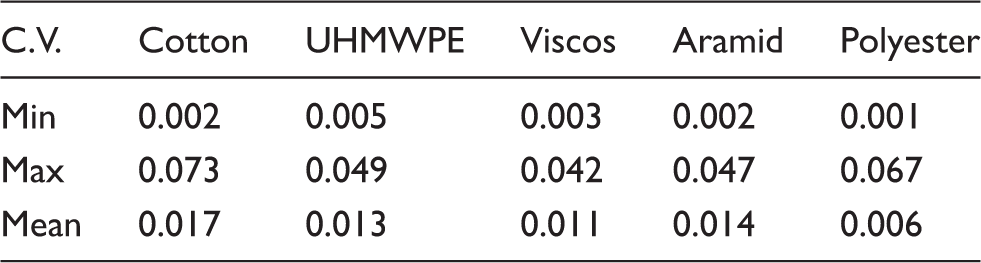
Except for these three experiments of fabrics no.7, no.8 and no.18, the predicted friction coefficients of the three repeat tests of each fabric are very close for every type of wrapped bi-U-shaped pins, as indicated by the maximum value of C.V. below 0.1. Therefore, the repeatability of the tests is good. It also indicates that the CHES-FY with the selected optimal system parameters can obtain stable pulling-out force–displacement curves, and curve parameters and the corresponding friction coefficient calculated from the curve parameters are very stable.
Correlation coefficients between the four curve parameters and friction coefficients tested by the Kawabata evaluation system for fabric surface tester
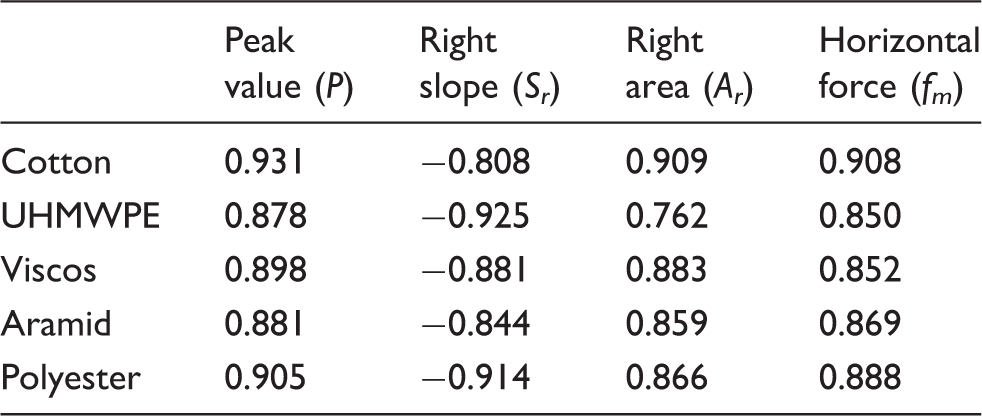
Correlation is significant at the 0.01 level (two-tailed).
UHMWPE: ultra-high molecular weight polyethylene.
Evaluating smoothness/roughness handle by the CHES-FY
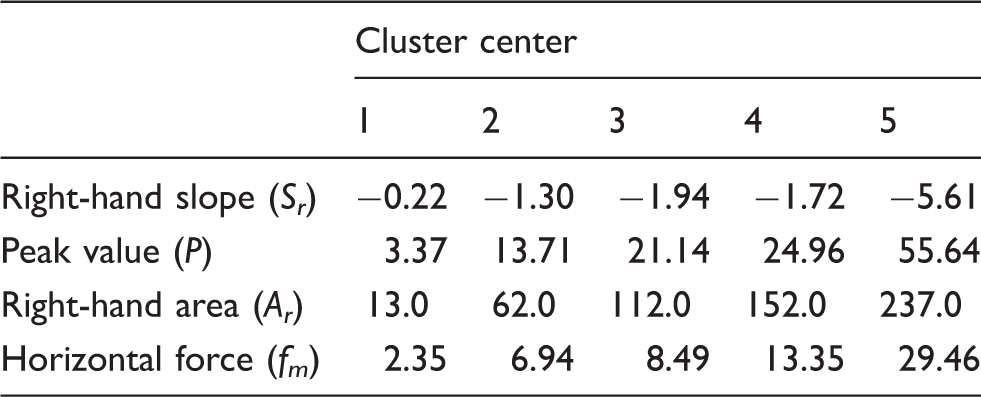
k-means cluster analysis of smoothness/roughness handle
Initial clustering center
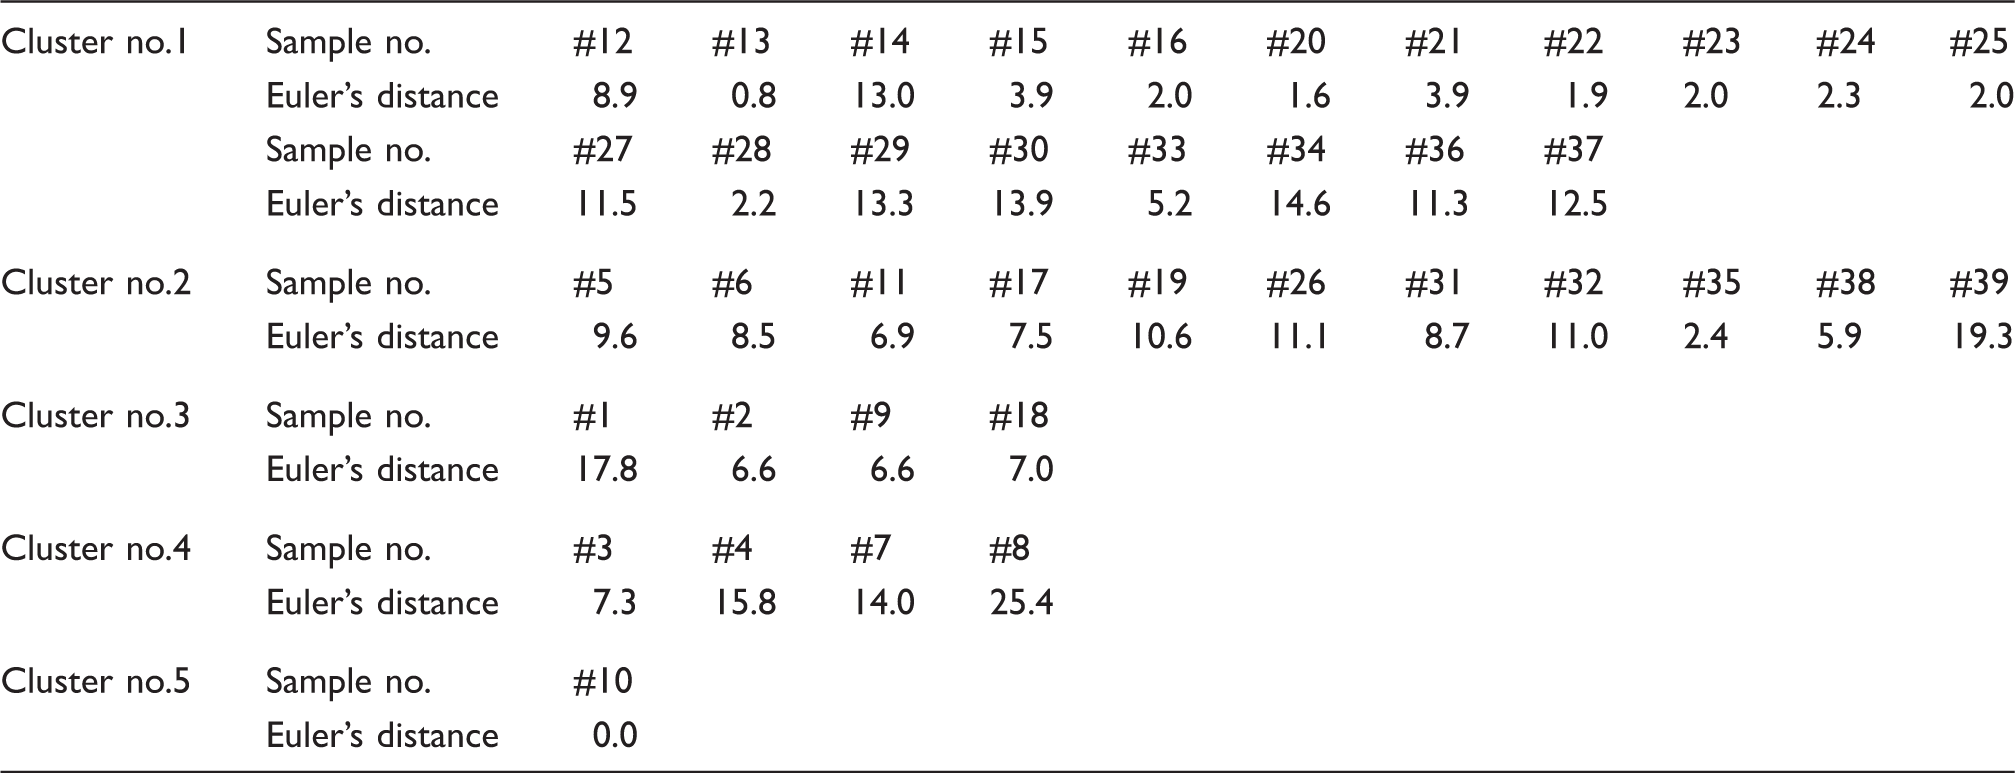
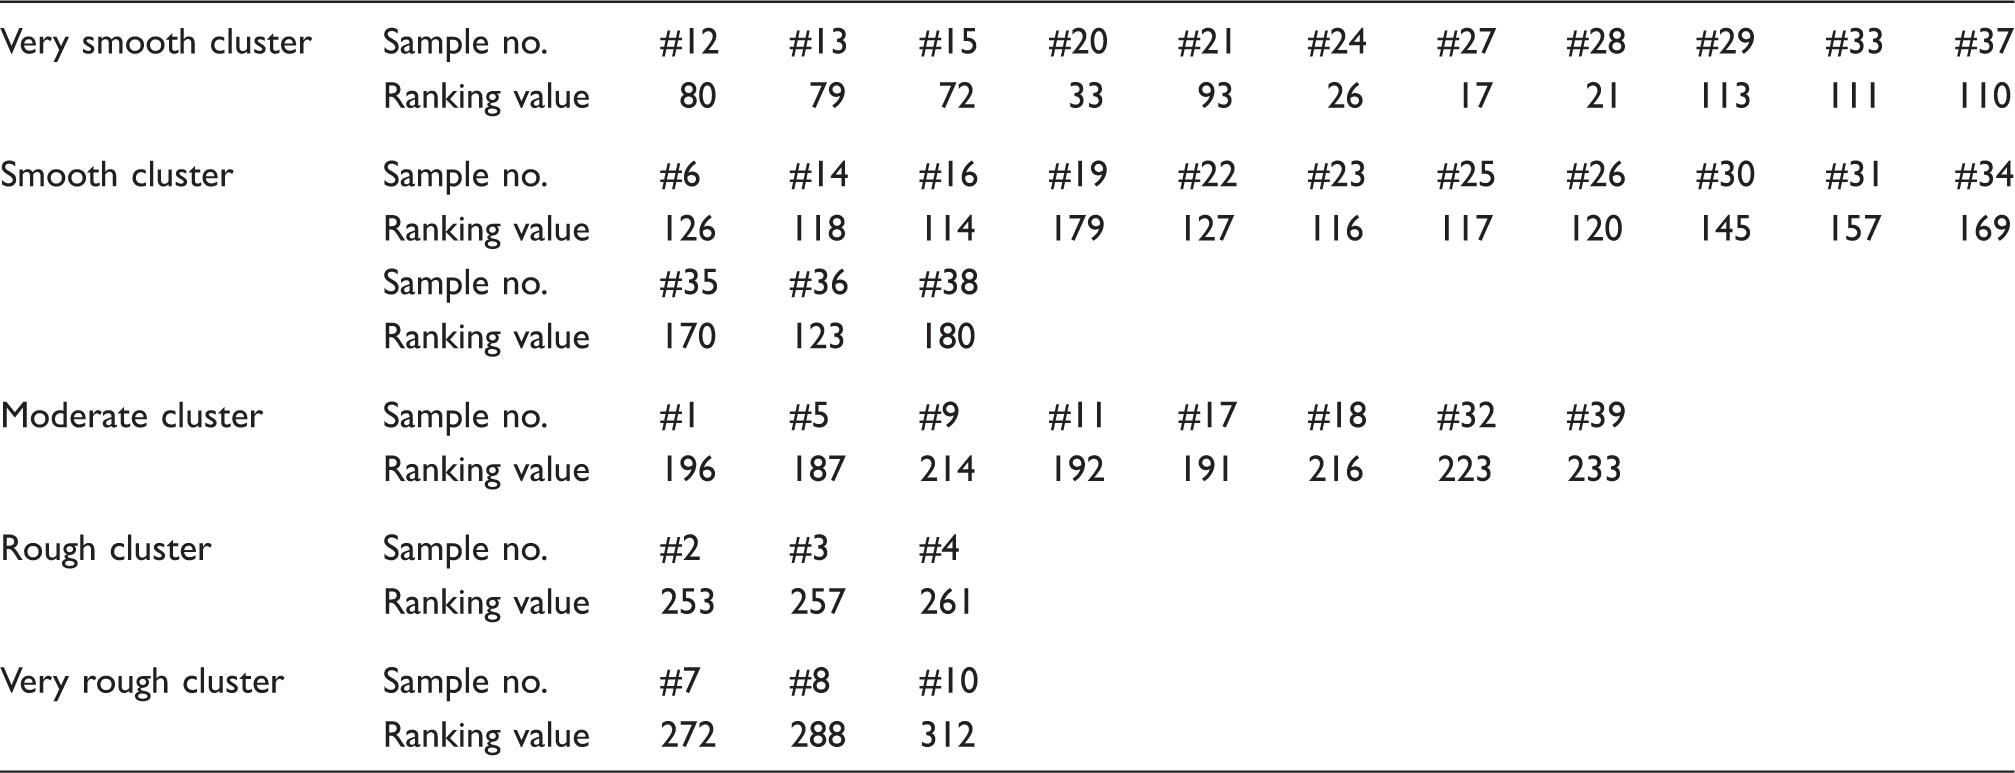
Objective clustering results of 39 fabrics
Comparisons with subjective assessments
Subjective cluster results of 39 fabrics
The effectiveness coefficient of ranking value (W) and F hypothesis test were also utilized to evaluate the effectiveness of ranking values, which can be expressed as


By comparing Table 11 with Table 10, it can be seen that results of objective clusters by the k-means cluster method are similar to those of subjective assessments. Although there exist variations for some samples between adjacent clusters, such that samples #14, #16, #22, # 23, #25, #30, #34 and #36 are assigned to the very soft cluster by the k-means cluster method based on measurements of the CHES-FY, but are assigned to the soft cluster by judges in subjective assessments. However, it can be found that the ranking values of these samples are very close to the samples in the very soft cluster, and there are no large gaps between the clustering results of the objective and subjective evaluations. Therefore, the CHES-FY with the selected system parameters can be used to effectively characterize the smoothness/roughness handle of fabrics based on the four curve parameters.
Conclusions
Experimental investigations of measuring friction properties of fabrics using the CHES-FY were reported. Orthogonal experiment design was employed to analyze the optimal system parameters of the CHES-FY based on the selected four curve parameters and their correlations with friction coefficients tested by the KES-F4. Results showed that the four system parameters were listed in the order of significance for the friction testing as diameter of bi-U-shaped pins (d), horizontal distance between the jaws (DJJ), vertical distance between the jaws and bi-U-shaped pins (DJP) and interval of the bi-U-shaped pins (DPP); also, the optimal system parameters were determined based on the orthogonal experiment and comparison analysis as follows: the diameter of bi-U-shaped pins is 6 mm; the horizontal distance between the jaws is 50 mm; the vertical distance between the jaw and bi-U-shaped pins is 60 mm; and the interval of the bi-U-shaped pins is 4 mm. Using the optimal system parameters, a regression model was also developed to predict a fabric’s friction coefficient. Moreover, five types of fabrics were used to wrap the bi-U-shaped pins, and three repeatable tests for each kind of wrapped bi-U-shaped pins were conducted. Low C.V.s of the repeatable tests showed good repeatability and stability of the CHES-FY for measuring friction coefficients of fabrics that comprised different materials. In addition, comparisons between objective clusters and subjective clusters of fabric smoothness/roughness handle were carried out. Results showed that the CHES-FY with k-means cluster method provided a feasible method for characterizing the smoothness/roughness handle of fabrics. It can be deduced that the four curve parameters featured from a pulling-out–displacement curve contain the main information of a fabric’s friction property, and the CHES-FY with the selected optimal system parameters can be used to characterize the friction coefficient and smoothness/roughness handle of fabrics effectively and stably.
Footnotes
Declaration of conflicting interests
The authors declared no potential conflicts of interest with respect to the research, authorship and/or publication of this article.
Funding
The authors disclosed receipt of the following financial support for the research, authorship, and/or publication of this article: This work was supported by National Natural Science Foundation of China projects (grant numbers 11272086 and 51203022), the Fundamental Research Funds for the Central Universities (2232014A3-02, CUSF-DH-D-2016006 and CUSF-DH-D-2016020), the “DHU Distinguished Young Professor Program (B201307)” and the Fok Ying Tung (huoyingdong) Education Foundation (151071). The authors are grateful to the China scholarship council (CSC) for the scholarship (number 201506630046) provided to one of the authors (Sun), and supported by the National Key Research and Development Program of China (Grant No.2016YFC0802802).